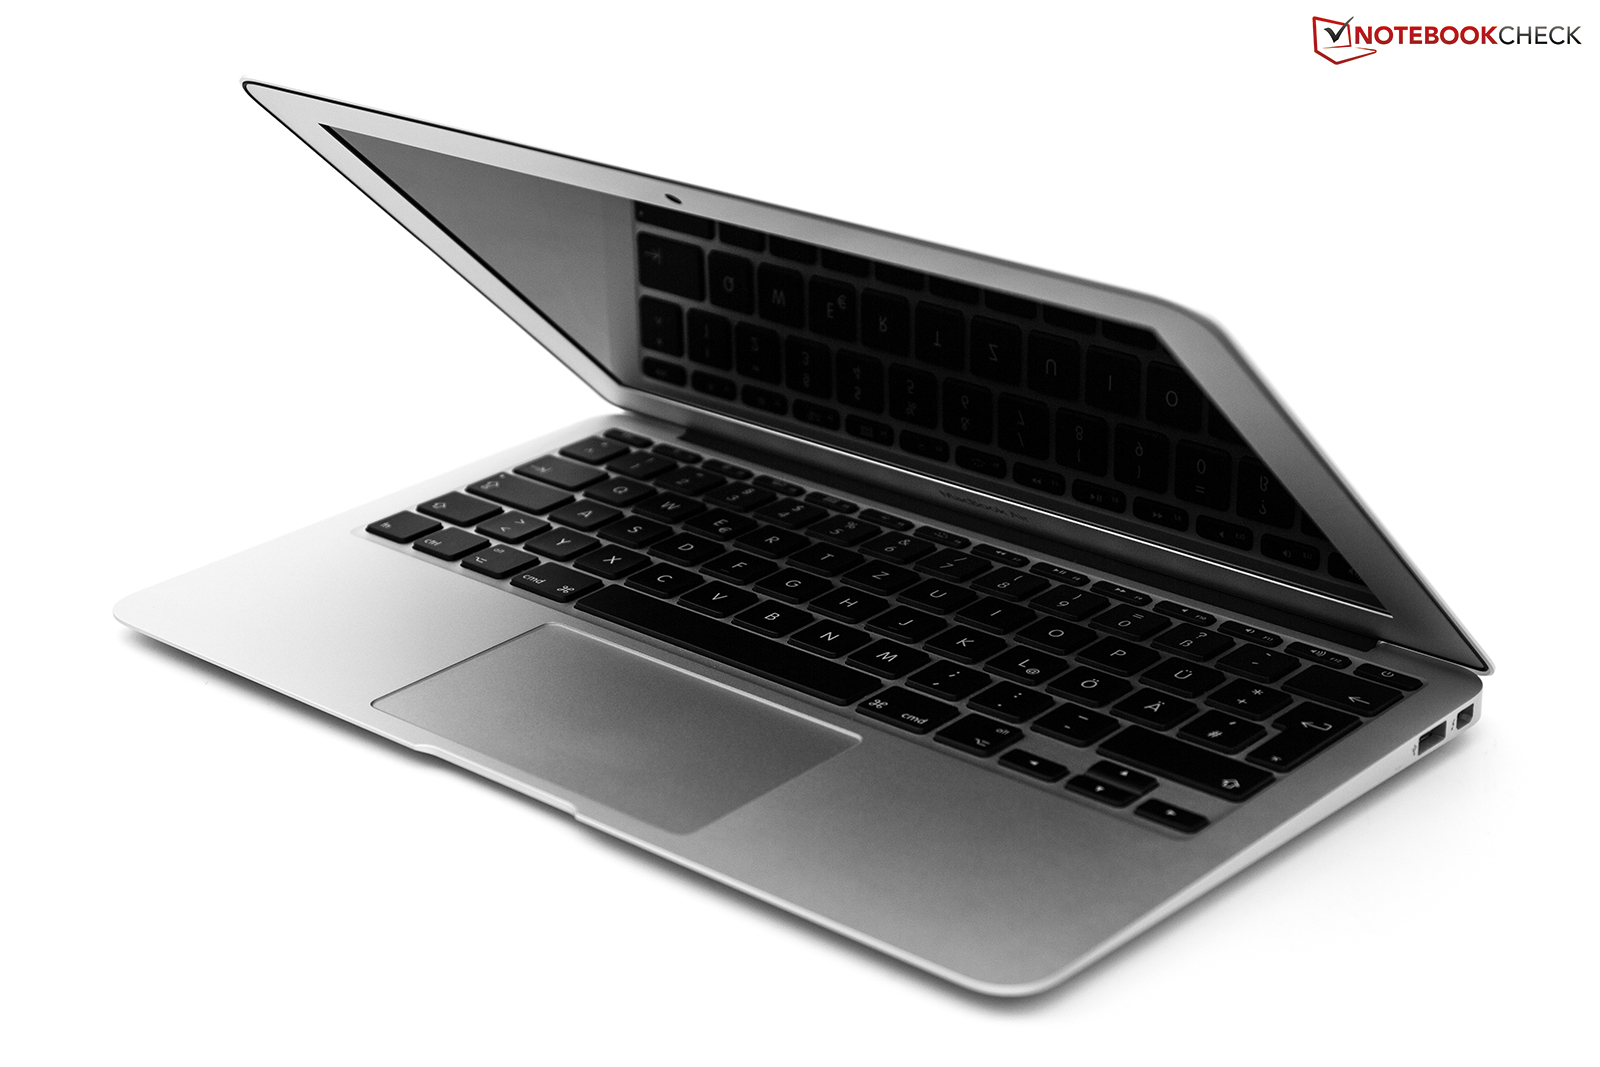
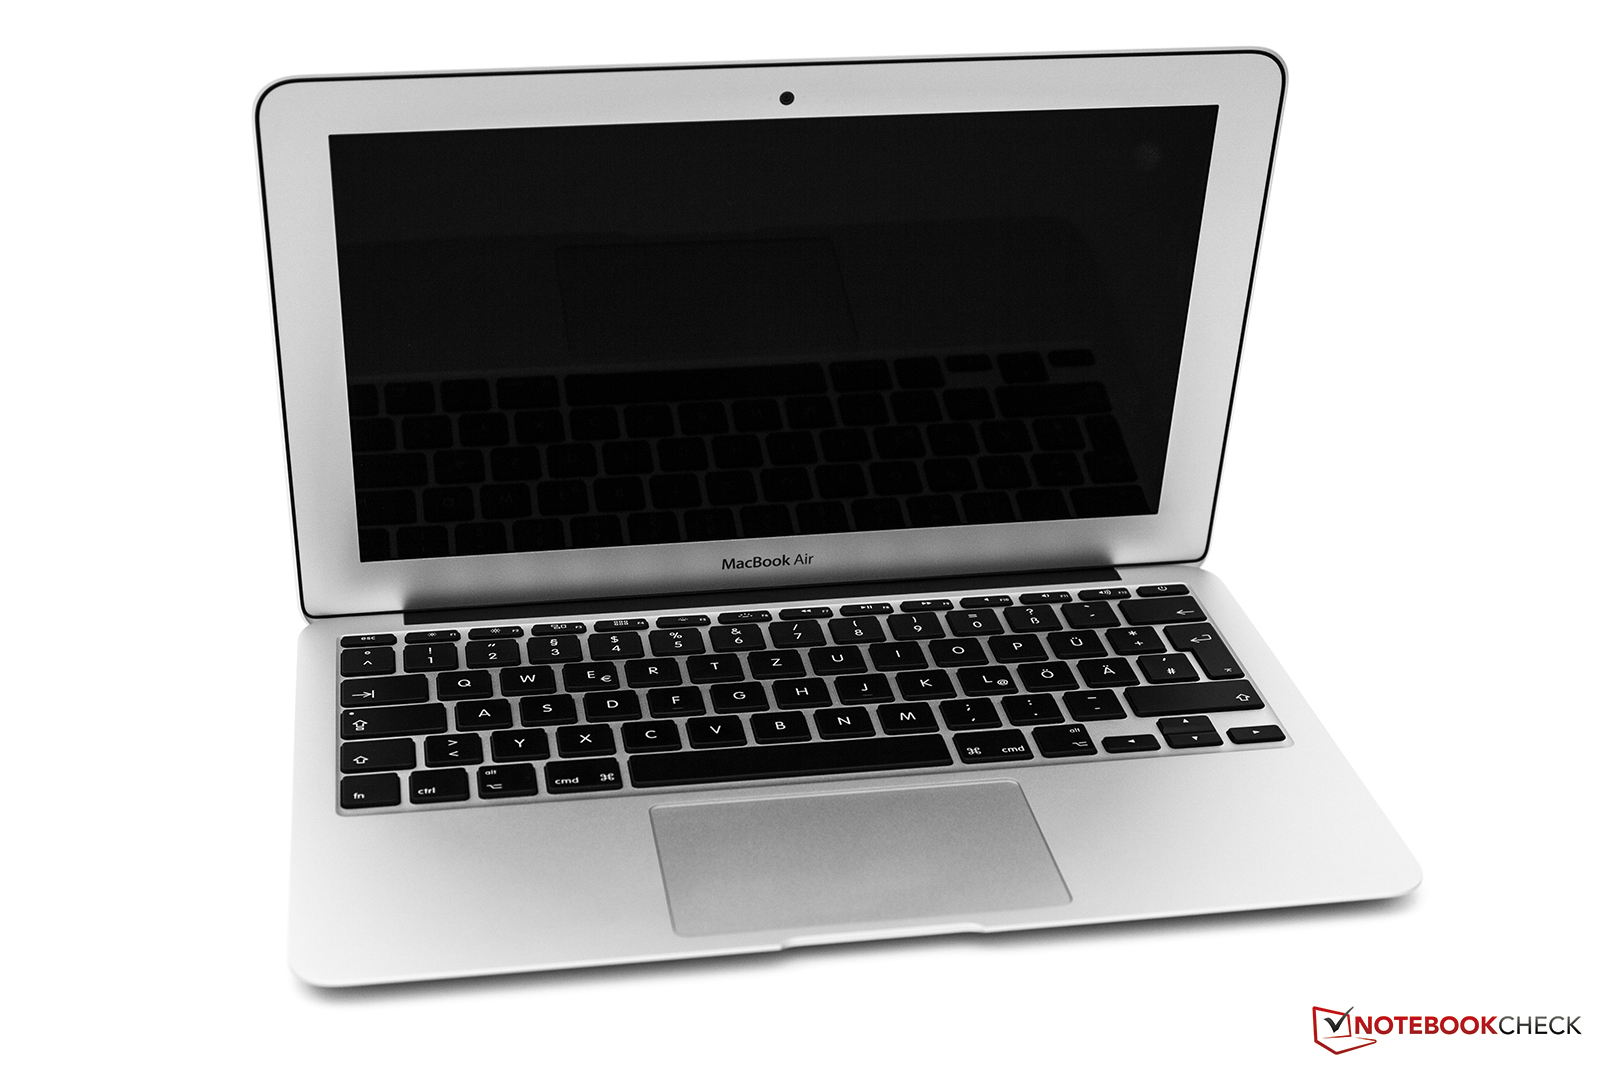
Review Apple MacBook Air 11 inch Mid 2013 1.7 GHz 256 GB Subnotebook

For the original German review, see here.
We already thoroughly reviewed the entry-level versions of the latest MacBook Air 11 06-2013 as well as the bigger MacBook Air 13-inch Mid 2013. This is a review update of the MacBook Air 11, now equipped with an Intel Core i7-4650U CPU, a 256 GB SSD and 8 GB memory. This configuration for ambitious users is around 1,450 Euros (~$1906), an additional charge of 450 Euros (~$591) compared to the entry-level configuration. Is it worth it?
We take a closer look at the differences between the two configurations in regard to the performance, emissions and battery runtime and try to give you some assistance with your final purchase decision.
Apple MacBook Air 11 and 13 Configurations (Mid 2013):
| 11" MacBook Air Mid 2013 | 13" MacBook Air Mid 2013 | |||
|---|---|---|---|---|
| Display | 11,6" LED 1366x768, glossy | 13,3" LED 1440x900, glossy | ||
| Storage | 128 GB | 256 GB (512 GB + 300 Euros) | 128 GB | 256 GB (512 GB + 300 Euros) |
| Processor | Intel Core i5-4250U 1.3 GHz Dual-Core | Intel Core i7-4650U 1.7 GHz Dual-Core | Intel Core i5-4250U 1.3 GHz Dual-Core | Intel Core i7-4650U 1.7 GHz Dual-Core |
| Graphics | Intel HD Graphics 5000 | Intel HD Graphics 5000 | ||
| Memory | 4 GB 1600 MHz LPDDR3 (8 GB + 100 Euros) | 4 GB 1600 MHz LPDDR3 (8 GB + 100 Euros) | ||
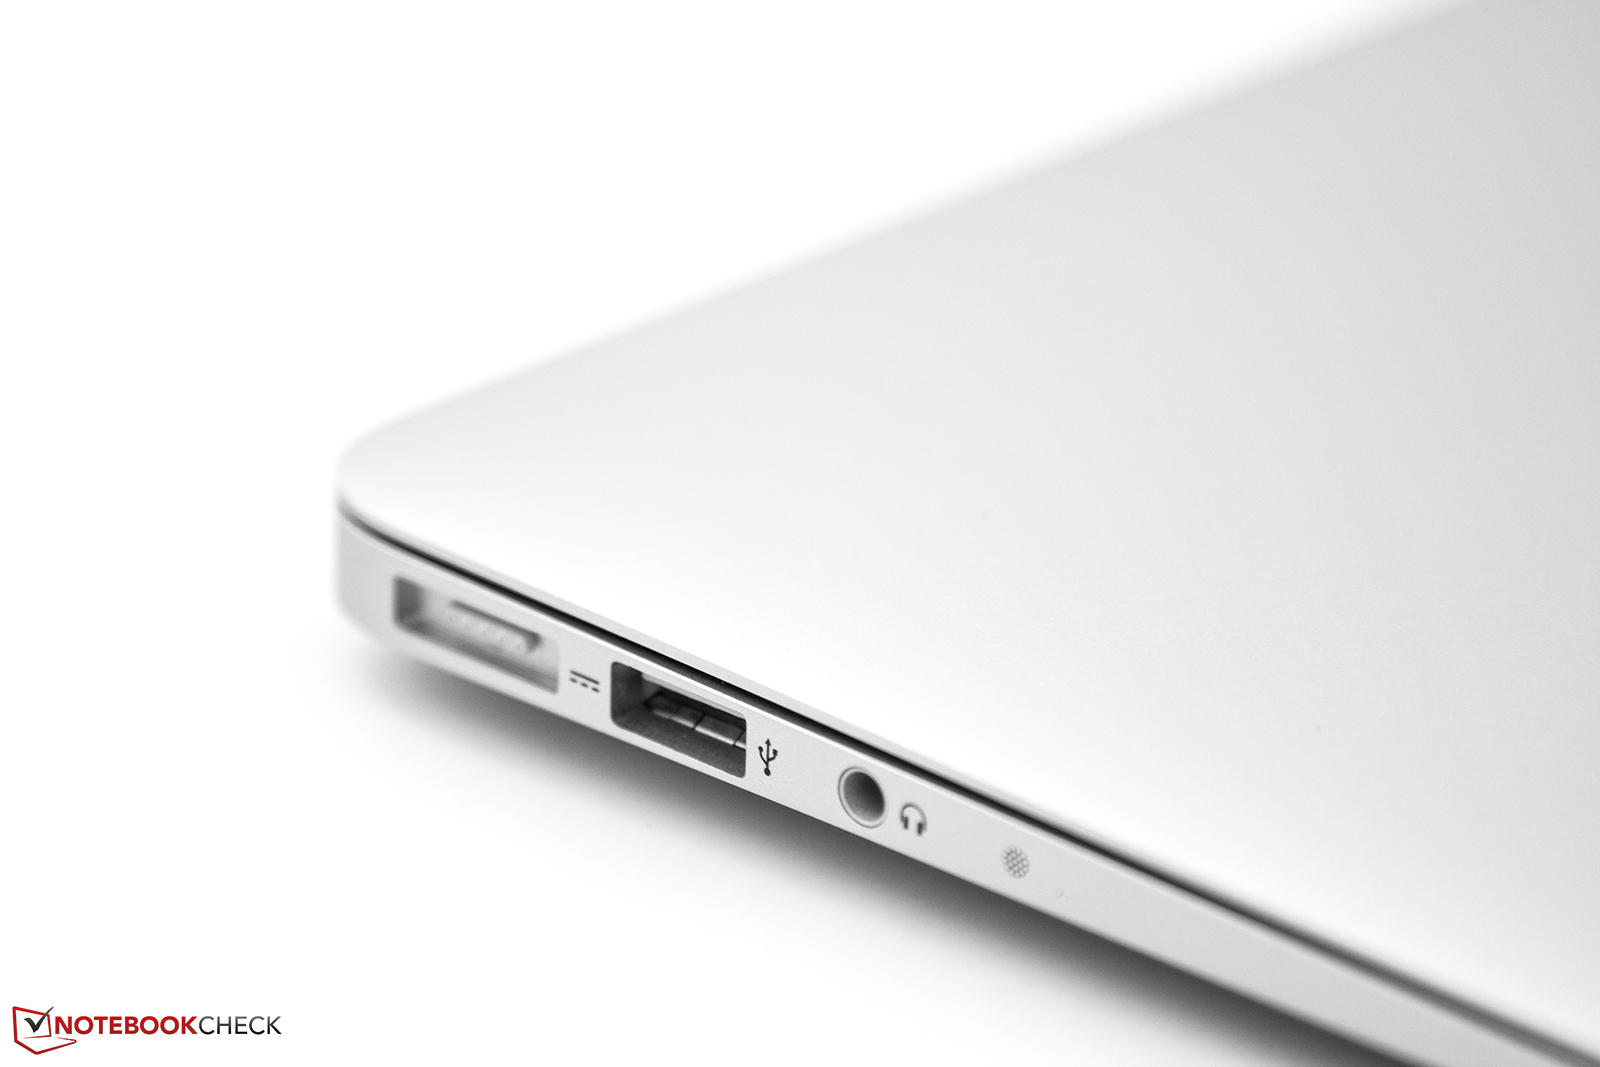
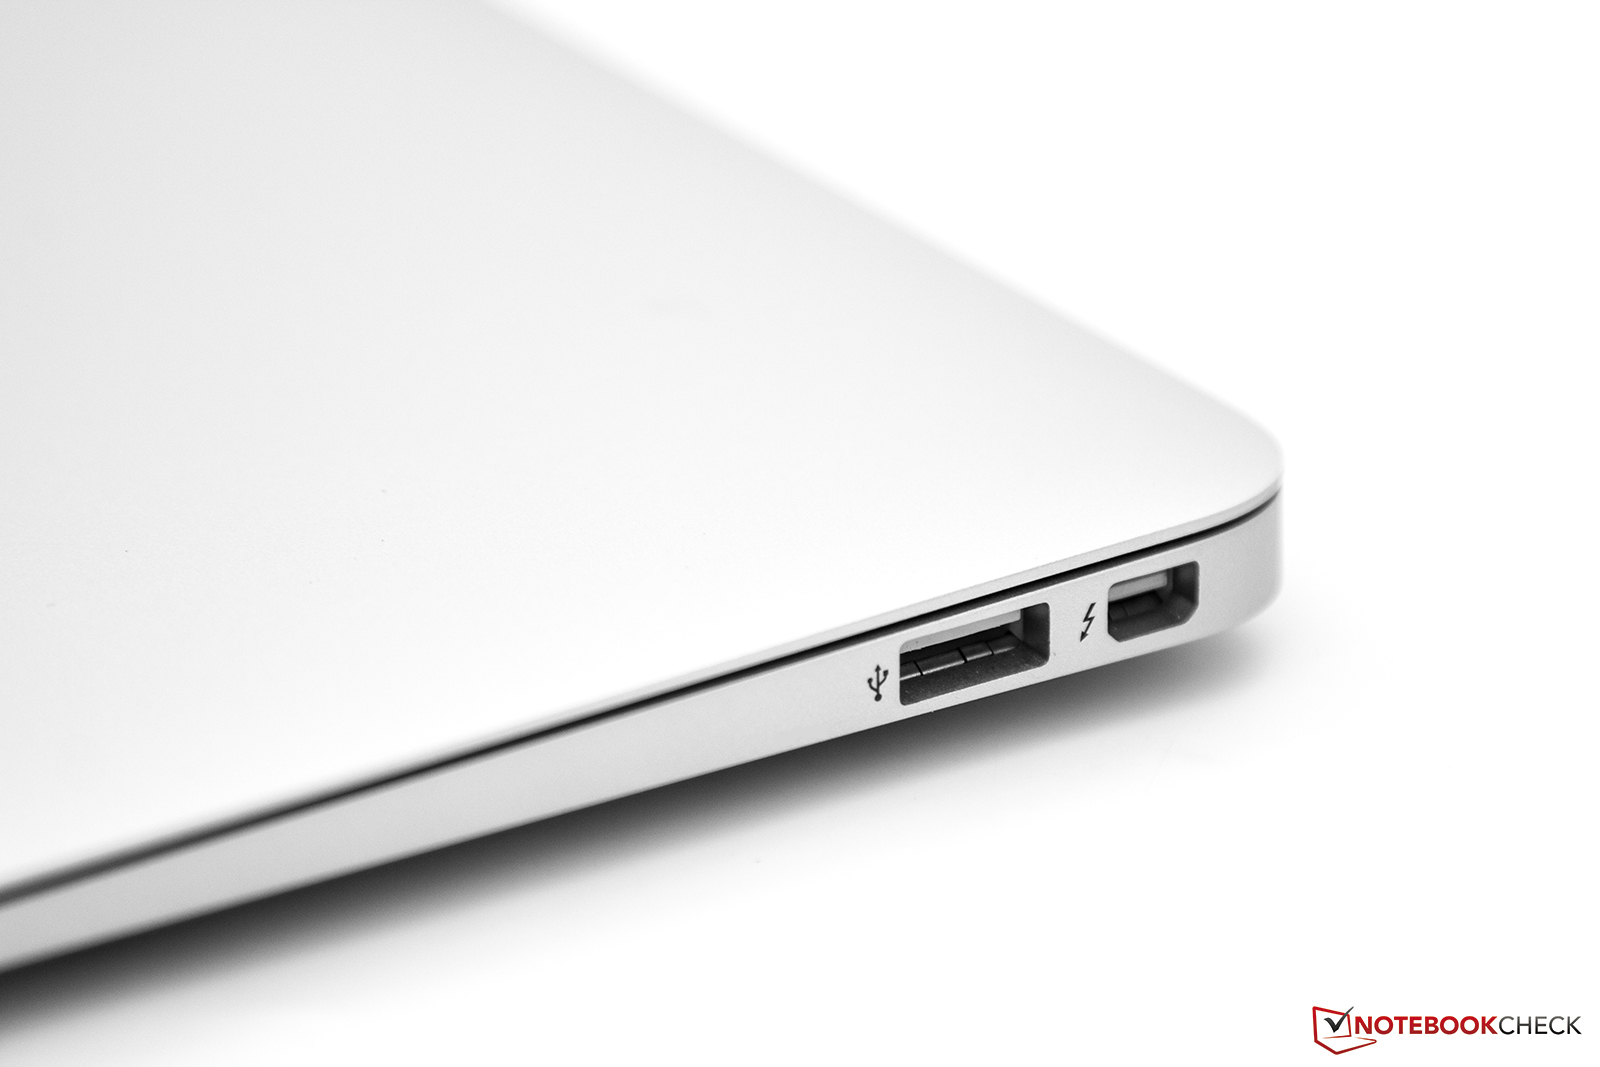
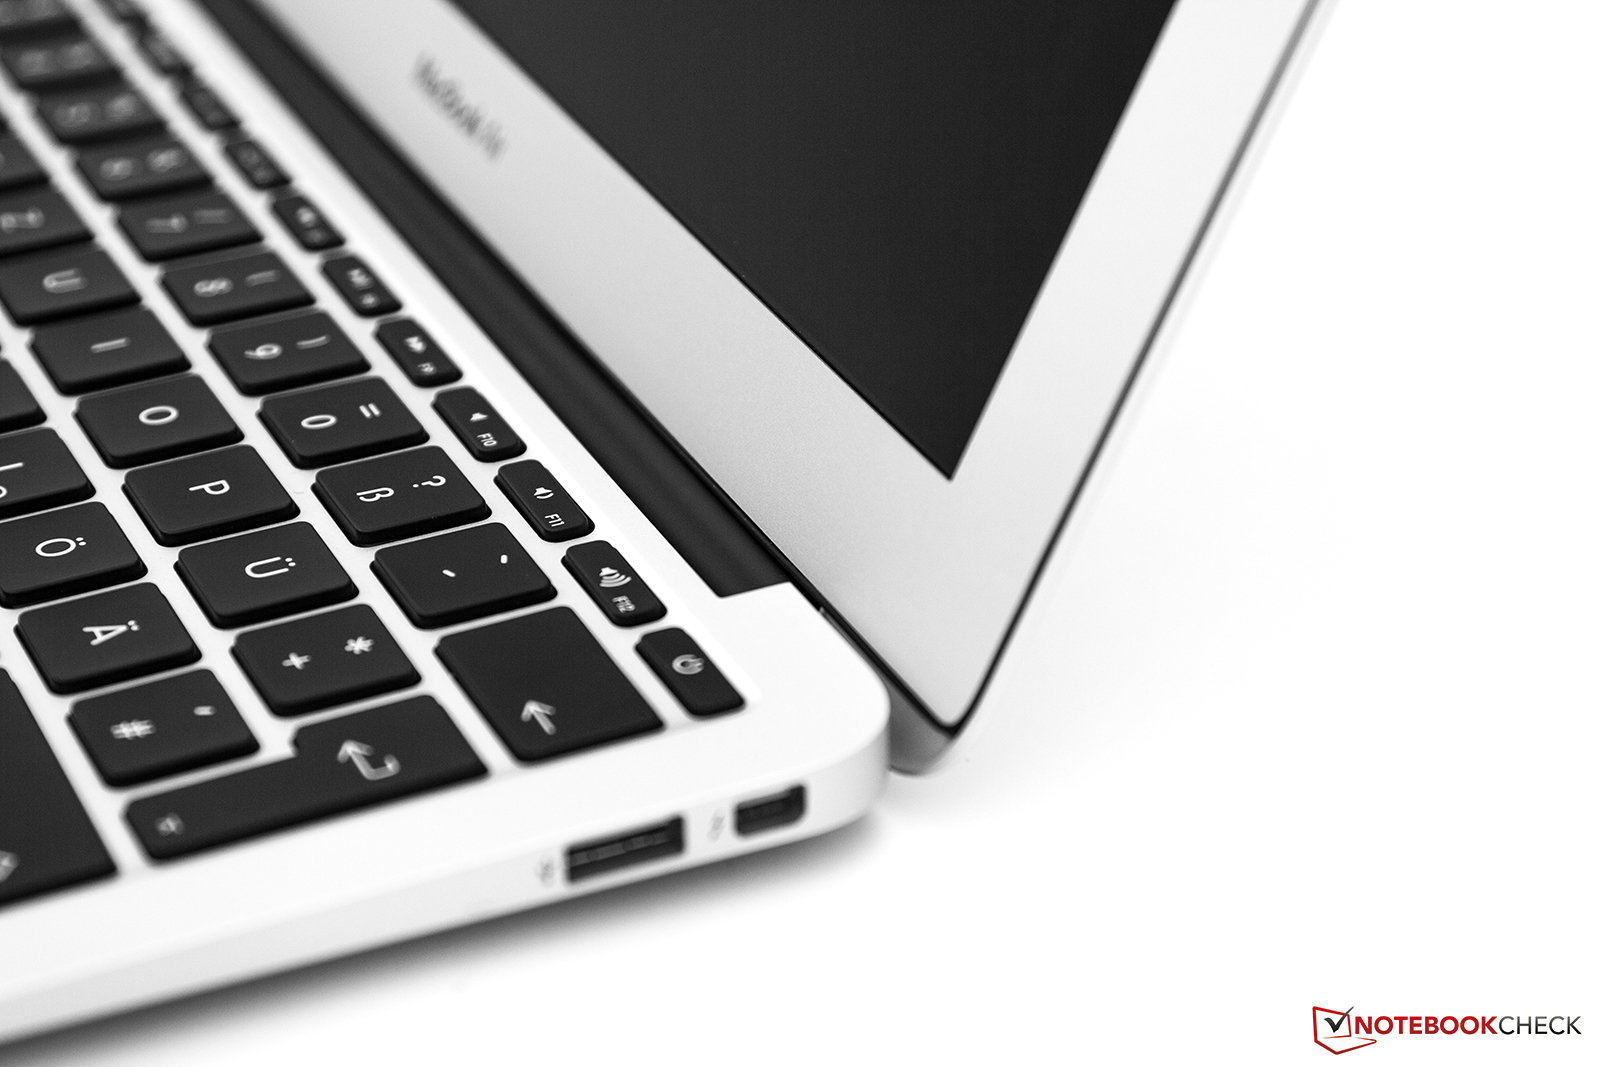
| Ports | Thunderbolt, 2x USB 3.0, headphones; up to 2560x1600 pixels on external display | Thunderbolt, 2x USB 3.0, headphones, SDXC slot; up to 2560x1600 pixels on external display | ||
| Communication | WLAN 802.11ac, Bluetooth 4.0, 720p webcam | WLAN 802.11ac, Bluetooth 4.0, 720p webcam | ||
| Dimensions | 300 x 192 x 17 mm (lxwxh) | 325 x 227 x 17 mm (lxwxh) | ||
| Weight | 1.08 kg | 1.35 kg | ||
| Price | here starting at 989 Euros | 1179 Euros | here starting at 1049 Euros | 1399 Euros |
Performance

Processor: Intel Core i7-4650U Dual Core
"Intel Core i5-4250U or i7-4650U? That is the question potential buyers of the MacBook Air 2013 will need to consider. Again we're talking about a surcharge of about 150 Euros (~$197) that must be carefully contemplated" - this has already been the question in our entry-level configuration review. An answer is now possible with our review unit.
Once again the main differences of the two CPU's: The i5-4250U has a base clock of 1.3 GHz (turbo up to 2.6 GHz) while the Core i7-4650U increases this by around 30% with a base clock of 1.7 GHz (turbo up to 3.3 GHz). This could result in a 30% performance advantage for the more expensive CPU. The i7 also has a bigger cache (4 MB vs. 3 MB) and a higher turbo clock for the integrated graphics (1.1 GHz vs. 1.0 GHz).
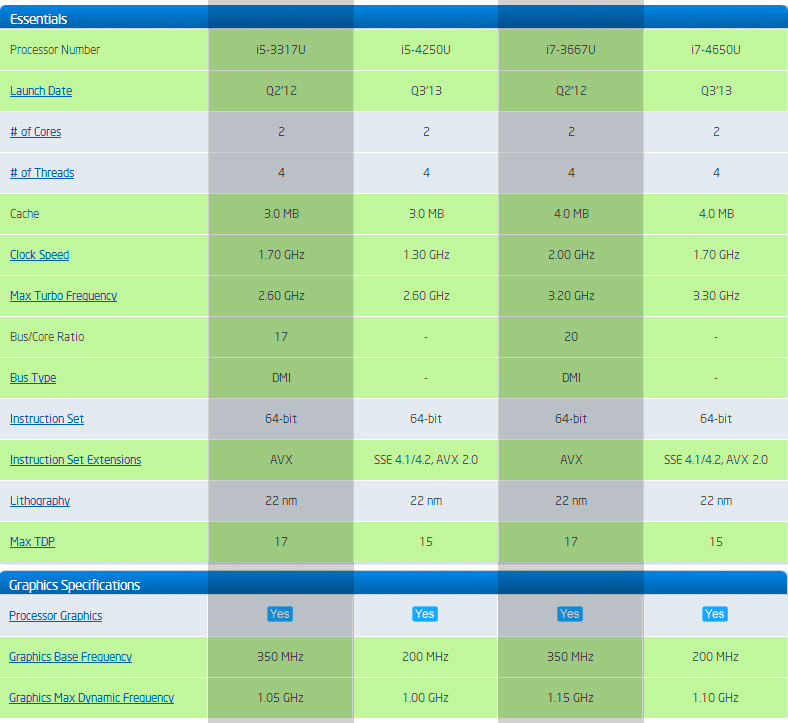
Let us start our performance analysis with the CPU benchmarks. The i7-4650U CPU is between 29% and 52% ahead of the i5-4250U CPU in the single thread benchmarks. The advantage is not as big in the multithread tests but it is still significant: An advantage of 15 up to 35% for the 150 Euros (~$197) more expensive Intel i7 Haswell CPU.
Compared to the i7-3667U-CPU, which has been used for the more expensive configurations of the predecessor, although in this case inside a Lenovo Thinkpad X1 Carbon, the performance of the new Haswell CPU is on a similar level. Depending on the benchmark, the new Haswell processor is slightly ahead or falls slightly behind the Ivy Bridge predecessor.
| Cinebench R10 | |
| Rendering Single CPUs 64Bit (sort by value) | |
| Apple MacBook Air 11 inch 2013-06 1.7 GHz 256 GB | |
| Apple MacBook Air 11 inch 2013-06 MD711D/A | |
| Lenovo ThinkPad X1 Carbon | |
| Rendering Multiple CPUs 64Bit (sort by value) | |
| Apple MacBook Air 11 inch 2013-06 1.7 GHz 256 GB | |
| Apple MacBook Air 11 inch 2013-06 MD711D/A | |
| Lenovo ThinkPad X1 Carbon | |
| wPrime 2.10 - 1024m (sort by value) | |
| Apple MacBook Air 11 inch 2013-06 1.7 GHz 256 GB | |
| Apple MacBook Air 11 inch 2013-06 MD711D/A | |
| Lenovo ThinkPad X1 Carbon | |
| Super Pi Mod 1.5 XS 32M - 32M (sort by value) | |
| Apple MacBook Air 11 inch 2013-06 1.7 GHz 256 GB | |
| Apple MacBook Air 11 inch 2013-06 MD711D/A | |
| Lenovo ThinkPad X1 Carbon | |
* ... smaller is better
Turbo-Mode
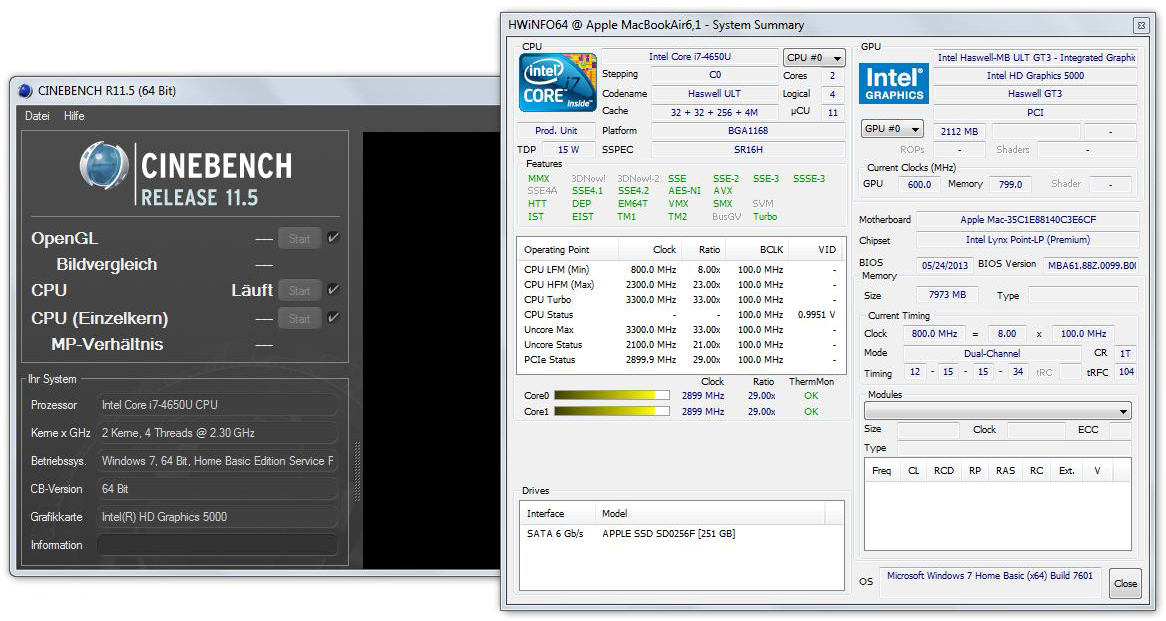
Even the i5 CPU had some problems with the turbo clocks; the maximum clock of the CPU was rarely used. The i7-4650U processor shows a similar behavior: The maximum clock was 2.9 GHz for the single thread benchmark of Cinebench R11.5 and Windows operating system (via Bootcamp). As mentioned before the maximum turbo clock of the Intel Core i7-4650U CPU is 3.3 GHz, which is also advertised by Apple. During our benchmarks the clock fluctuated between 2.7 and 2.9 GHz; the promised 3.3 GHz were only utilized in the SuperPi benchmark. At least at the start we determined 3.3 GHz for fractions of a second before it leveled off at 2.9 GHz after a few seconds.
The MacBook Air reaches 2.7 up to 2.9 GHz at the beginning of the multithread benchmark, but once again the clock fluctuates between 2.3 and 2.9 GHz after a couple of seconds. The chip reduces its clock to 800 MHz during idle.
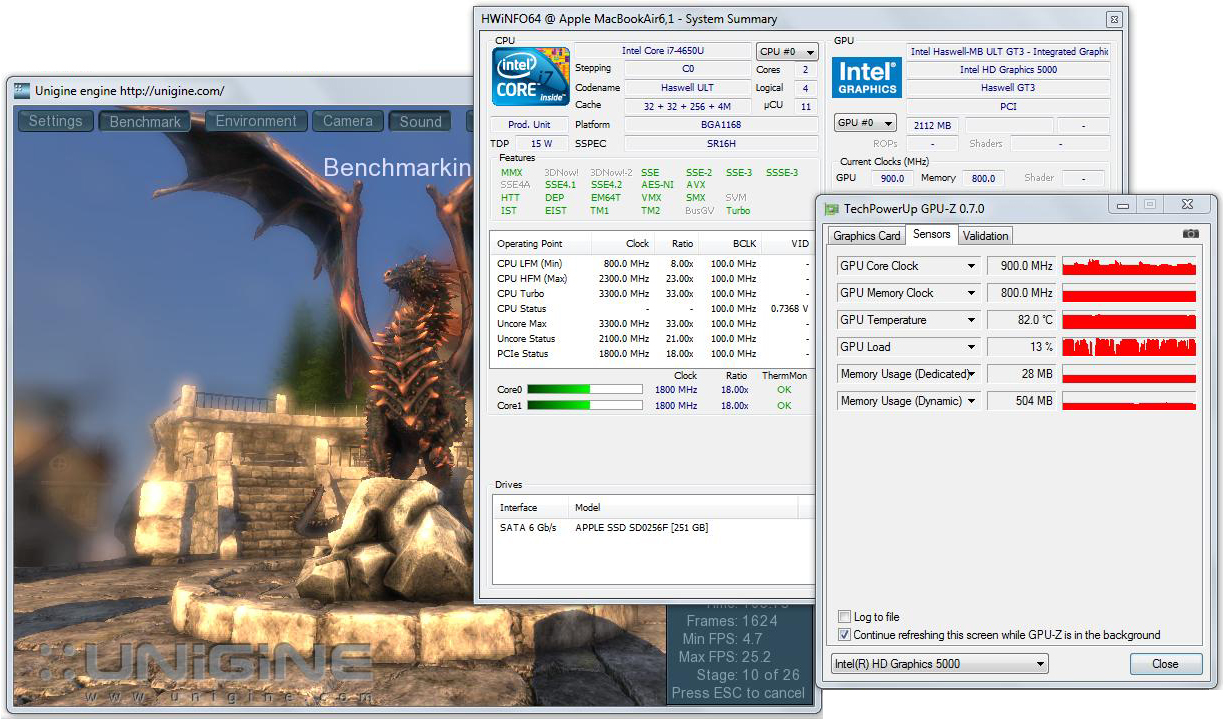
The turbo clock of the integrated HD 5000 graphics is raised up to 850 MHz in the Cinebench R11.5 OpenGL-Shading test but the chip reaches a core temperature of 99 °C (210.2 °F) (HWInfo) after a few seconds. The consequence is a lower clock between 650 and 750 MHz. We were able to squeeze up to 950 MHz out of the GPU in the Unigine-Heaven benchmark, but the clock was often reduced because the temperatures were very high between 95 °C (203 °F) and 99 °C (210.2 °F). Typical clocks in the benchmarks were between 750 and 900 MHz.
Compared to the similar MacBook Air Mid 2013 with the i5-4250U CPU the clocks are consequently higher but the chip reaches critical temperatures quicker, which leads to a reduced turbo clock. However, we cannot determine a worse thermal behavior of the i7 CPU because of this.
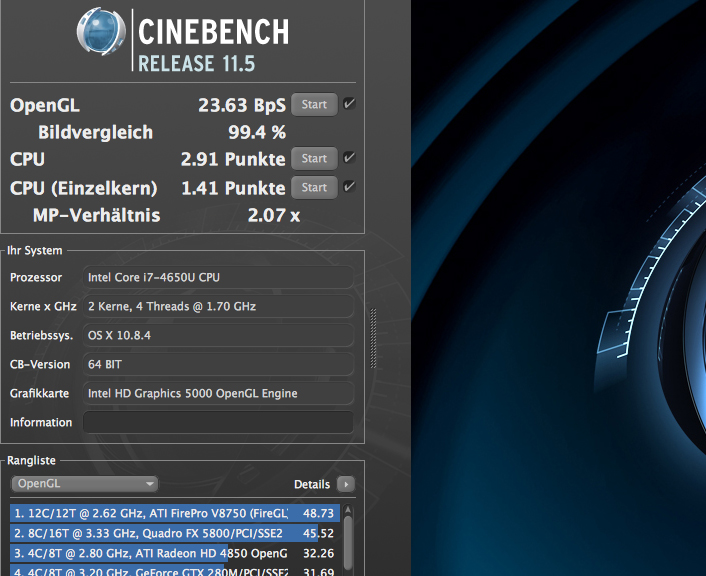
Interesting: While the Cinebench R11.5 OpenGL benchmark shows no significant advantages for the i7 CPU (19.63 vs. 20.58) under Windows, we determined a 15% lead with Mac OS. This could indicate a better thermal management of Mac OS that enables higher GPU turbo clocks for a longer period.
Stress Test / Throttling
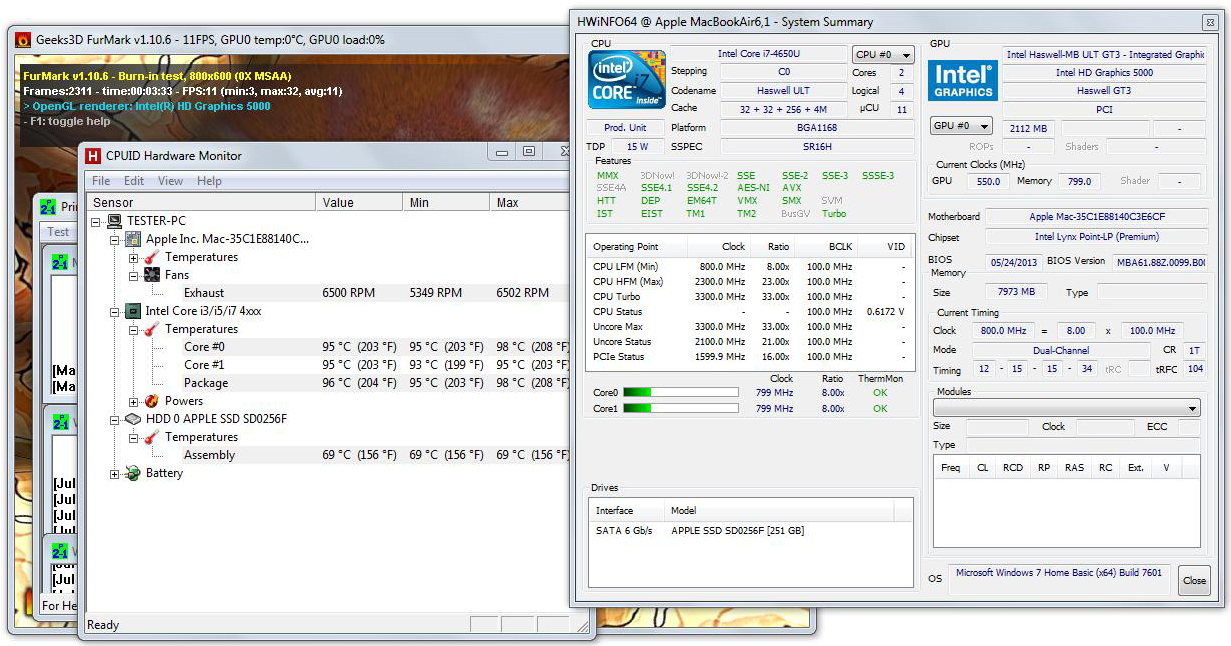
As usual, we also tortured the MacBook Air 11 with our stress test, a combined CPU and GPU load for more than one hour. Unfortunately, our review unit gave up fairly quickly. Just after the start of FurMark the CPU clock was reduced to 800 MHz. We also ran Prime95 and observed that the core temperature reaches the critical area above 95 °C (203 °F) within seconds. Consequently, the GPU clock is also reduced to 450 MHz, sometimes it is even reduced to 200 MHz. This drop below the nominal clock is definitely a case of throttling, at least in this extreme scenario. Typical for Apple is the slow rise to the maximum fan speed of 6500 rpm, the result is a core temperature (HWInfo) of 80 to 90 °C (176 to 194 °F).
The situation does not really change if we only use FurMark to stress the GPU. The clock levels off at 450 MHz while the CPU runs with 800 MHz with core temperatures of around 80 °C (176 °F). Full CPU load is handled much better, a continuous load by Prime95 results in steady 2.3 GHz, the nominal clock of the CPU. The temperature is around 90 °C (194 °F) in this case.
All in all this behavior is very similar to the reviewed i5 configuration of the MacBook Air 11, the main difference is the higher nominal clock of the i7 CPU. A run of 3DMark 2006 immediately after the stress test was identical to a cold start, a thermally caused throttling is therefore rather unlikely in more realistic scenarios.
The clocks and core temperatures during the Unigine-Heaven benchmark are also very similar to the i5 version. The CPU works with 2 GHz after the start but this is quickly lowered to 800 MHz and rarely reaches values between 1000 and 2000 MHz over the period of the benchmark. The GPU starts with 900 up to 950 MHz, which is just slightly lowered to values between 800 and 900 MHz. The temperature of the i7-4650 CPU levels off at around 95 °C (203 °F) in this case.
System Performance
The comparison of the PCMark 7 benchmark results shows small differences of the overall score between the i5 and i7 CPU; the configuration with the i7-4650U CPU has an advantage of 8%.
We also compare the two configurations with a more realistic workload. We use iMovie to render 5 minutes of 720p material (3 clips, standard transitions, with credits). The i7 CPU needs 7 minutes while the i5 CPU needs 2 minutes more, a performance advantage of around 30%. The following video shows a side-by-side comparison of the i5 and i7 configuration with several tests.
| PCMark Vantage Result | 13502 points | |
| PCMark 7 Score | 4723 points | |
Help | ||
Performance under Mac OS X 10.8.4
The available benchmarks for Mac OS X also show a significant performance advantage for the i7-4650 CPU. Cinebench R11.5 shows a 19% higher result for the Intel i7 CPU in the CPU-Test (Multi-core) compared to the i5, the difference is even bigger in the single thread test with 28%. The OpenGL performance is also 15% higher than the i5 CPU with 23.63 fps.
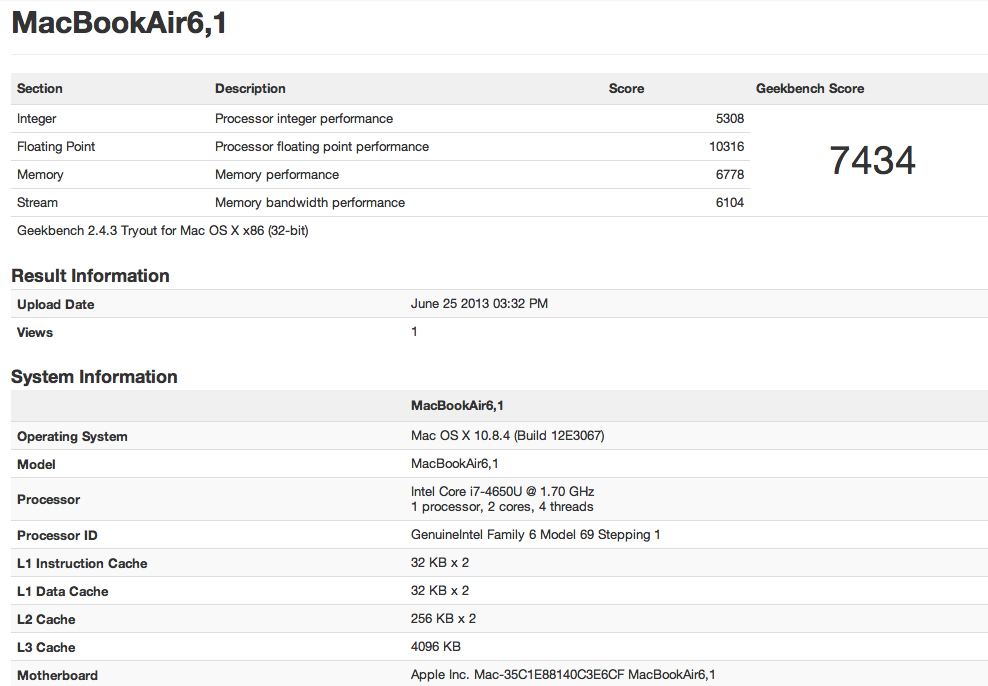
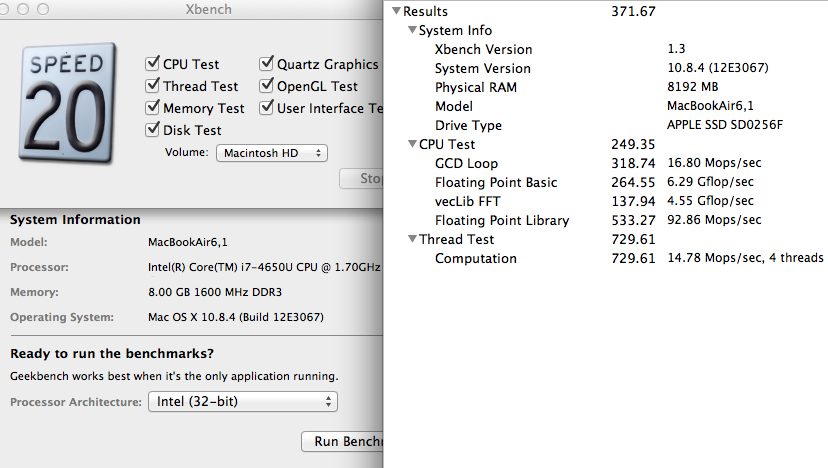
The situation is identical with Geekbench and XBench, which show a performance advantage of 22 or 35% respectively for the i7 CPU.
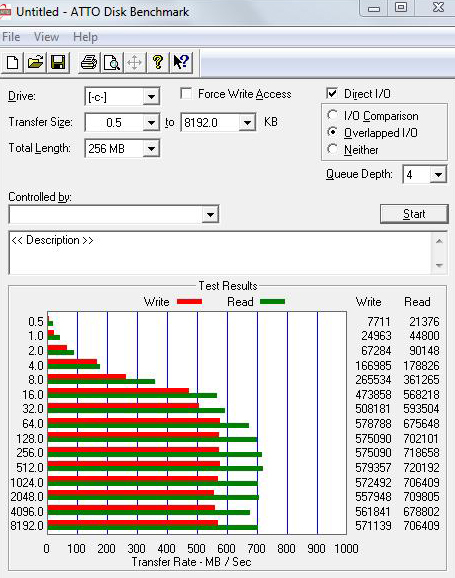
Storage Solution: Apple SSD SM0256F
After our review with the 128 GB SSD entry-level configuration, we can have a closer look at the optional 256 GB PCIe-SSD in our i7 review unit. We already determined a noticeable performance advantage of the smaller drive compared to the Solid State Drives in the predecessors. Sequential data rates could almost compete with high-end 2.5-inch SSD's, it only fell behind in the 4k tests but was still at a good level.

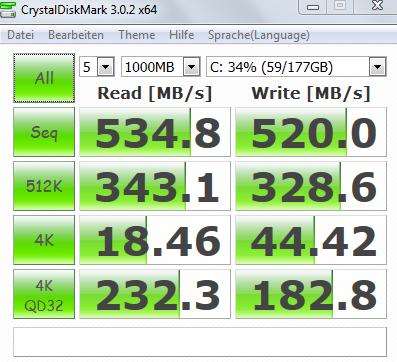
Let us compare the performance of the Apple SSD SM0256F with the 128 GB entry-level solution: The read tests do not show significant differences, they are within the variation of the results after several benchmark runs. The situation is different with the sequential and 512k write operations where we determine a noticeable advantage compared to the 128 GB drive. This advantage could be a result of the larger capacity (if it uses more memory chips).
The ASSSD Copy benchmark also shows a clear advantage for the 256 GB SSD, copying of an ISO file (benchmark) is almost twice as fast. PCMark 7 Storage determines a nearly identical result for both storage solutions; all in all the PCIe-SSD is in the leading group of all our reviewed storage solutions.
Compared to a current high-end 2.5-inch SSD (SATA3), in this case a Samsung 840 Pro, we can see that the Apple SSD can keep up in regard to the sequential transfer rates, while it clearly falls back in the 4k tests.


Graphics: Intel HD Graphics 5000

There are no significant differences between the two graphics solutions; the i7 configuration uses the same Intel HD Graphics 5000 GT3. A more detailed look however reveals a 100 MHz higher turbo clock compared to the i5-4250U. In theory, this would result in a 10% performance advantage.
While we determined an advantage of around 15% in the Cinebench R11.5 OpenGL benchmark under Mac OS (20.58 vs. 23.63 fps), the tests under Bootcamp Windows indicate no significant performance differences apart from some percent measurement scattering.
| Cinebench R11.5 - OpenGL 64Bit (sort by value) | |
| Apple MacBook Air 11 inch 2013-06 1.7 GHz 256 GB | |
| Apple MacBook Air 11 inch 2013-06 MD711D/A | |
| Apple MacBook Air 11 inch 2012-06 MD223D/A | |
| 3DMark 11 - 1280x720 Performance (sort by value) | |
| Apple MacBook Air 11 inch 2013-06 1.7 GHz 256 GB | |
| Apple MacBook Air 11 inch 2013-06 MD711D/A | |
| Apple MacBook Air 11 inch 2012-06 MD223D/A | |
| 3DMark Vantage - 1280x1024 P Result (sort by value) | |
| Apple MacBook Air 11 inch 2013-06 1.7 GHz 256 GB | |
| Apple MacBook Air 11 inch 2013-06 MD711D/A | |
| Apple MacBook Air 11 inch 2012-06 MD223D/A | |
| 3DMark 06 - 1280x1024 Standard Score AA:0x AF:0x (sort by value) | |
| Apple MacBook Air 11 inch 2013-06 1.7 GHz 256 GB | |
| Apple MacBook Air 11 inch 2013-06 MD711D/A | |
| Apple MacBook Air 11 inch 2012-06 MD223D/A | |
| 3DMark 06 Standard Score | 5976 points | |
| 3DMark Vantage P Result | 4734 points | |
| 3DMark 11 Performance | 1163 points | |
| 3DMark Ice Storm Standard Score | 39098 points | |
| 3DMark Cloud Gate Standard Score | 5059 points | |
Help | ||
Gaming Performance
We also use some of the latest games to determine any differences of the two CPU's. All in all the results of the Intel Core i5 CPU, the 13-inch MacBook Air Mid 2013 (also with i5-4250U) and our review unit with the i7-4650U processor are very close together; we could not see a significant performance advantage of the i7 CPU during gaming. The MacBook Air remains a notebook with entry-level gaming capabilities.
| low | med. | high | ultra | |
|---|---|---|---|---|
| Anno 2070 (2011) | 57.8 | 32.23 | 20.08 | |
| Tomb Raider (2013) | 56 | 27.5 | 15.8 | |
| BioShock Infinite (2013) | 34.3 | 20.87 | 16.62 |
| BioShock Infinite - 1366x768 High Preset (sort by value) | |
| Apple MacBook Air 11 inch 2013-06 1.7 GHz 256 GB | |
| Lenovo ThinkPad X230T | |
| Asus F75VC-TY088H | |
| Samsung 730U3E-S04DE | |
Emissions
System Noise
There are no differences of the configurations in regard to the system noise. Office tasks, for example writing of texts, web surfing and light workloads are no problem for the cooling system and usually result in a silent device. We measure a maximum system noise of 39 db(A) under load for the i7 MacBook Air with the maximum fan speed of 6500 rpm. The slow response characteristic of the fan speed is subjectively identical to the i5 version.
Noise level
| Idle |
| 28.7 / 28.7 / 28.7 dB(A) |
| Load |
| 39.2 / 39.2 dB(A) |
 | ||
30 dB silent 40 dB(A) audible 50 dB(A) loud |
||
min: | ||
Temperature
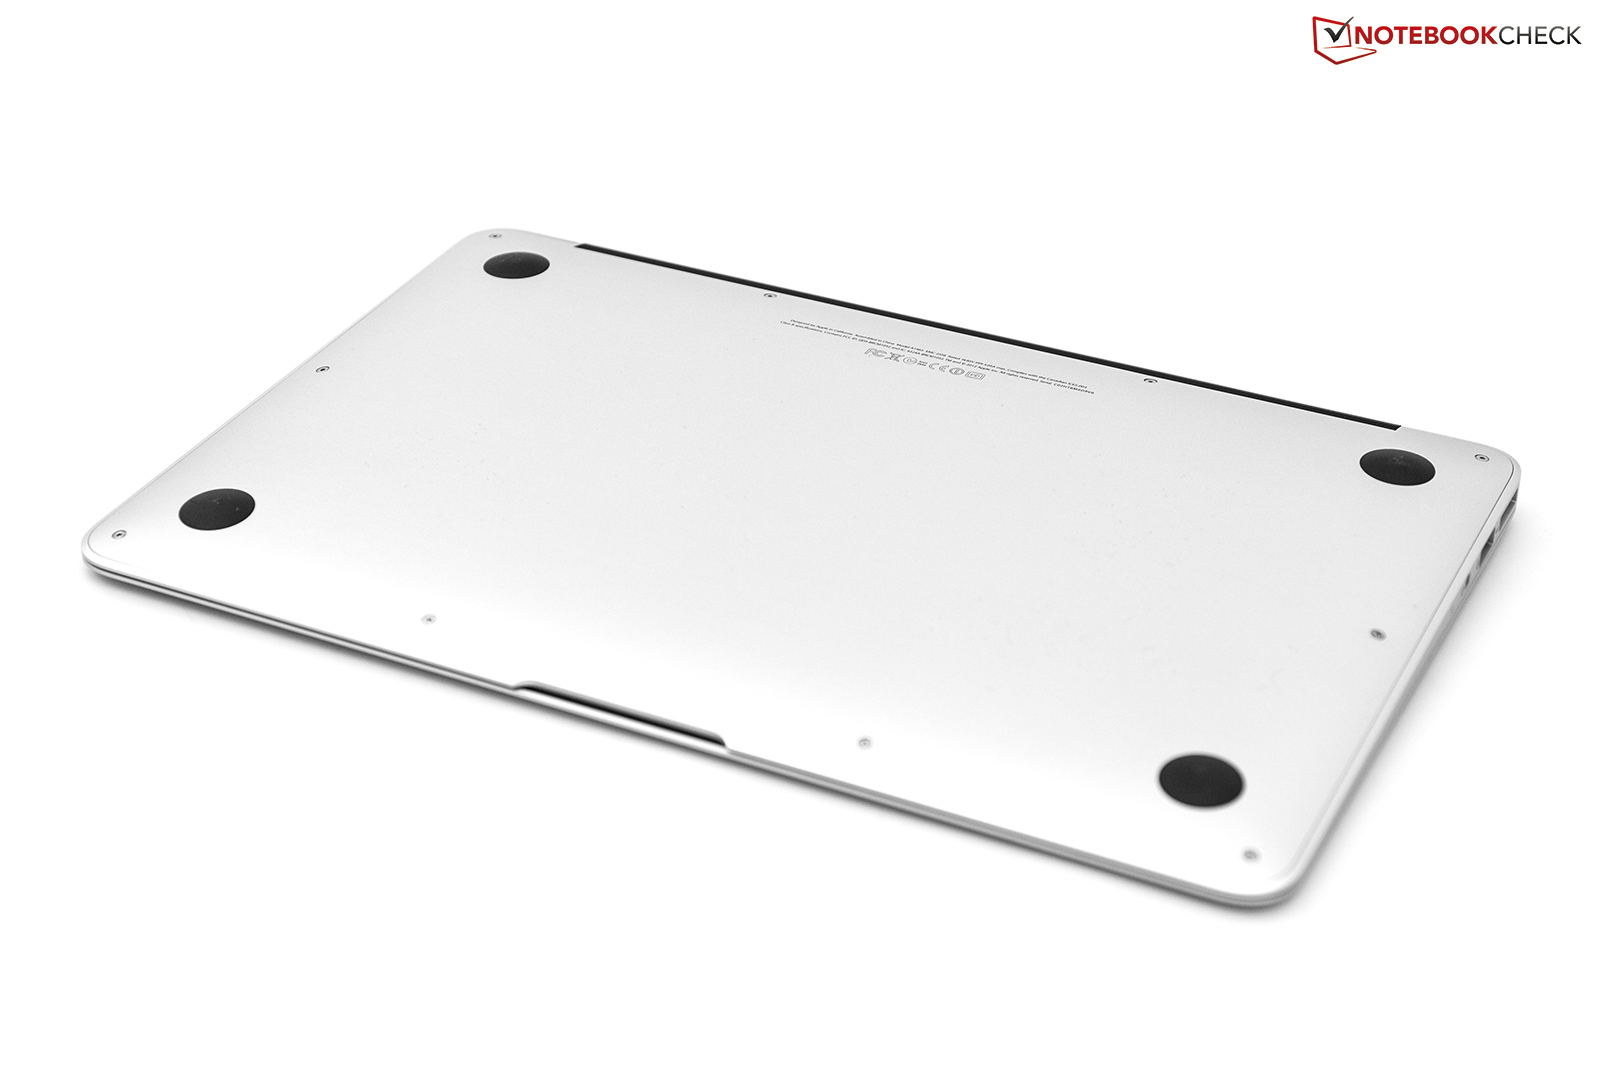
The surface temperatures show almost no impact of the i7 CPU in comparison either. Average surface temperatures during idle (Mac OS) are very similar to the i5-4250U version. Subjectively the aluminum unibody case feels slightly warmed up but not inconveniently so. This impression remains even after long operation. Under load (Bootcamp Windows), we could see slightly higher temperatures compared to the i5 version.
(±) The maximum temperature on the upper side is 44.9 °C / 113 F, compared to the average of 35.9 °C / 97 F, ranging from 21.4 to 59 °C for the class Subnotebook.
(-) The bottom heats up to a maximum of 45.8 °C / 114 F, compared to the average of 39.2 °C / 103 F
(+) In idle usage, the average temperature for the upper side is 27.4 °C / 81 F, compared to the device average of 30.8 °C / 87 F.
(±) The palmrests and touchpad can get very hot to the touch with a maximum of 36.2 °C / 97.2 F.
(-) The average temperature of the palmrest area of similar devices was 28.2 °C / 82.8 F (-8 °C / -14.4 F).
Energy Management
Power Consumption
We observe a slight raise in regard to the energy consumption, at least with our measurements under Bootcamp Windows. The idle measurements are 1-2 Watts higher than the i5 configuration. Our load scenarios however show no significant differences (31.4 / 48.4 Watts). Interesting: Our measurements under Mac OS are almost identical with the i5 version: 1.5 Watts / 3.6 Watts / 4.7 Watts.
| Off / Standby | |
| Idle | |
| Load |
|
Key:
min: | |
Battery Runtime
We were surprised by the battery runtime tests: The more realistic WLAN scenario (Mac OS, web page is refreshed every 40 seconds) determines a battery runtime of 13 hours and 21 minutes (brightness at around 160 cd/m²). Not only is this an excellent result in itself, the i7 configuration can even beat its i5 sibling (620 minutes). Apart from some measurement uncertainties, the i7 CPU could have some advantages with different load situations in regard to the battery runtime, at least in theory. It needs less time to execute tasks and can switch back to the energy-saving sleep mode more quickly. Quality differences of the CPU (selected chips for the i7 CPU's) could provide better energy efficiency as well. Under load, the situation changes and the i5 CPU provides longer battery runtimes (also see Anandtech analysis).
Favorable circumstances (Reading mode, Mac OS, display brightness setting 1) even result in 23.5 hours battery runtime. This is the maximum runtime with minimal load.
Verdict
And now, the final question: What should you buy? i5 or i7 processor, 128 GB or 256 GB SSD?
The latter is probably easier to answer since the decision is primarily based on the required storage capacity. The user can use around 100 GB (Mac OS) of the 128 GB drive; this should be sufficient for the normal user. The larger 256 GB drive is more interesting if your usage model is more multimedia-oriented with lots of music, pictures and videos on your computer. Ambitious users also get the slightly faster solution with the 256 GB SSD, although the advantage is not apparent with daily tasks. Additional charge: around 200 Euros (~$263). You could also buy a 256 GB mSATA SSD for that money without waiving the 128 GB drive. Obviously, this is not an option for the MacBook Air but it shows the price policy of Apple.
The CPU choice is a bit more complicated; we also speak about an additional charge of 150 Euros (~$197), not an insignificant investment. Intel lists the i7-4650U CPU for $454, the i5-4250U is not listed but the next CPU in line, the i5-4350U (1.4 GHz), is listed for $342. The additional charge of Apple seems to be reasonable in this case (probable discounts ignored).
Performance-wise, the i7-4650U has a significant advantage in many scenarios. The result is that more demanding tasks are executed faster. A 30% rendering performance advantage, for instance, can easily save a couple of minutes (or more) of waiting time. We could neither determine significant impacts in regard to the emissions (temperature, system noise) nor the battery runtimes. Our i7 configuration actually beats the i5 version in the WLAN scenario (load mix).
Ambitious users will be happy with the upgrades but the entry-level i5 configuration is more than sufficient for normal users.