Lenovo IdeaPad S940 Laptop Review: Slimmer, Lighter, Sleeker

For many years now, marketing from companies like microchip manufacturers has featured the elusive ultra-slim, ultra-small laptop of the future, which not too long ago was merely a sci-fi dream of sorts. Fast-forward to 2019, and we not only have made that dream a reality, but we’re living with multiple options from various manufacturers that fit that description. Dell’s XPS 13 obviously comes first to mind, as it was the first mover in a market with tiny bezels and super-small footprints and form factor. But Lenovo’s own Yoga series has been chasing this goal for quite some time, with HP’s EliteBooks and Spectre laptops alongside them.
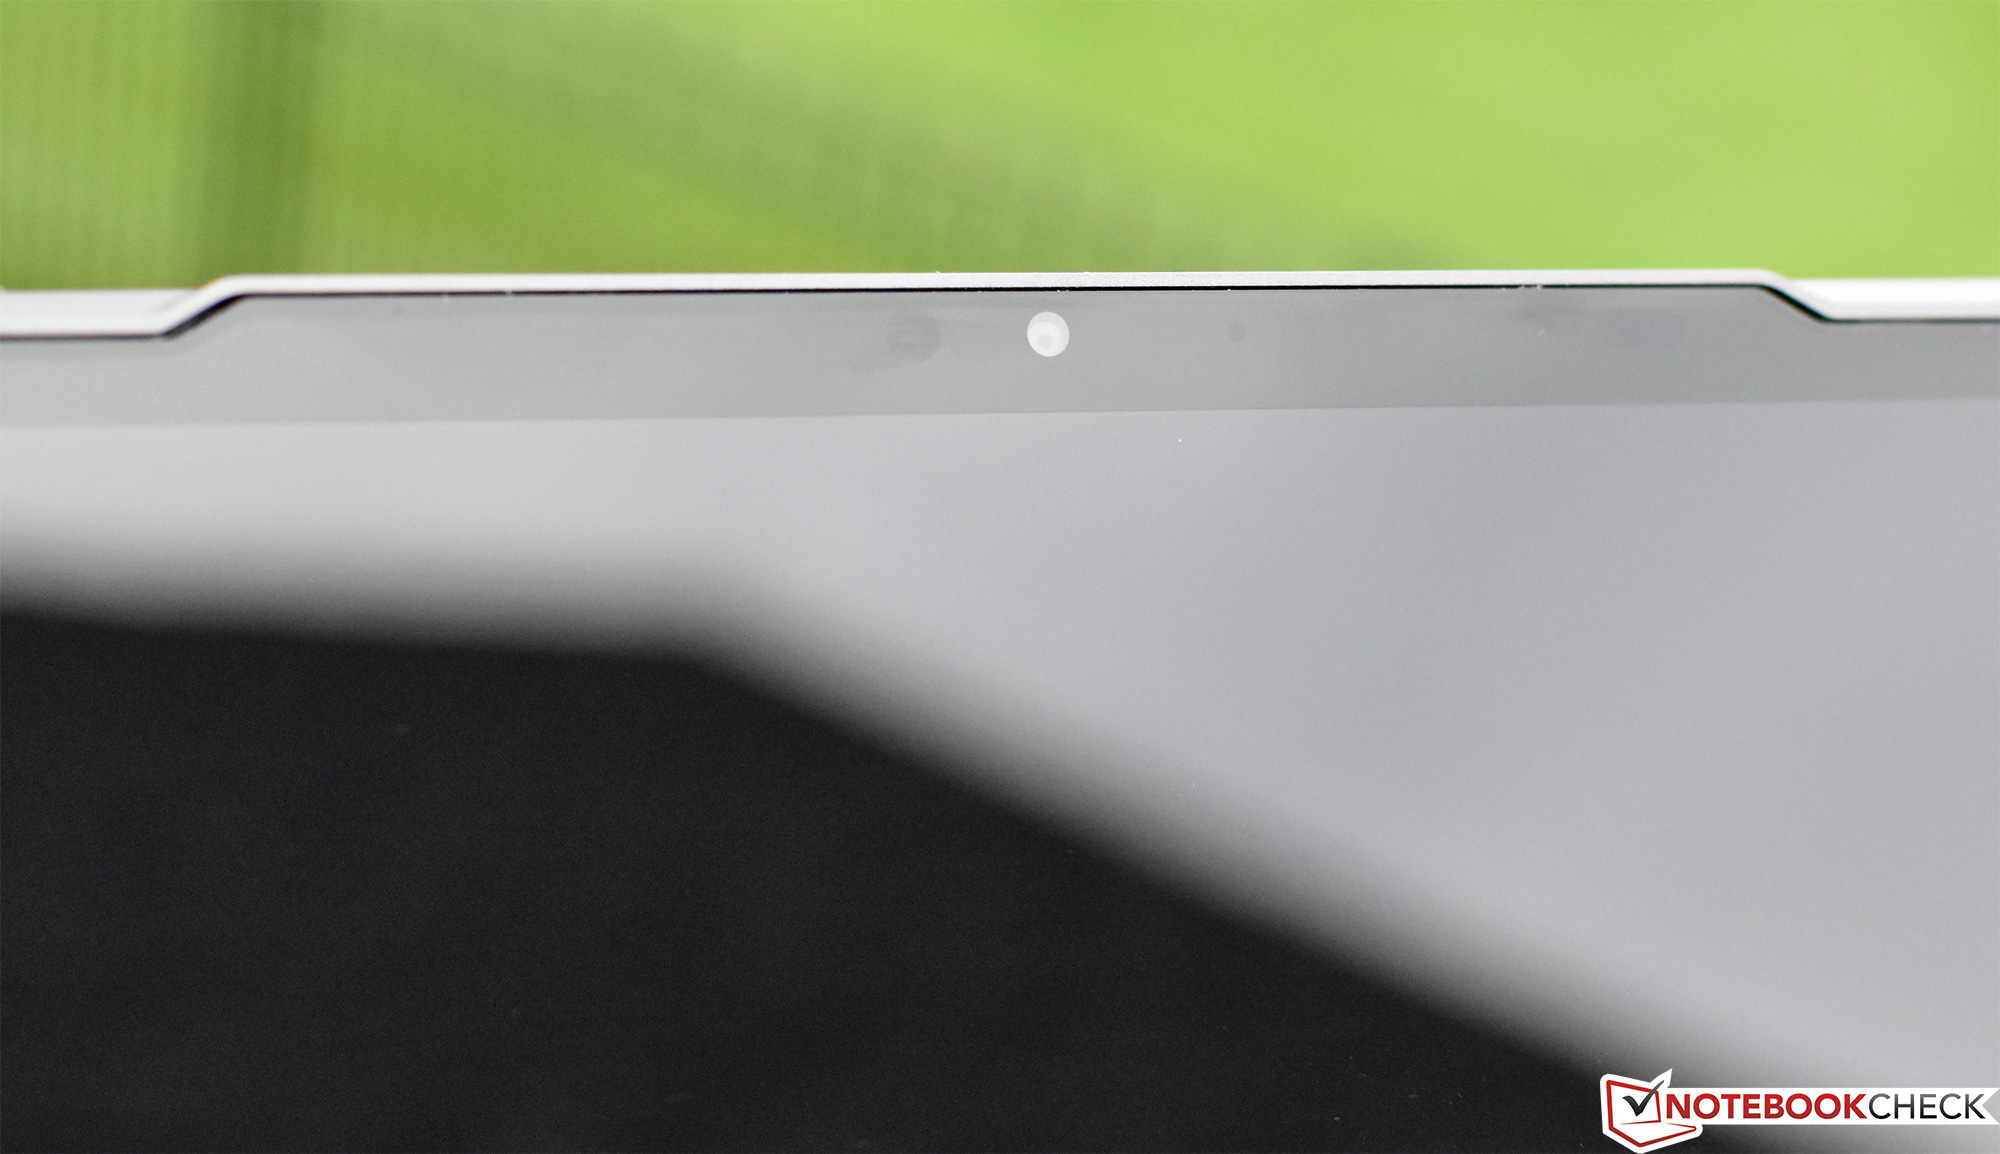
Today, with the release of the IdeaPad S940, Lenovo takes this dream a step further. Unlike its closest competitors, the S940 ($2,000 as configured) features a 14-inch dazzling 4K HDR display with ultra-slim bezels and a unique rounded glass edge. That’s easily the largest screen of any laptop of its size, made possible by the aforementioned rounded glass edge and an inverted notch to accommodate the webcam in its natural location above.
Alongside this centerpiece, our review unit is powered by a Core i7-8565U quad-core CPU, 16 GB RAM, and a Samsung 512 GB NVMe SSD. Surely, you might think, there must be some significant compromises undertaken in order to achieve such an ambitious design. You’d be correct—but let’s start from the top and work our way through yet another gargantuan review.
Case
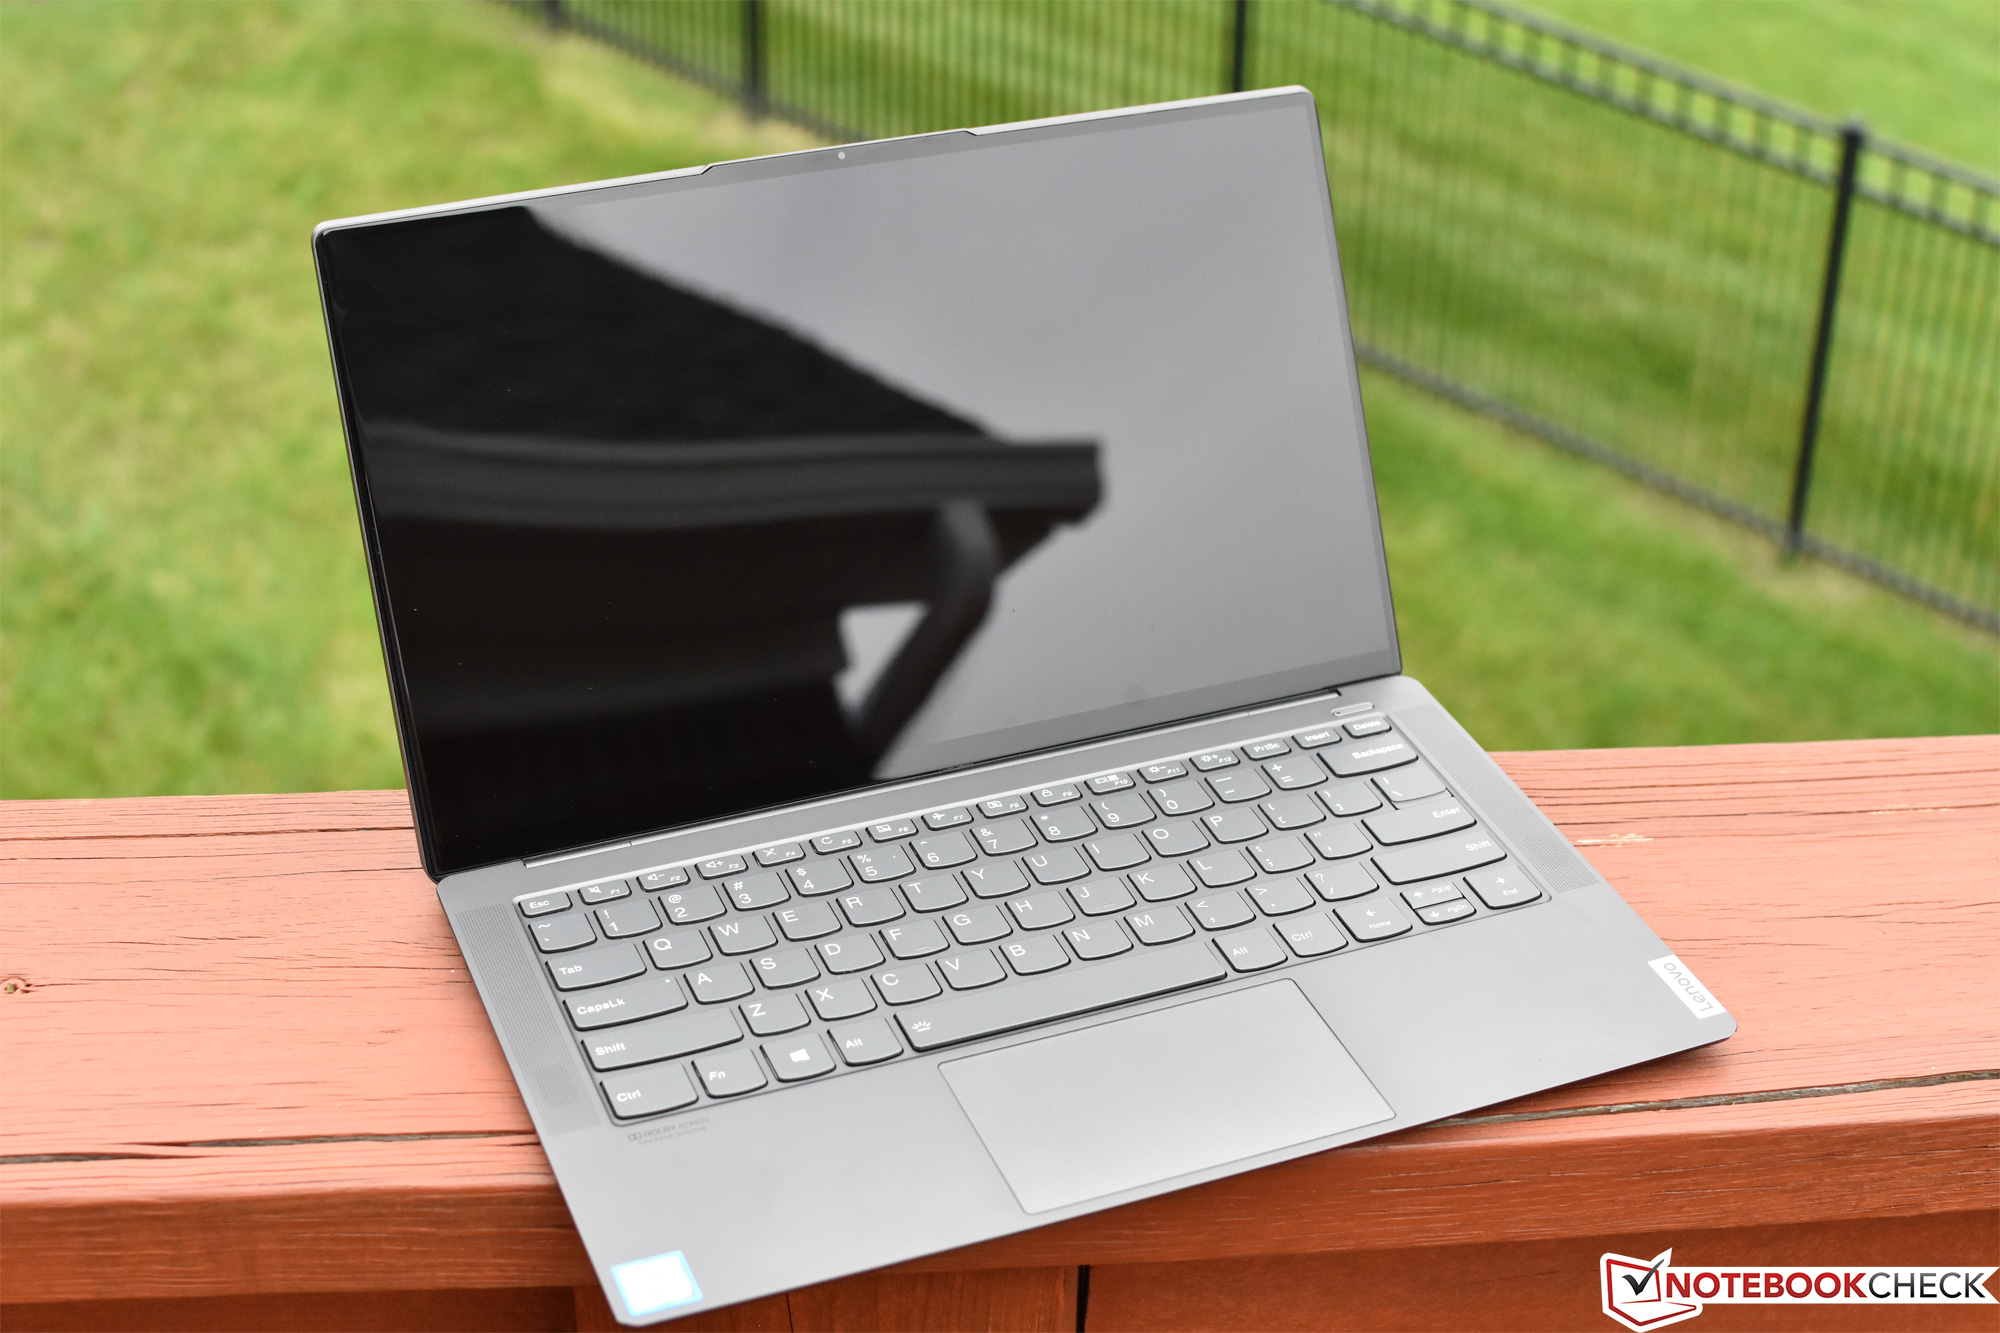
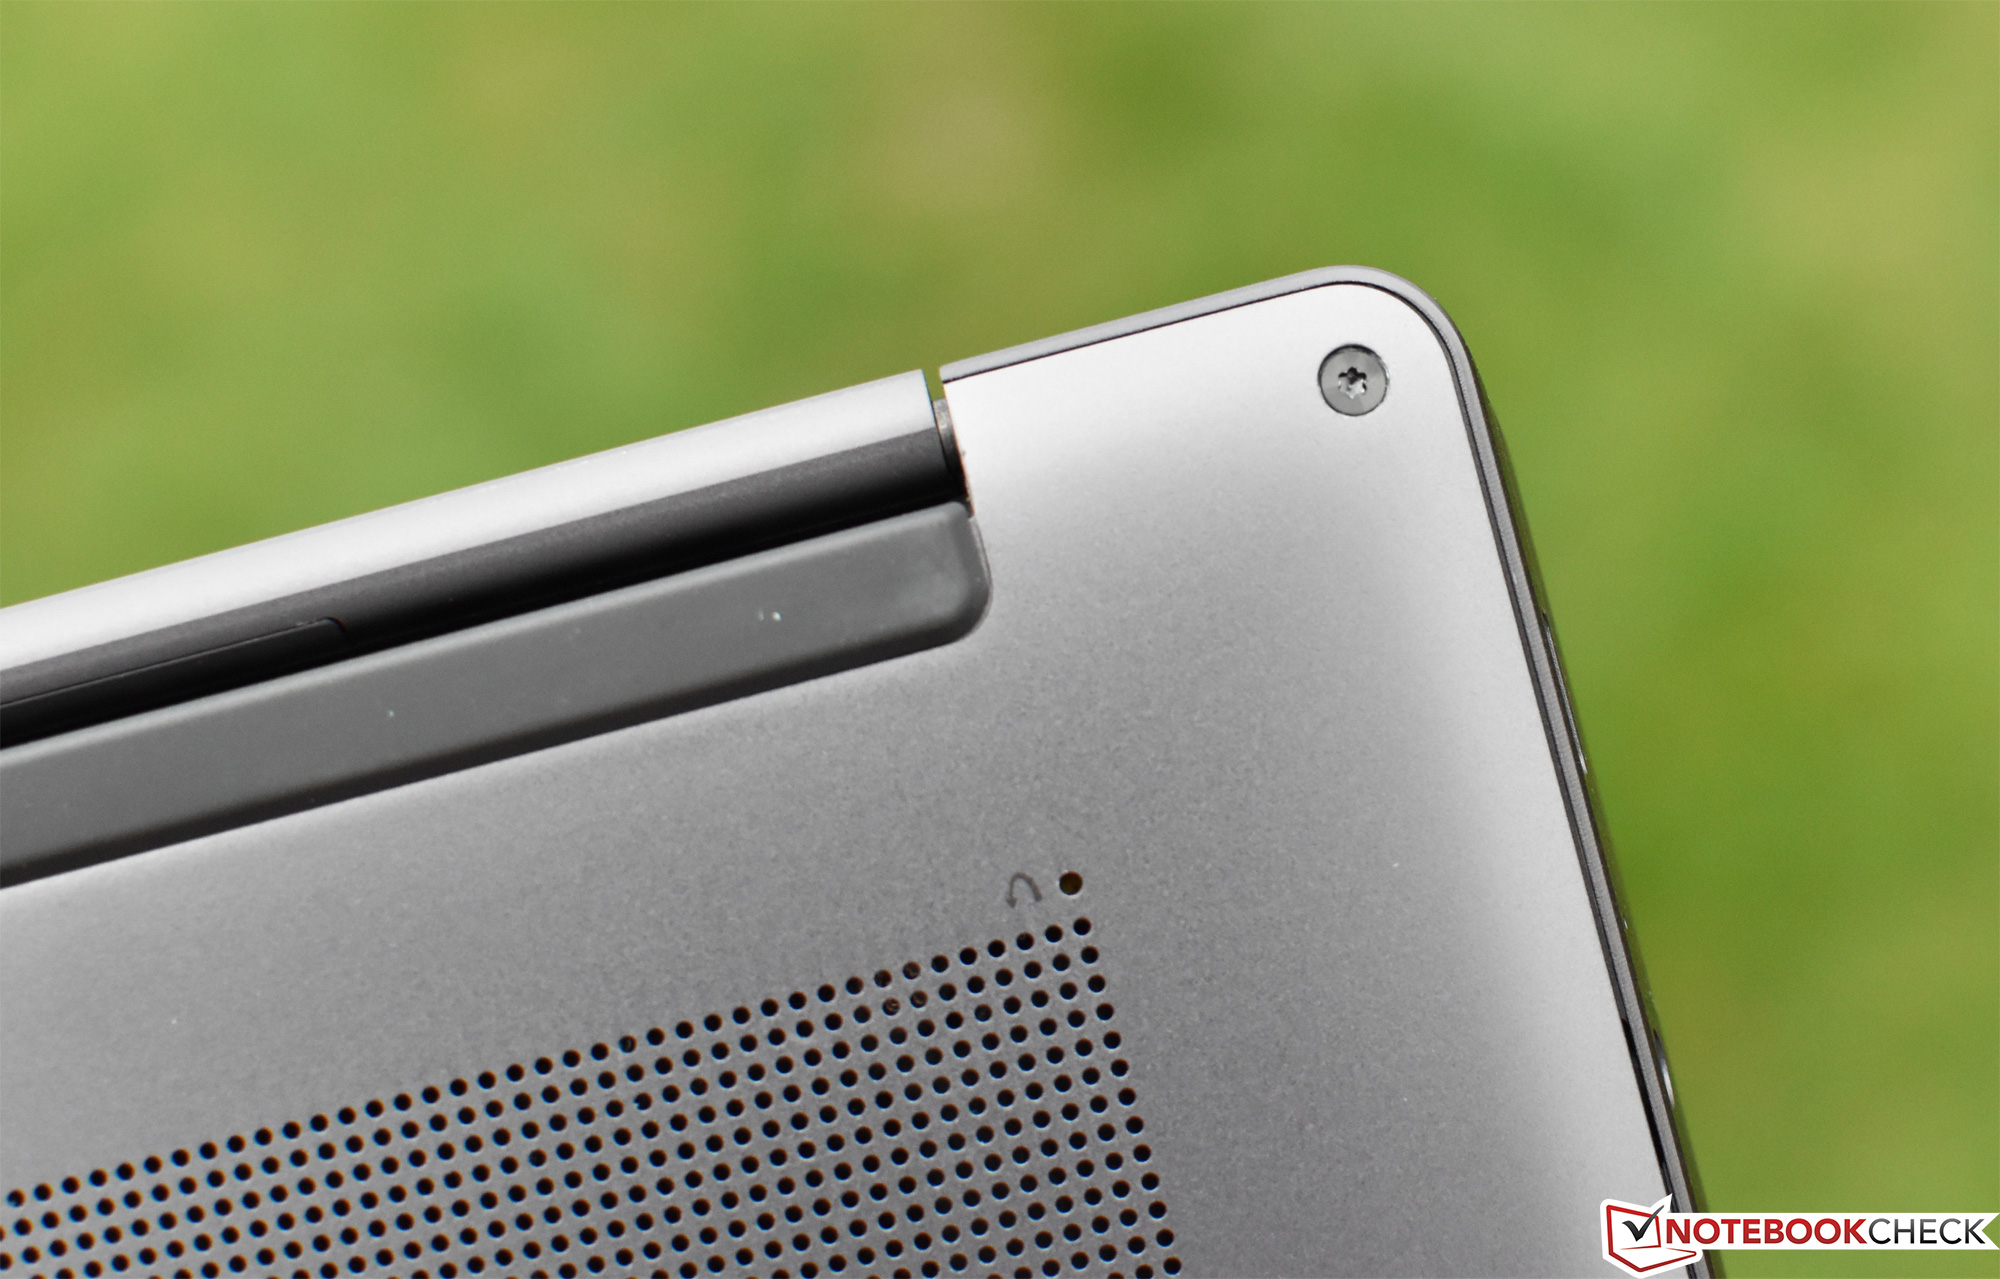
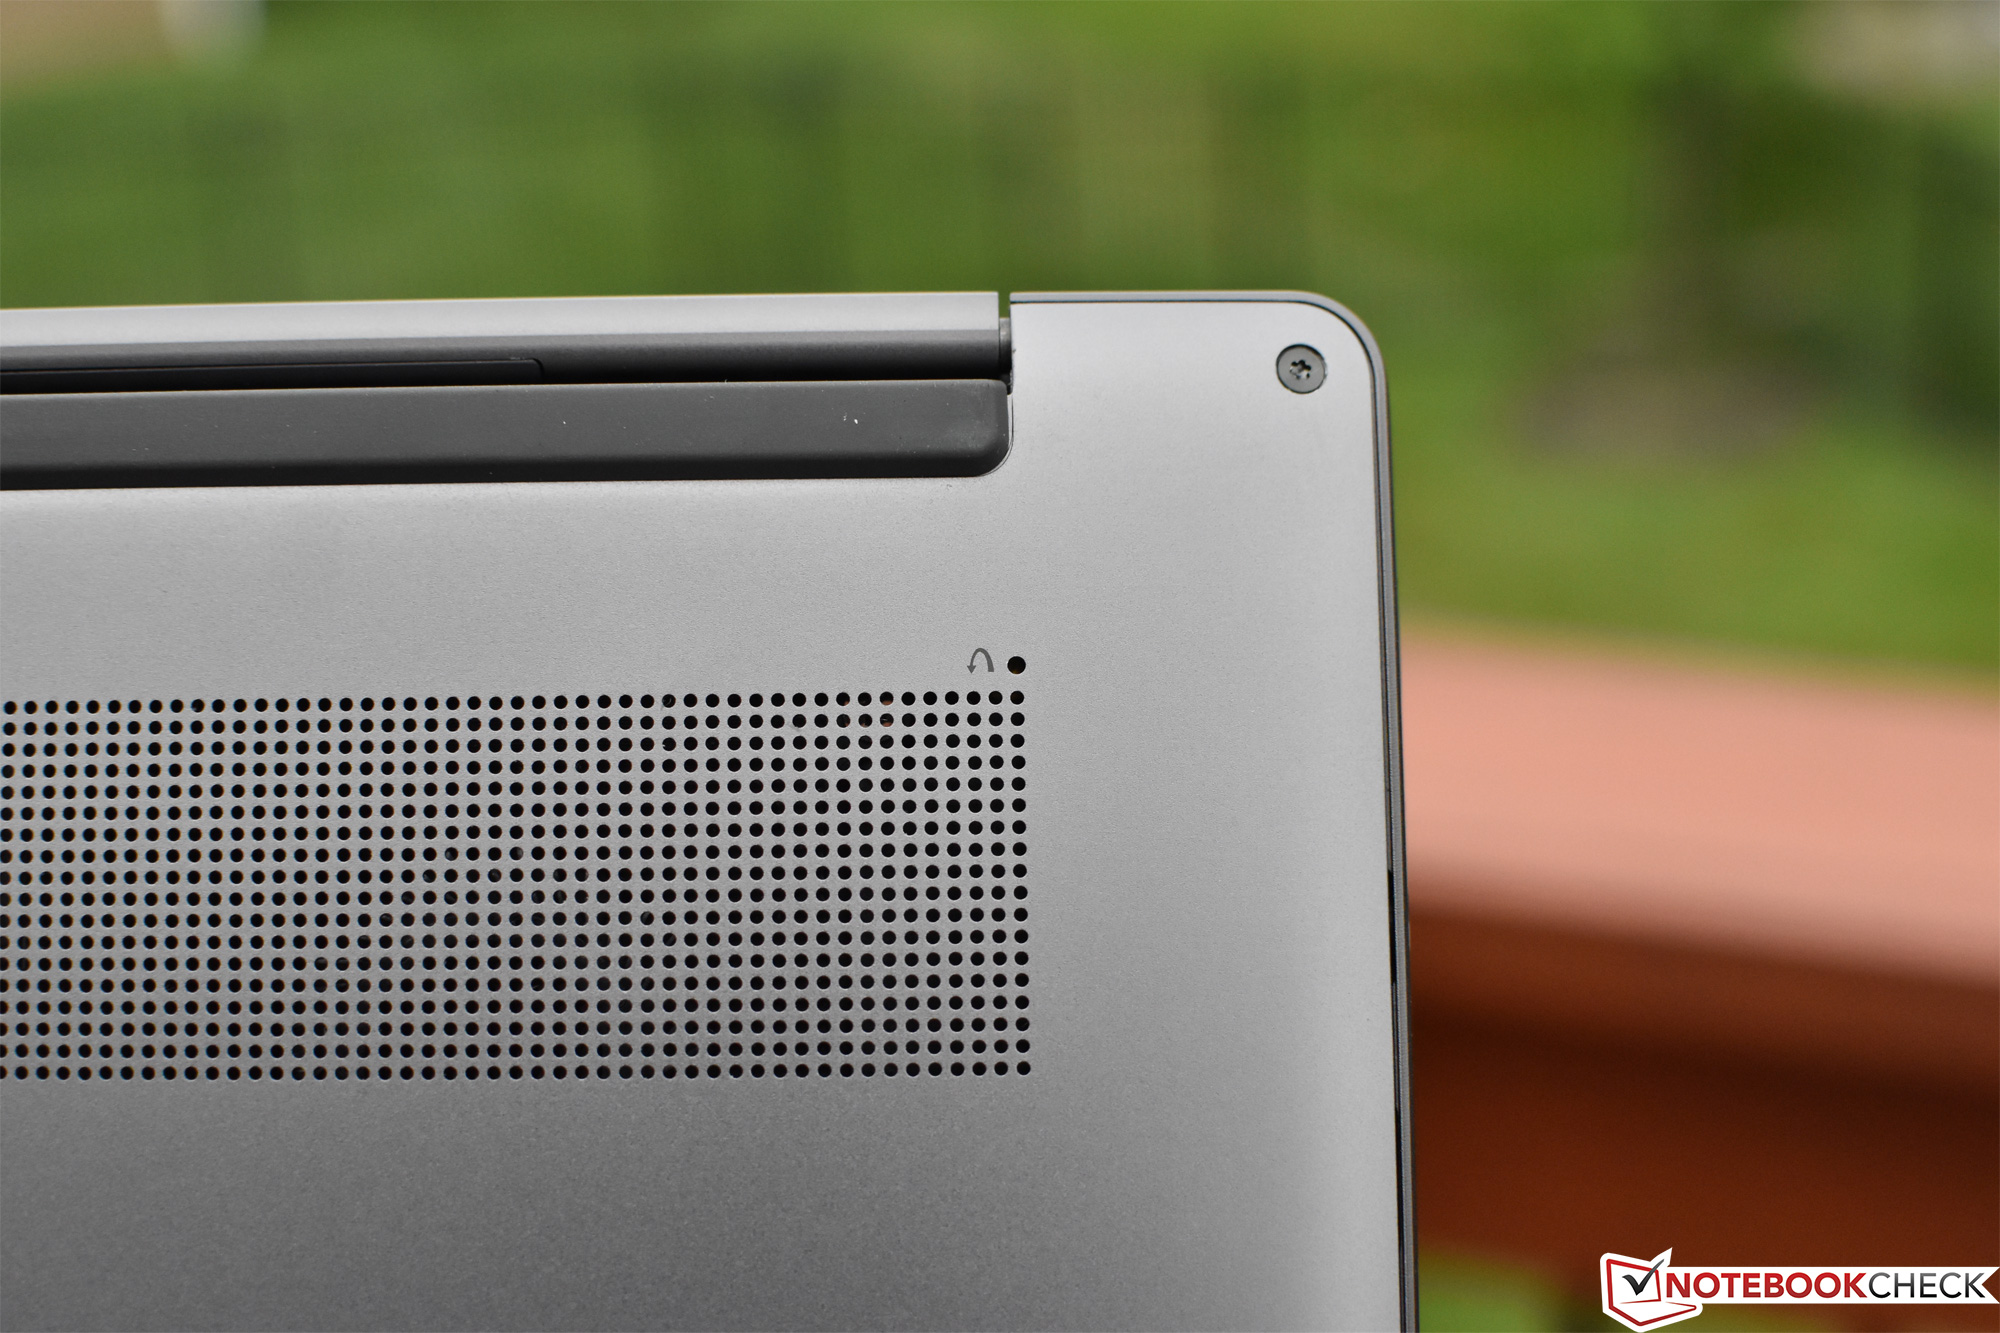
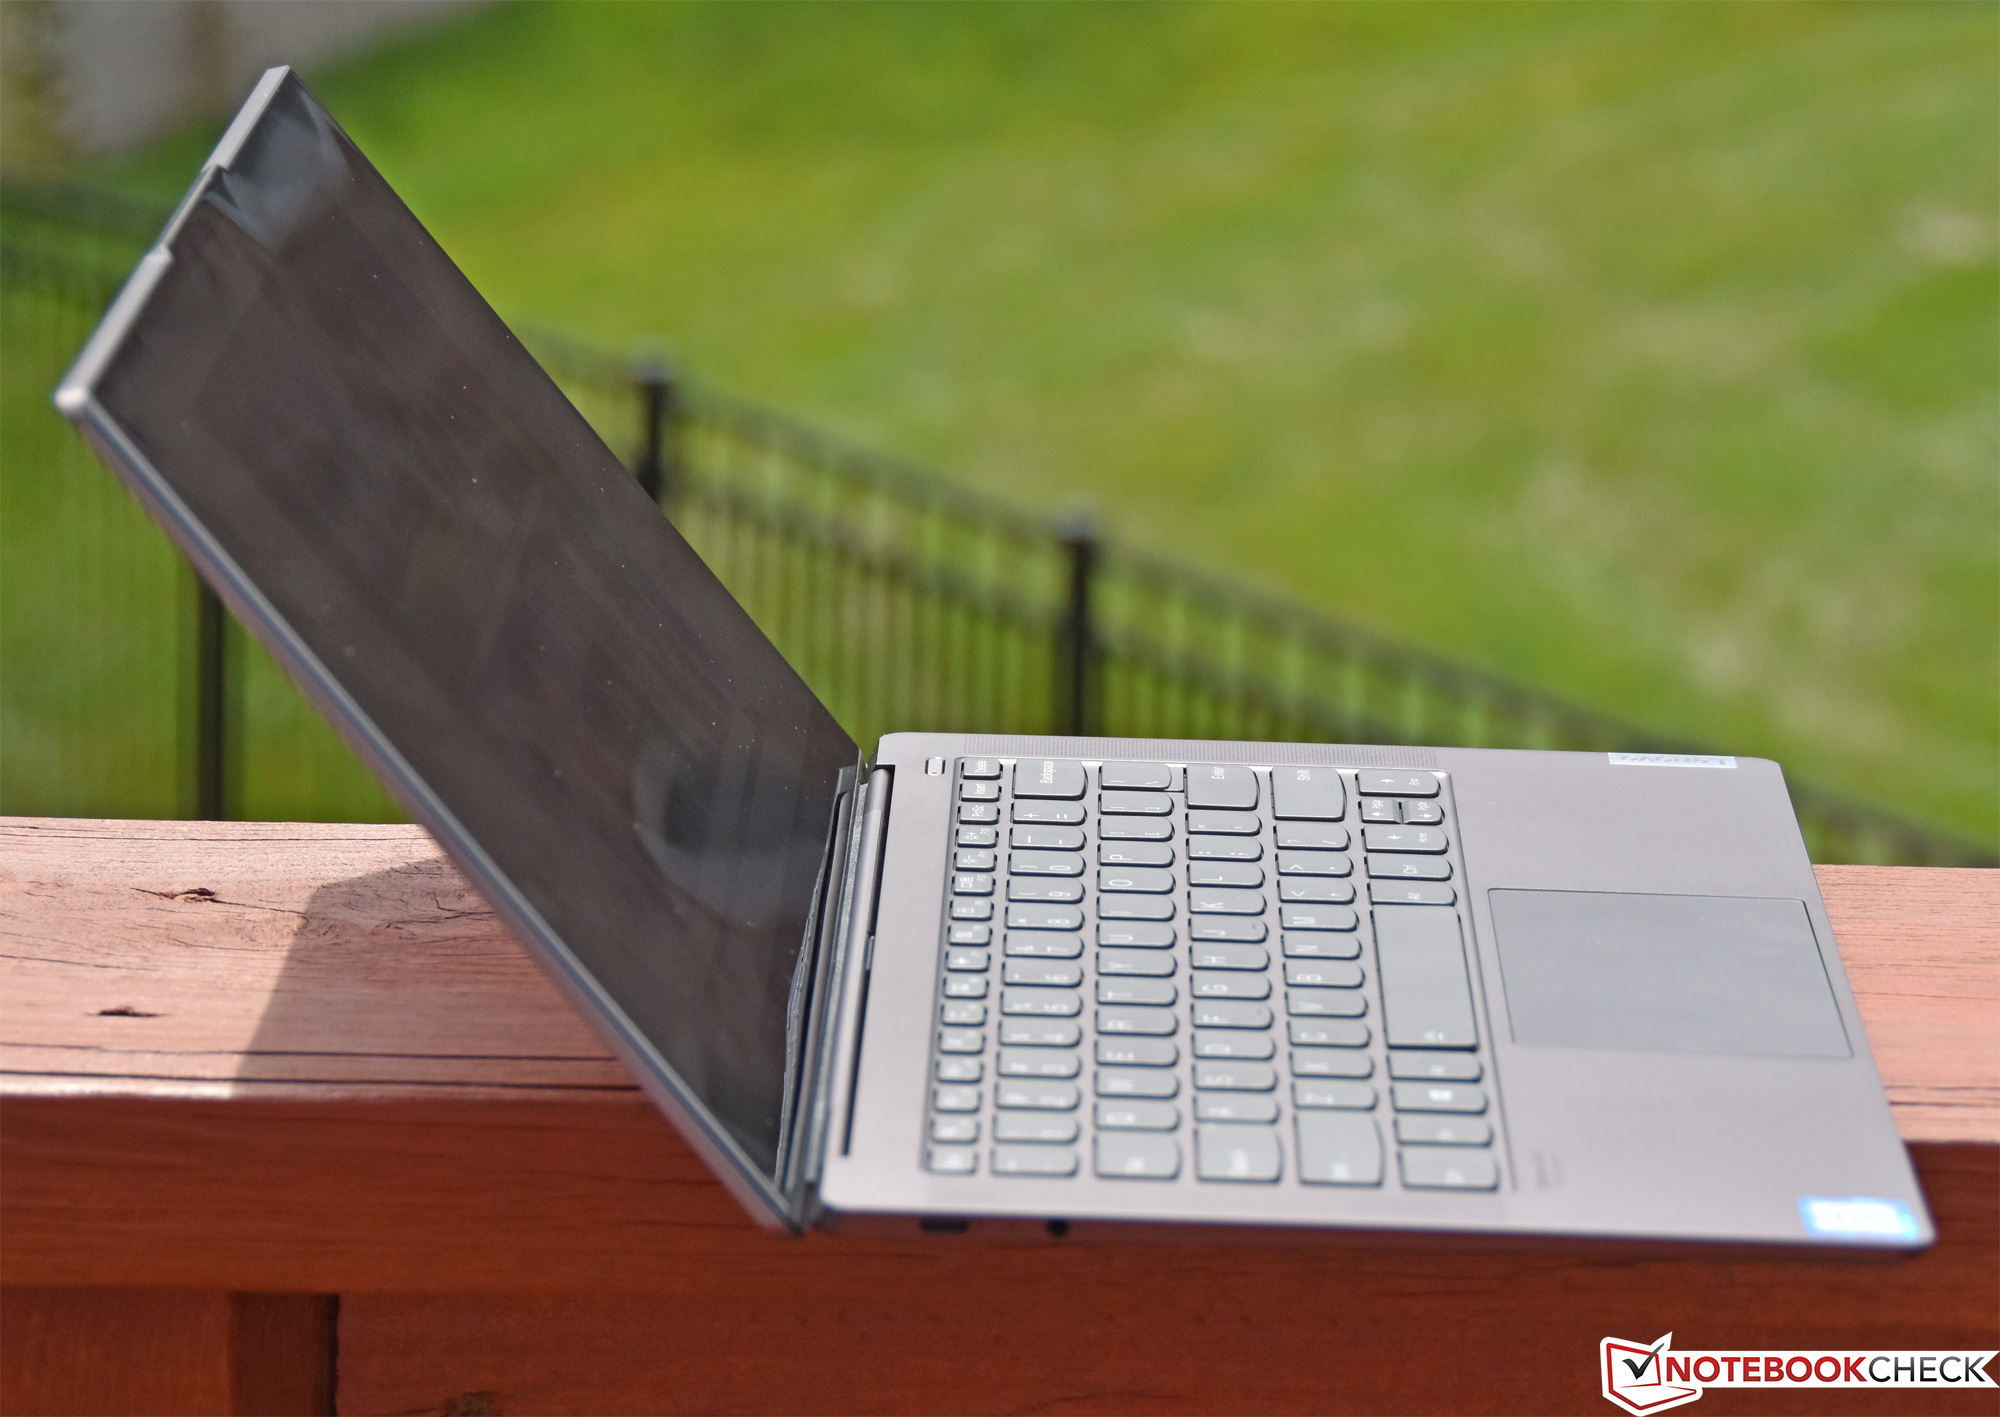
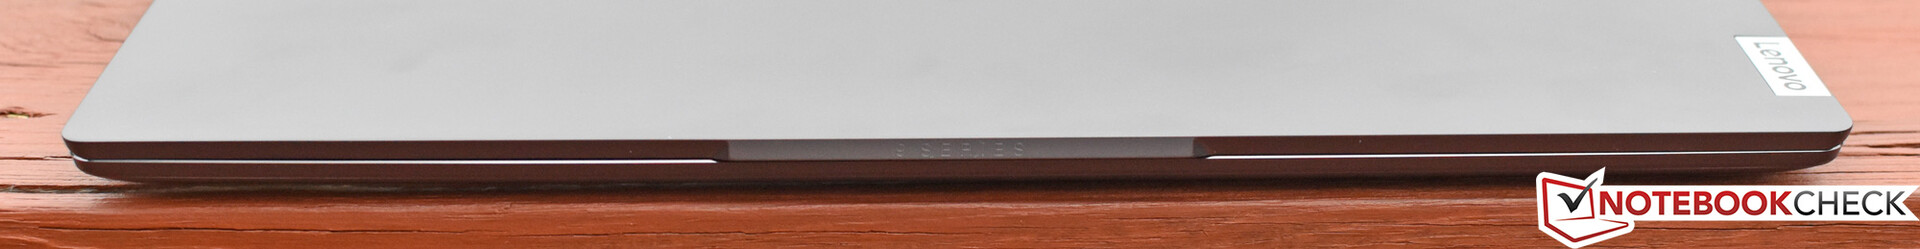
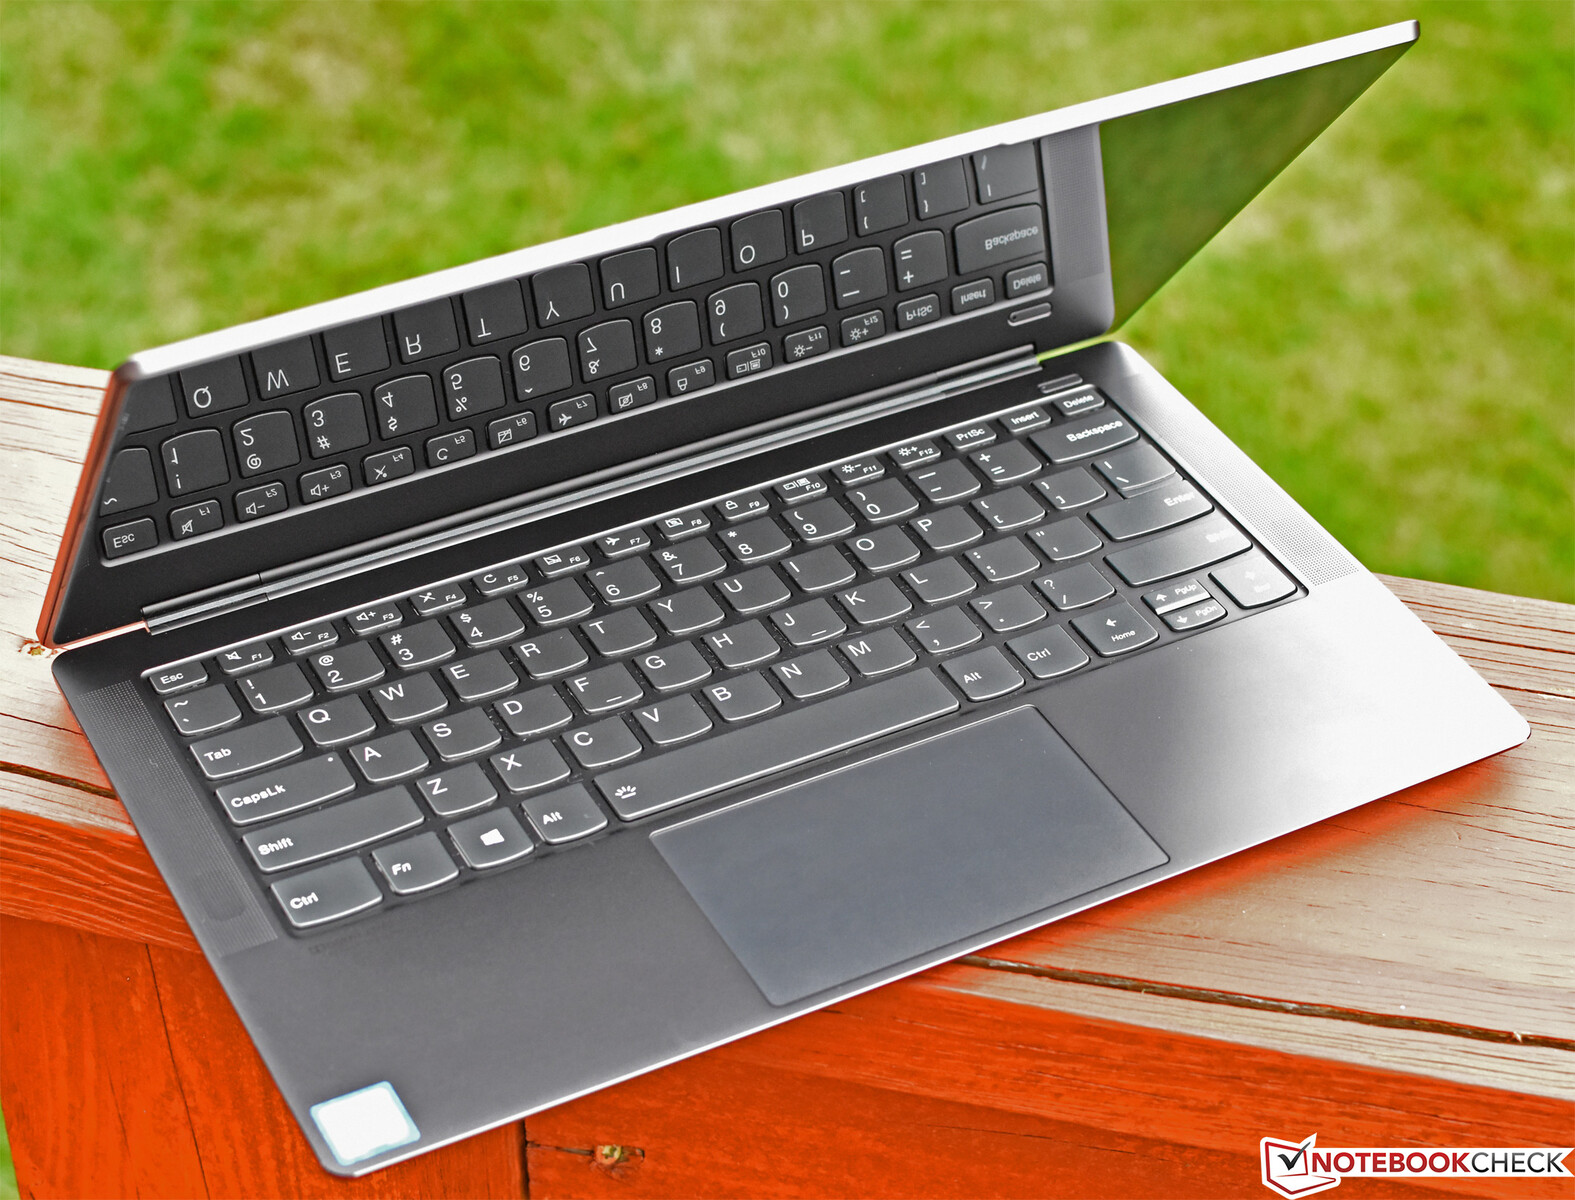
The IdeaPad S940 is undoubtedly one of the most attractive laptops we’ve ever reviewed. Chiseled out of aluminum and sandblasted for a professional-looking matte finish, the Iron Grey case is both clean and appealing in its styling. The bottom cover and display lid both feature a subtly rounded edge, which is both striking and comfortable in the hand. The display, while highly reflective, is extremely bright and bordered by tiny 5 mm bezels, with a unique curved glass edge (literally—inspired by modern smartphones) rounding out the design. Apart from this eye-popping screen, the only semblance of pomp is found in the two silver Lenovo logos, one on the lid and one on the right edge near the touchpad.
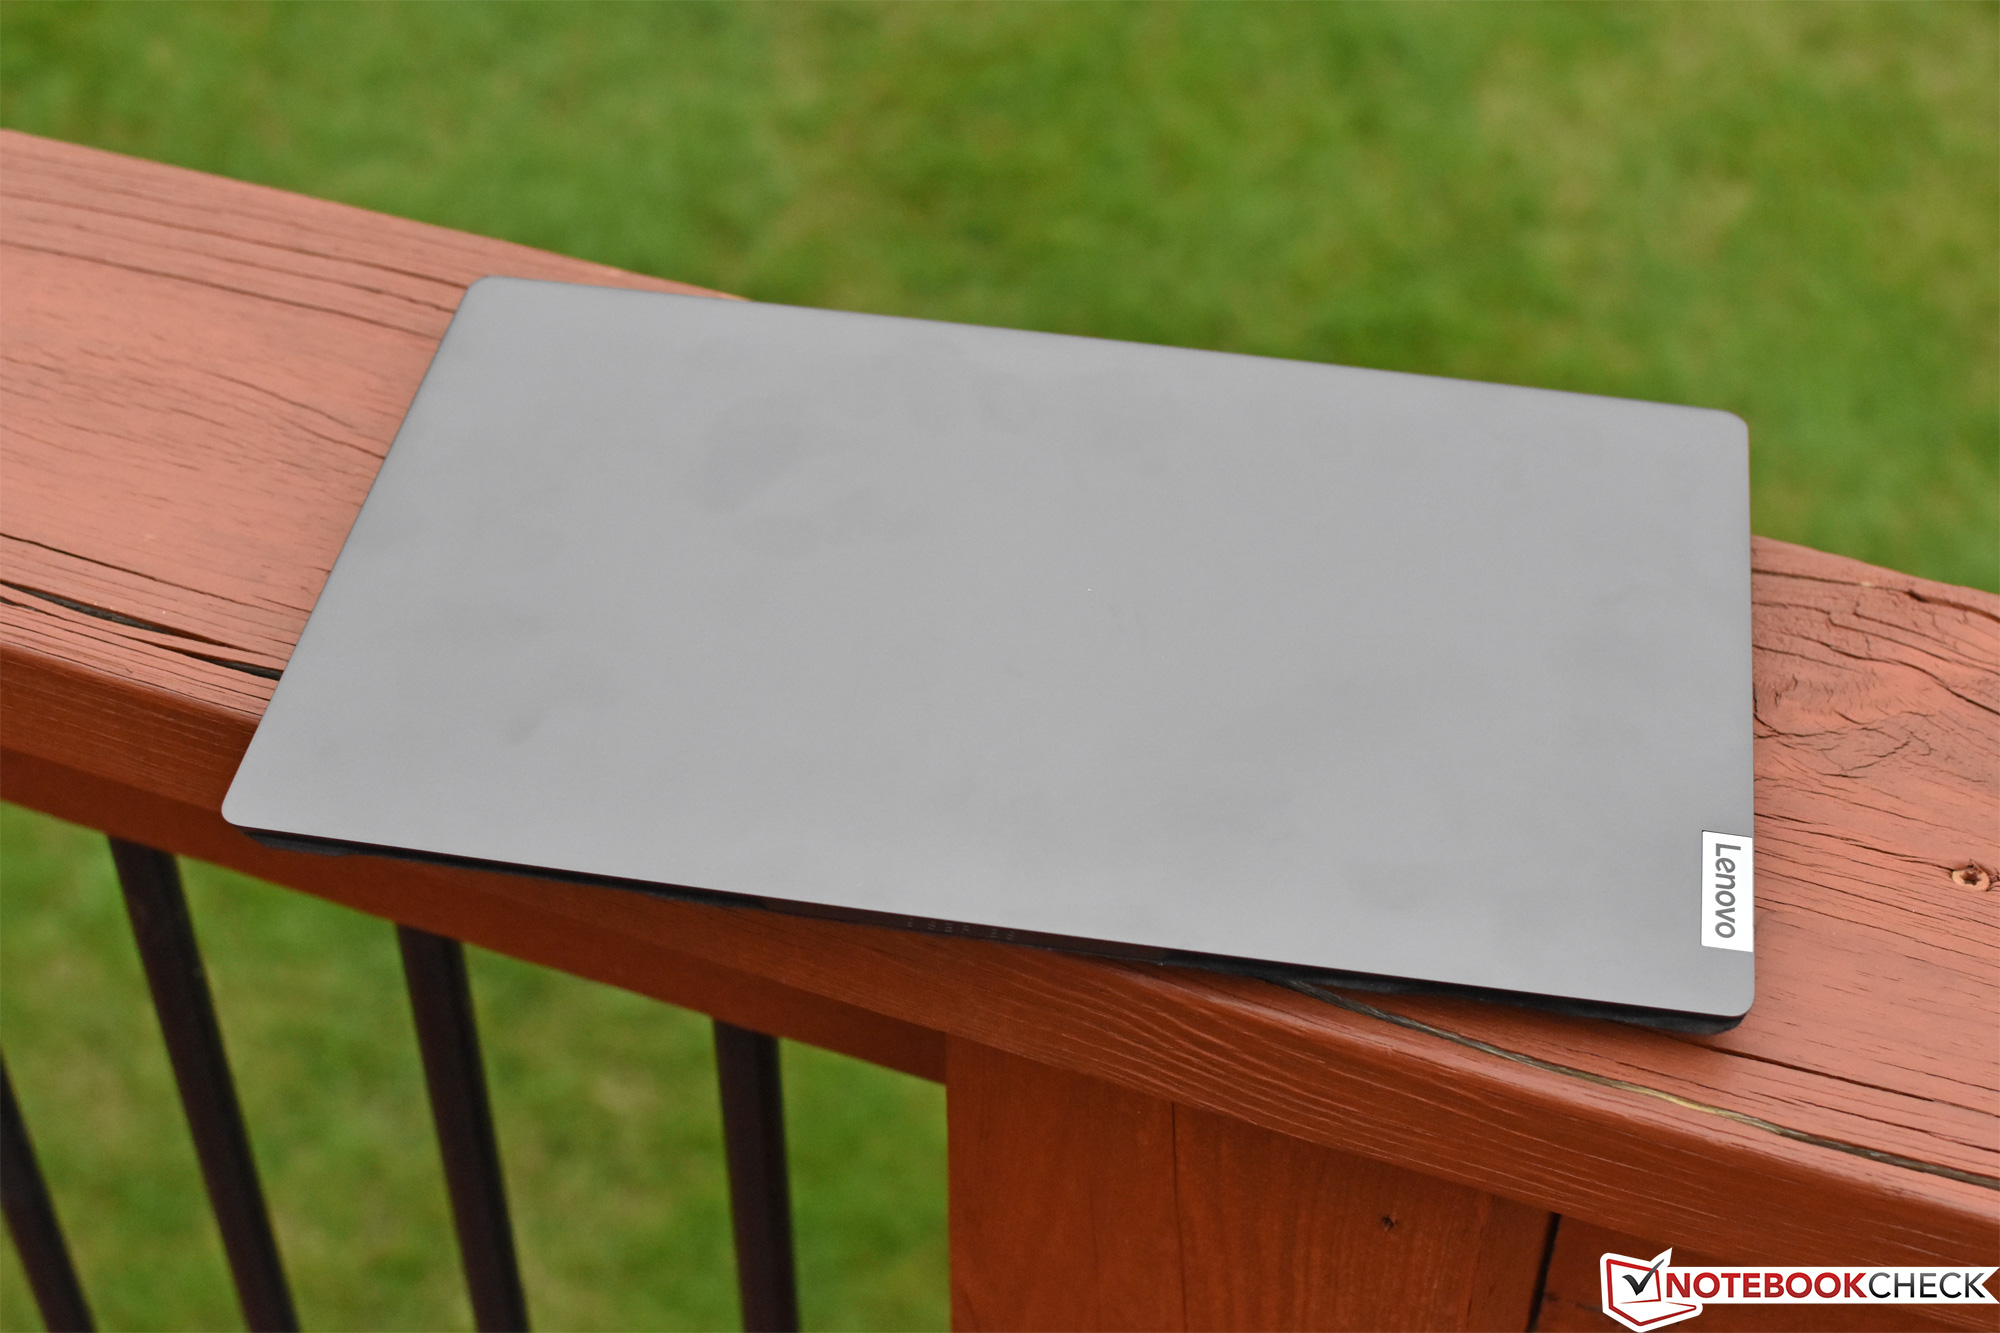
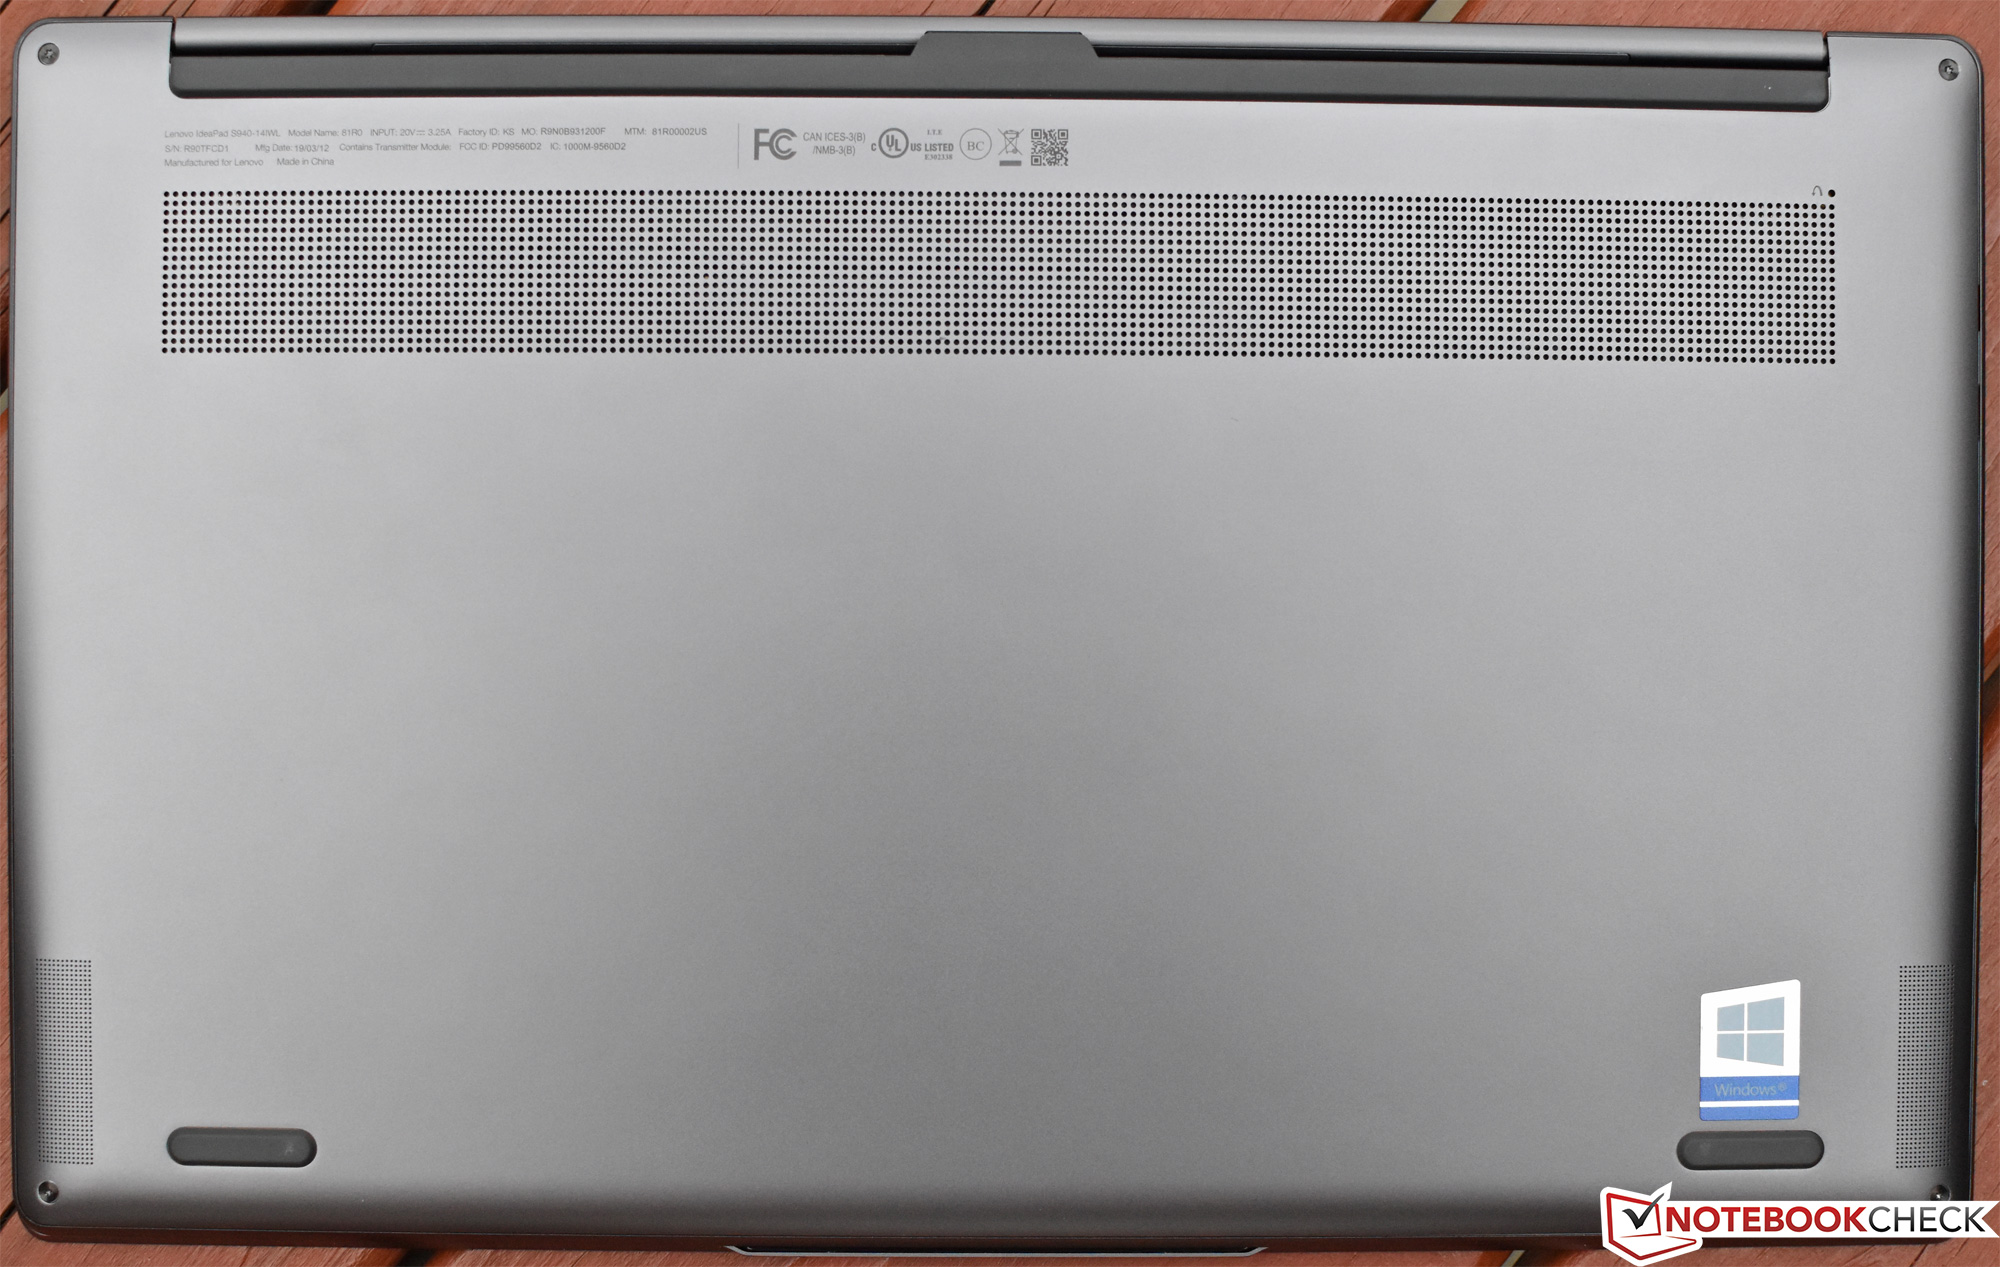
Weighing just 1.236 kg—with a footprint of just 320 x 199 mm and a thickness of only 12 mm—the S940 isn’t the smallest device in our comparison group, but it’s also just one of two 14-inch machines in the lineup. Only the ThinkPad X1 Carbon matches its screen size, and while the X1 weighs slightly less (1.1 kg), it’s a considerably larger machine at 323 x 217 x 16 mm. Despite its ultra-thin profile, we detected only mild flex in the center of the case (above the touchpad), thanks in part to the large rear rubber foot spanning the horizontal breadth of the top of the machine’s underside. The only true negative to such a compact form factor remains the availability of palm rest real estate; users with larger hands will probably find lengthier typing sessions to be less than comfortable, as the chiseled front edge can dig into the palms.
The display lid is supported by two expertly-tuned hinges; there is absolutely zero bounce in transit or while typing—a critical feature for a machine with a glossy display finish. Plus, the lid can be opened with a single hand, a feat which is rendered even easier by the aforementioned inverted webcam notch.
Connectivity
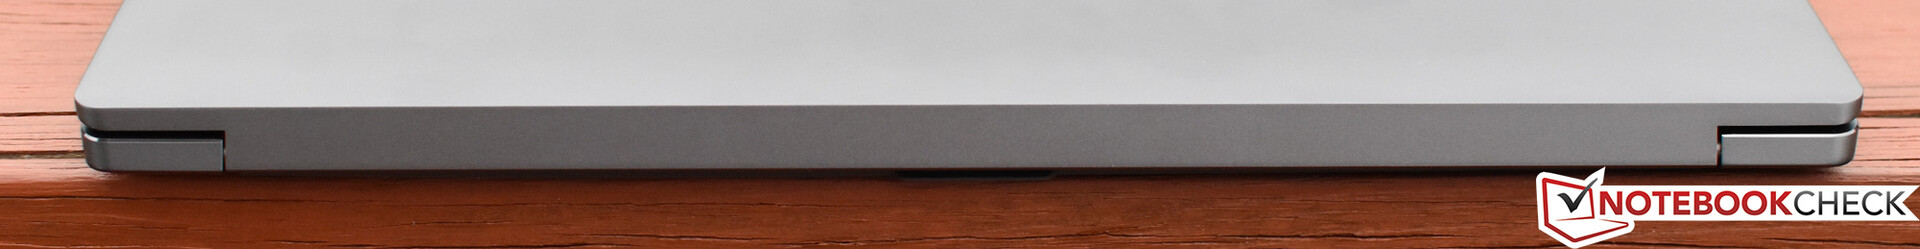
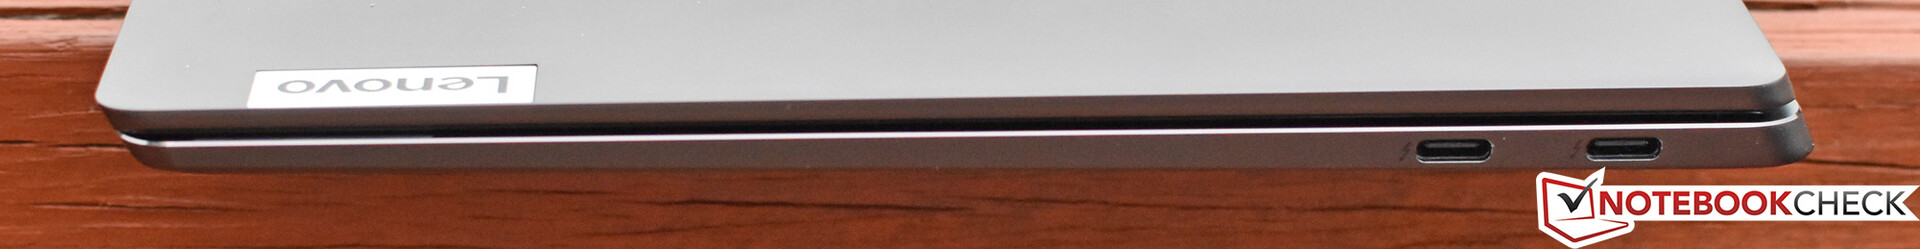
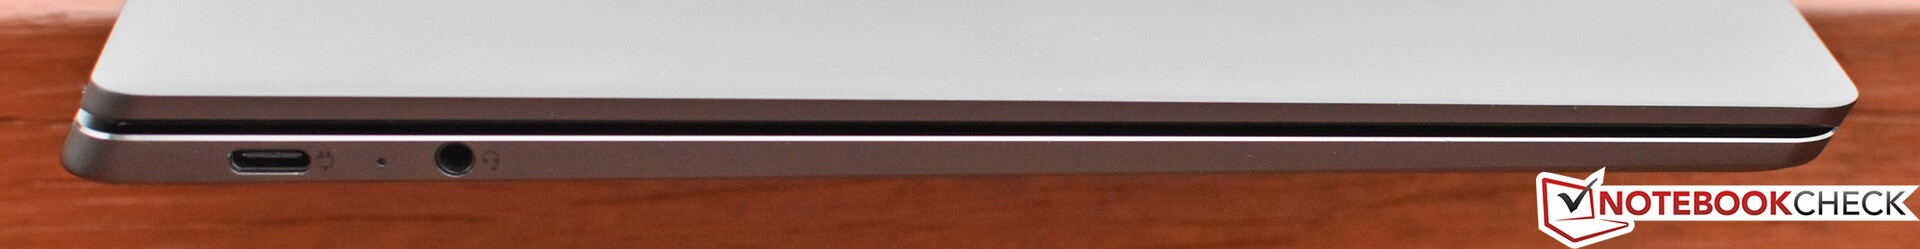
The first area in which compromise is evident is, unsurprisingly, that of port selection. As a result of the S940’s incredibly thin profile, only USB Type-C ports are present, though two of these are Thunderbolt 3 ports (either of which can also be used to charge the machine). The third is located on the opposite (right) edge of the laptop, and it’s accompanied downstream by a 3.5 mm combo audio jack—the only other port on the entire machine.
Communication
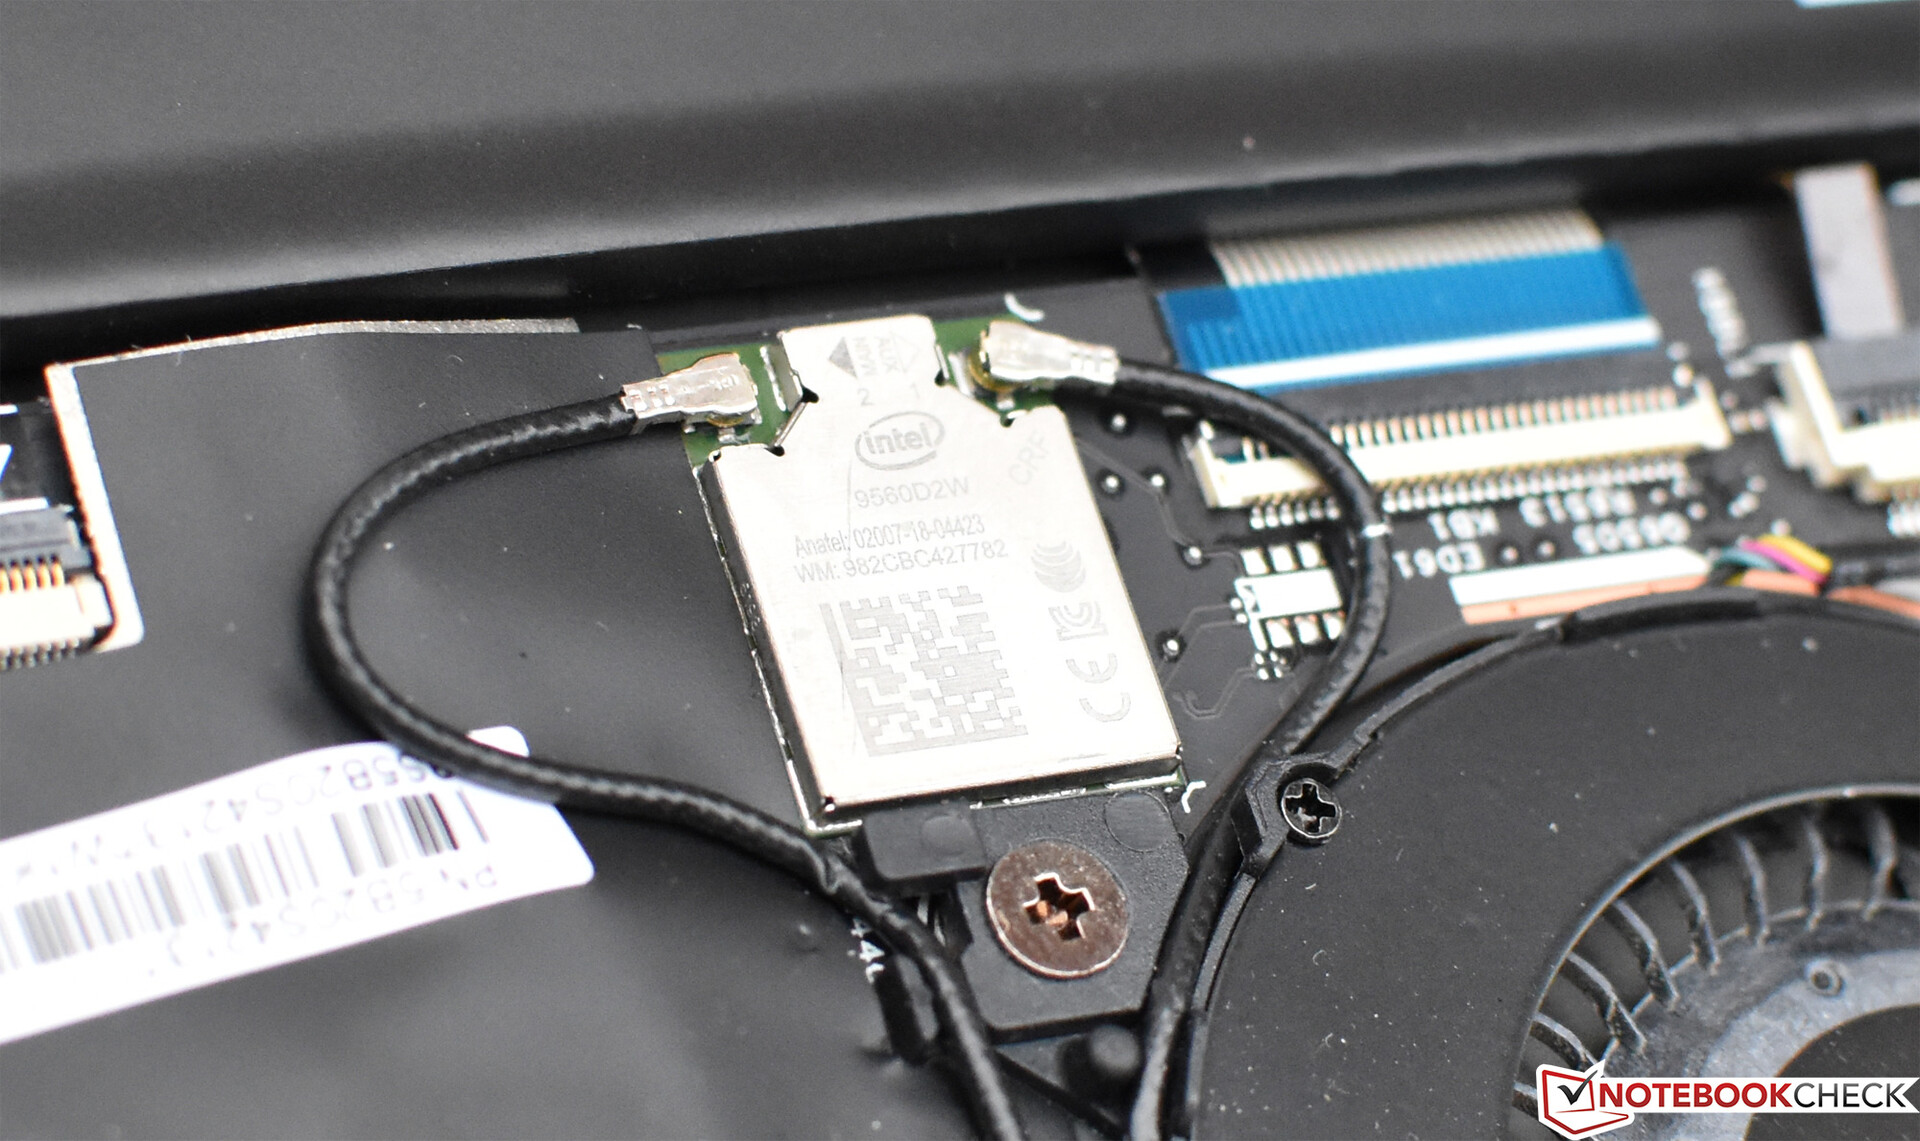
The S940 leverages an Intel Wireless-AC 9560 adapter (featuring Bluetooth 5.0) for its WLAN, and as usual, its performance is strong. We measure 652 Mb/s and 679 Mb/s receive/transmit in our tests, which places it near the top of our list and well above the average for the subnotebook class. Needless to say, there is no room for an Ethernet port on the device; if one is required, an adapter or dock is the only option.
Accessories
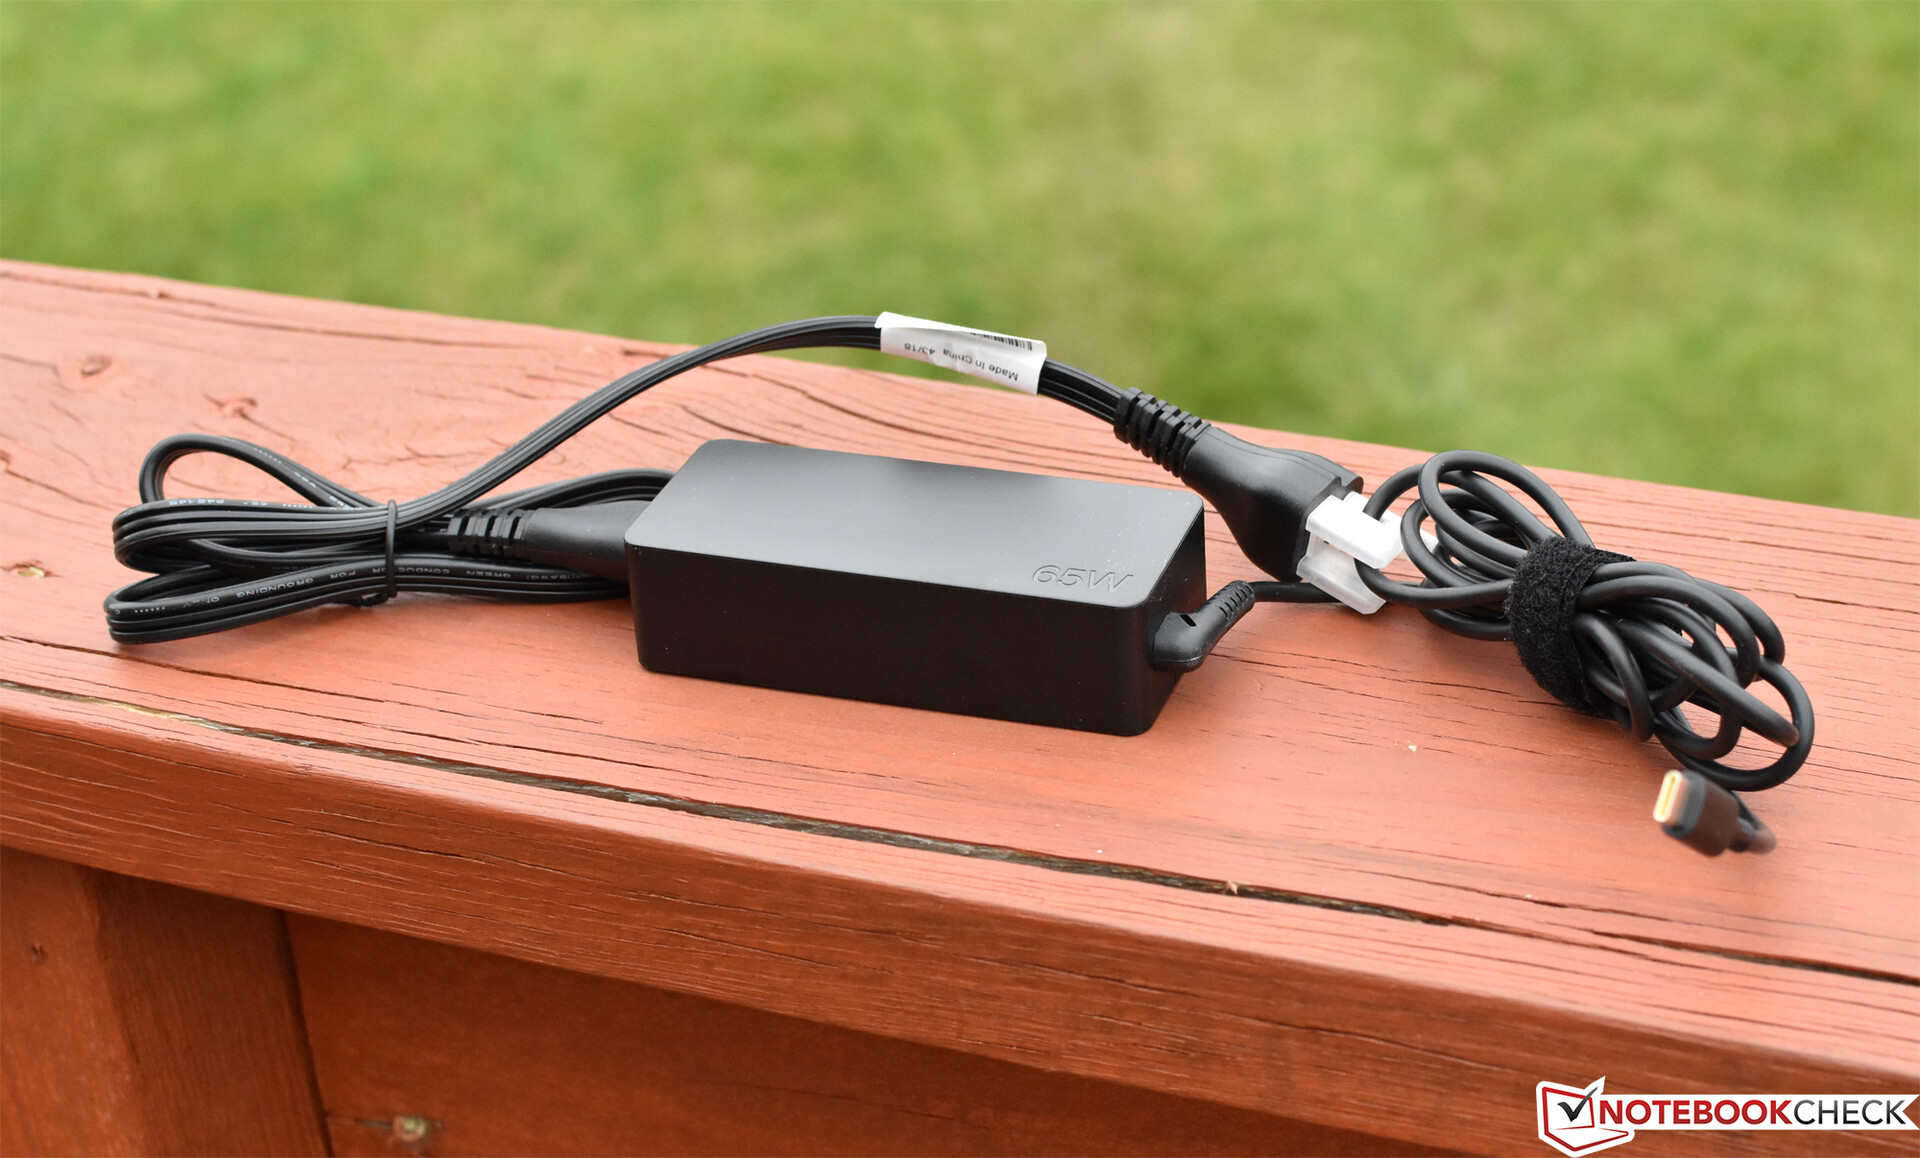
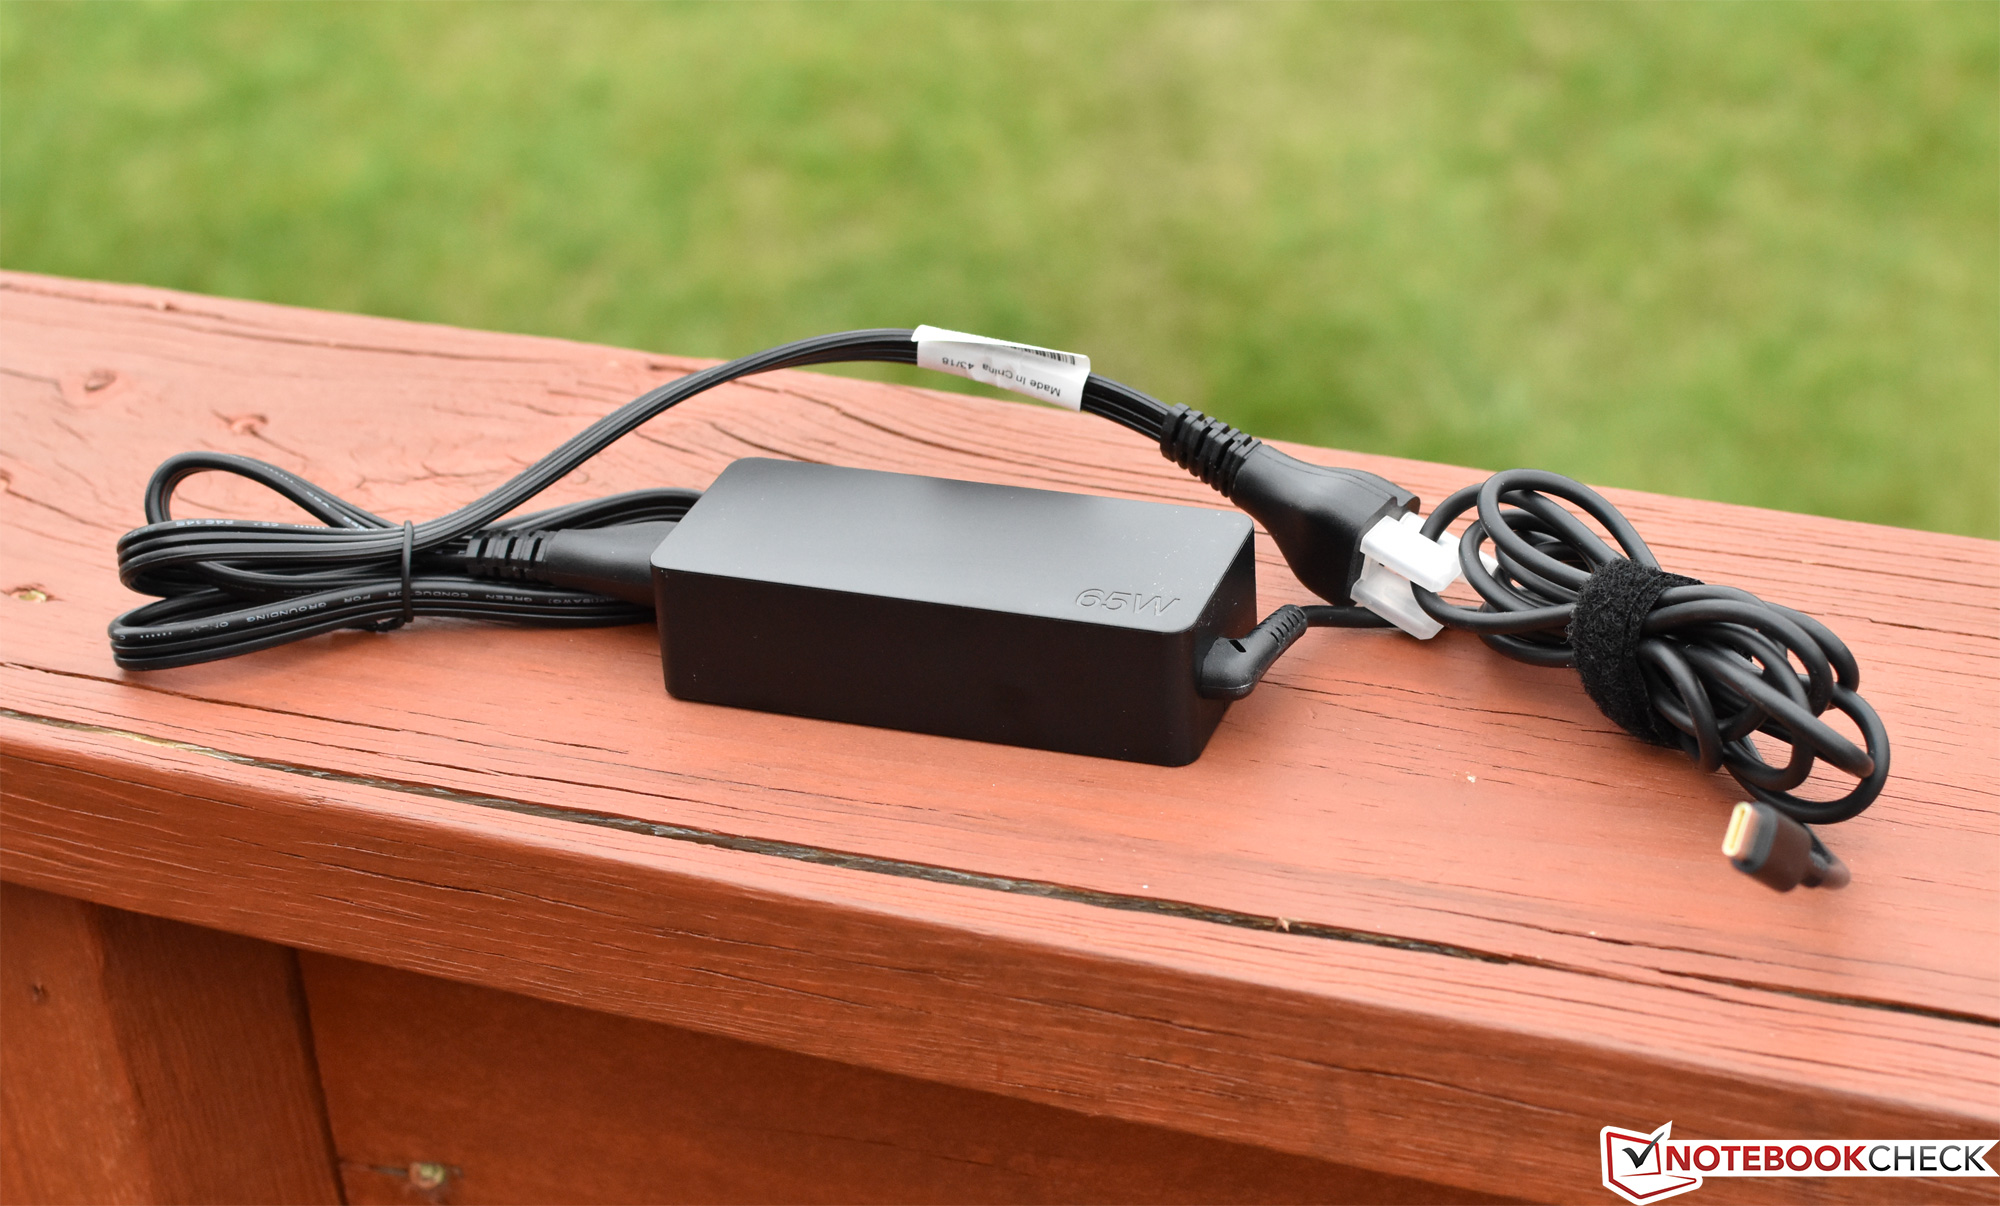
The 65 W USB-C power adapter weighs 304 g, and it’s the only accessory included with the S940.
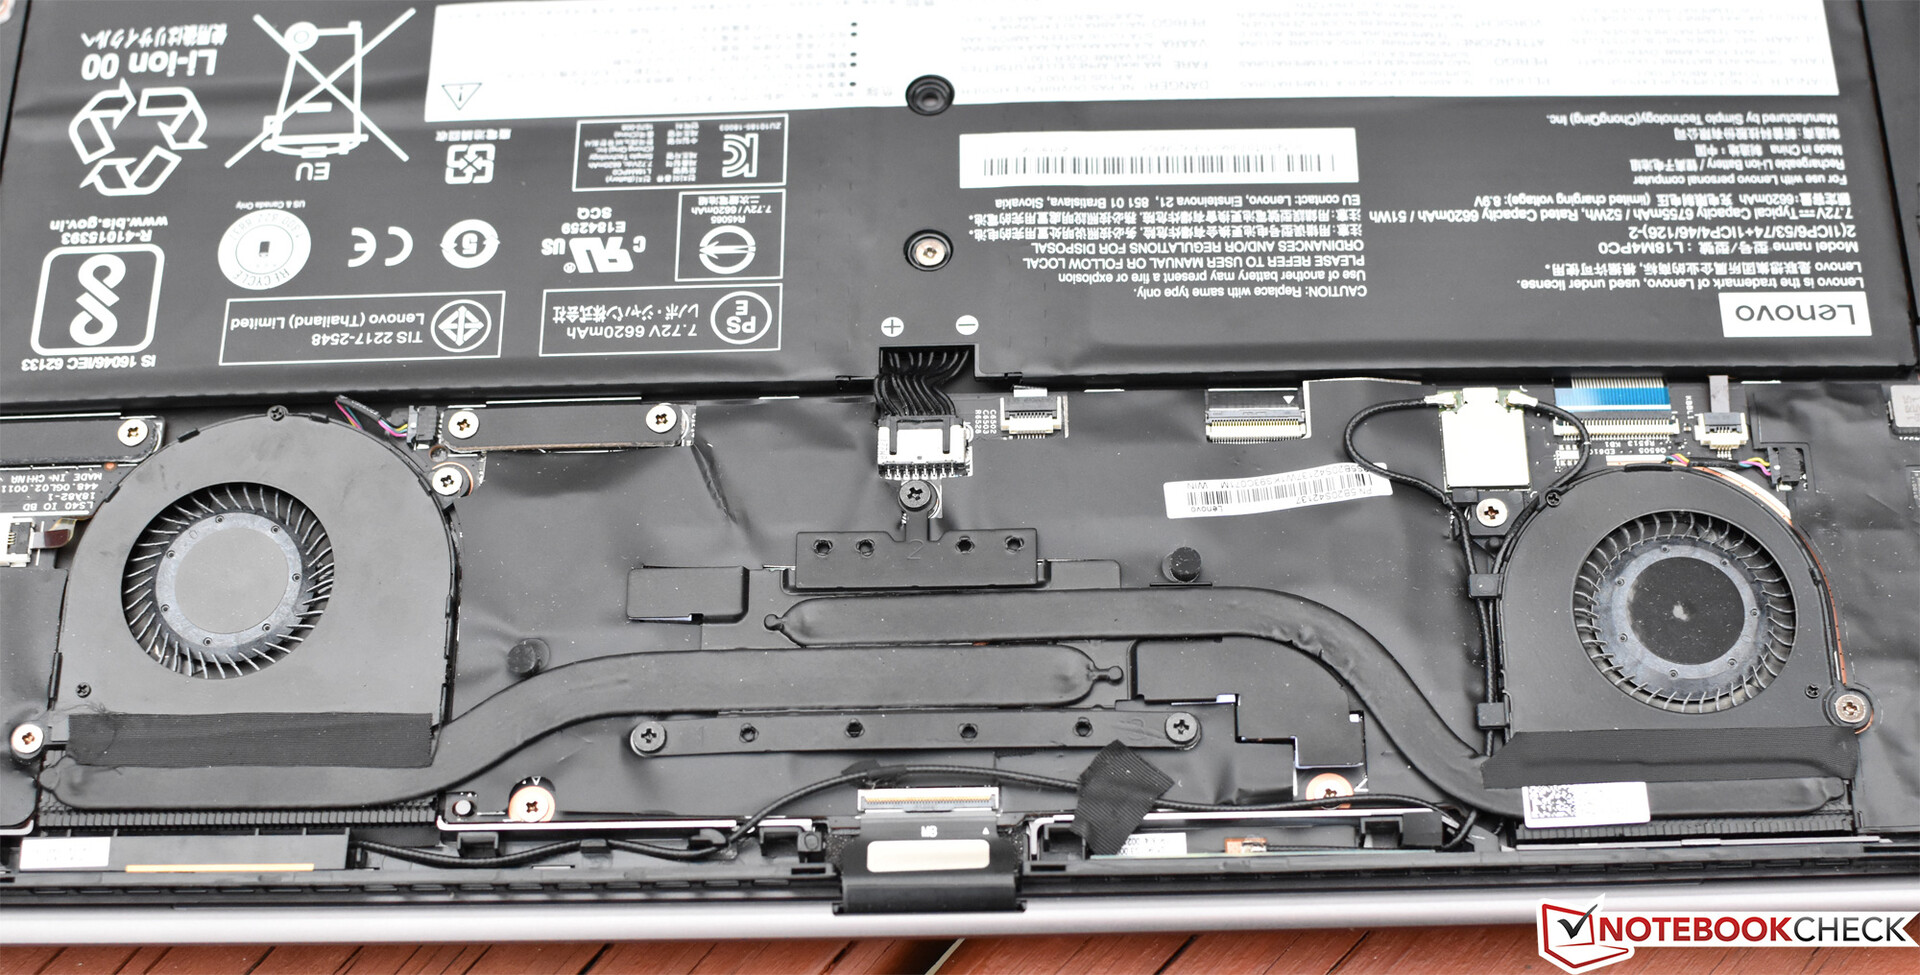
Maintenance
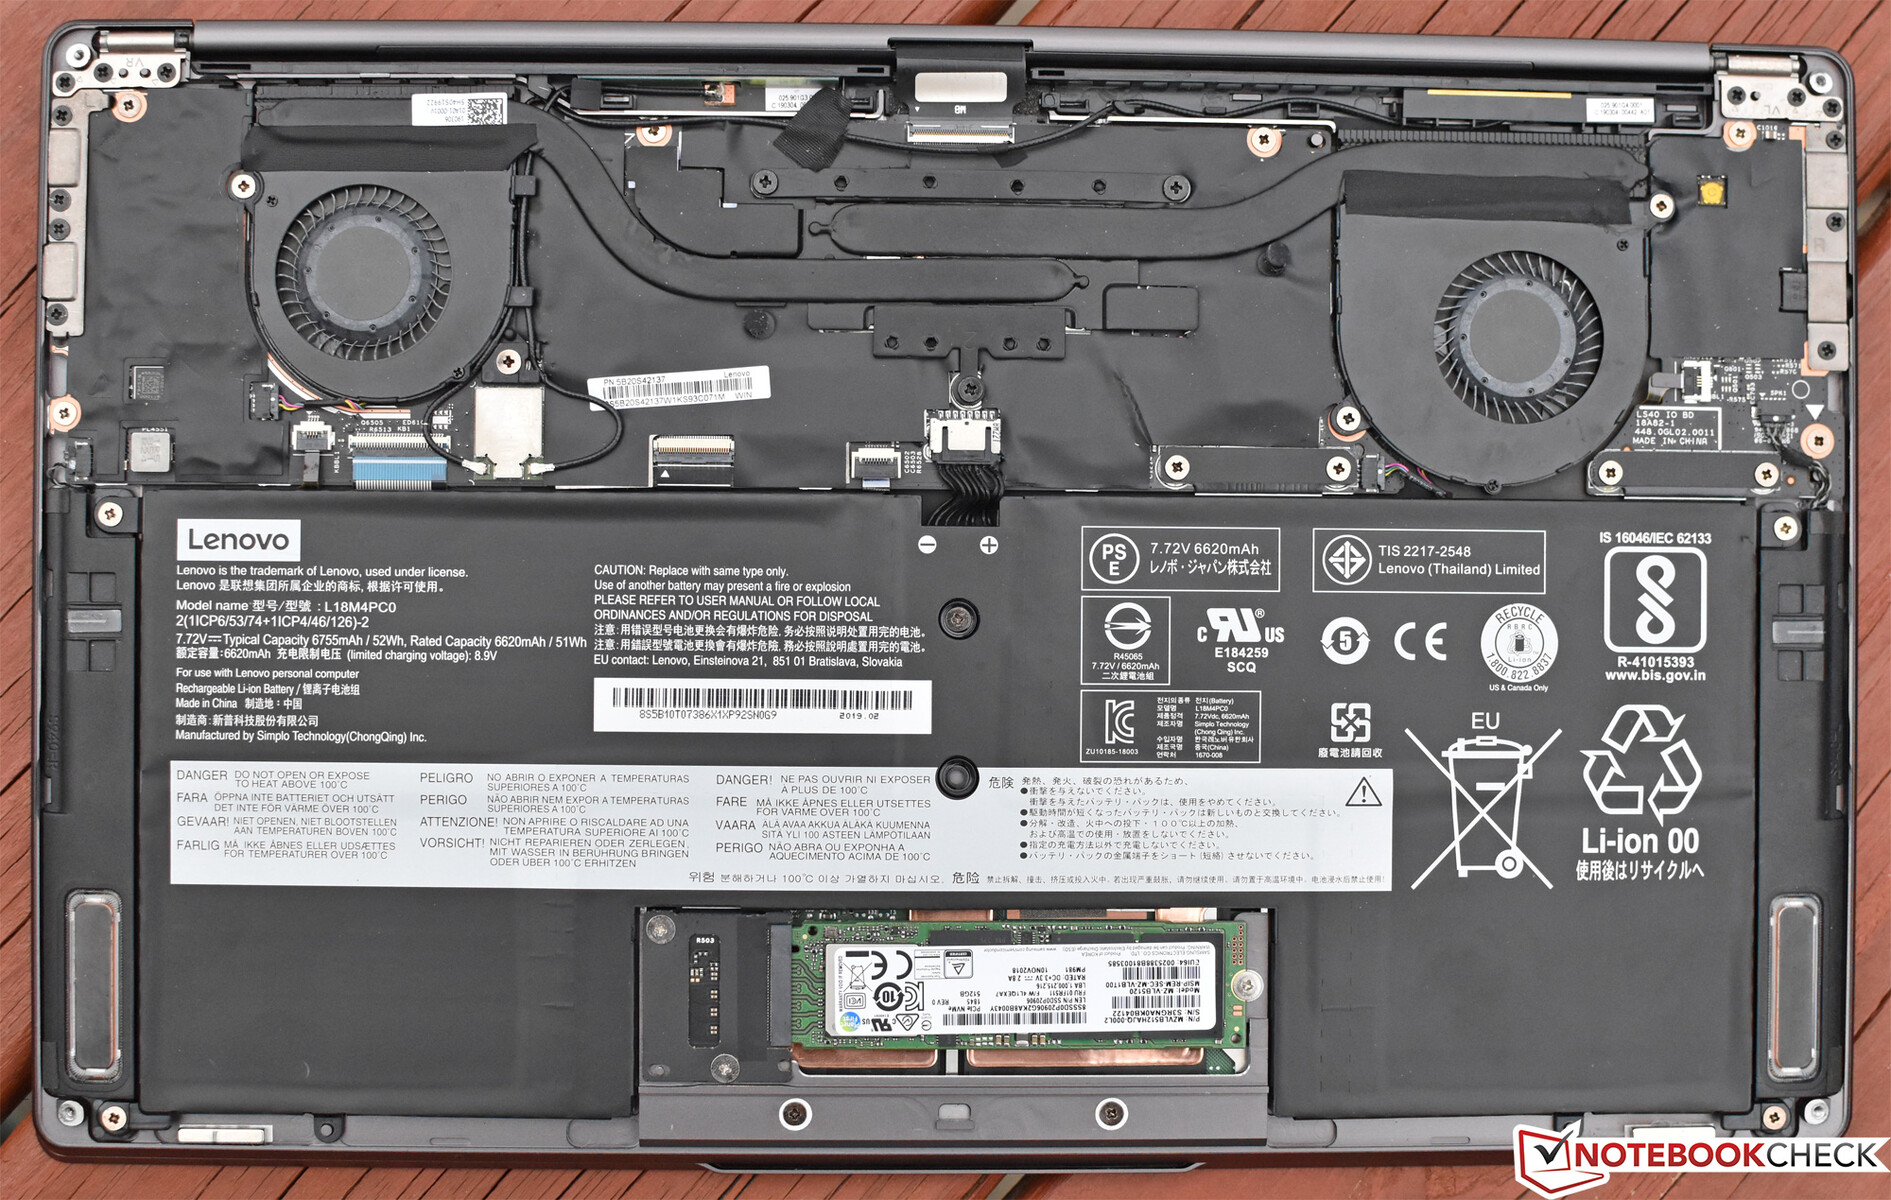
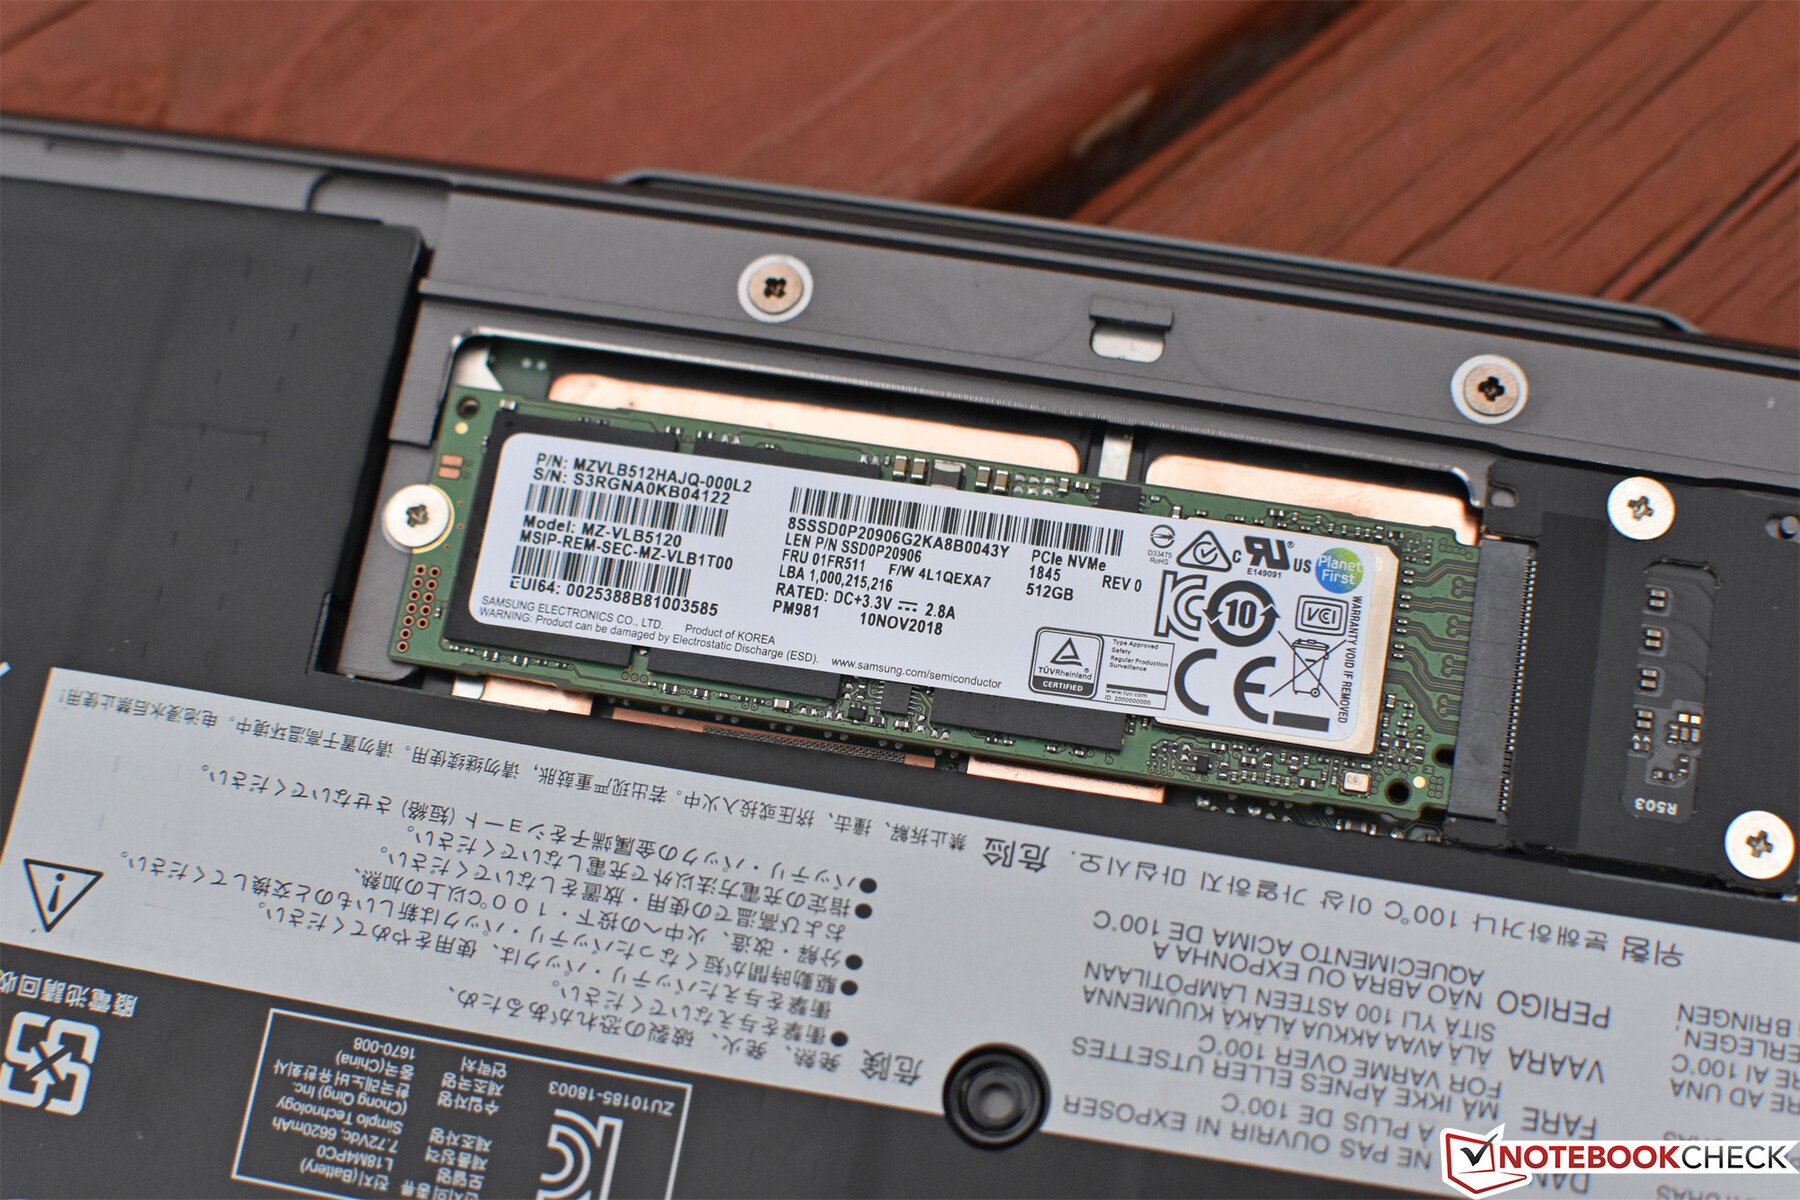
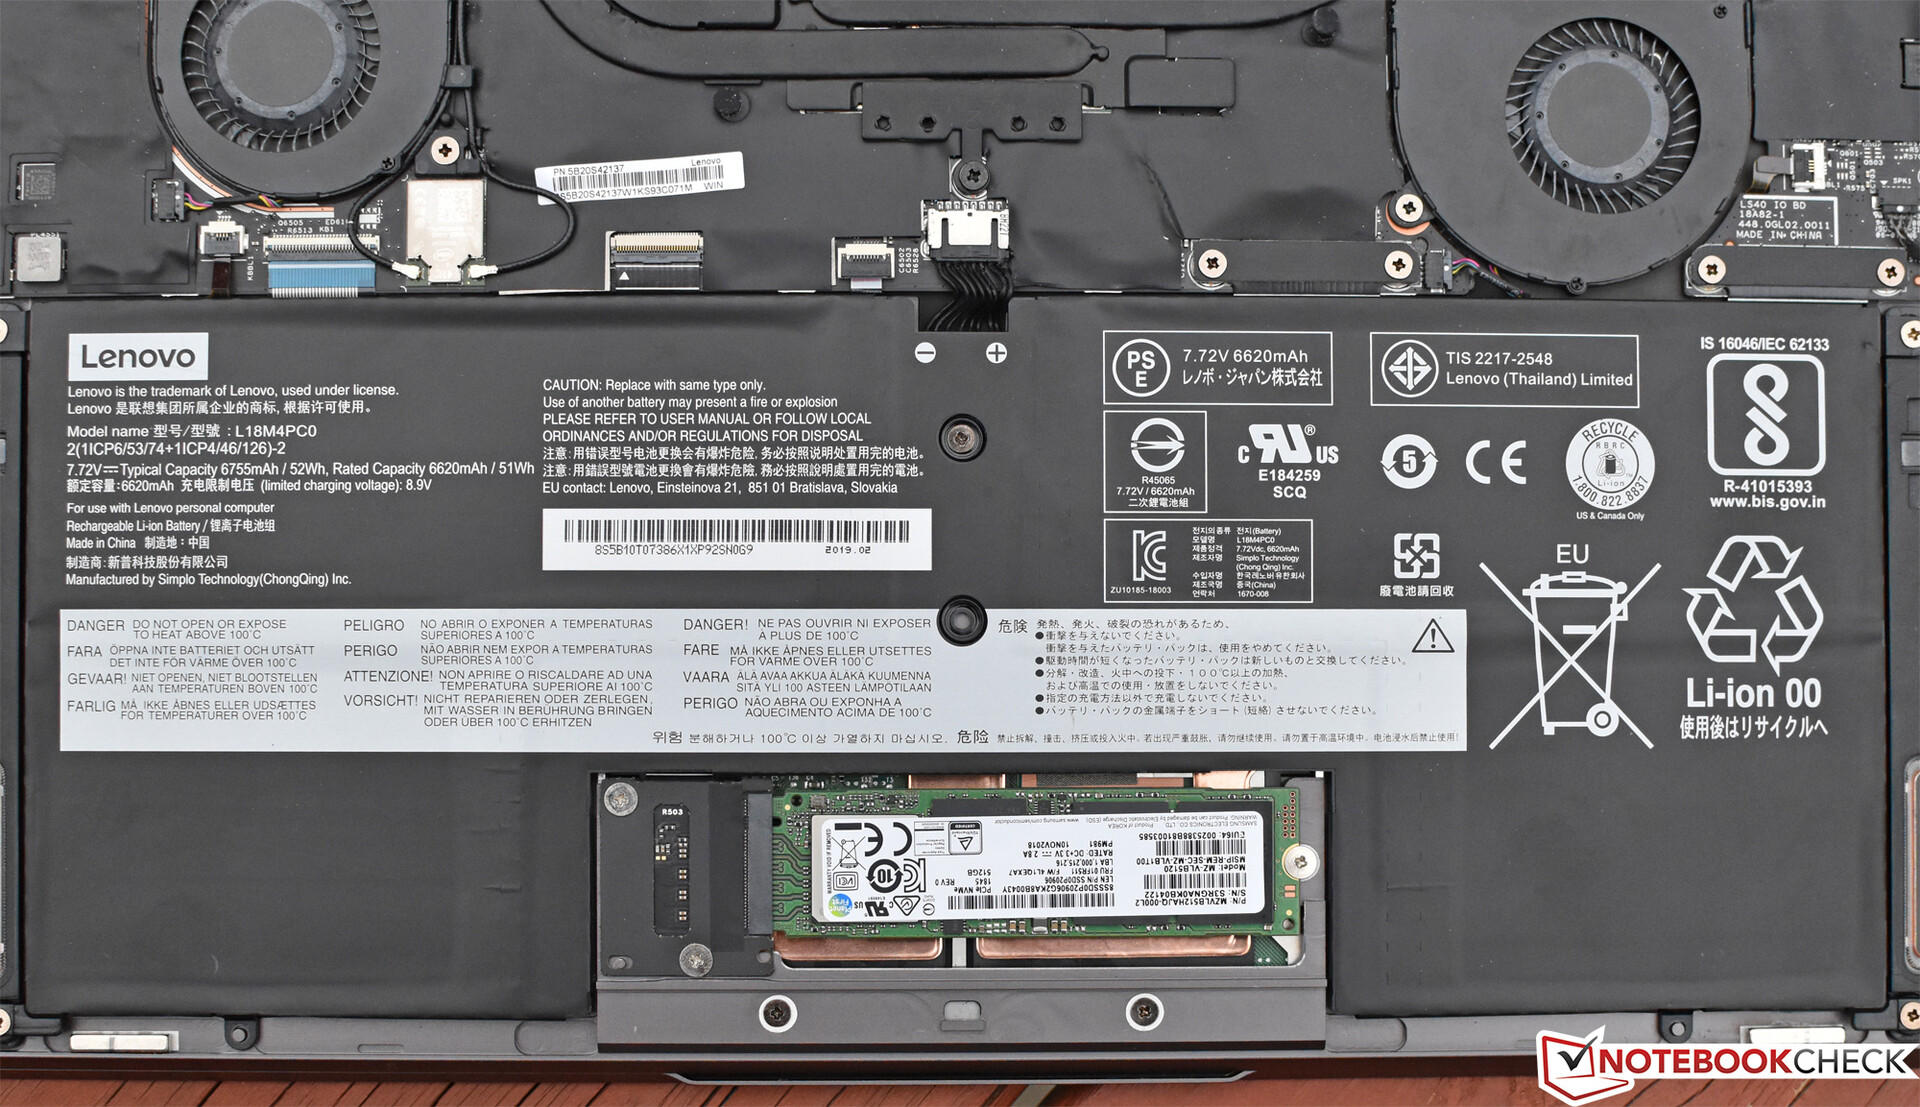
Apart from the choice of T5 Torx screws which secure the bottom cover (just four in total), maintenance is easy on the S940. Options for replaceable FRUs are obviously limited by the design, but users will be happy to hear that the M.2 SSD is fully accessible and replaceable, as well as the WLAN adapter, speakers, and battery. The RAM is soldered to the board and cannot be upgraded post-purchase.
Warranty
The IdeaPad S940 ships with a 1 year depot warranty. The warranty can be upgraded (as usual) to one of Lenovo’s other options, which include longer terms and on-site service.
Input Devices
Keyboard
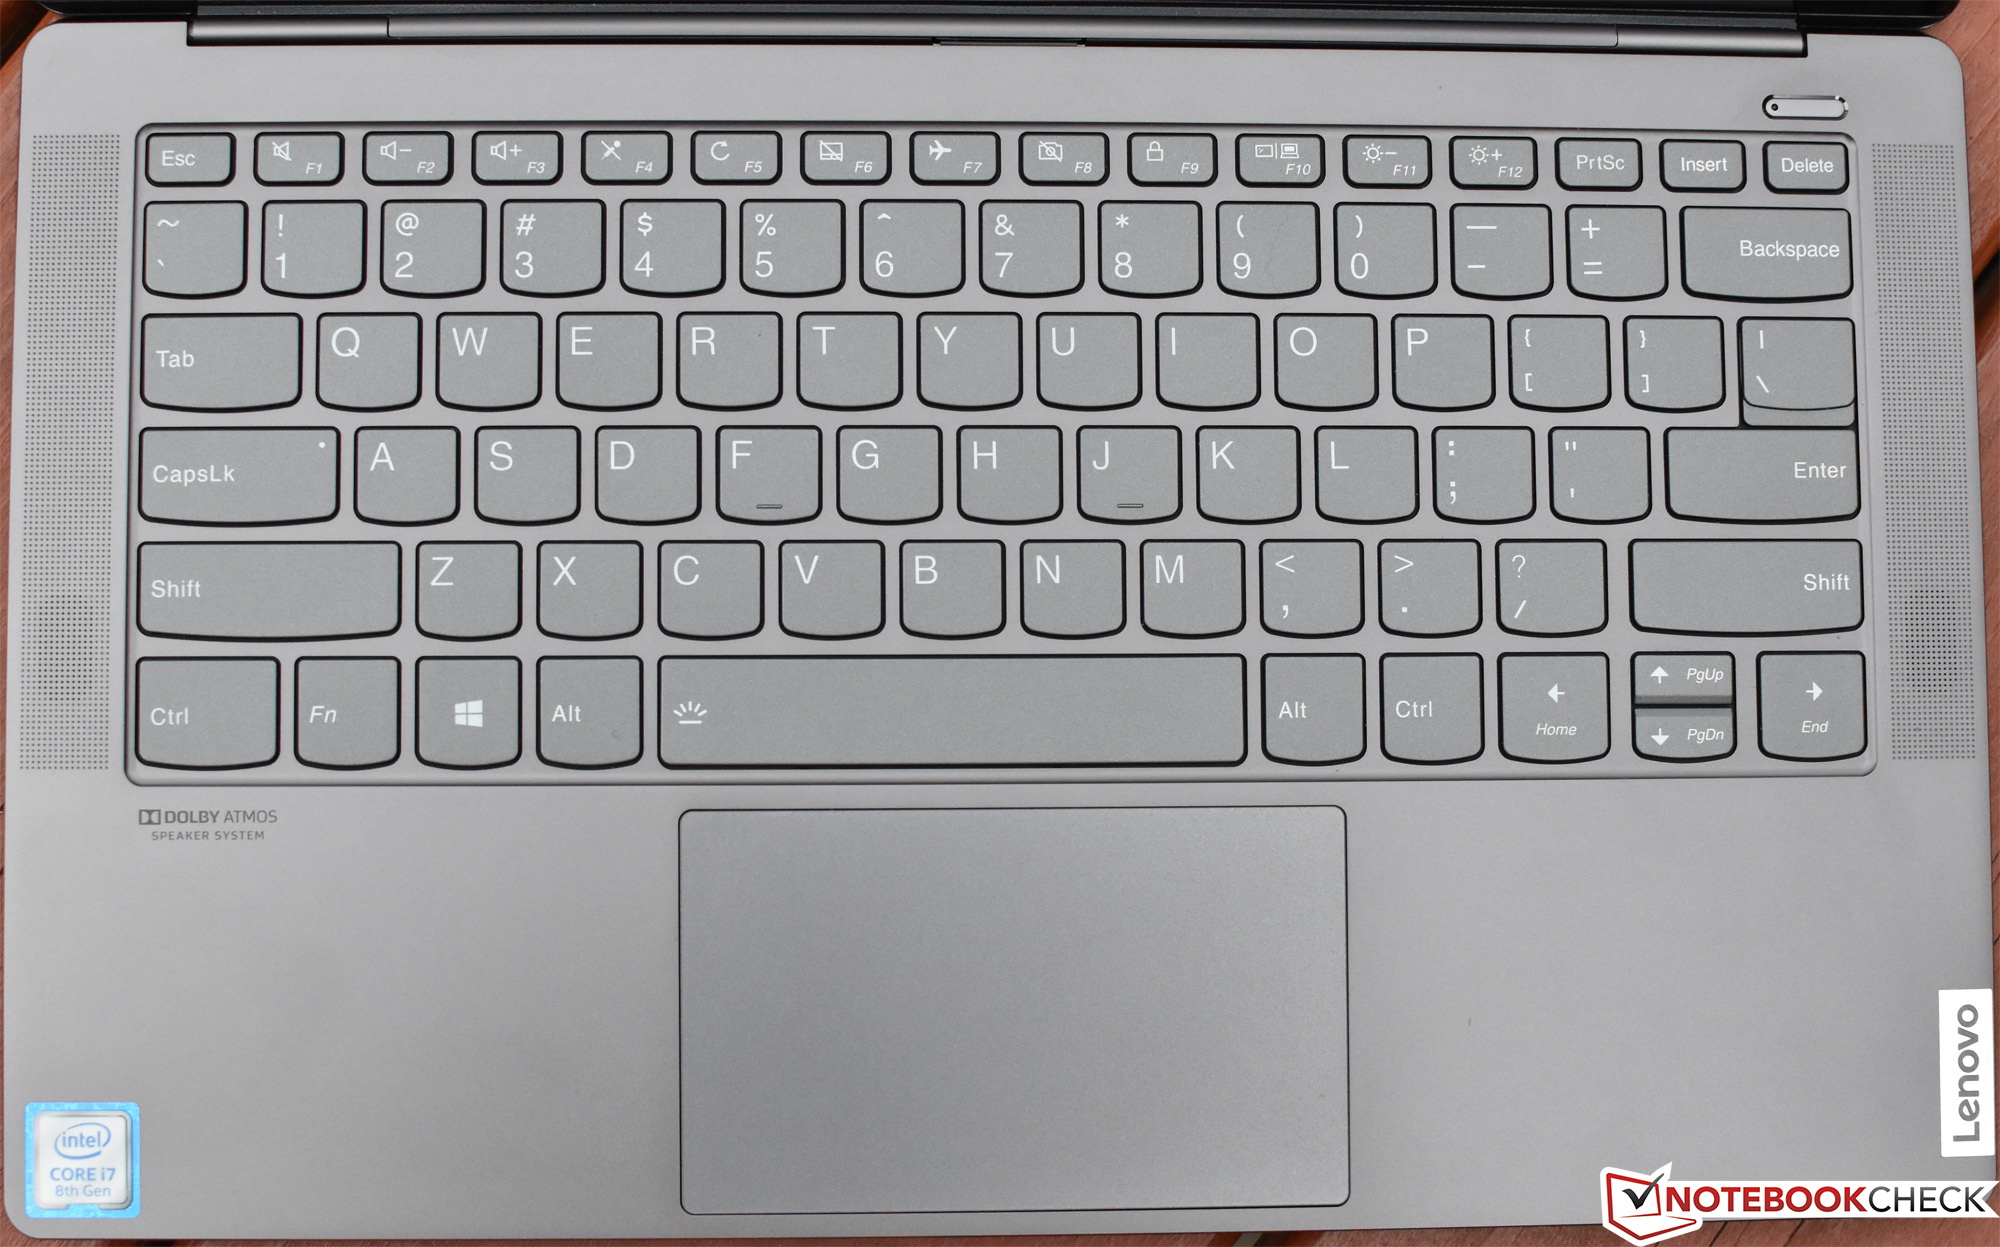
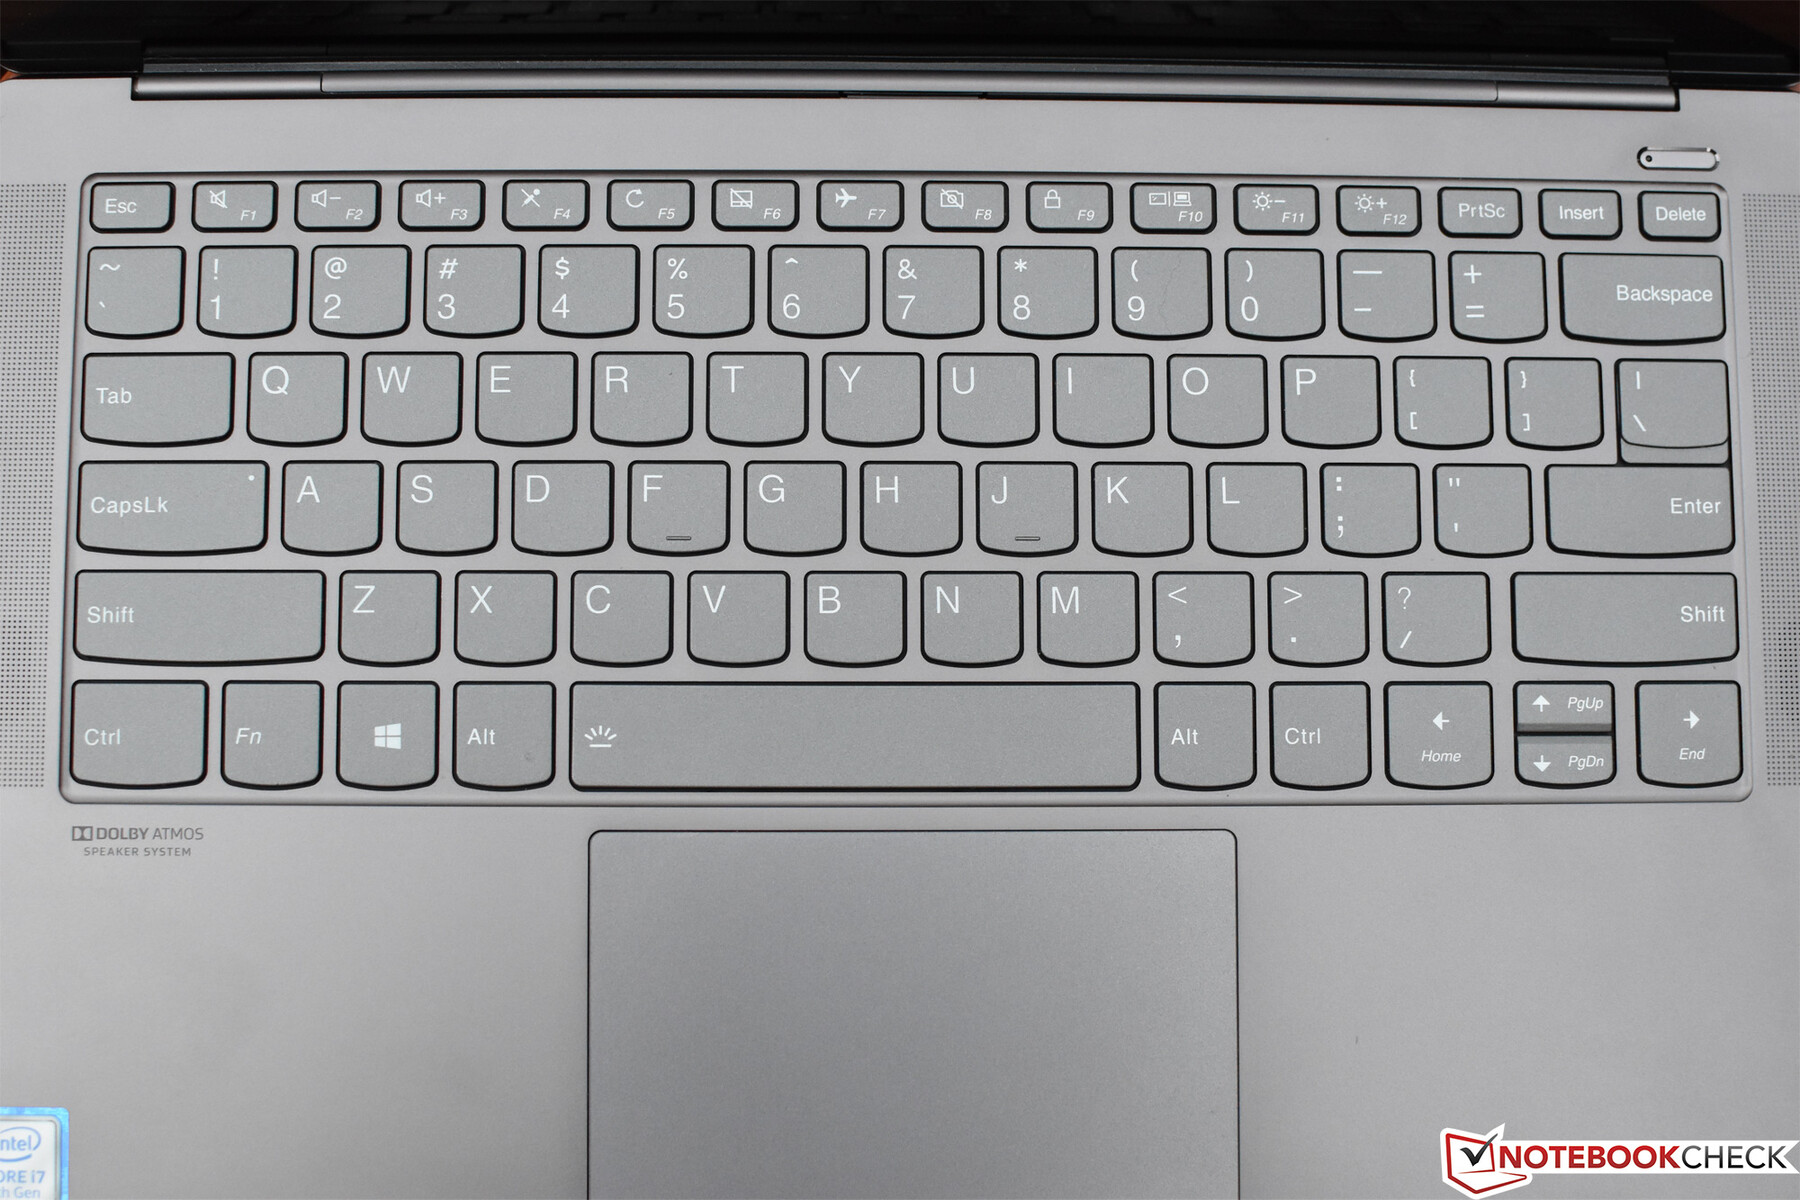
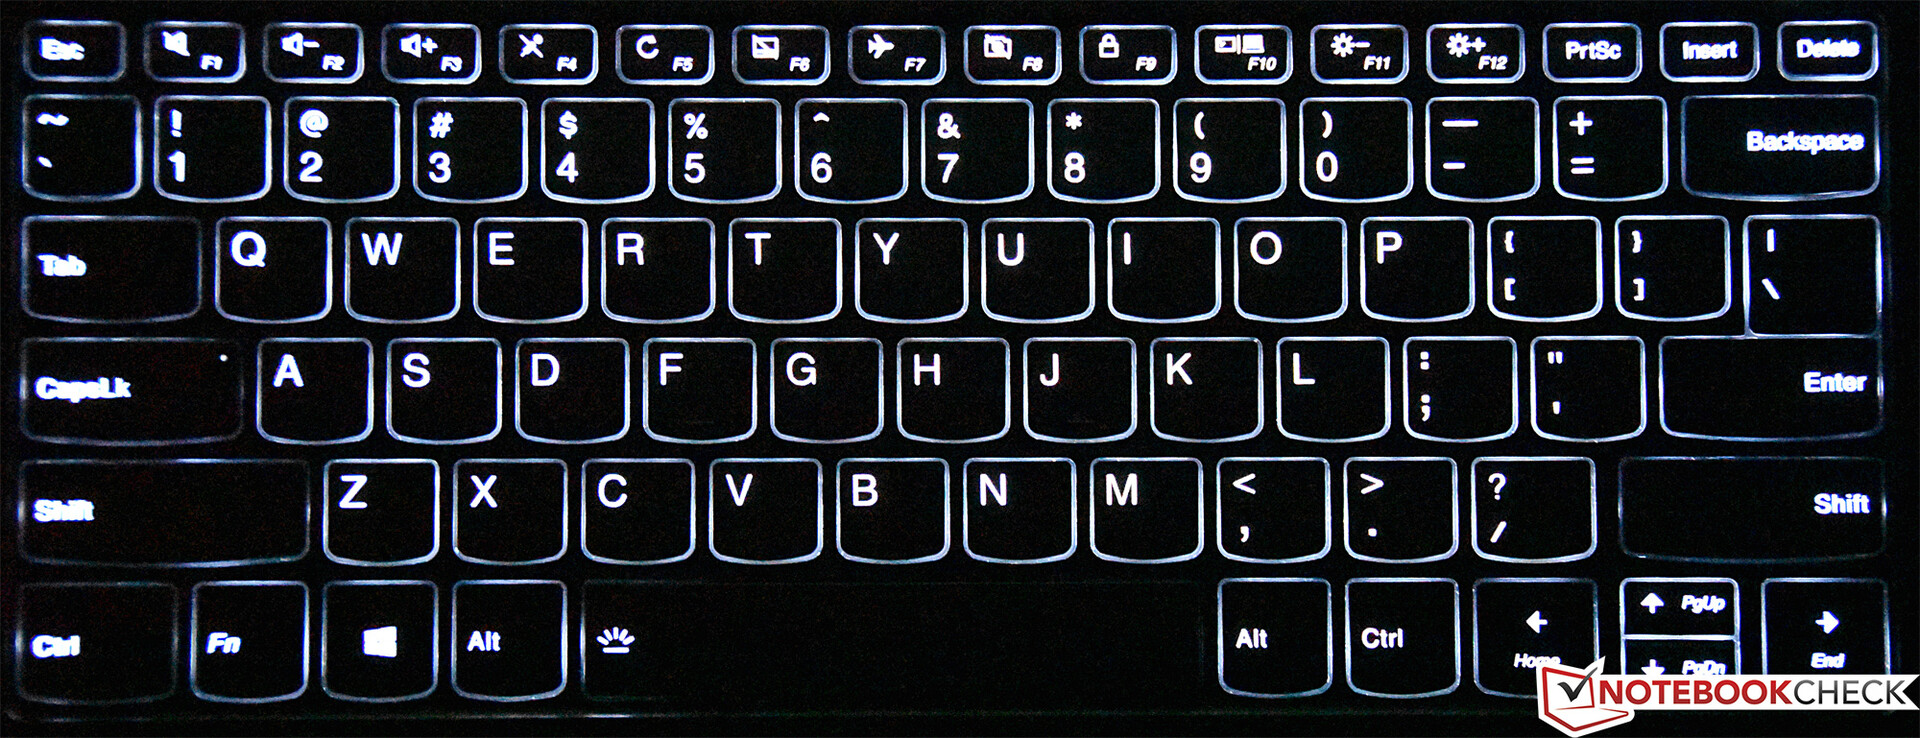
The chiclet keyboard is overall quite good, though travel is very short (as expected). Feedback is well-tuned, however, providing a good sense of certainty for keystrokes, and actuation force is comfortable. Spacing and layout is also familiar; the only real negative here is the small vertical arrow keys and the PgUp/PgDown/Home/End buttons configured as alternate functions.
The keyboard is backlit with two configurable levels of brightness. Key visibility in bright environments is decent, but thanks to the white lettering on the (dark-ish) grey background, it could be better.
Touchpad
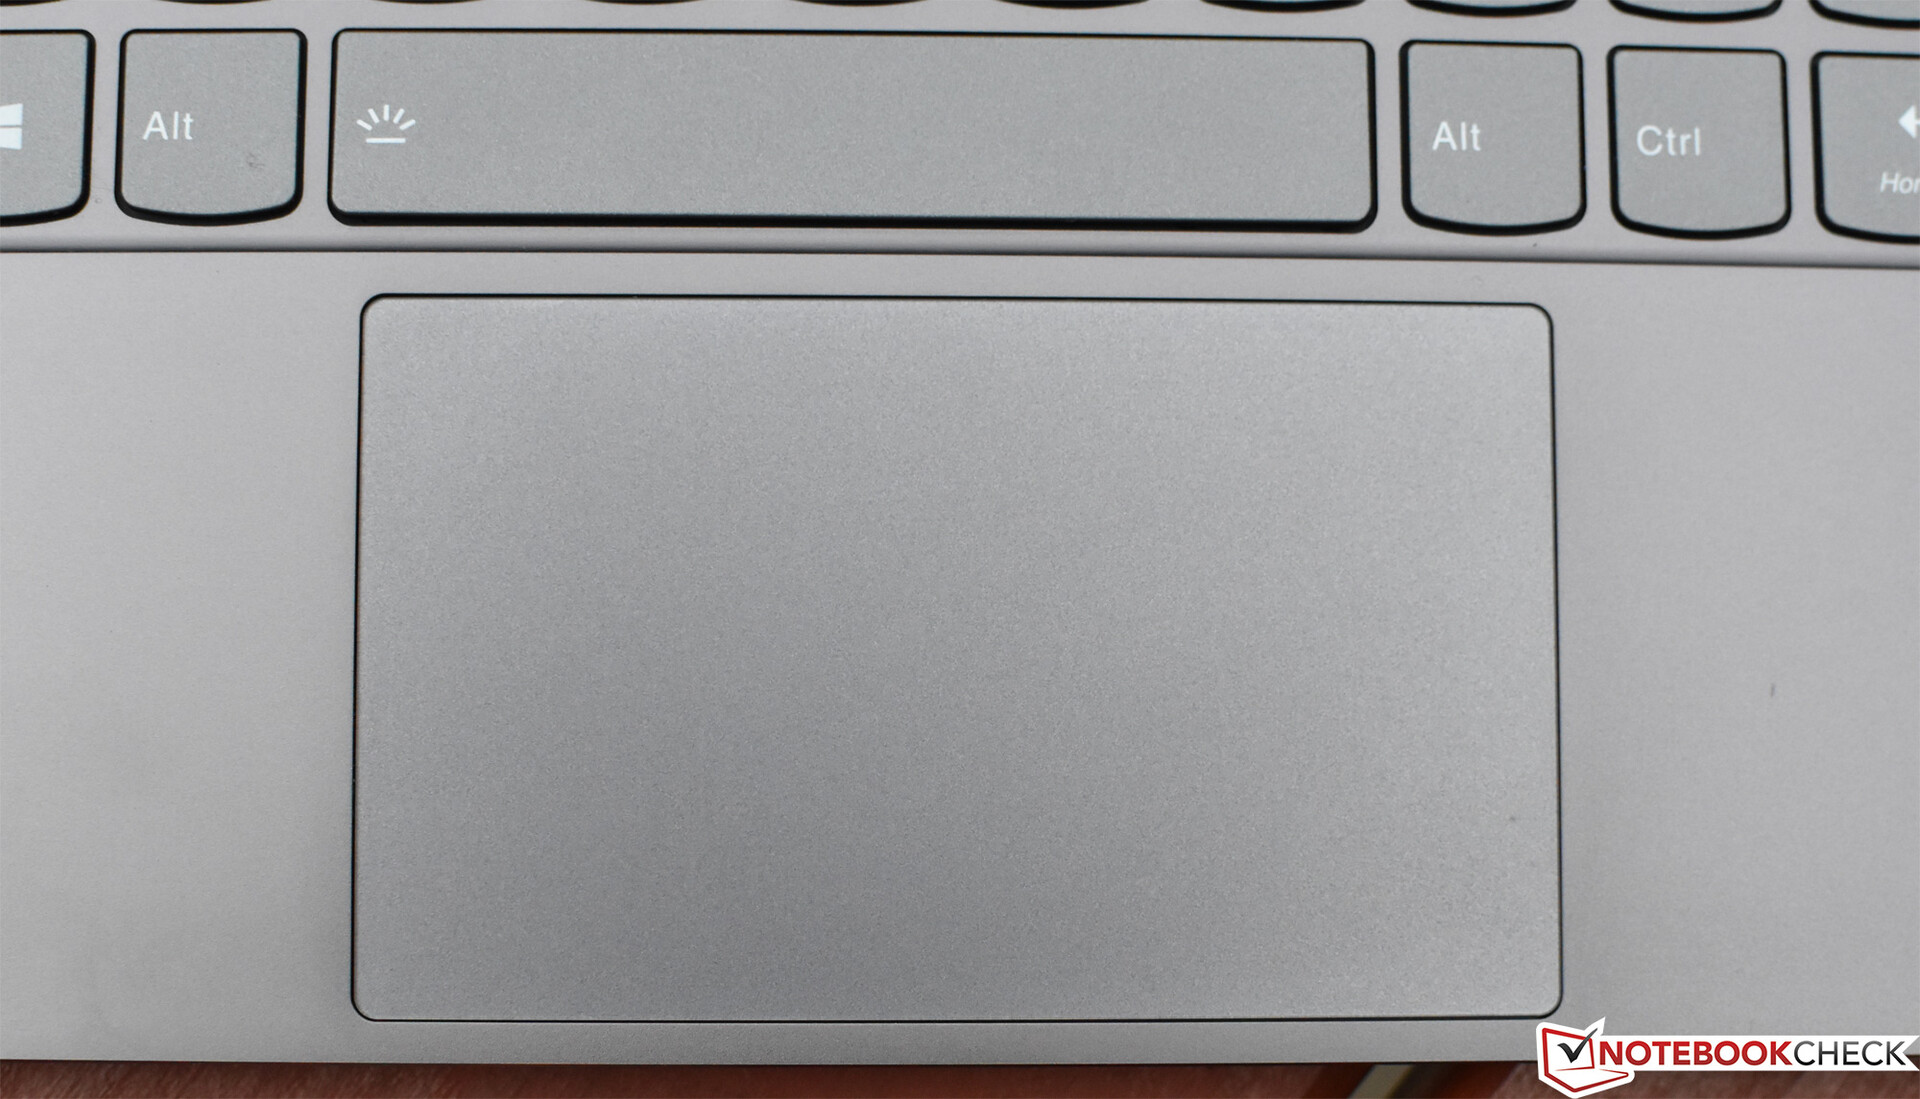
The Microsoft Precision touchpad seems sufficiently large at 105 mm x 52 mm, and it features a smooth glass surface for effortless operation. The integrated buttons—always a bit of a sticking point—are also quite good, with medium actuation required and a palpable sense of feedback. Drag/drop is relatively easy, also—for a clickpad.
Display
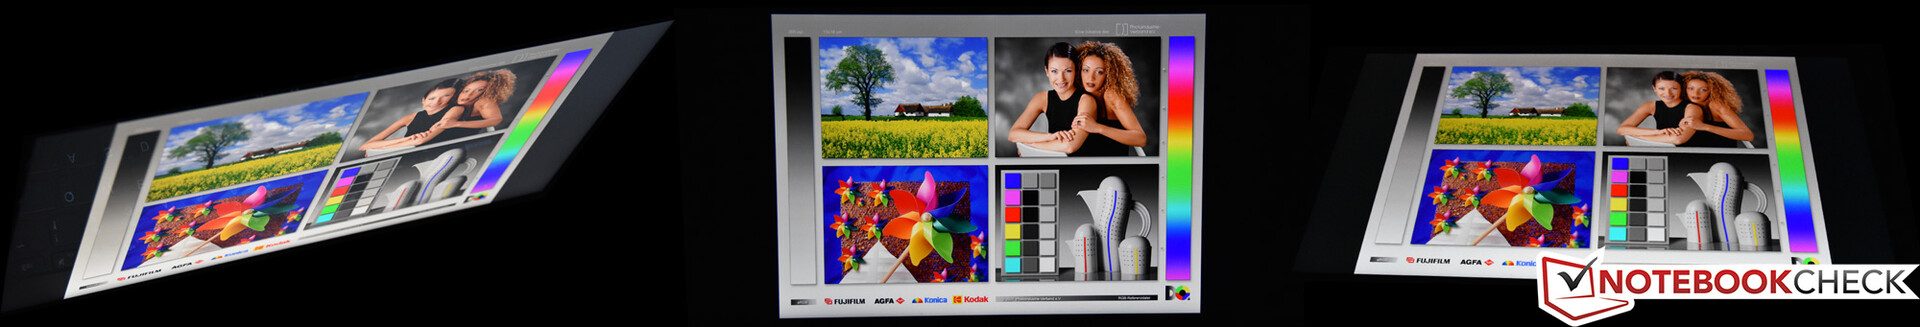
Without a doubt, the S940’s 4K HDR display is one of its most impressive features. It’s not only uncommonly bright (Lenovo quotes 500 nits), but it features subjectively rich color and contrast to boot. The curved glass at the edges doesn’t cover any portion of the actual panel (just the bezel surrounding it), so unlike (for instance) Samsung’s Galaxy phones, there’s no obstructive reflection imposed by the geometry. The top-end display we’re reviewing today is Dolby Vision capable and meets the VESA400 HDR standard. Lenovo says it “can decode a full 12-bit PQ signal from a video and intelligently map that content to the capabilities of the display to produce the best picture.” During our time watching sample content streaming on Netflix, the difference certainly does seem tangible.
It's not the only option, however: on “lower-end” models (such as the $1,499 starting configuration), an FHD display (400 nit brightness, according to Lenovo) is standard. Both displays are glossy. As is usually the case, the lower-resolution display (also with its lower brightness) should also save some energy, which might come in handy (as we’ll see during the battery tests in a bit). Oddly enough, there is no touchscreen option available.
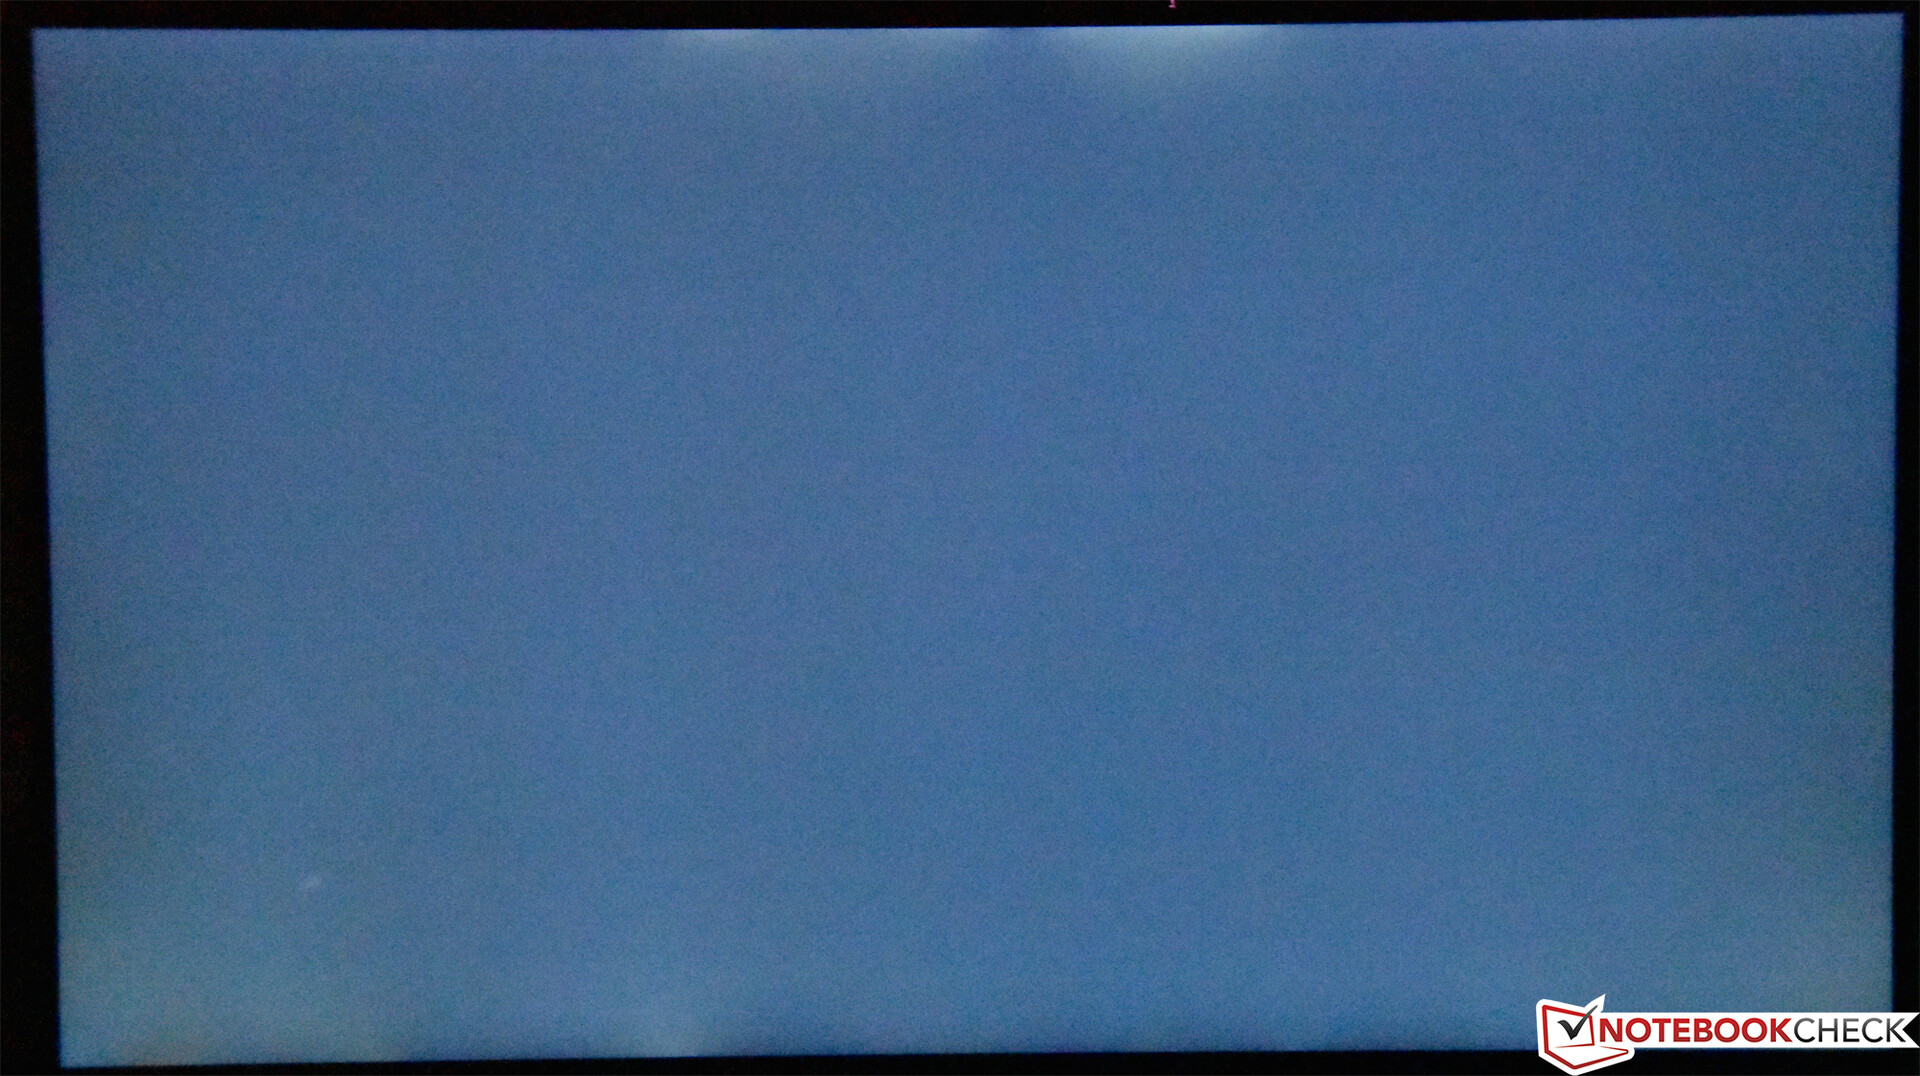
We didn’t notice any significant backlight bleed on dark screens, but there is some minor bleed detectable along the top and bottom edges (pictured below).
| |||||||||||||||||||||||||
Brightness Distribution: 83 %
Center on Battery: 594.5 cd/m²
Contrast: 1383:1 (Black: 0.43 cd/m²)
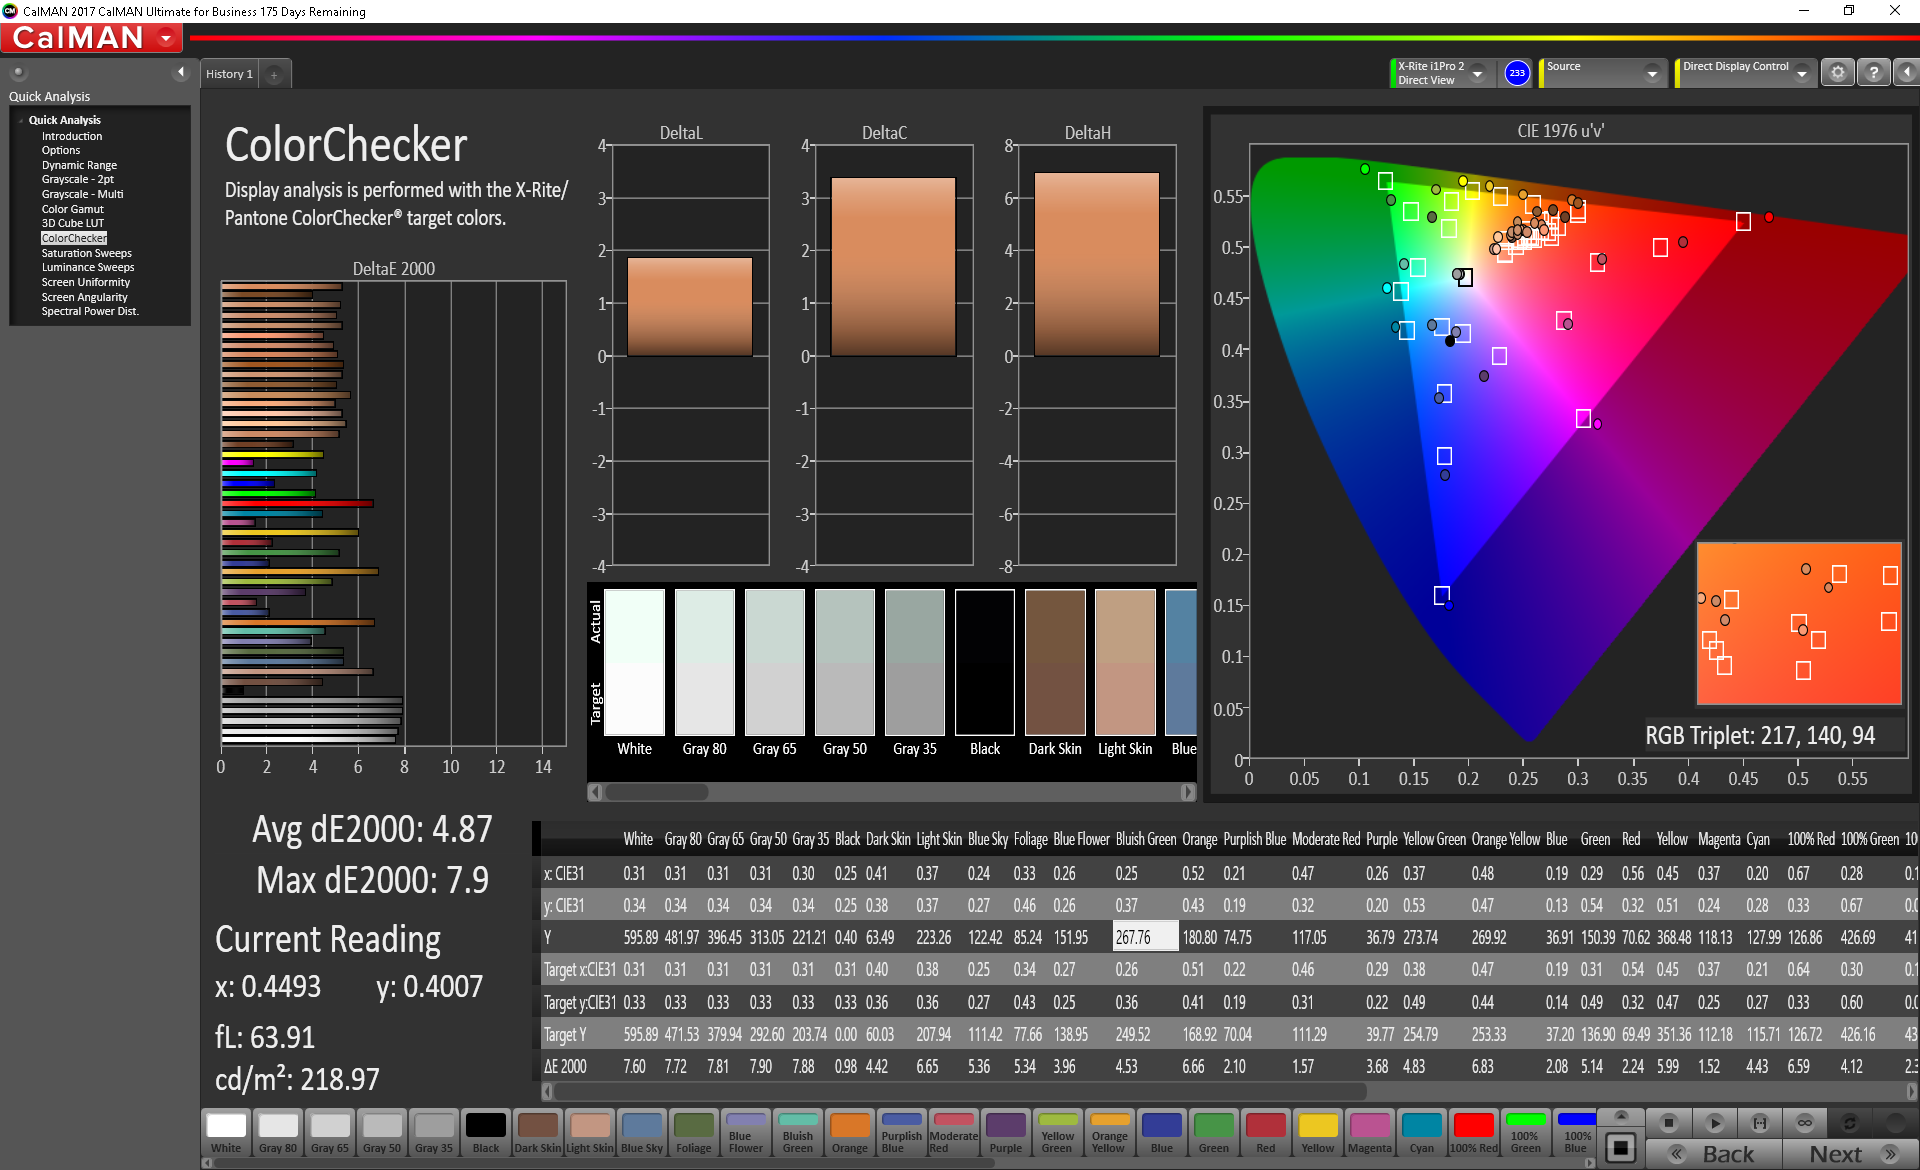
ΔE ColorChecker Calman: 4.87 | ∀{0.5-29.43 Ø4.76}
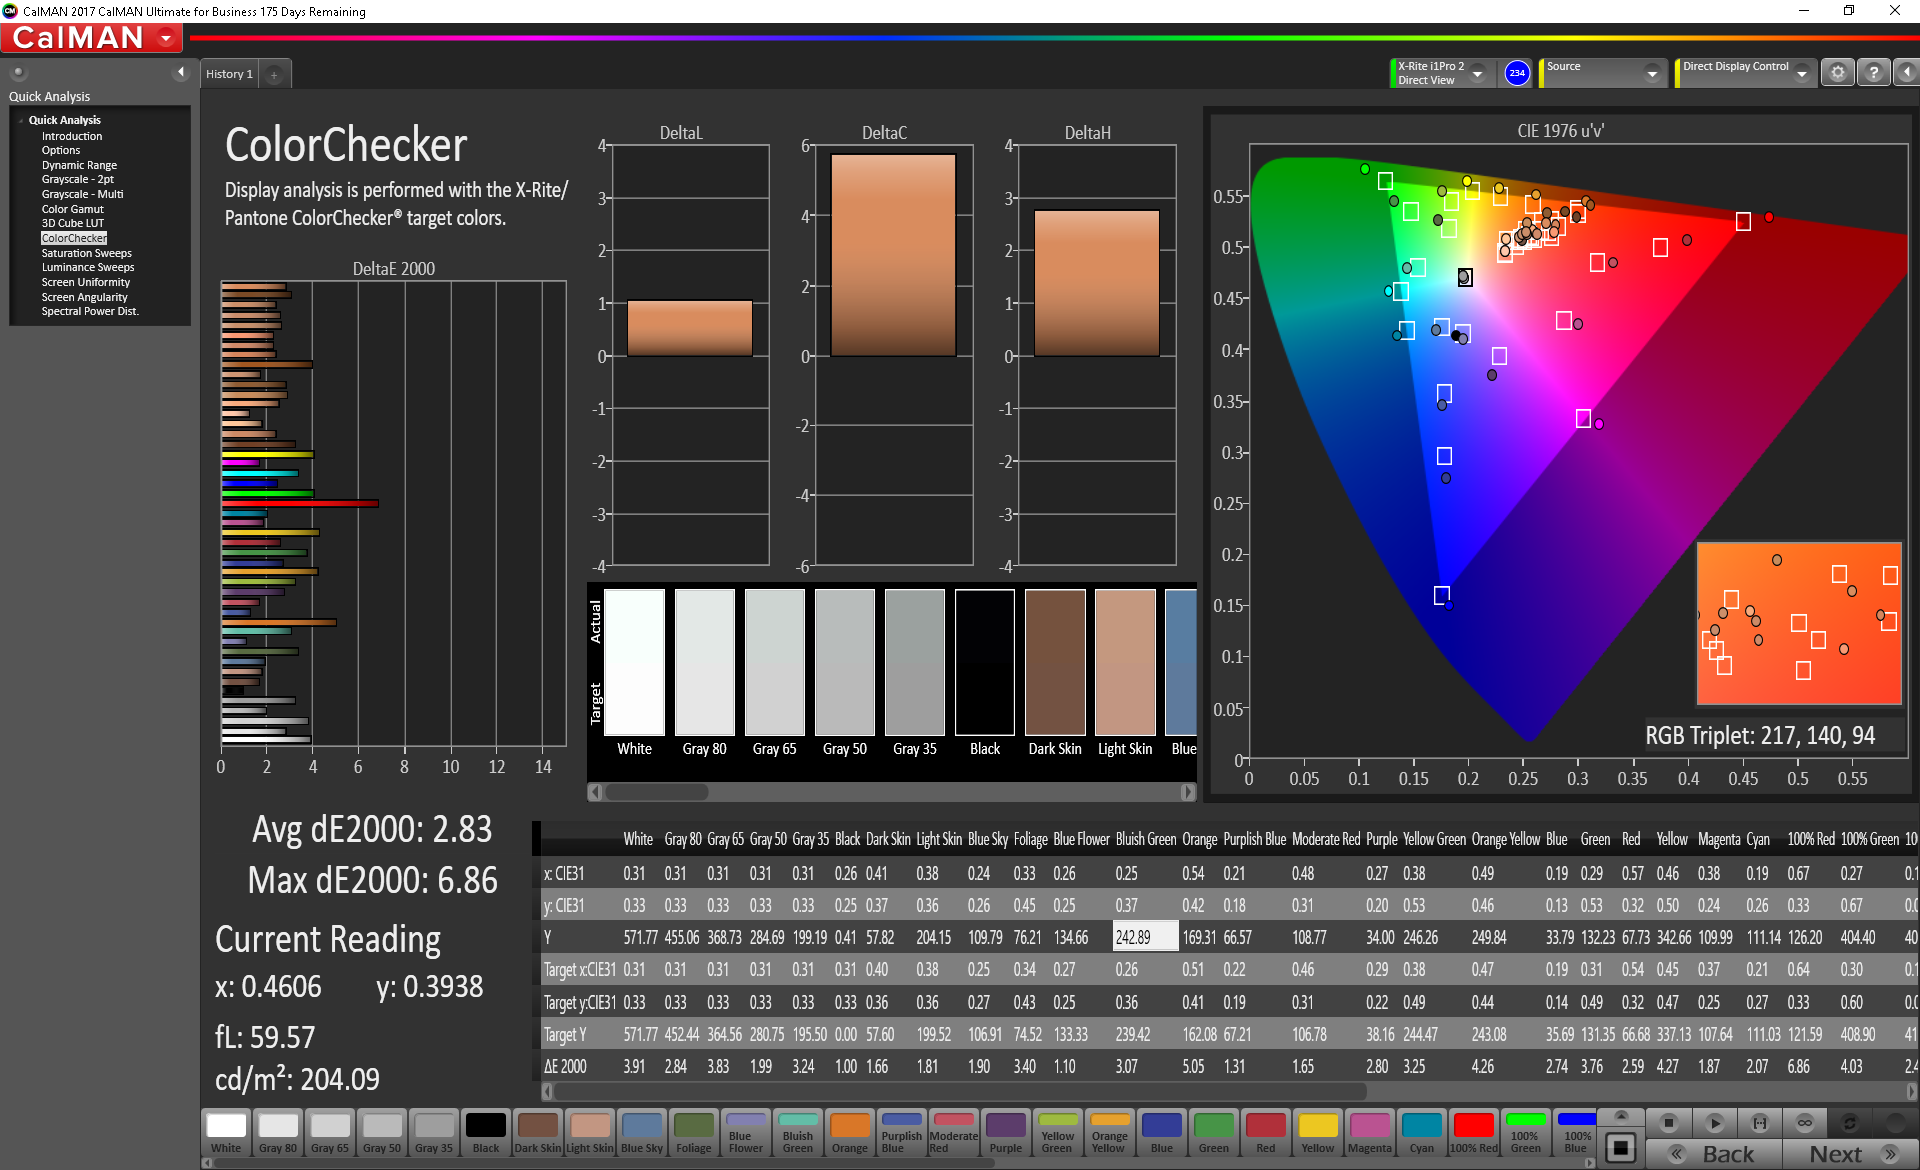
calibrated: 2.83
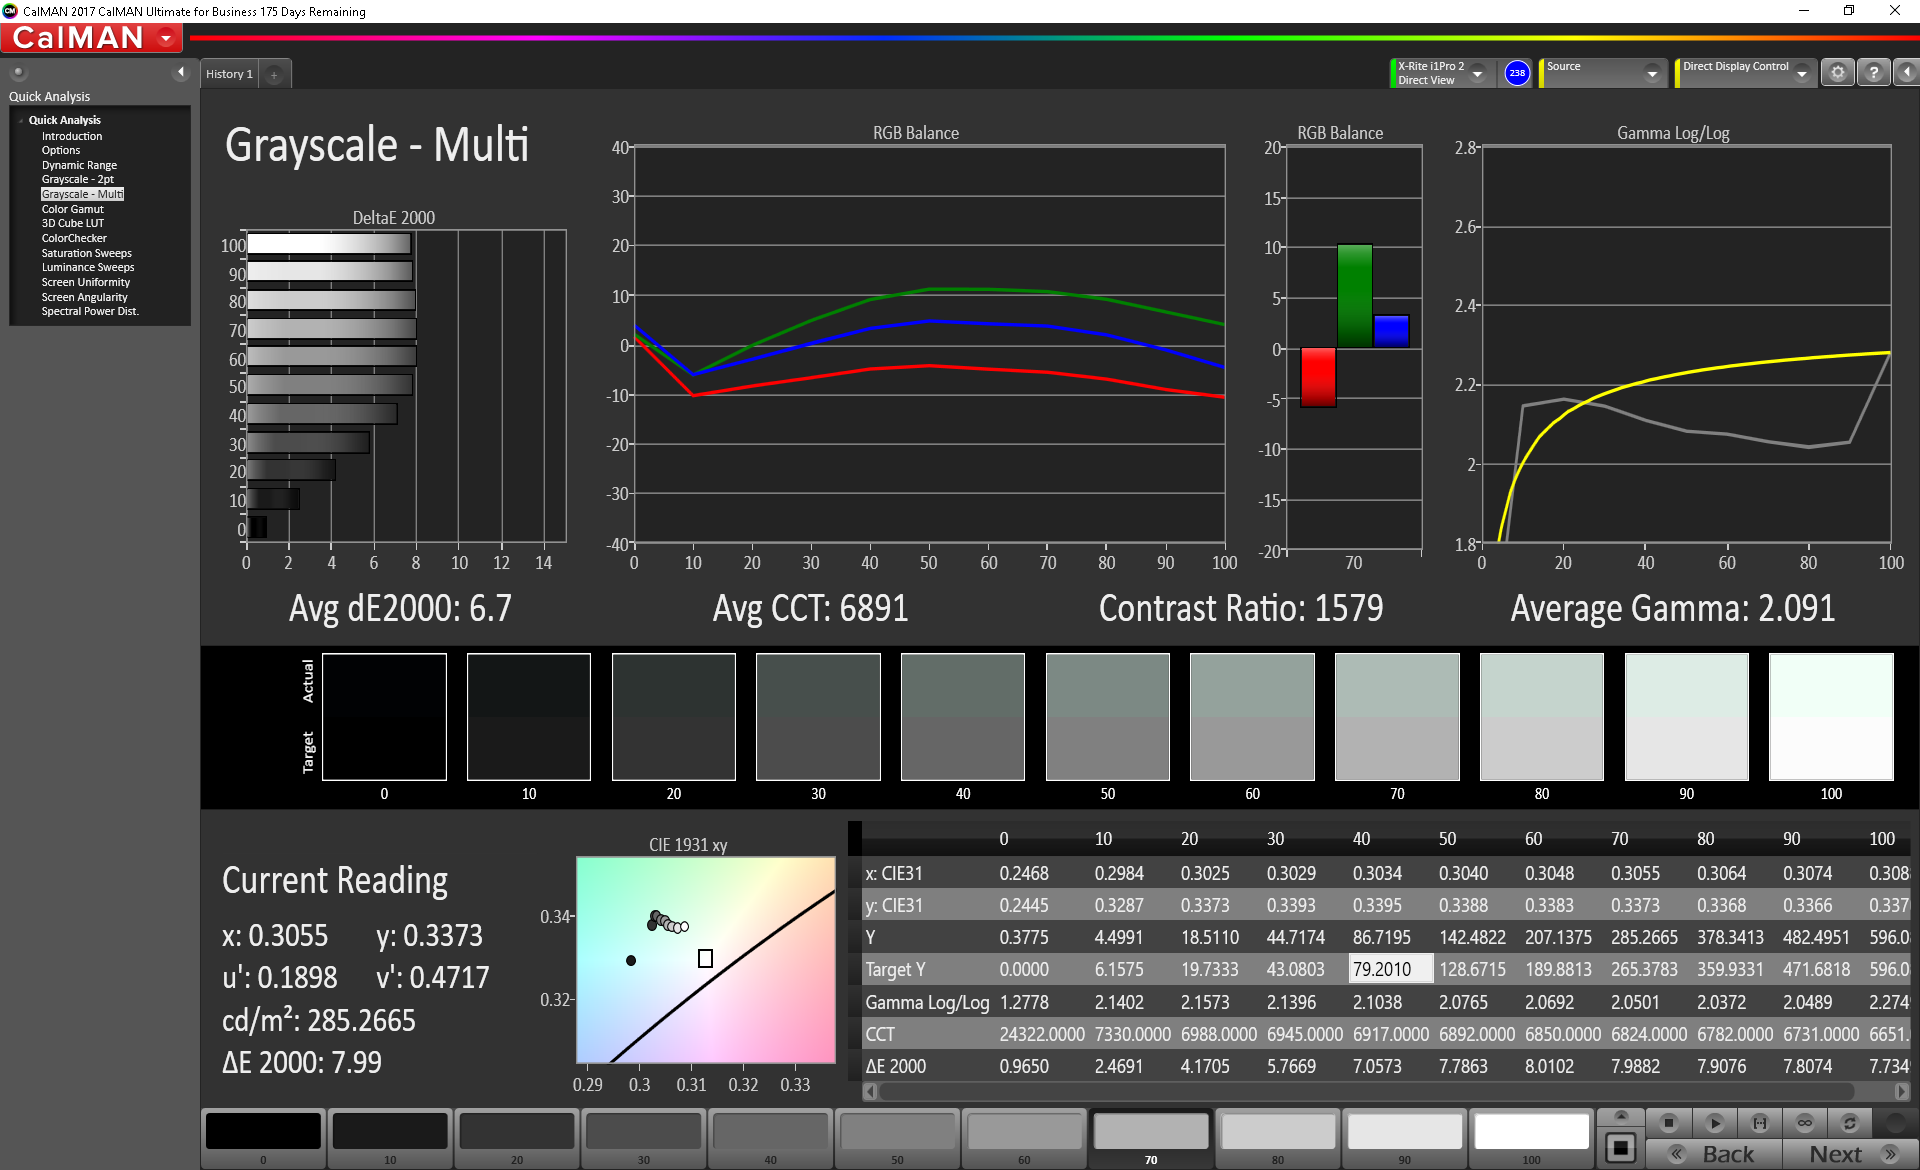
ΔE Greyscale Calman: 6.7 | ∀{0.09-98 Ø5}
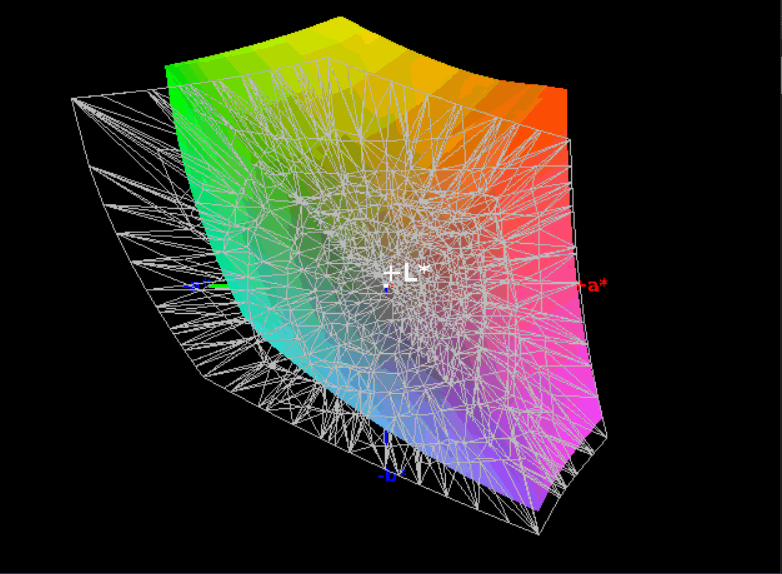
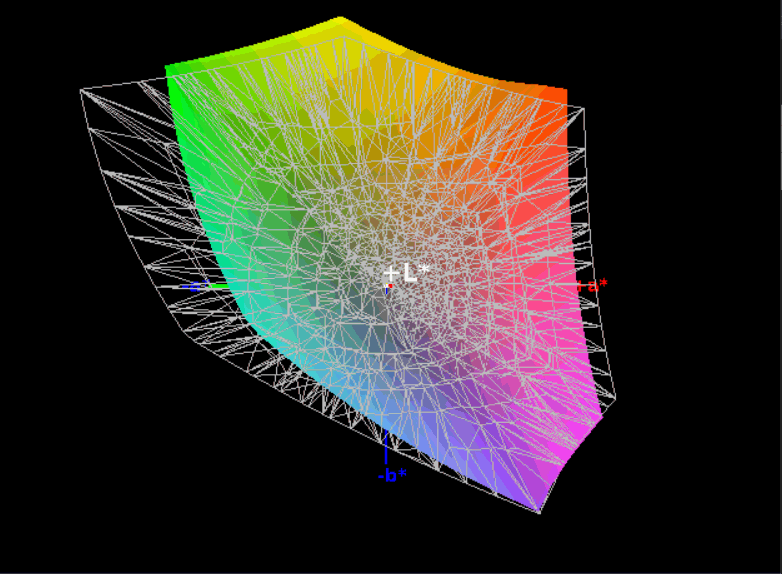
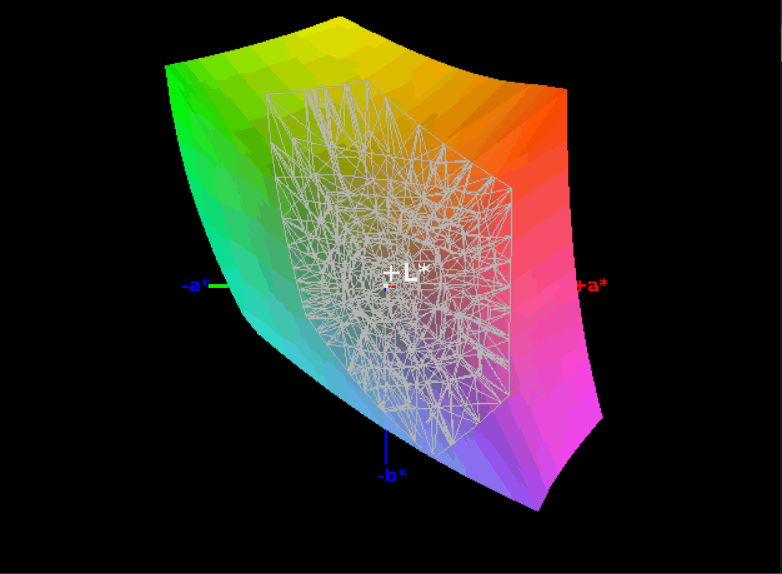
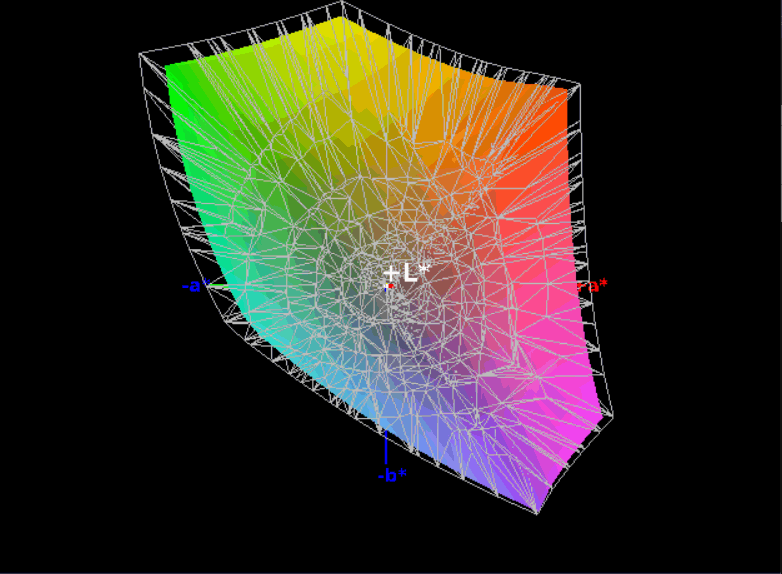
100% sRGB (Argyll 1.6.3 3D)
72% AdobeRGB 1998 (Argyll 1.6.3 3D)
81.1% AdobeRGB 1998 (Argyll 3D)
99.7% sRGB (Argyll 3D)
87.5% Display P3 (Argyll 3D)
Gamma: 2.091
CCT: 6891 K
| Lenovo IdeaPad S940-14IWL B140ZAN01.3, IPS, 14", 3840x2160 | Dell XPS 13 9380 i7 4K ID: AUO 282B B133ZAN Dell: 90NTH, IPS, 13.3", 3840x2160 | Apple MacBook Pro 13 2018 Touchbar i5 APPA03E, IPS, 13.3", 2560x1600 | Asus ZenBook 13 UX333FA AU Optronics B133HAN05.C, IPS, 13.3", 1920x1080 | Lenovo ThinkPad X1 Carbon 2018-20KGS5DU00 LP140QH2-SPB1, IPS, 14", 2560x1440 | Lenovo Yoga C930-13IKB 81C4 AUO B139HAN03_0, IPS, 13.9", 1920x1080 | |
|---|---|---|---|---|---|---|
| Display | -17% | 7% | -13% | -9% | -18% | |
| Display P3 Coverage (%) | 87.5 | 64.8 -26% | 98.5 13% | 67.9 -22% | 72.7 -17% | 62.7 -28% |
| sRGB Coverage (%) | 99.7 | 93.6 -6% | 99.9 0% | 97.4 -2% | 97.9 -2% | 92.6 -7% |
| AdobeRGB 1998 Coverage (%) | 81.1 | 65.8 -19% | 87.3 8% | 69.2 -15% | 74.6 -8% | 64.7 -20% |
| Response Times | -16% | 10% | -7% | 27% | 30% | |
| Response Time Grey 50% / Grey 80% * (ms) | 57.2 ? | 64.8 ? -13% | 46 ? 20% | 54.4 ? 5% | 38 ? 34% | 34.4 ? 40% |
| Response Time Black / White * (ms) | 32 ? | 38 ? -19% | 32 ? -0% | 37.6 ? -18% | 26 ? 19% | 25.6 ? 20% |
| PWM Frequency (Hz) | 118000 ? | |||||
| Screen | 11% | 24% | -1% | -10% | -28% | |
| Brightness middle (cd/m²) | 594.5 | 428.3 -28% | 519 -13% | 276 -54% | 316 -47% | 312 -48% |
| Brightness (cd/m²) | 536 | 414 -23% | 504 -6% | 263 -51% | 311 -42% | 295 -45% |
| Brightness Distribution (%) | 83 | 88 6% | 95 14% | 89 7% | 84 1% | 87 5% |
| Black Level * (cd/m²) | 0.43 | 0.27 37% | 0.33 23% | 0.21 51% | 0.35 19% | 0.43 -0% |
| Contrast (:1) | 1383 | 1586 15% | 1573 14% | 1314 -5% | 903 -35% | 726 -48% |
| Colorchecker dE 2000 * | 4.87 | 2.69 45% | 1.4 71% | 4.85 -0% | 4.5 8% | 7.6 -56% |
| Colorchecker dE 2000 max. * | 7.9 | 6.19 22% | 2.8 65% | 8.24 -4% | 10.3 -30% | 15.06 -91% |
| Colorchecker dE 2000 calibrated * | 2.83 | 2.01 29% | 1.6 43% | 1.6 43% | 1.96 31% | |
| Greyscale dE 2000 * | 6.7 | 3.7 45% | 2.2 67% | 5.7 15% | 7.7 -15% | 8.8 -31% |
| Gamma | 2.091 105% | 2.1 105% | 2.22 99% | 2.08 106% | 2.2 100% | 2.01 109% |
| CCT | 6891 94% | 6706 97% | 6908 94% | 7424 88% | 6639 98% | 6874 95% |
| Color Space (Percent of AdobeRGB 1998) (%) | 72 | 60.4 -16% | 77.3 7% | 63 -12% | 68.6 -5% | 59.1 -18% |
| Color Space (Percent of sRGB) (%) | 100 | 93.5 -6% | 99.99 0% | 98 -2% | 97.9 -2% | 92.3 -8% |
| Total Average (Program / Settings) | -7% /
3% | 14% /
19% | -7% /
-4% | 3% /
-5% | -5% /
-19% |
* ... smaller is better
Now for our measurements: the UHD display in our review unit achieves an average brightness of 536.5 cd/m², which is actually higher than promised by Lenovo, and extremely bright for a laptop. It’s the brightest screen in our comparison field today, in fact, edging out the MacBook Pro 13 and comfortably defeating the Dell XPS 13. Distribution is a bit less impressive at 83%, but it’s not really a noticeable discrepancy during general use. Finally, contrast is also very good at 1383:1 (thanks to a black value of 0.43 cd/m²).
We measure 100% sRGB gamut coverage and 72% AdobeRGB, which is a good result. It also beats all competitors, with the exception of the MacBook Pro 13, which just barely beats it with 77.3% AdobeRGB gamut coverage.


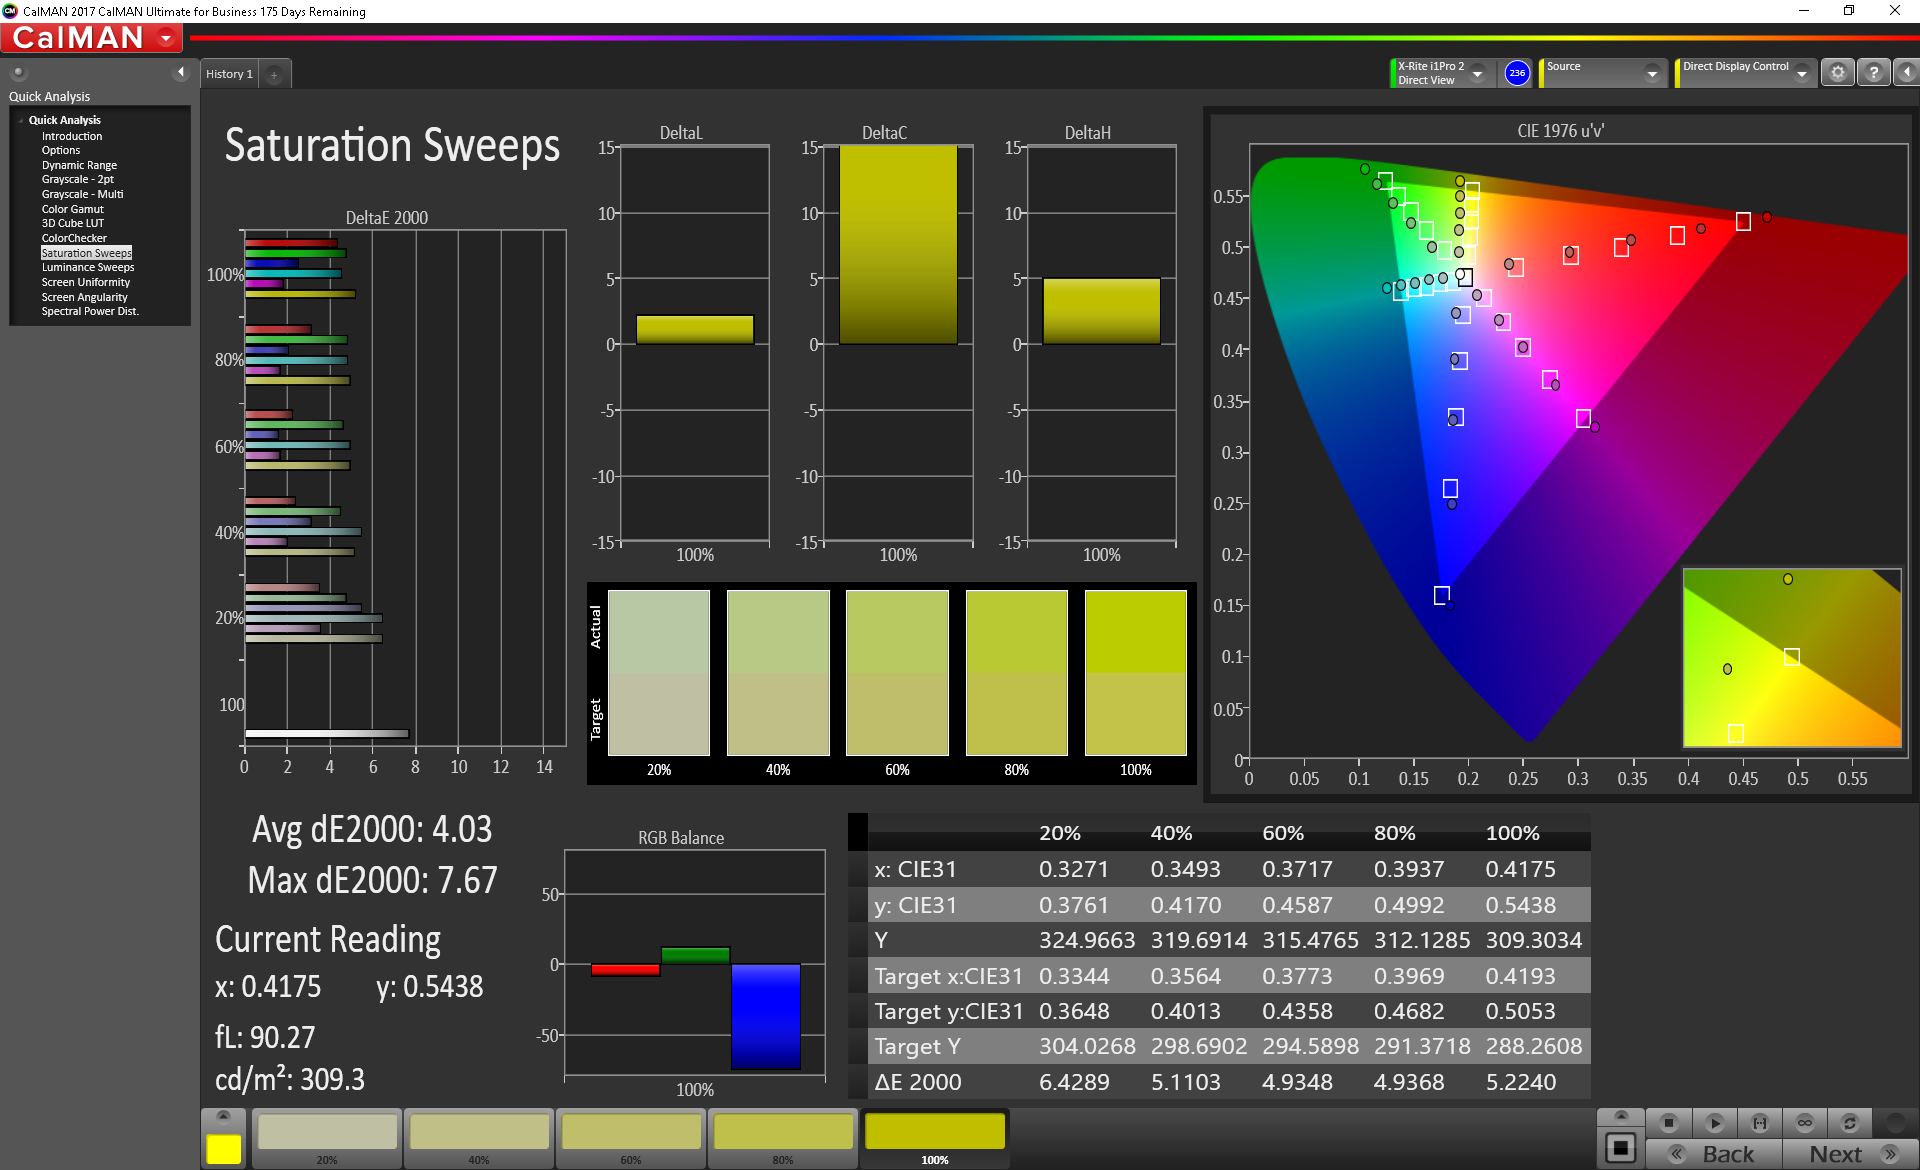
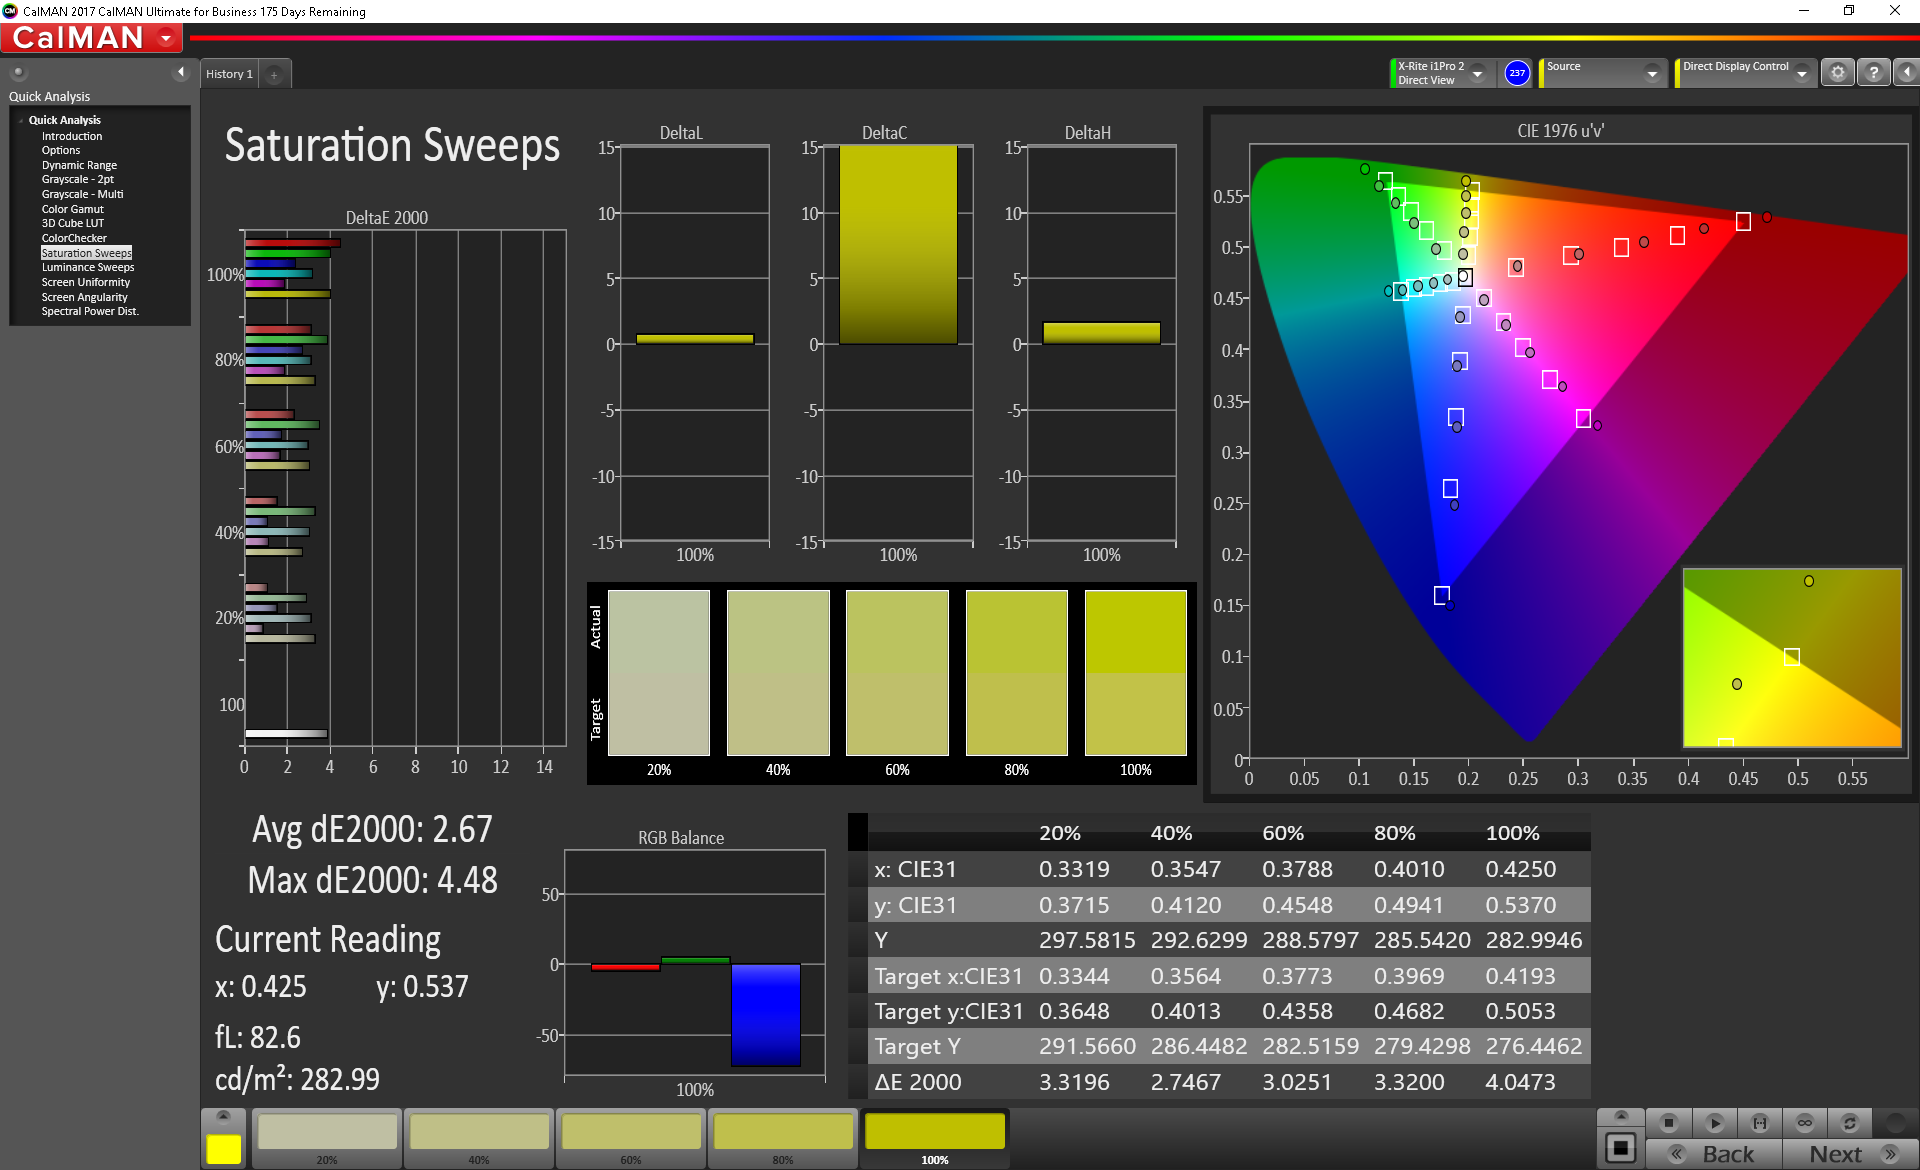
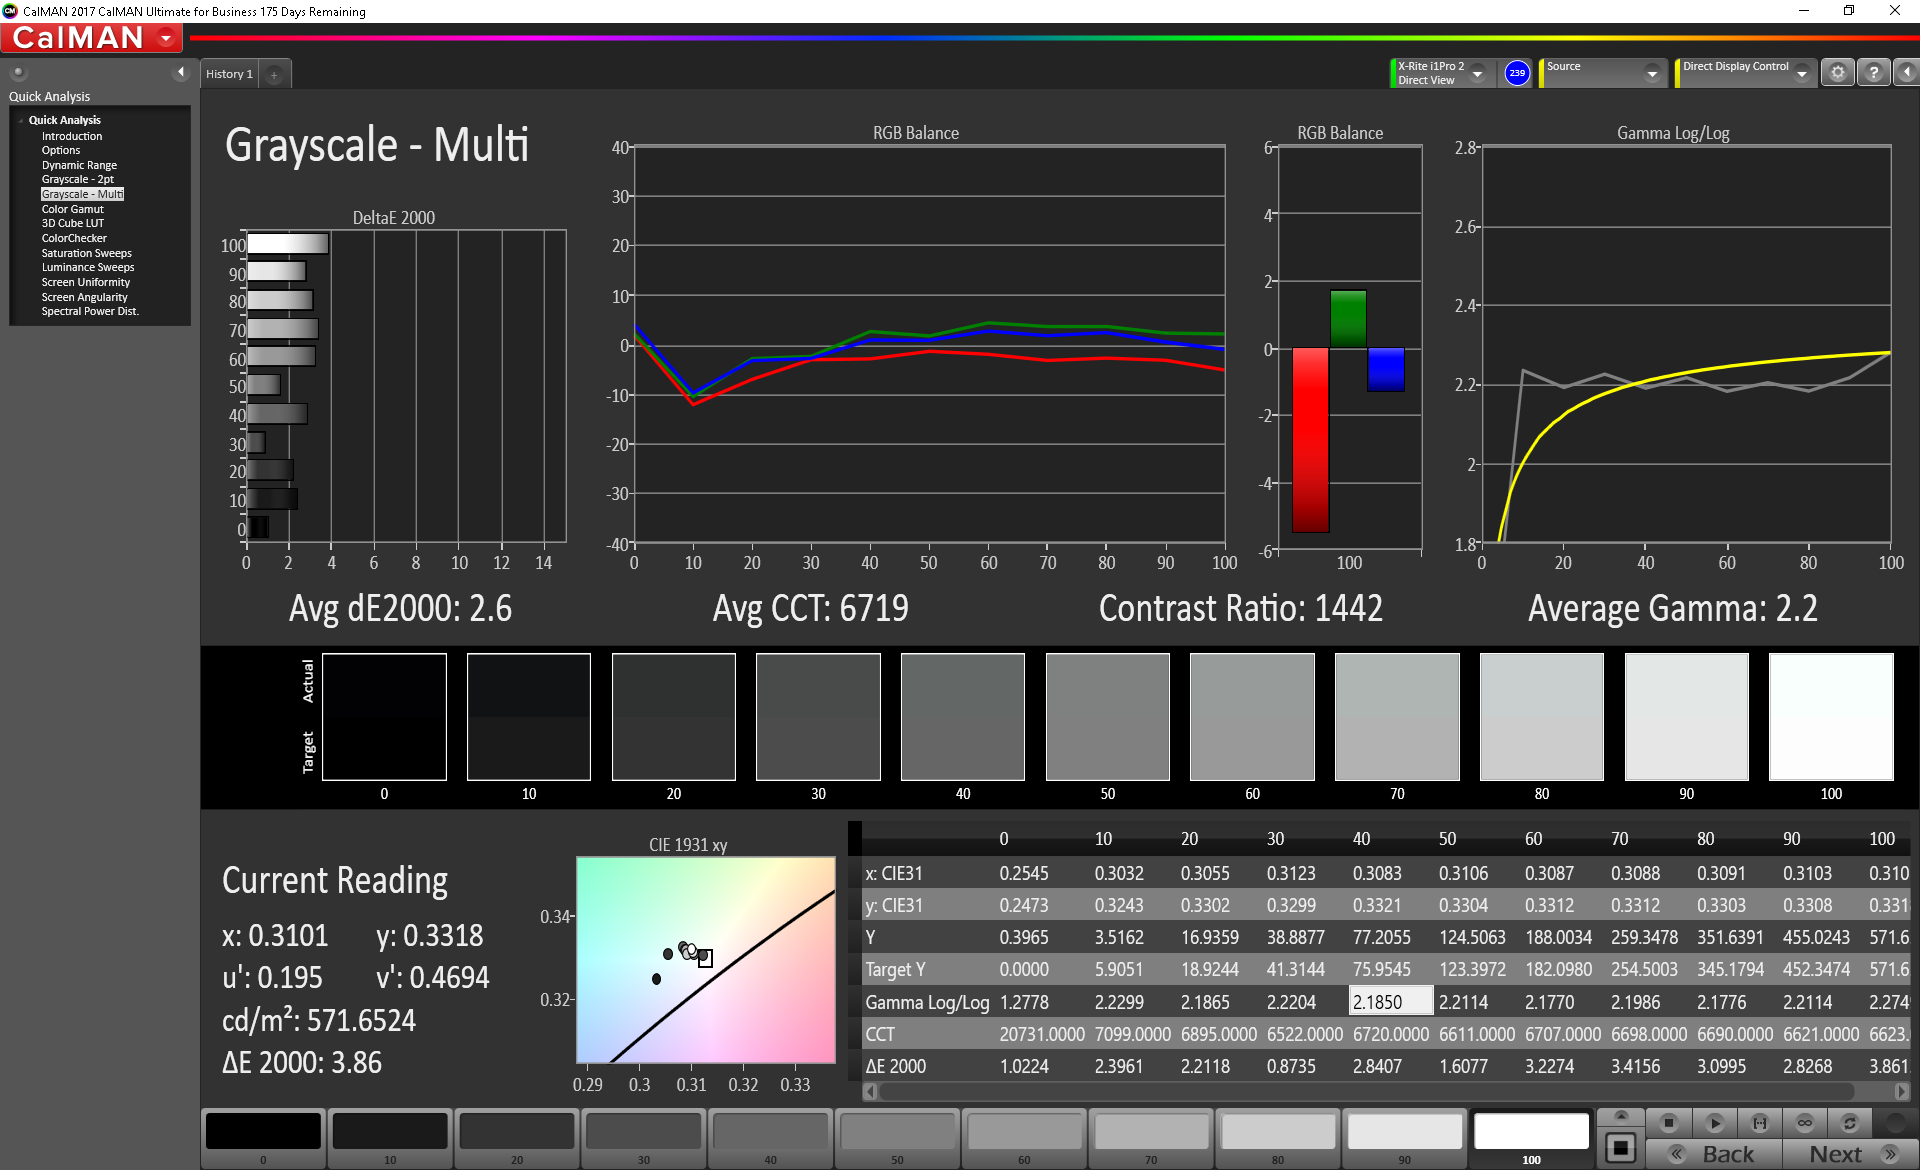
Our CalMAN measurements suggest that the panel could benefit from some post-purchase calibration. With the exception of the particularly deviant Yoga C930, most competitors fare batter than the IdeaPad S940 in terms of color accuracy: ColorChecker and Greyscale DeltaE measurements of 4.87 and 6.7 aren’t terrible, but post-calibration, these numbers dropped to 2.83 and 2.6 respectively, which is quite a bit more palatable. The Total Gamma value of 2.091 and CCT Average of 6891 are much closer to ideal, however.
Display Response Times
| ↔ Response Time Black to White | ||
|---|---|---|
| 32 ms ... rise ↗ and fall ↘ combined | ↗ 17.2 ms rise | 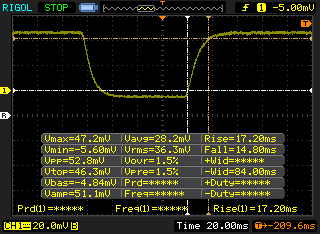 |
| ↘ 14.8 ms fall | ||
| The screen shows slow response rates in our tests and will be unsatisfactory for gamers. In comparison, all tested devices range from 0.1 (minimum) to 240 (maximum) ms. » 85 % of all devices are better. This means that the measured response time is worse than the average of all tested devices (20.1 ms). | ||
| ↔ Response Time 50% Grey to 80% Grey | ||
| 57.2 ms ... rise ↗ and fall ↘ combined | ↗ 30 ms rise | 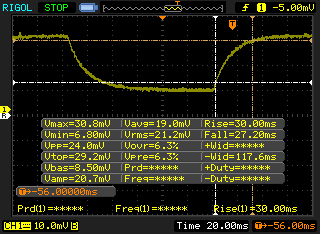 |
| ↘ 27.2 ms fall | ||
| The screen shows slow response rates in our tests and will be unsatisfactory for gamers. In comparison, all tested devices range from 0.165 (minimum) to 636 (maximum) ms. » 94 % of all devices are better. This means that the measured response time is worse than the average of all tested devices (31.5 ms). | ||
Screen Flickering / PWM (Pulse-Width Modulation)
| Screen flickering / PWM not detected | 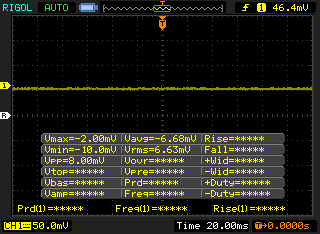 | ||
In comparison: 53 % of all tested devices do not use PWM to dim the display. If PWM was detected, an average of 8039 (minimum: 5 - maximum: 343500) Hz was measured. | |||
Our response time measurements suggest a slow panel that would be far from ideal for gaming (not that it’s likely to be used as such anyway). However, we fortunately didn’t measure any PWM at any brightness setting.
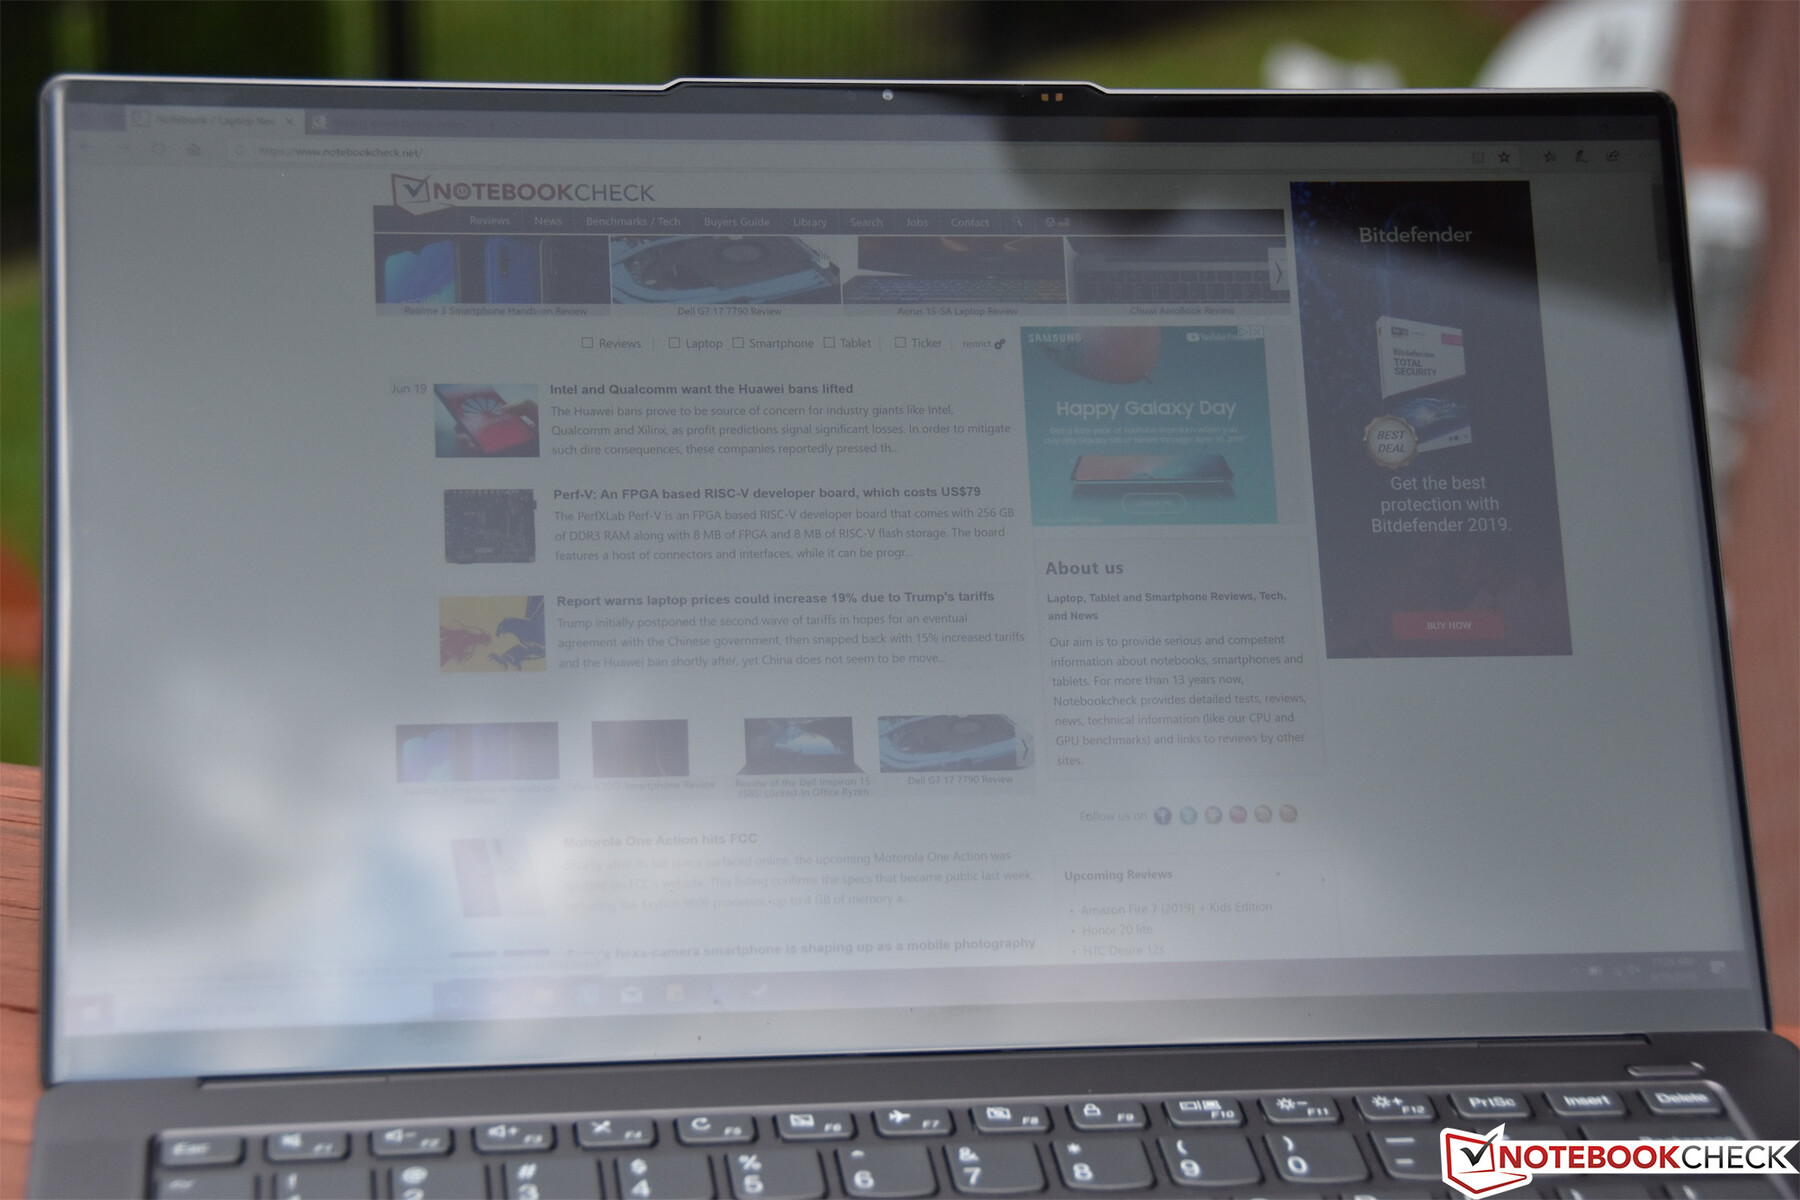
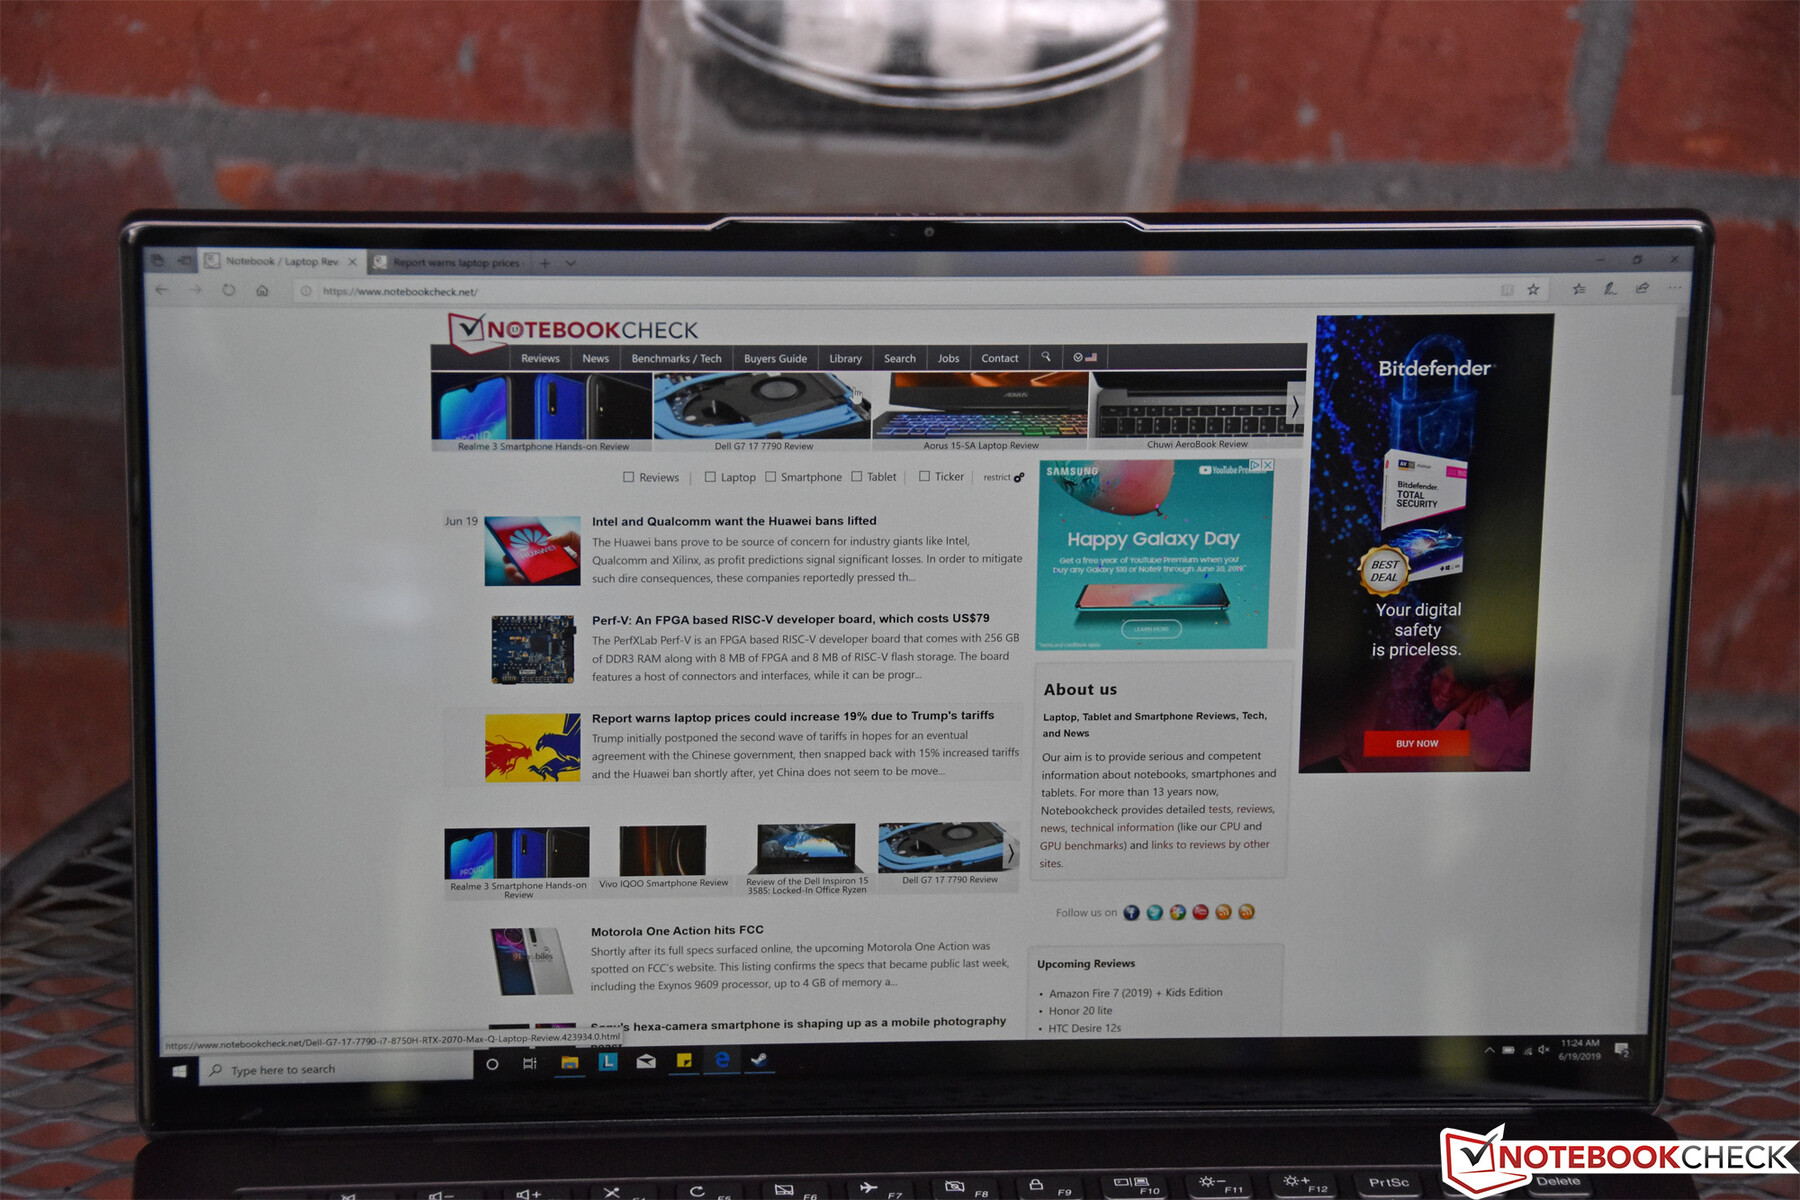
Outdoors, as expected, the high-gloss screen finish renders usage in the sun nearly impossible (even in spite of the high display brightness). Shaded areas are no problem however.
Performance
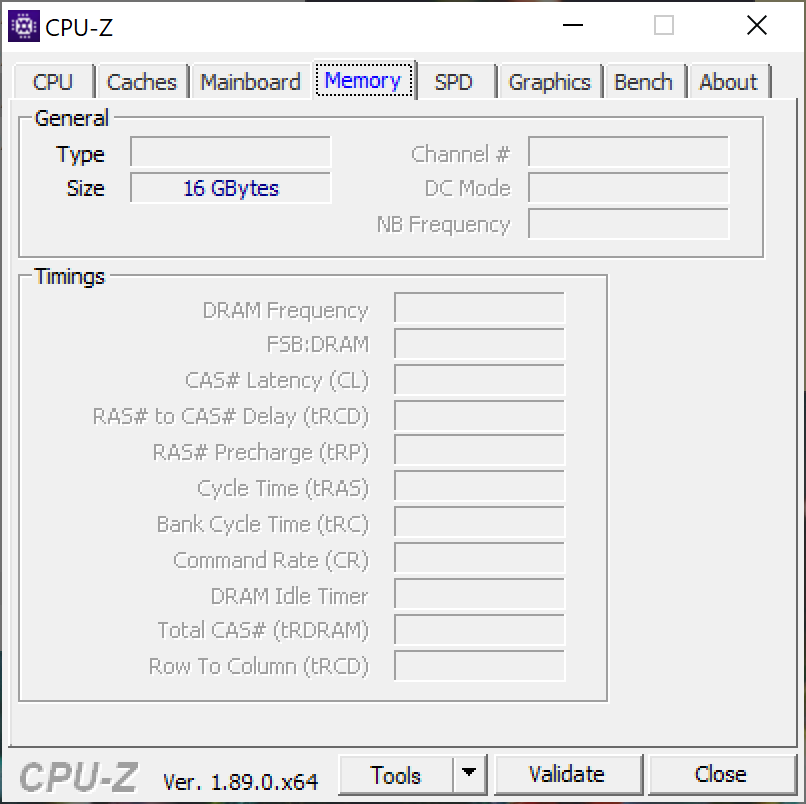
The S940 can be equipped with either a Core i5-8265U or a Core i7-8565U. Either 8 GB or 16 GB of LPDDR3 RAM is available—and RAM cannot be upgraded later on (it’s soldered to the board). Finally, you have the choice of various capacities of M.2 and NVMe SSDs. Our review unit features the Core i7-8565U CPU, 16 GB LPDDR3 RAM, and 512 GB NVMe SSD.
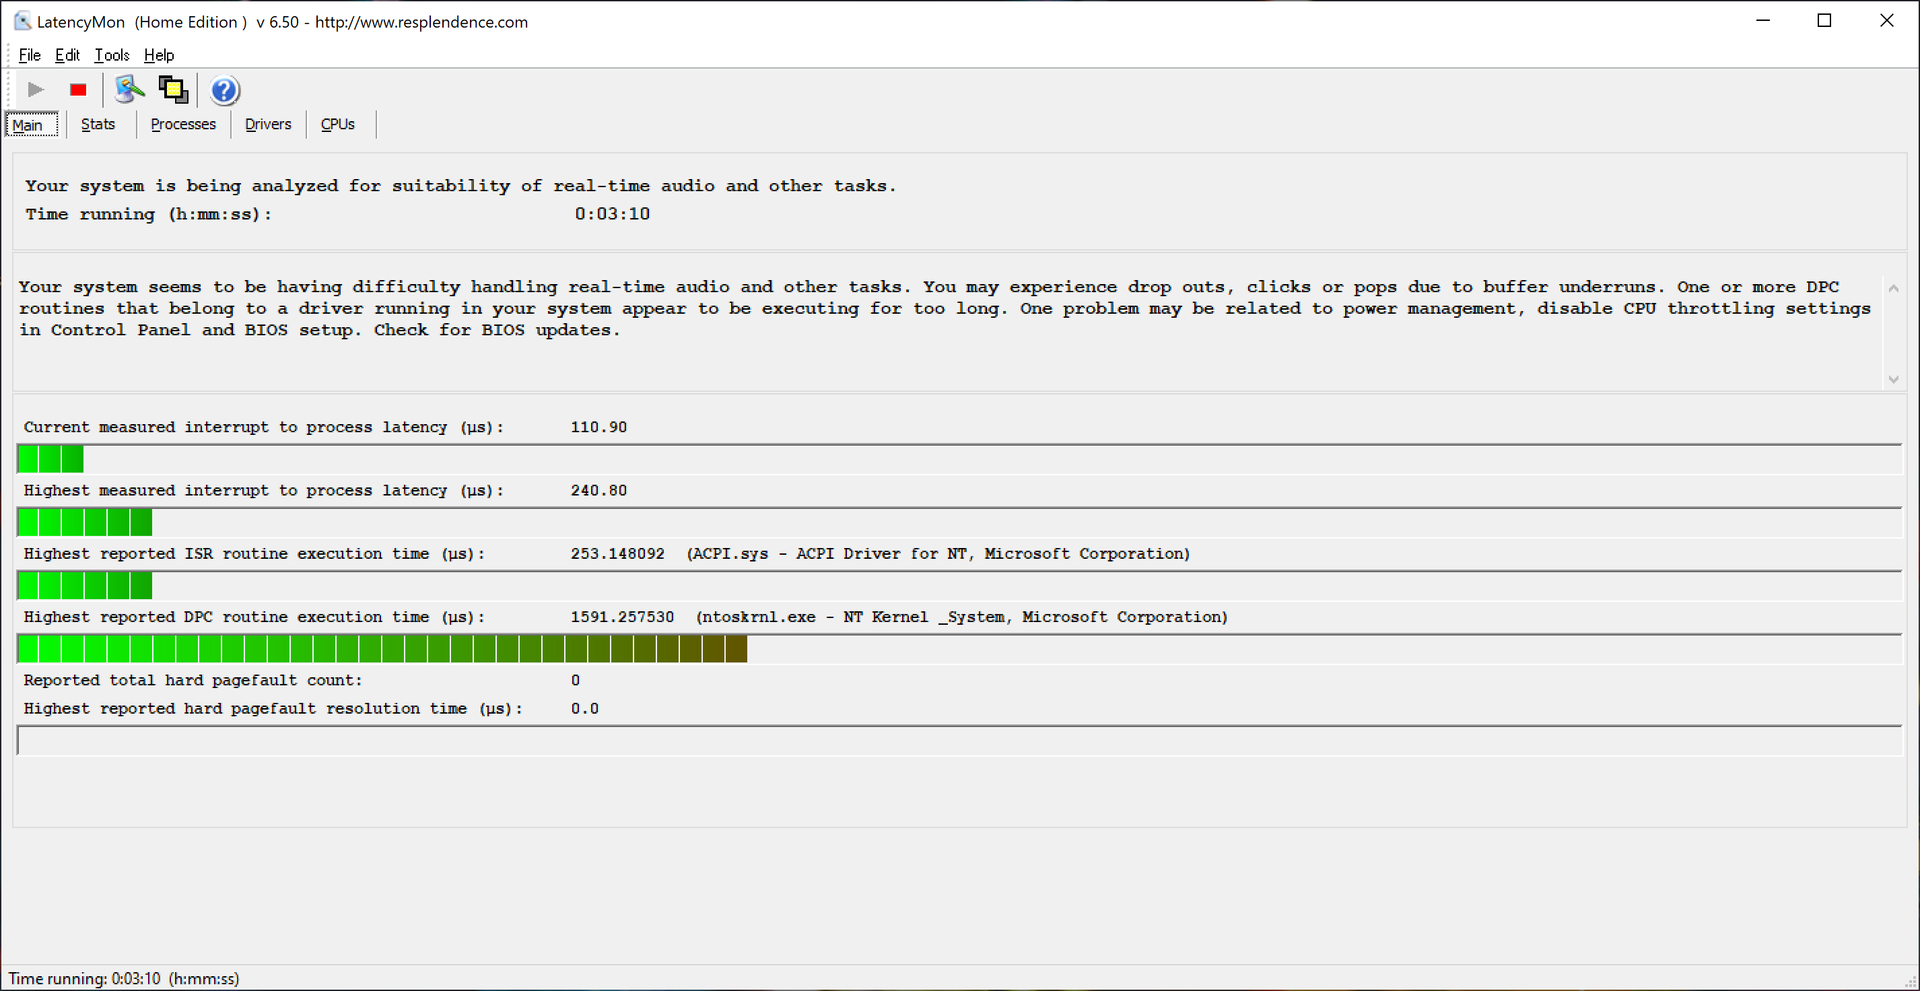
A second run of 3DMark 11 confirms that the system does not lose any performance when operating unplugged. LatencyMon reveals occasional spikes in latency, but it’s probably not enough to actually interfere with most real-time streaming tasks. Wireless radio status did not affect these results.
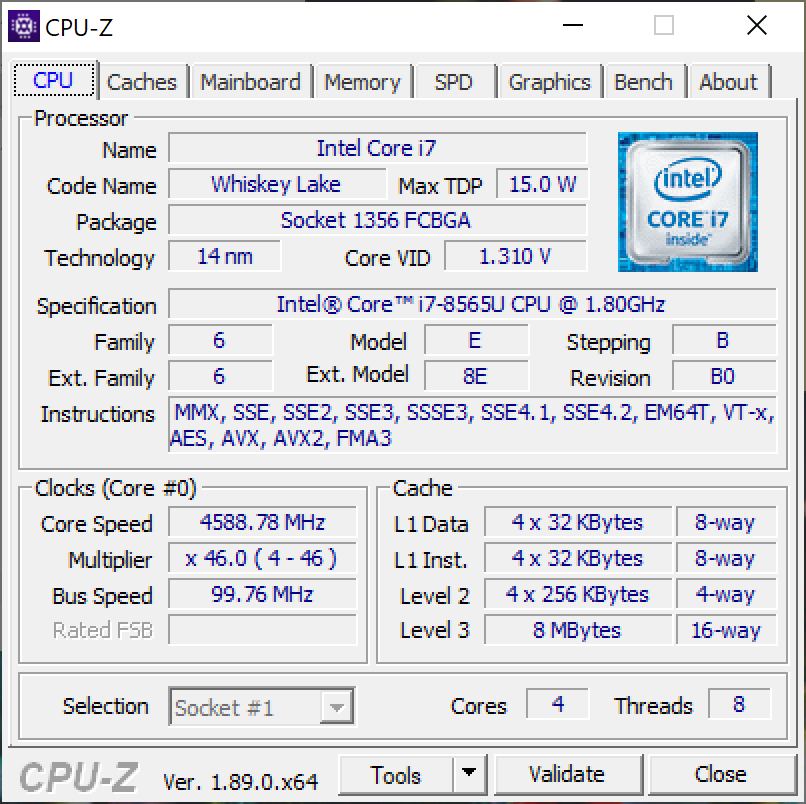
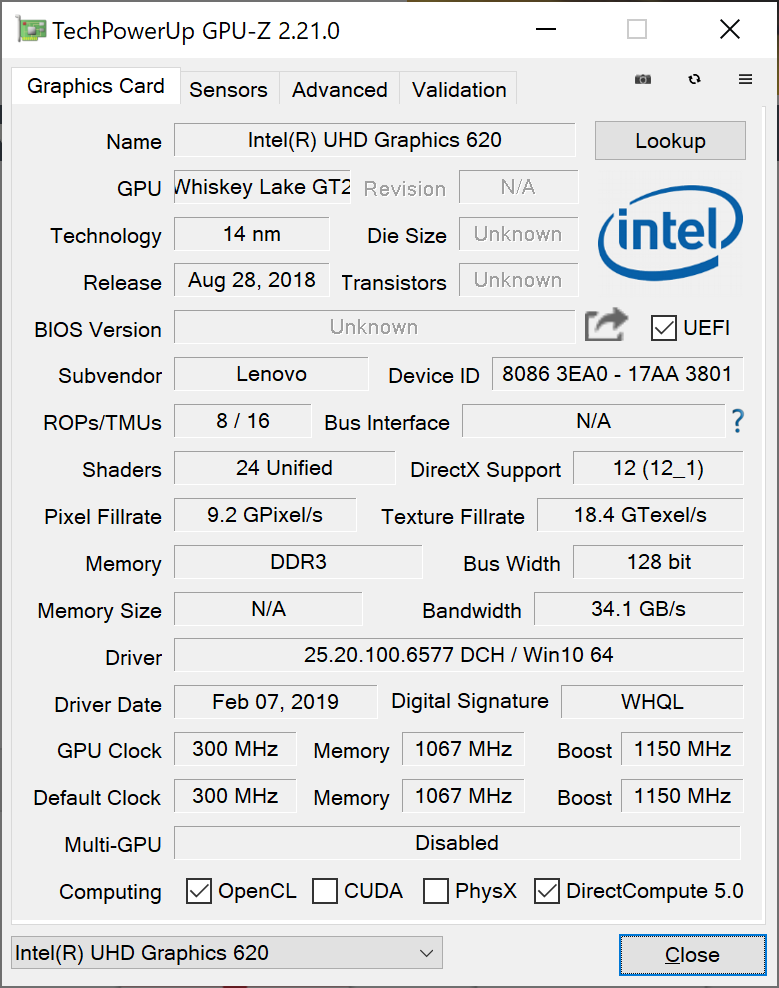
Processor
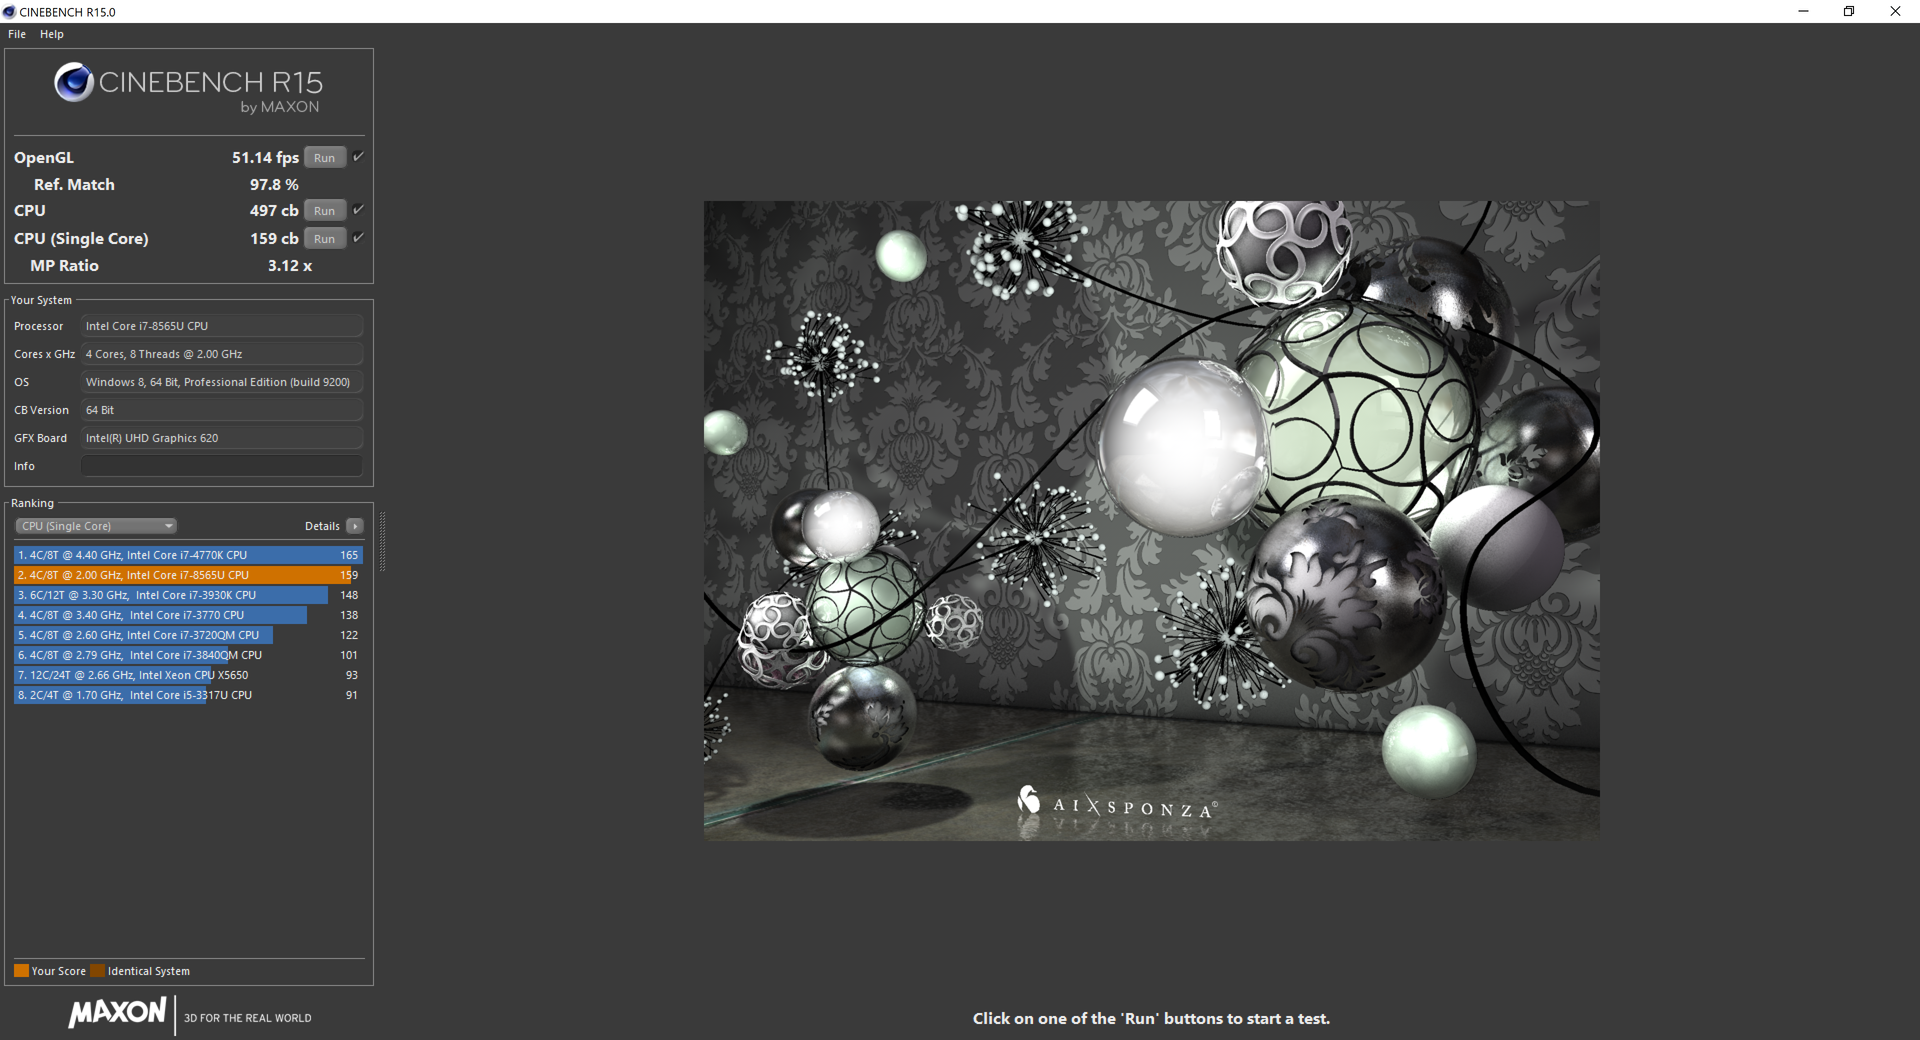
The Intel Core i7-8565U is a 14 nm quad-core Whiskey Lake SoC that we’ve already tested in numerous other machines. The CPU features Thermal Velocity Boost, which acts as a sort of second stage of Turbo Boost that takes into account device thermal and power conditions to provide a very short-term frequency boost to up to 4.6 GHz single-core (4.1 GHz multi-core).
As we’ve seen during our testing of some other machines equipped with Intel’s TVB, running the Cinebench R15 benchmark in sequence (as opposed to running the multi-CPU test isolated) results in significantly lower benchmark results. That’s why in our graph below, you’ll see two values at the start of the Cinebench loop test (540 and 508) which outstrip the final recorded Cinebench R15 multi-CPU value in our database (497). Because this is how we test every machine, however, the value we record is the first one we receive during our normal testing routines. The Cinebench loop values, by contrast, are recorded in isolation.
In comparison with the sole other machine in our field sporting the same CPU (the Dell XPS 13), the S940 performs around 16% slower and 44% slower in single- and multi-core operations respectively. It’s well below the average for other machines in our database with this CPU as well. This is almost certainly a result of the system’s very conservative cooling and thermal policies; the XPS 13, for example, gets much louder in comparison, (as we’ll see in just a bit), and thus cools more quickly and effectively. The S940 doesn’t seem to respond as aggressively to the heat, and instead just caps its CPU performance more conservatively and tries its best to remain silent whenever possible.
A quick glance at our Cinebench R15 loop test results below provides further illustration of the situation. The S940 starts lower than all other competitors at 540 points, and throughout the course of the next six iterations, drops even further down to the 430 to 440 range—a roughly 20% drop from the score we received during the initial run. By comparison, the XPS 13 9380 posts an initial score of 735 in this same test, and only drops sporadically down below the 600 mark after many back-to-back iterations (586 being the low point).
| Cinebench R10 | |
| Rendering Multiple CPUs 32Bit | |
| Average of class Subnotebook (14395 - 51374, n=11, last 2 years) | |
| Average Intel Core i7-8565U (13806 - 23118, n=16) | |
| Lenovo Yoga 530-14ARR-81H9000VGE | |
| Rendering Single 32Bit | |
| Average of class Subnotebook (2299 - 10697, n=11, last 2 years) | |
| Average Intel Core i7-8565U (2682 - 8906, n=16) | |
| Lenovo Yoga 530-14ARR-81H9000VGE | |
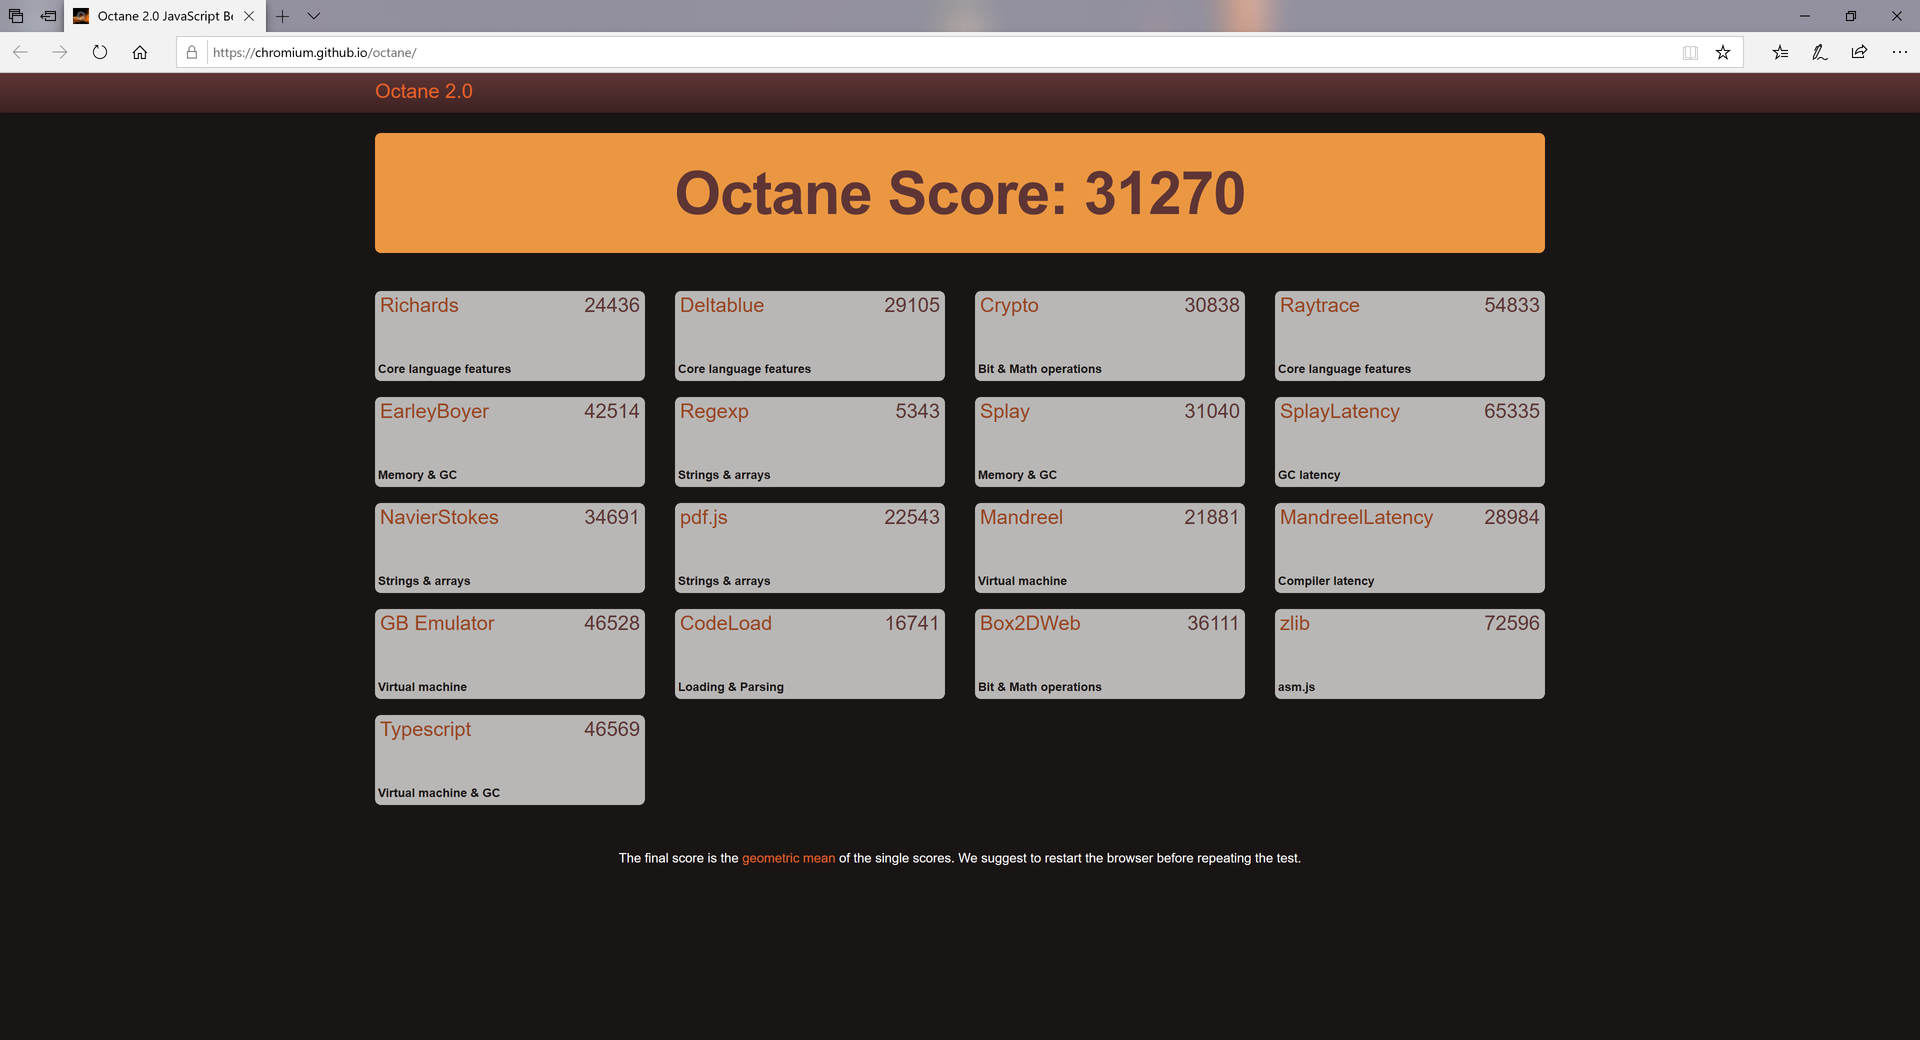
System Performance
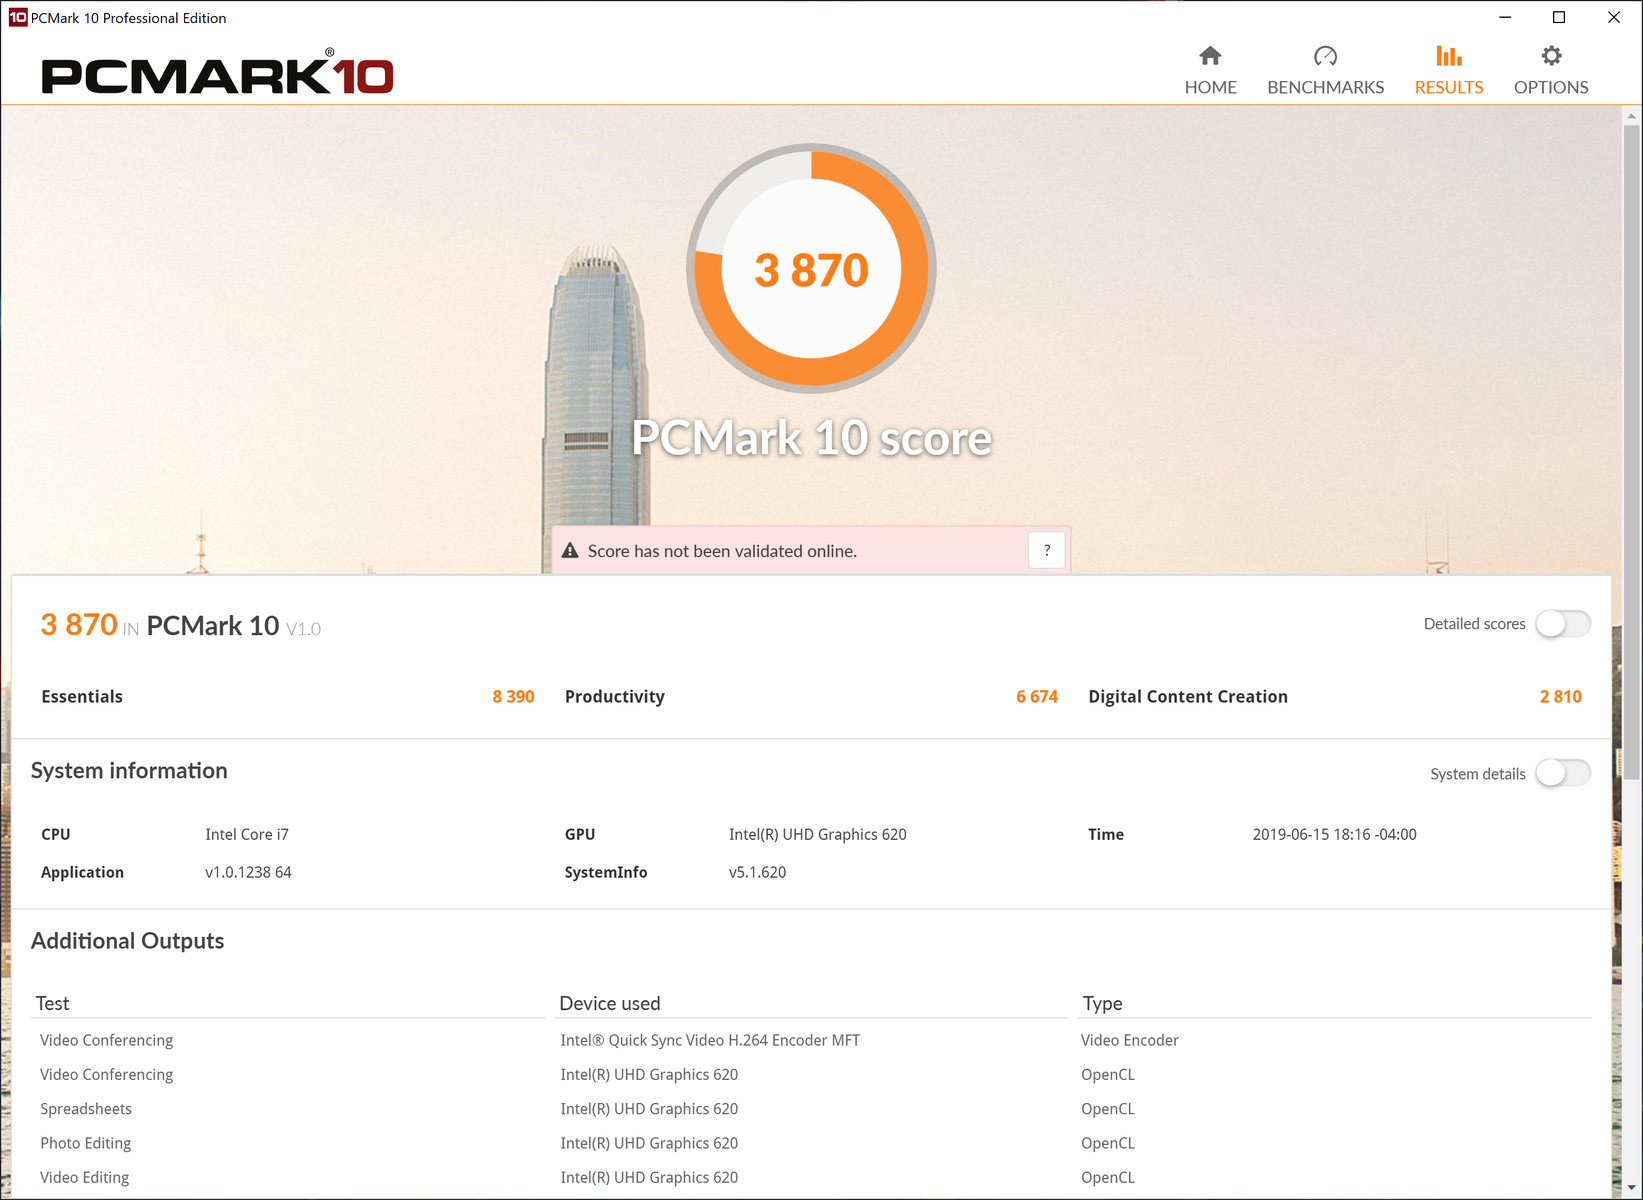
Fortunately, CPU performance is only one variable in the equation. Our synthetic general performance benchmarks using PCMark still suggest a very fast machine—and that’s because these days, quite frankly, CPUs are rarely the primary bottleneck. Instead, storage plays an enormous role in general system performance, and in this category, the S940’s Samsung NVMe drive is absolutely blisteringly fast (as we’ll see in the next section). This, coupled with sufficient CPU performance, results in a strong PCMark 10 overall score of 3870 (just 8% below the XPS 13 9380’s 4172) as well as good Productivity and Essentials scores of 6674 and 8390, respectively.
Digital Content Creation, which focuses much more on arithmetic-heavy (and thus CPU-centric) operations such as photo and video manipulation and encoding, scores a much more modest 2810 (versus the XPS 13’s 3370). In this latter test, the S940 is in dead last in our comparison field, whereas in the former tests, it’s always near the front. Again, the CPU is the only real bottleneck we’re dealing with here, and it’s really still not a dealbreaker; most competitors only lead the S940 by a single-digit percentage margin (though the ZenBook, Yoga, and XPS range from 12%—20% ahead). Unless you’re planning on a lot of this sort of activity, the S940 won’t disappoint you.
Case in point: throughout our time with the laptop, general performance seemed undeniably strong, with applications launching nearly instantaneously and boot/installation times zipping along as we’d expect to see from a machine carrying this price tag.
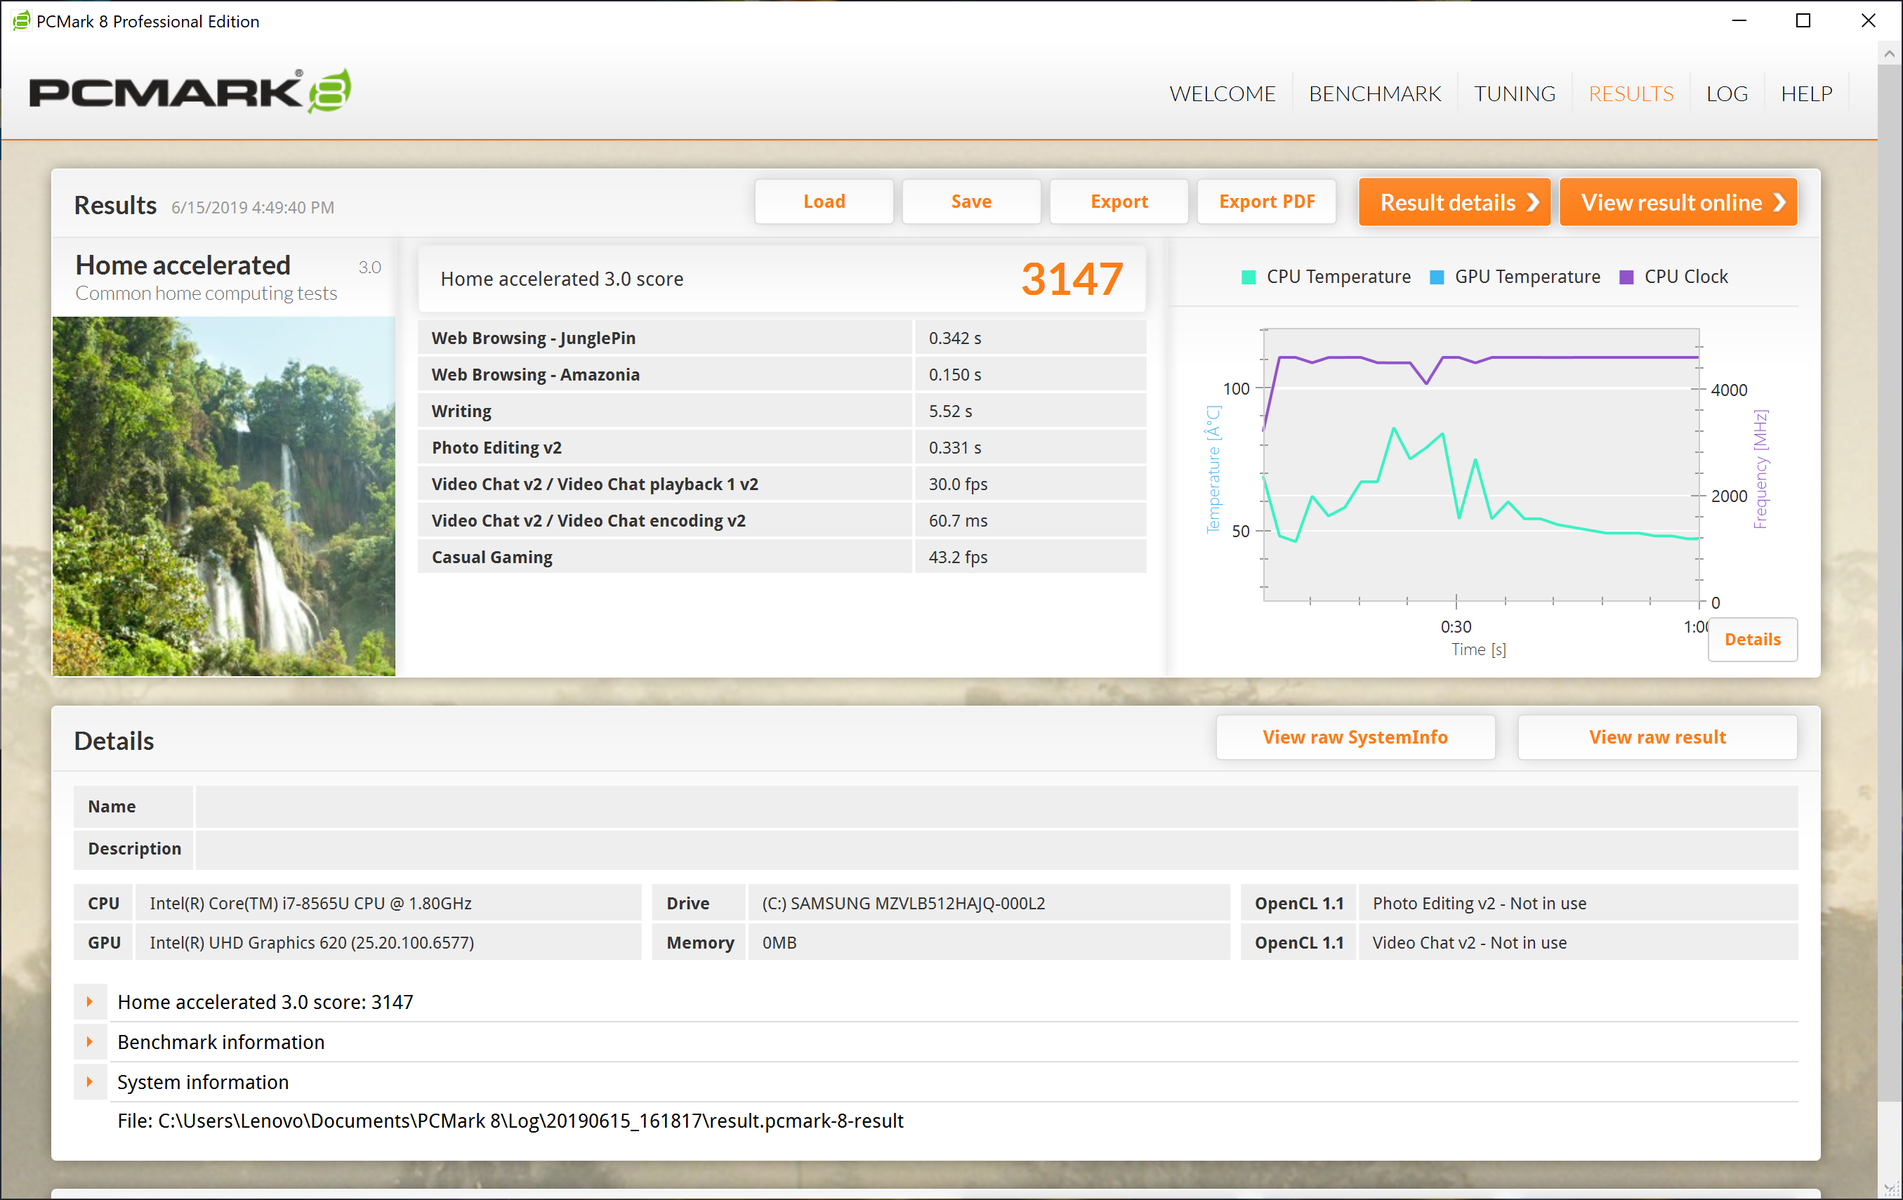
| PCMark 8 Home Score Accelerated v2 | 3147 points | |
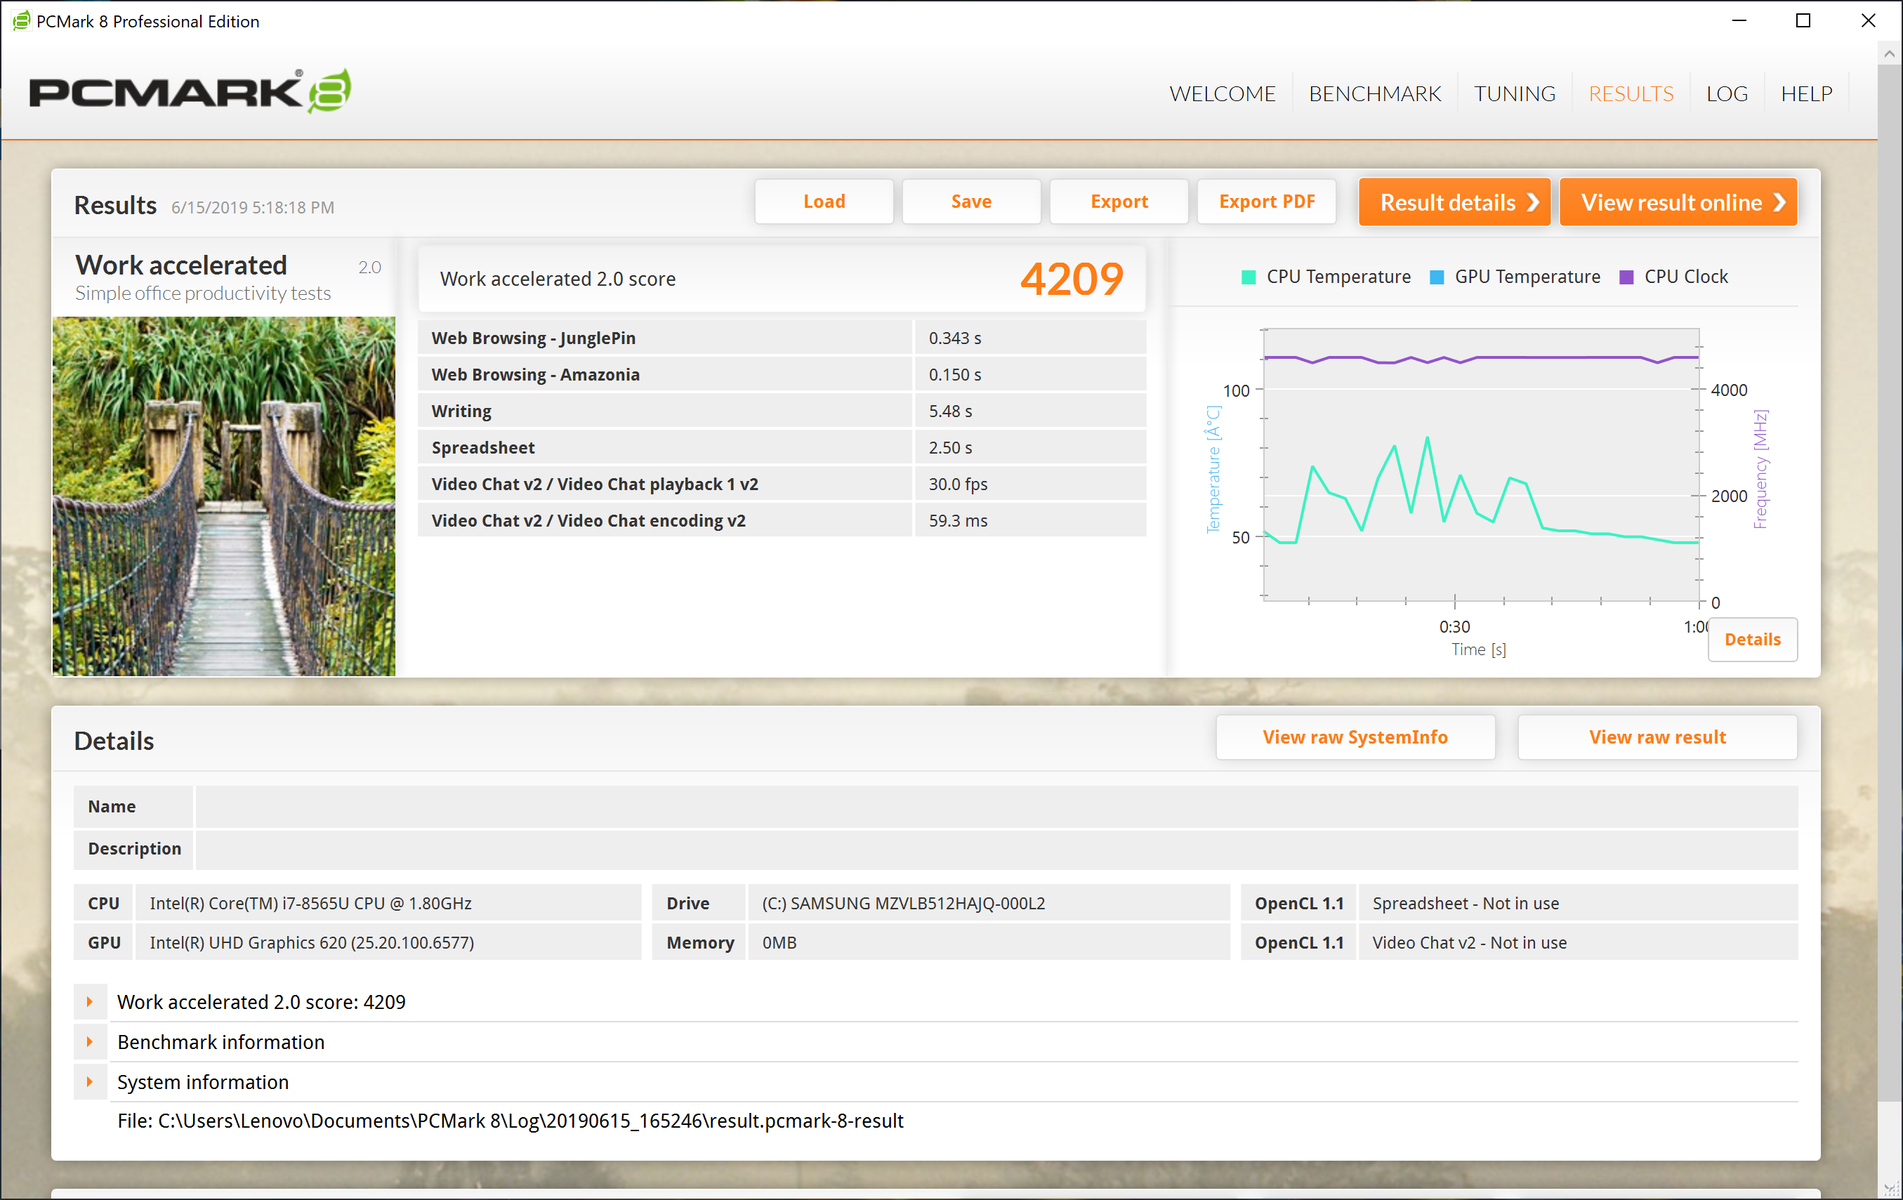
| PCMark 8 Work Score Accelerated v2 | 4209 points | |
| PCMark 10 Score | 3870 points | |
Help | ||
Storage Devices
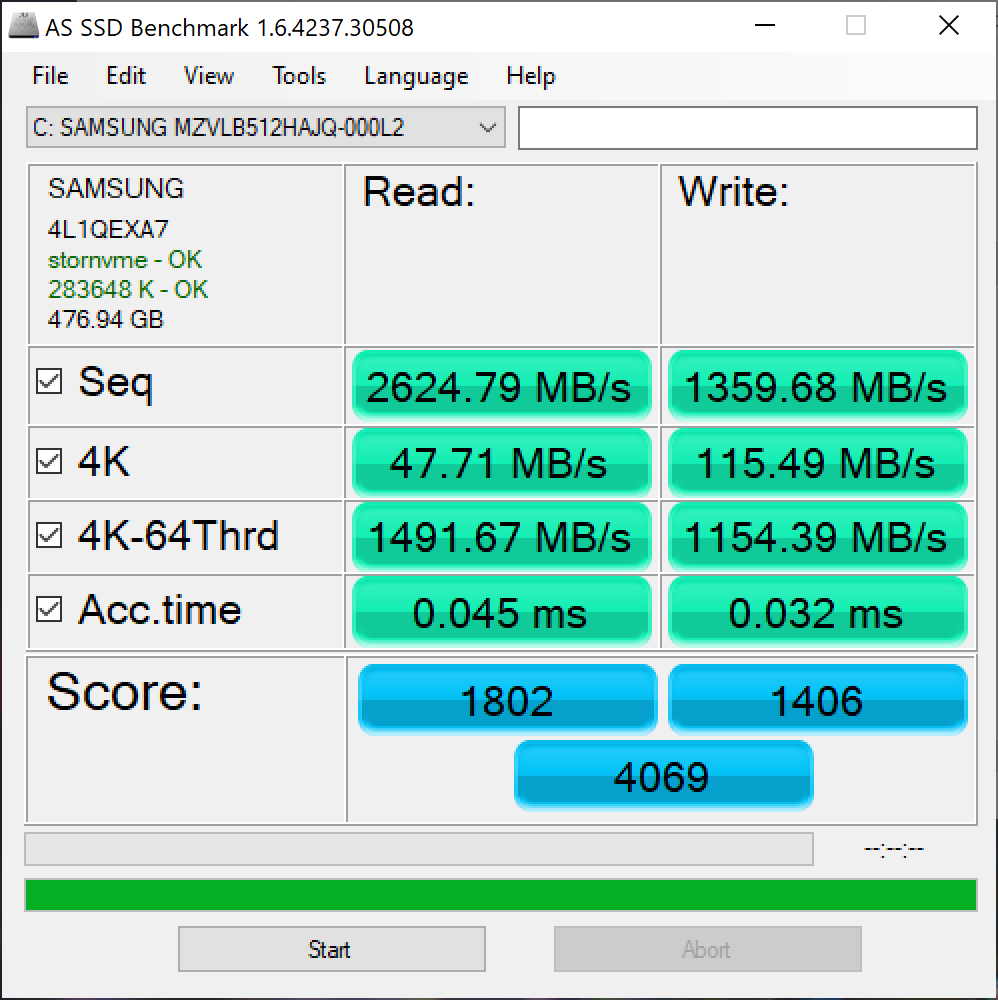
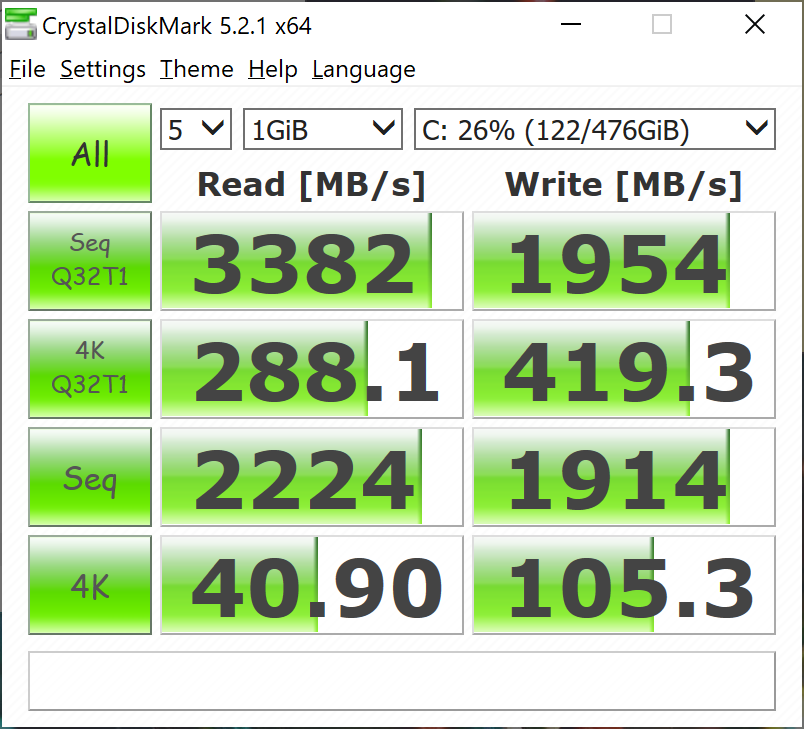
Both standard M.2 SATA and NVMe PCIe 3.0 x 4 drives are available for S940 configurations, but again, the drive is relatively easy to replace provided you’ve got a Torx T5 screwdriver on hand. Our review unit includes a 512 GB NVMe SSD: specifically, a Samsung PM981, which is among the fastest drives we’ve tested. Its performance predictably tops the charts in our comparison field too, with overall speeds that obliterate those of the ZenBook 13, MacBook Pro 13, and Yoga C930. The other two machines (XPS 13 and ThinkPad X1 Carbon) are actually powered by the same drive.
Check out our full breakdown of the benchmarks below.
| Lenovo IdeaPad S940-14IWL Samsung SSD PM981 MZVLB512HAJQ | Dell XPS 13 9380 i7 4K Samsung SSD PM981 MZVLB512HAJQ | Apple MacBook Pro 13 2018 Touchbar i5 | Asus ZenBook 13 UX333FA WDC PC SN520 SDAPNUW-256G | Lenovo Yoga C930-13IKB 81C4 SK hynix PC401 HFS256GD9TNG | |
|---|---|---|---|---|---|
| AS SSD | 14% | -51% | -40% | -263% | |
| Seq Read (MB/s) | 2625 | 1981 -25% | 1442 -45% | 1186 -55% | 1228 -53% |
| Seq Write (MB/s) | 1360 | 1473 8% | 1694 25% | 809 -41% | 544 -60% |
| 4K Read (MB/s) | 47.71 | 53.3 12% | 9.7 -80% | 39.69 -17% | 39.16 -18% |
| 4K Write (MB/s) | 115.5 | 127.4 10% | 20 -83% | 114 -1% | 106.5 -8% |
| 4K-64 Read (MB/s) | 1492 | 1179 -21% | 957 -36% | 618 -59% | 466.4 -69% |
| 4K-64 Write (MB/s) | 1154 | 2105 82% | 162 -86% | 510 -56% | 305.1 -74% |
| Access Time Read * (ms) | 0.045 | 0.036 20% | 0.068 -51% | 0.46 -922% | |
| Access Time Write * (ms) | 0.032 | 0.029 9% | 0.032 -0% | 0.51 -1494% | |
| Score Read (Points) | 1802 | 1430 -21% | 776 -57% | 628 -65% | |
| Score Write (Points) | 1406 | 2379 69% | 705 -50% | 466 -67% | |
| Score Total (Points) | 4069 | 4526 11% | 1870 -54% | 1394 -66% | |
| Copy ISO MB/s (MB/s) | 1294 | 1090 | 628 | ||
| Copy Program MB/s (MB/s) | 503 | 714 | 540 | ||
| Copy Game MB/s (MB/s) | 1148 | 413 | 533 | ||
| CrystalDiskMark 5.2 / 6 | 29% | -38% | -25% | -22% | |
| Write 4K (MB/s) | 105.3 | 139.5 32% | 43.24 -59% | 113.7 8% | 108.7 3% |
| Read 4K (MB/s) | 40.9 | 61.3 50% | 14.07 -66% | 43.18 6% | 40.91 0% |
| Write Seq (MB/s) | 1914 | 1863 -3% | 887 -54% | 970 -49% | 798 -58% |
| Read Seq (MB/s) | 2224 | 2494 12% | 1515 -32% | 1085 -51% | 1610 -28% |
| Write 4K Q32T1 (MB/s) | 419.3 | 772 84% | 225.3 -46% | 396.8 -5% | 385.1 -8% |
| Read 4K Q32T1 (MB/s) | 288.1 | 454.8 58% | 346.5 20% | 317.8 10% | 305.8 6% |
| Write Seq Q32T1 (MB/s) | 1954 | 1869 -4% | 859 -56% | 518 -73% | 779 -60% |
| Read Seq Q32T1 (MB/s) | 3382 | 3480 3% | 2915 -14% | 1741 -49% | 2359 -30% |
| Total Average (Program / Settings) | 22% /
20% | -45% /
-44% | -33% /
-34% | -143% /
-162% |
* ... smaller is better

GPU Performance
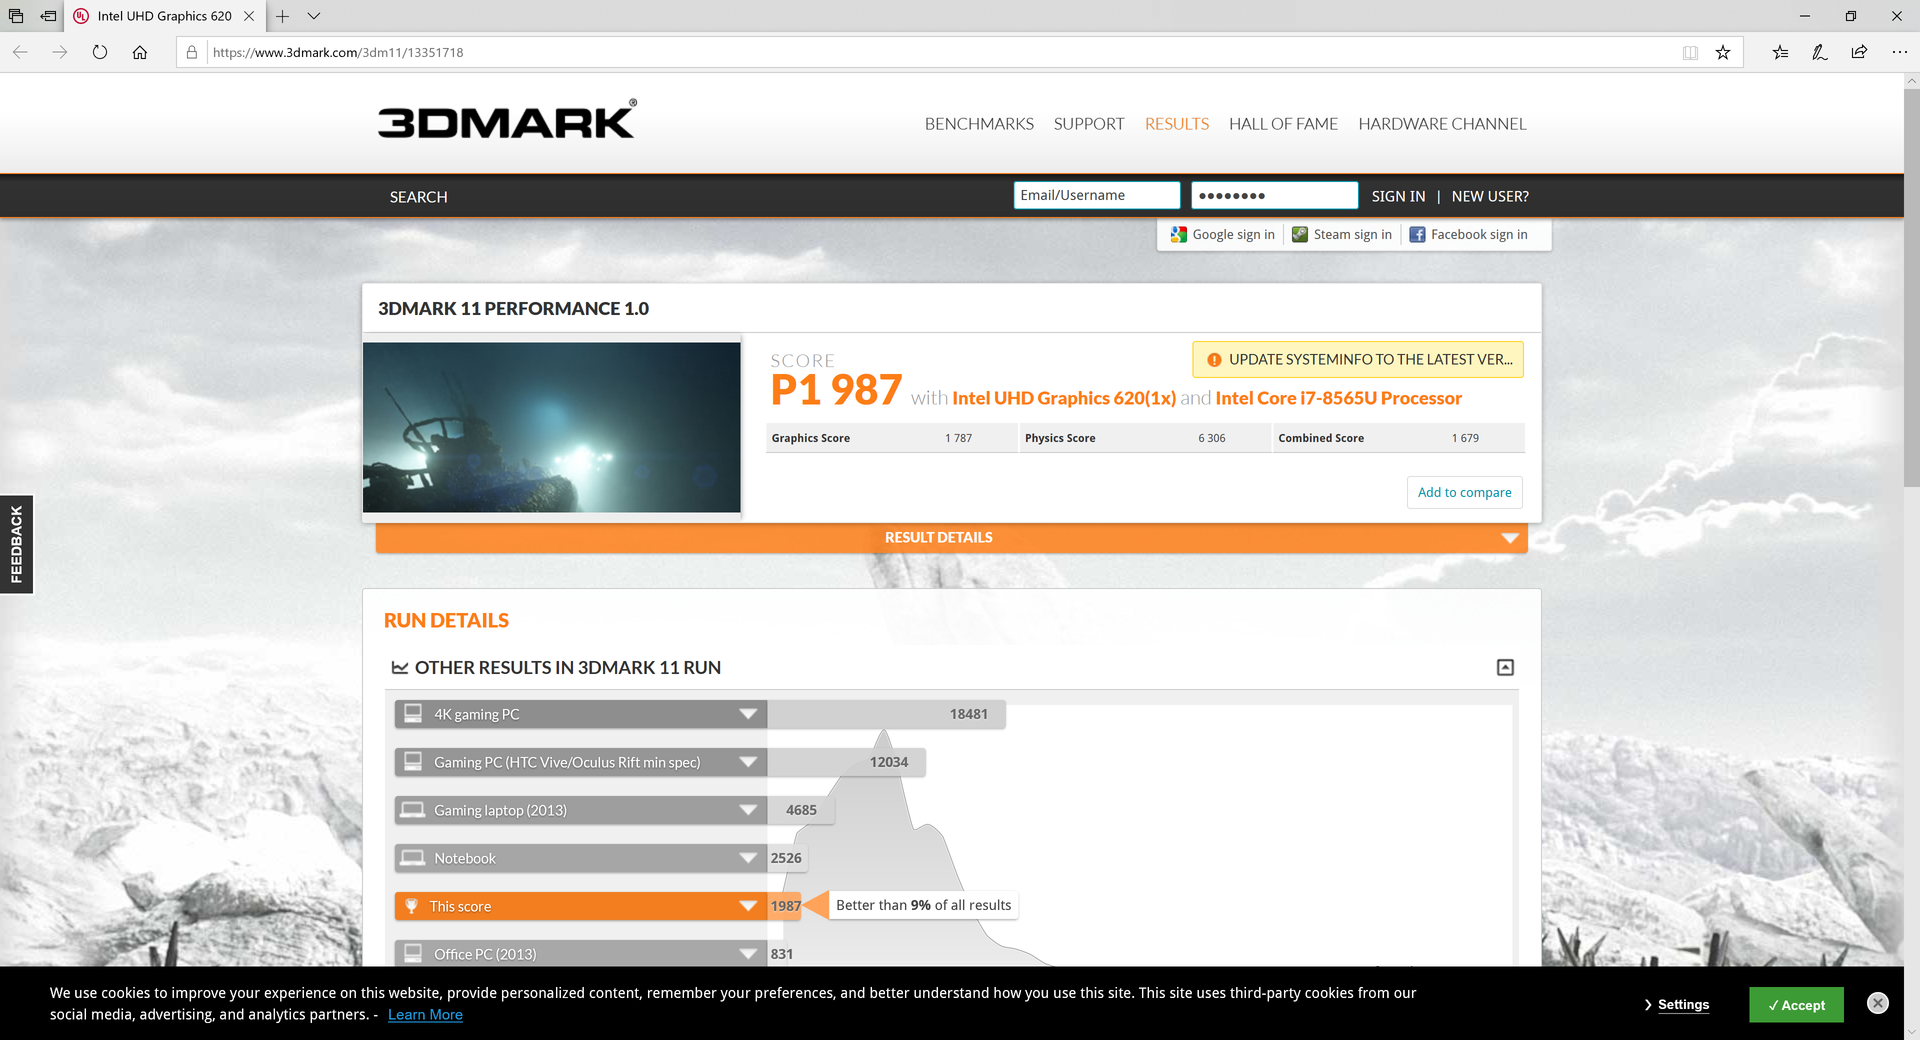
The S940 lacks dedicated graphics options (not surprising given its tiny size), and is instead powered by Intel UHD Graphics 620, whose clock rates range between 300 MHz and 1150 MHz for this SoC. Bear in mind that the 3DMark overall scores are hamstrung by the middling CPU performance (in comparison to other laptops with the same CPU), but isolated GPU scores are very close to what we’d expect. For example, while 3DMark 11 only scores the machine 1987 (versus, for instance, the XPS 13’s score of 2117), the 3DMark 11 GPU score is much closer: just 4% behind, at 1787 points (versus 1855 points). The Yoga 530, powered by an AMD Radeon RX Vega 10, mops the floor with 4045 points.
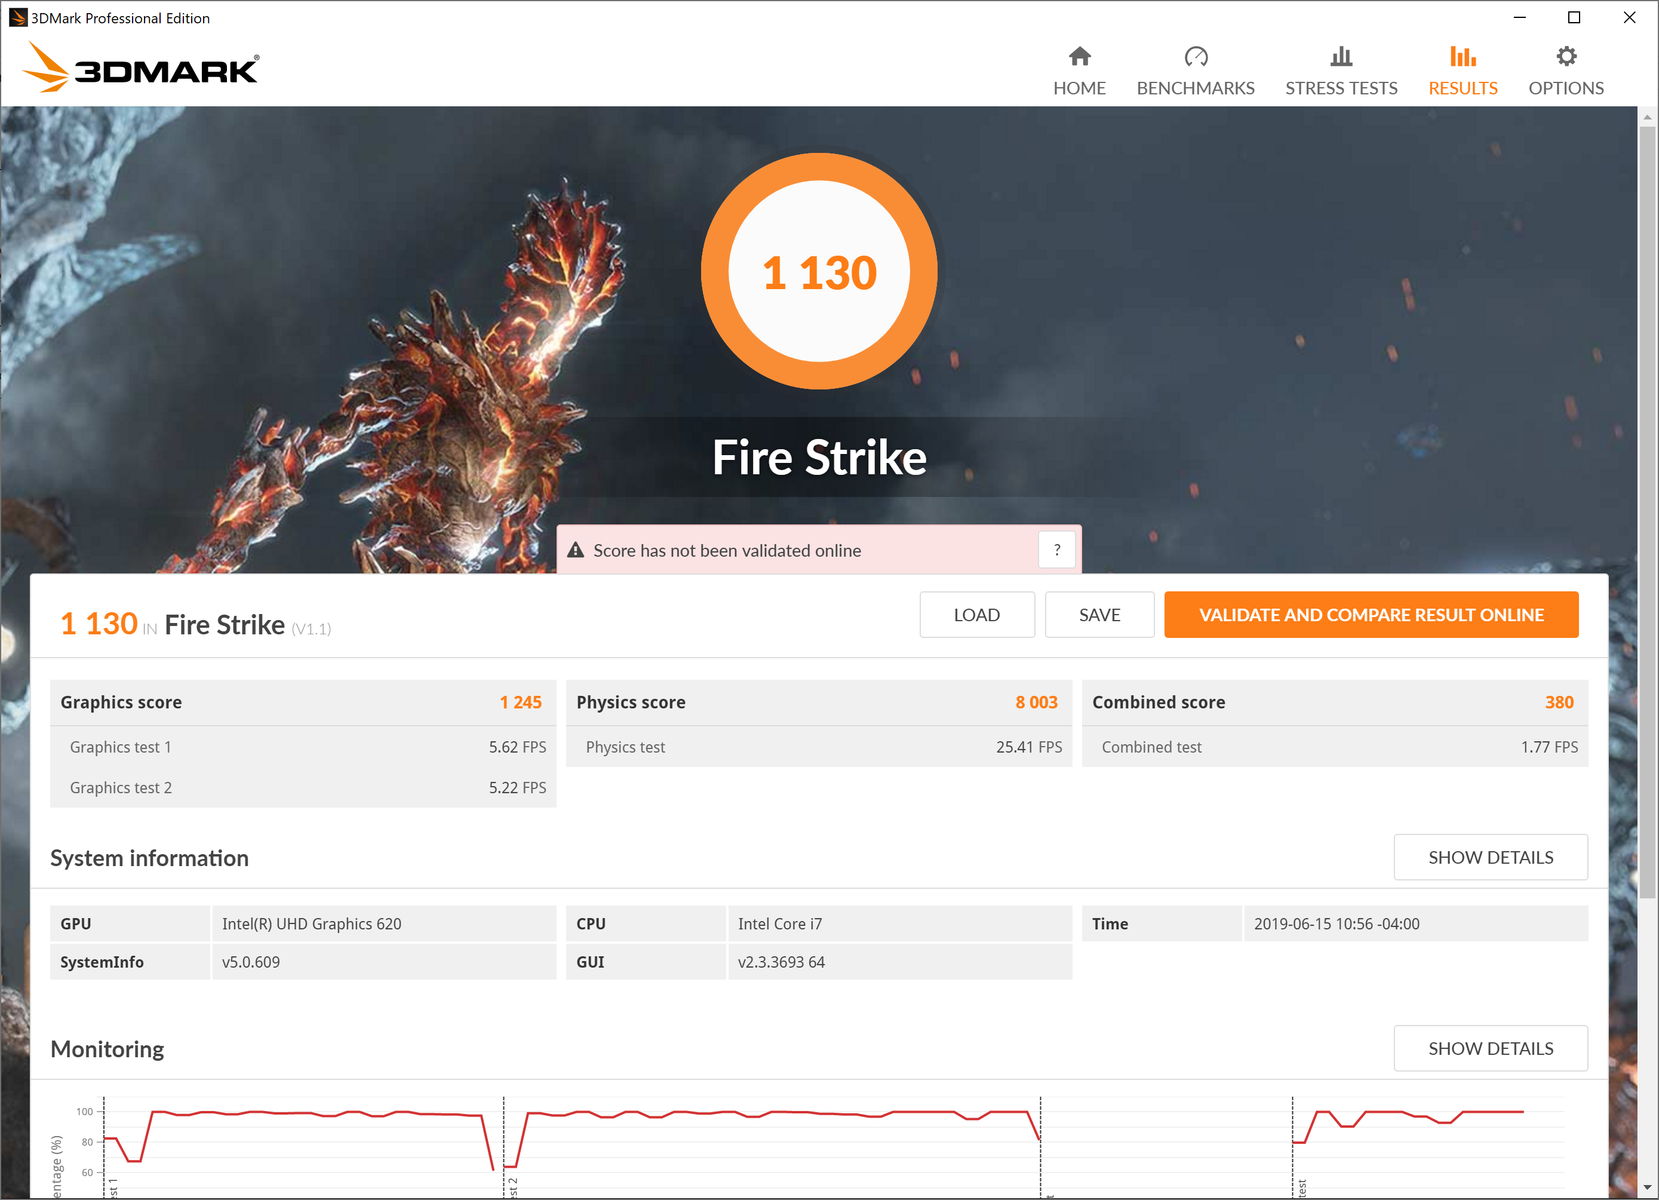
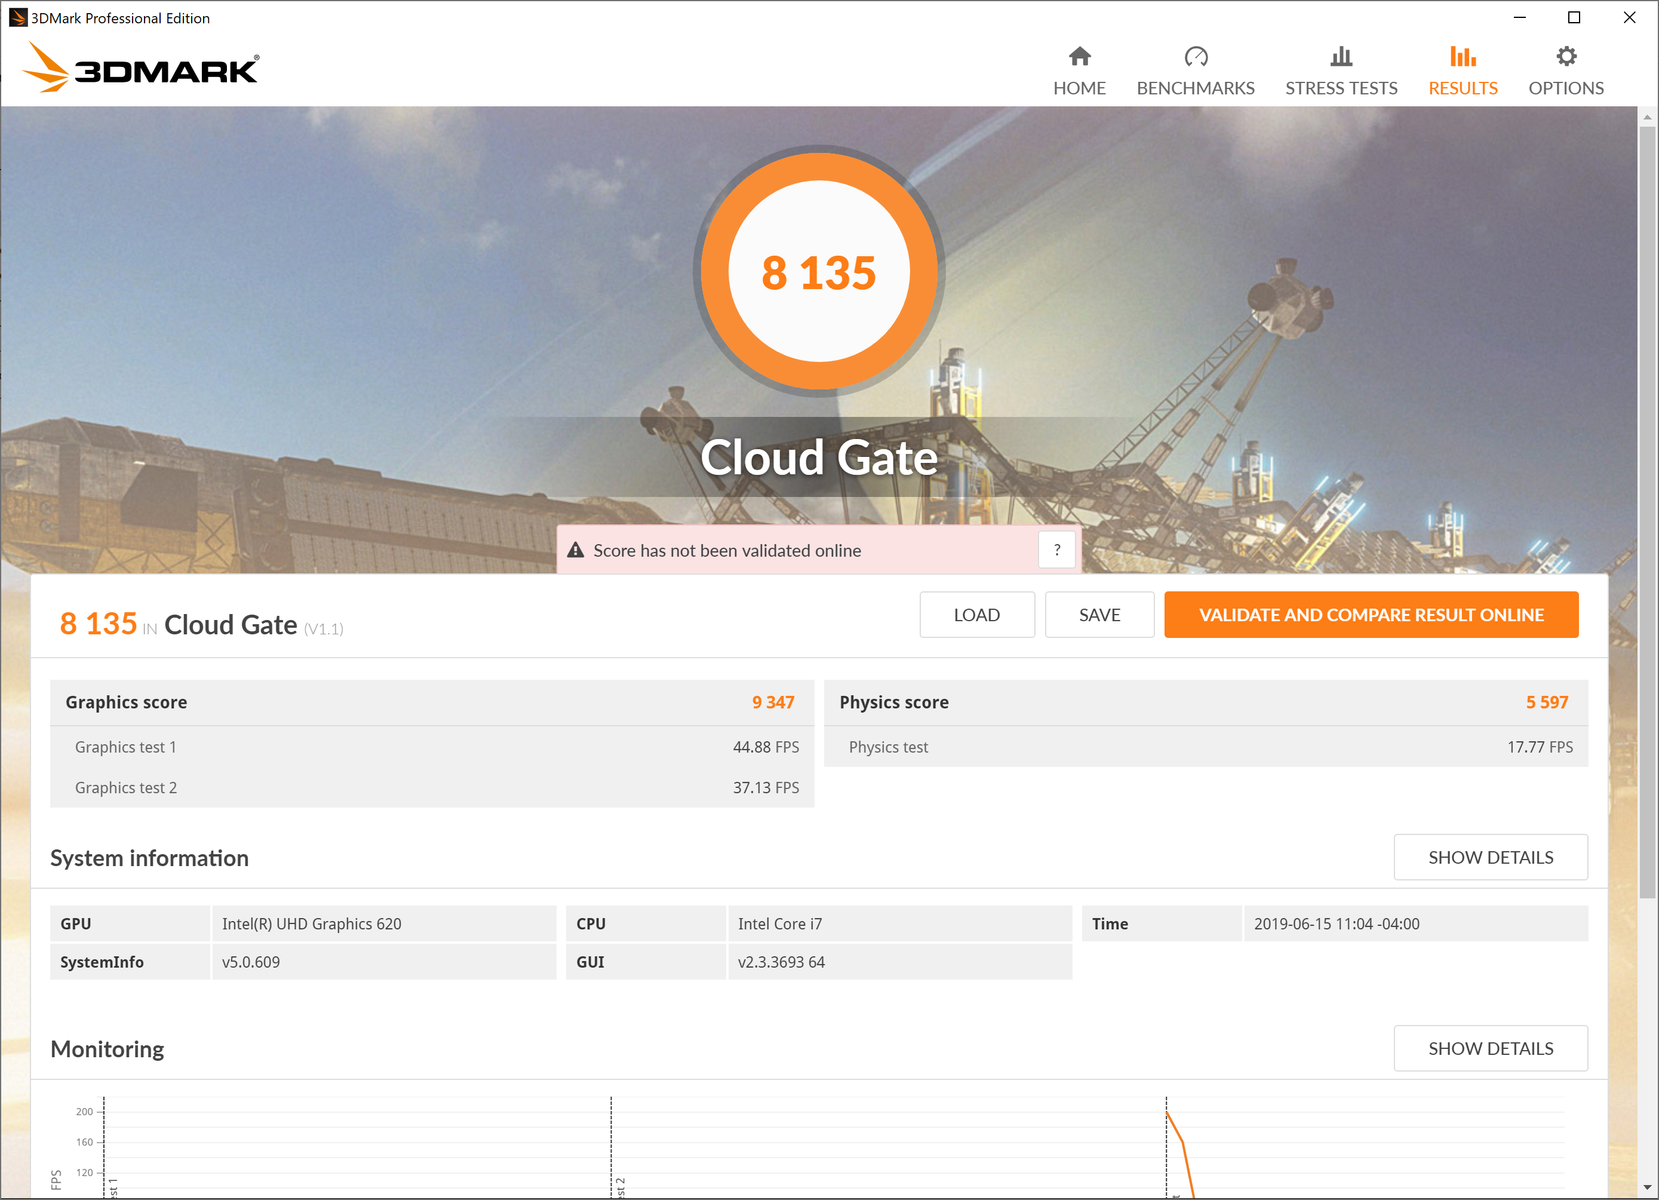
3DMark Fire Strike Graphics still scores the S940 a respectable 1245 points, and it receives a Cloud Gate Graphics score of 9347 points (just 3% behind the XPS 13’s 9582). Both the MacBook Pro 13, with its Intel Iris graphics, and the Yoga 530 (again, with its RX Vega 10) are miles ahead in all of these benchmarks, of course.
Needless to say, the S940 isn’t really meant for gaming; only older games will run at lower resolutions and settings.
| 3DMark 11 Performance | 1987 points | |
| 3DMark Cloud Gate Standard Score | 8135 points | |
| 3DMark Fire Strike Score | 1130 points | |
Help | ||
| low | med. | high | ultra | |
|---|---|---|---|---|
| BioShock Infinite (2013) | 70 | 35 | 27 | 8 |
| Metro: Last Light (2013) | 41 | |||
| Rise of the Tomb Raider (2016) | 16 | 11 | 6 |
Emissions
System Noise
The IdeaPad S940 greatly favors quiet operation over CPU performance, and our fan noise measurements corroborate this. Idle operation is practically silent—equal to environmental noise levels on average, and at maximum, 31.3 dB(A). But even under load, the machine is fairly quiet: whereas, for instance, the XPS 13 reaches 46.8 dB(A) under max load, the IdeaPad never budges beyond 34.3 dB(A). For those who don’t necessarily require top-end CPU performance, but frequently sit in boardrooms, classrooms, or other such quiet environments, this might be a serious advantage. However, it’d be nice to be able to switch profiles on the fly to prioritize performance at the expense of tranquility when needed.
Noise level
| Idle |
| 28.3 / 28.3 / 31.3 dB(A) |
| Load |
| 34.3 / 34.3 dB(A) |
 | ||
30 dB silent 40 dB(A) audible 50 dB(A) loud |
||
min: | ||
Temperature
As we discovered in the previous section, the IdeaPad works as hard as possible to avoid running its fans at all costs. This means that if it has to reduce CPU performance or allow surface temperatures to rise noticeably, so be it. While idling, average temperatures already reach a rather high 8.7 °C and 10.4 °C above room temperatures on top/bottom respectively (30.9 °C / 32.6 °C). That’s well above the XPS 13, whose idle temps are just 3.3 °C and 6.6 °C above ambient levels in those same areas. In fact, it’s by far the warmest relative idle temperature readings of every machine in our comparison field—with the exception of the Yoga C930, which comes close (6.9 °C / 9.1 °C above ambient temps).
Under load, we measure 37.1 °C / 37.3 °C on top/bottom, a value which is much closer to the differential that we see from laptops like the XPS 13—but the approach to temperature mitigation is different; while the XPS is getting very noisy to maintain such thermal readings, the IdeaPad is cooling its jets and reducing clock rates more aggressively to reduce the thermal load. We’ll see this spelled out in the next section.
Stress Test
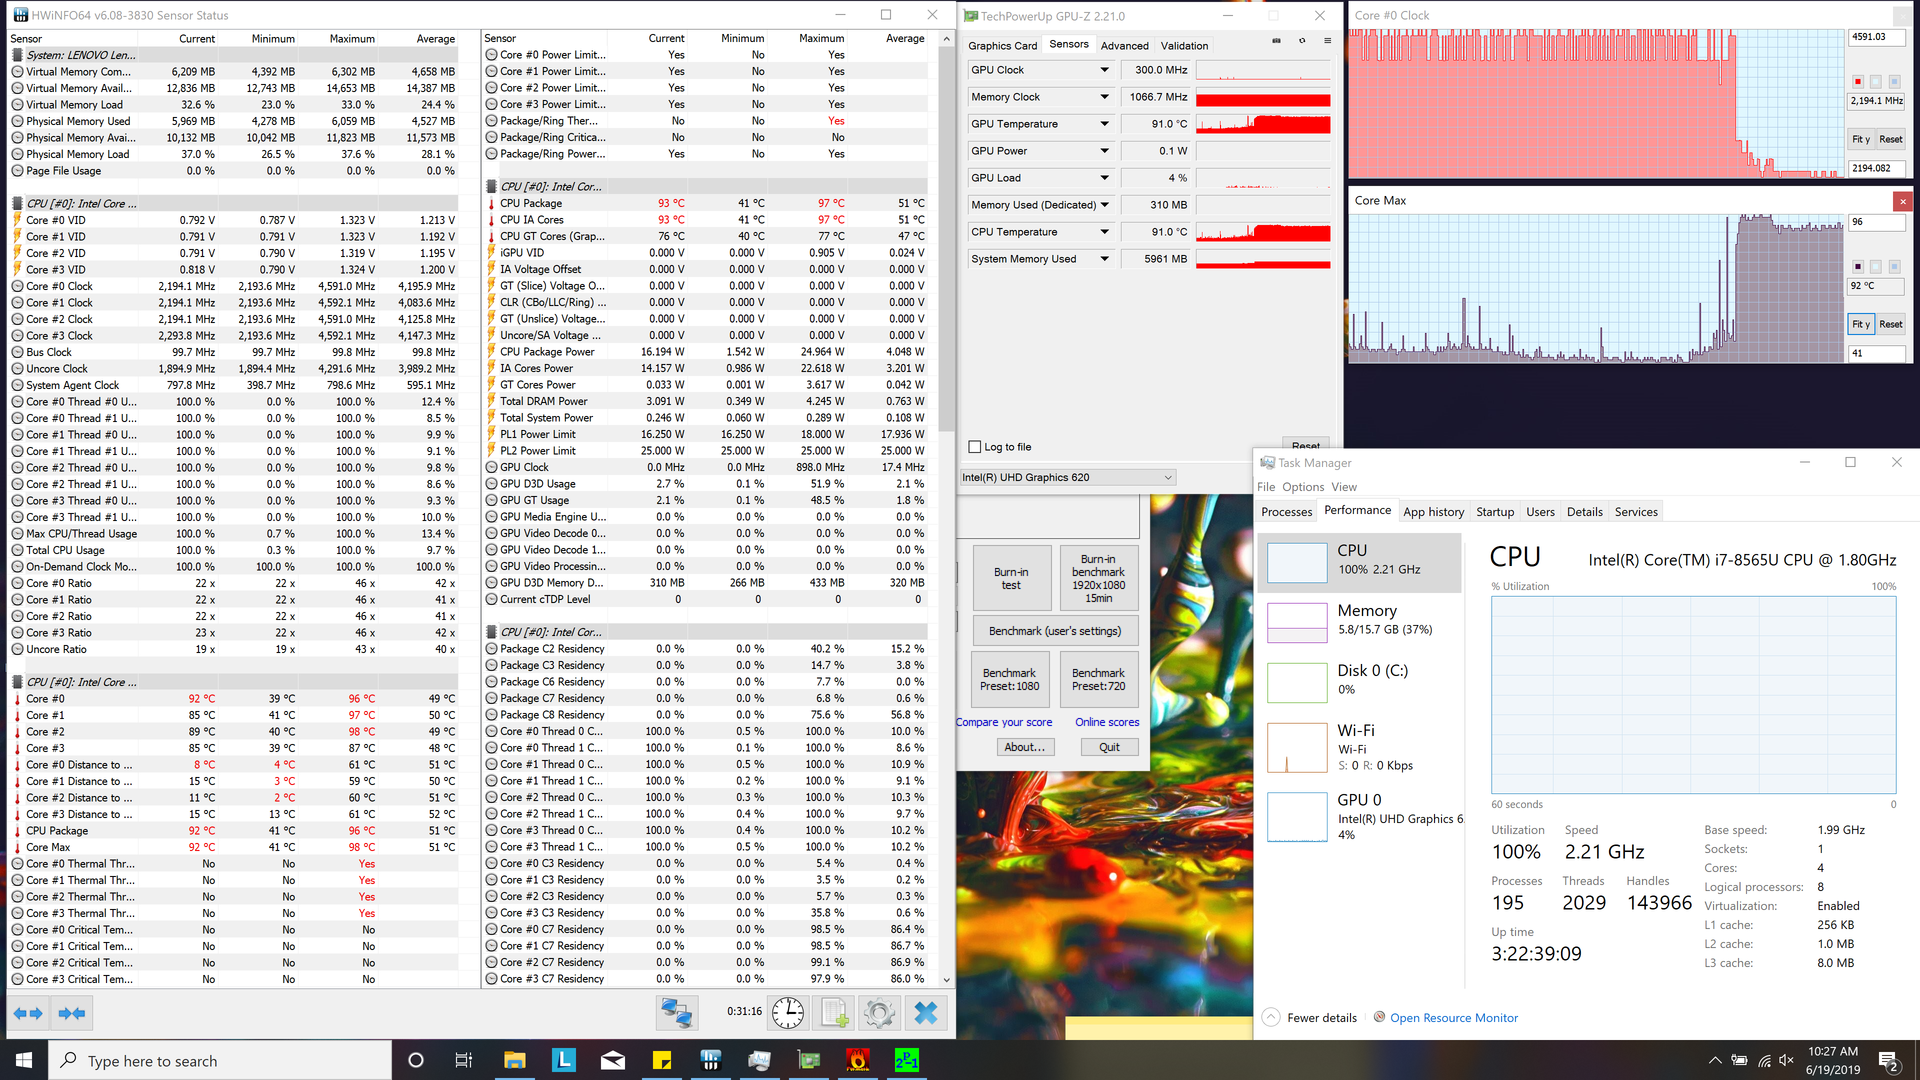
After taking a look at our stress testing results, it’s clear that our assumptions about the cooling behavior (or, rather, in this case, the thermal mitigation behavior) are correct. Under full CPU stress, the Dell XPS 13 9380 rockets to 100 °C, then kicks its cooling system into high gear under heavy stress to drop temperatures back into the 70s, and repeats the cycle. But the IdeaPad S940 watches the increase to around 90 °C without blinking an eye, then slashes its clock rates all the way from 4.5 GHz down to around 2.7 GHz, at which point it continues to fade further down into the 2.2 GHz range (as even the reduction to 2.7 GHz can’t sufficiently cool the machine). Chip temperatures never again drop below 90 °C, instead remaining near 92 °C.
GPU stress sees clock rates around the 850 MHz mark, which is above the 300 MHz base rate but quite a bit below the 1150 MHz theoretical max. (HWiNFO didn’t have a proper field for GPU clock rates for our test system, so the best way to visualize where the start of stress begins is by looking for the chip temperature rise near the center of the graph. It ultimately stabilizes around the 71 °C mark.)
Combined stress, as we’d expect, absolutely lays waste to the CPU performance, starting at just 1.2 GHz and dropping further and further until it stabilizes well below the base clock rate at 698 MHz. This is technically throttling, since the base clock rate for the CPU is 1.8 GHz. The GPU manages to maintain a clock rate at least above base frequency at 550 MHz (though since the base frequency is just 300 MHz, it’s a comparatively easier task).
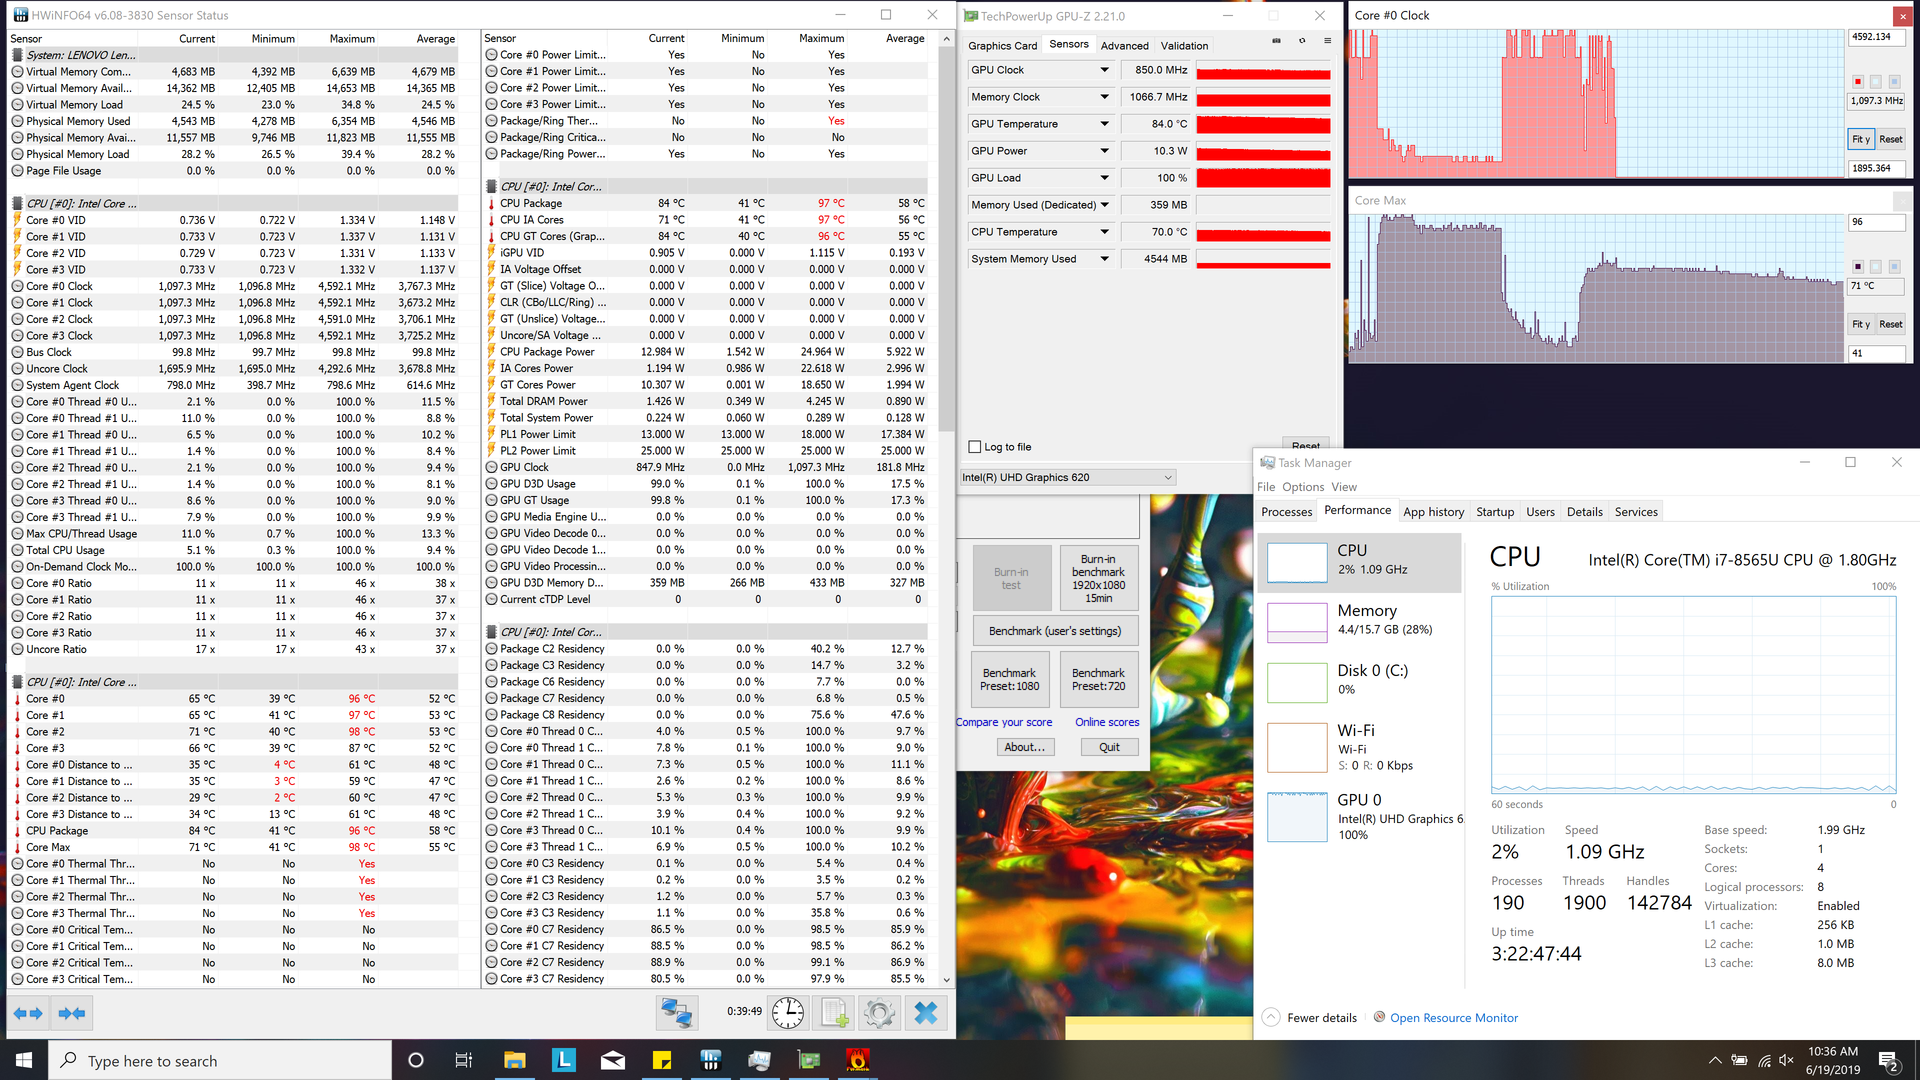
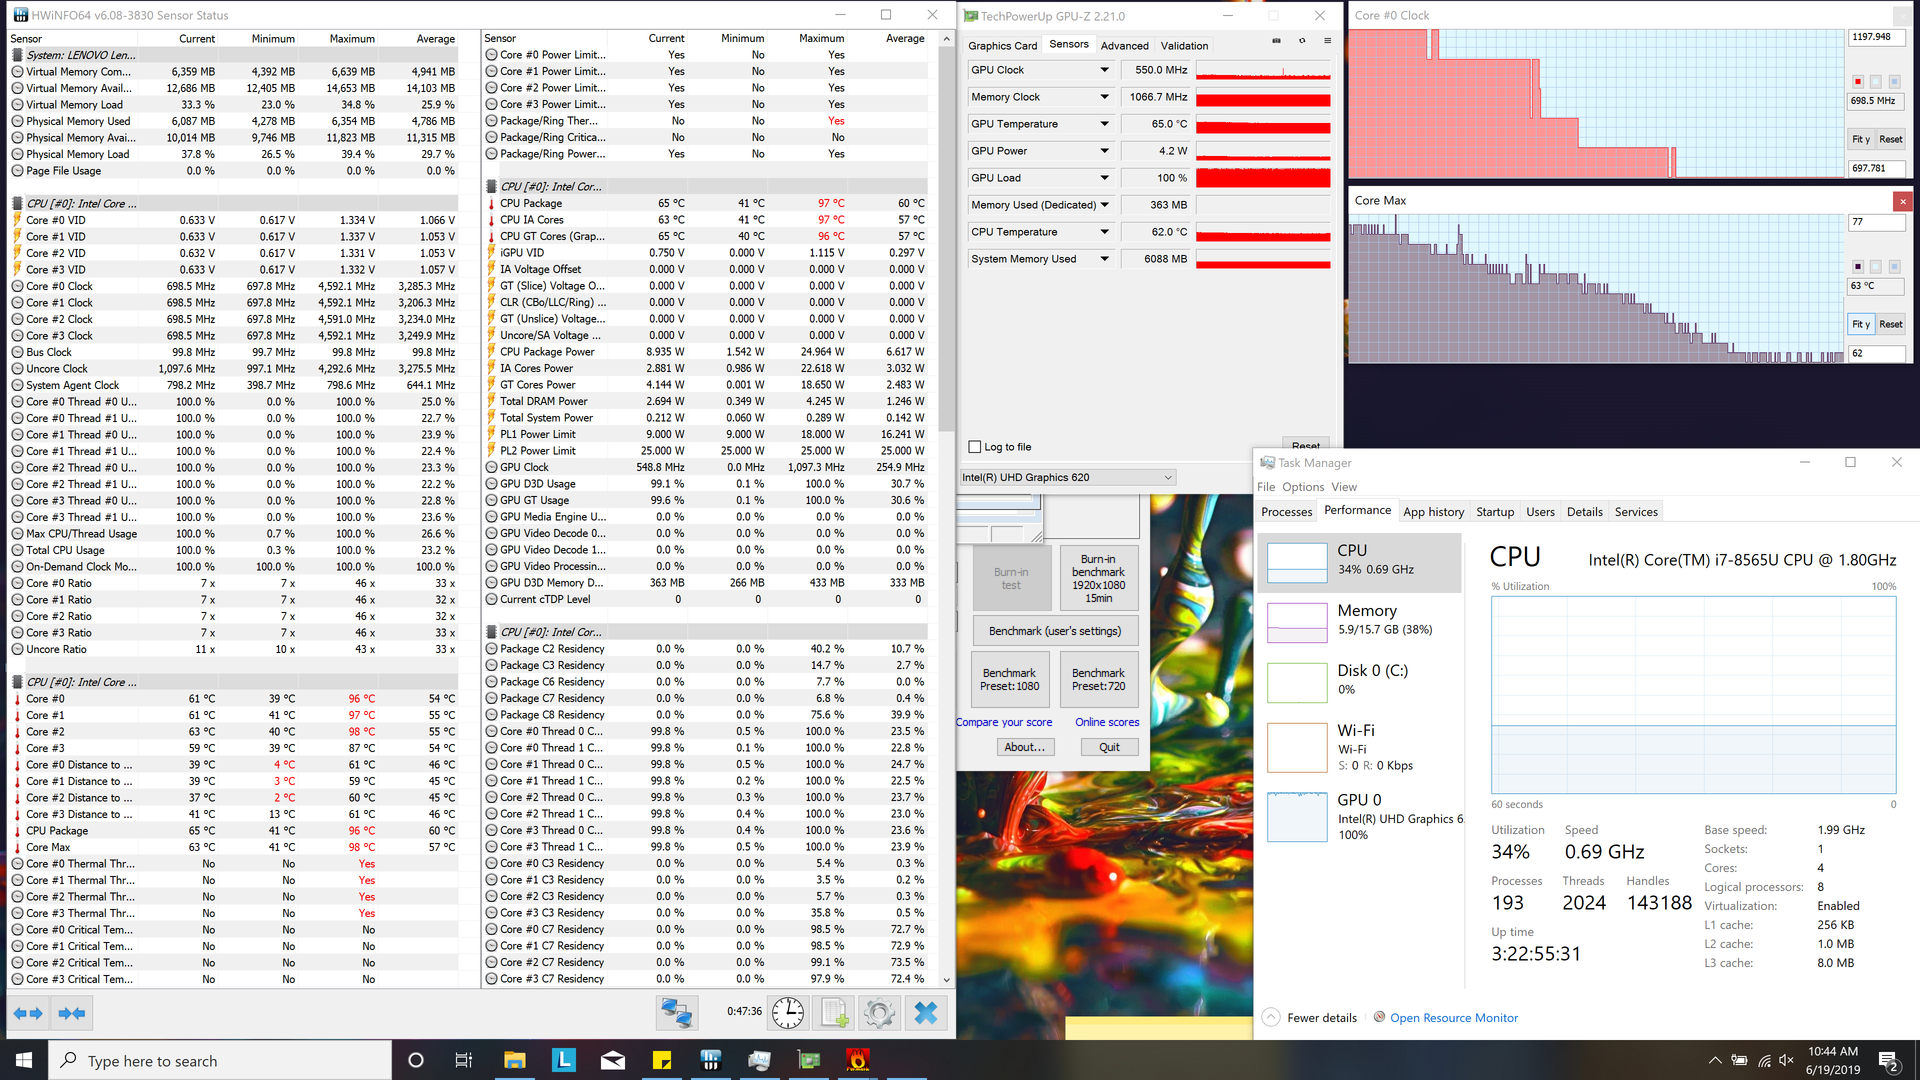
| CPU Clock (GHz) | GPU Clock (MHz) | Average CPU Temperature (°C) | Average GPU Temperature (°C) | |
| Prime95 Stress | 2.2 | - | 92 | - |
| FurMark Stress | - | 850 | - | 71 |
| Prime95 + FurMark Stress | 0.7 | 550 | 63 | 63 |
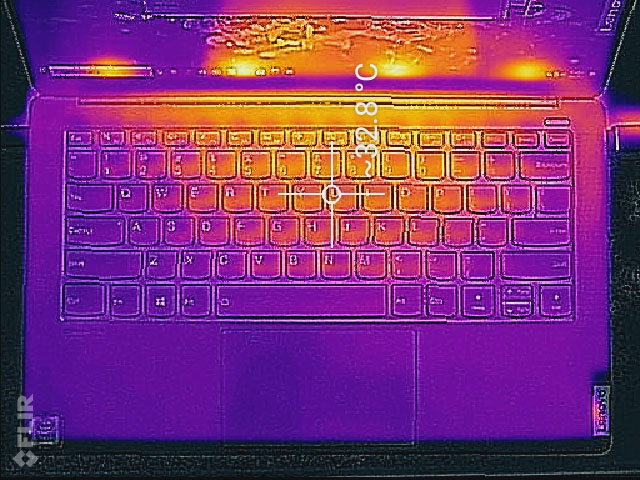
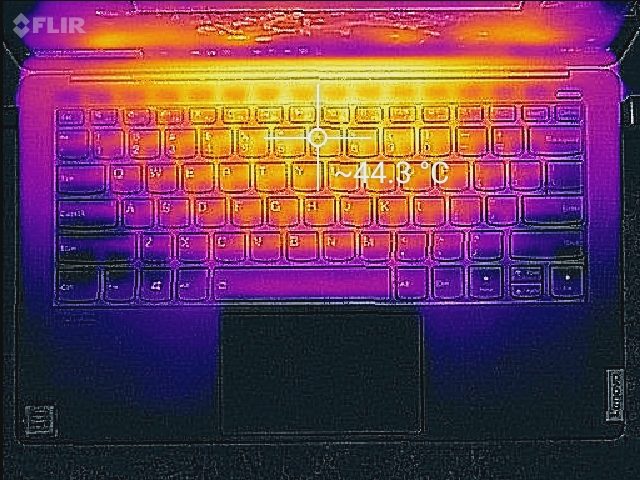
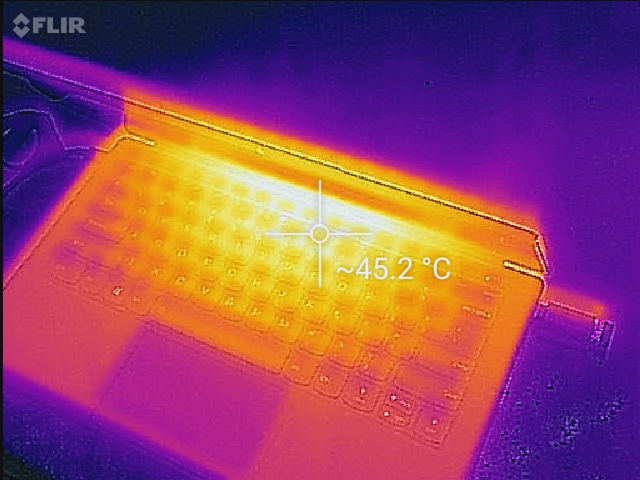
(±) The maximum temperature on the upper side is 43.8 °C / 111 F, compared to the average of 35.9 °C / 97 F, ranging from 21.4 to 72.4 °C for the class Subnotebook.
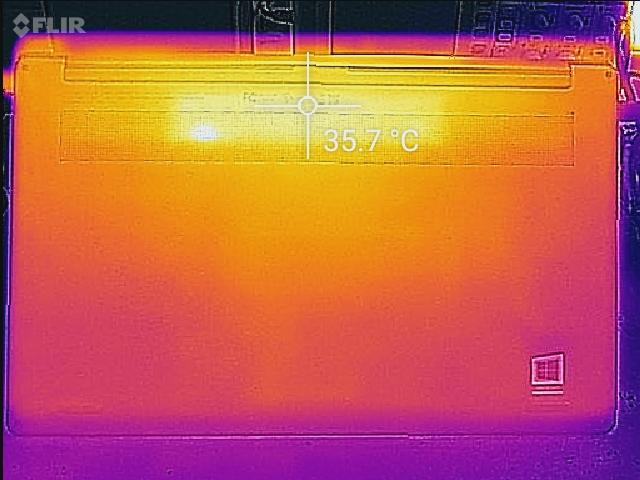
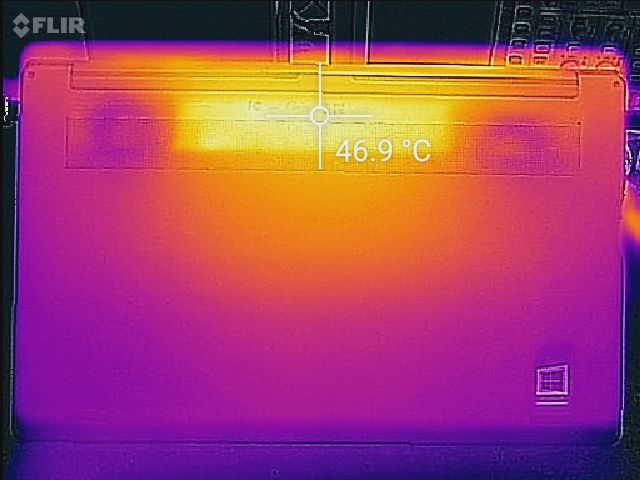
(-) The bottom heats up to a maximum of 47 °C / 117 F, compared to the average of 39.3 °C / 103 F
(+) In idle usage, the average temperature for the upper side is 30.9 °C / 88 F, compared to the device average of 30.8 °C / 87 F.
(+) The palmrests and touchpad are reaching skin temperature as a maximum (34 °C / 93.2 F) and are therefore not hot.
(-) The average temperature of the palmrest area of similar devices was 28.2 °C / 82.8 F (-5.8 °C / -10.4 F).
Speakers

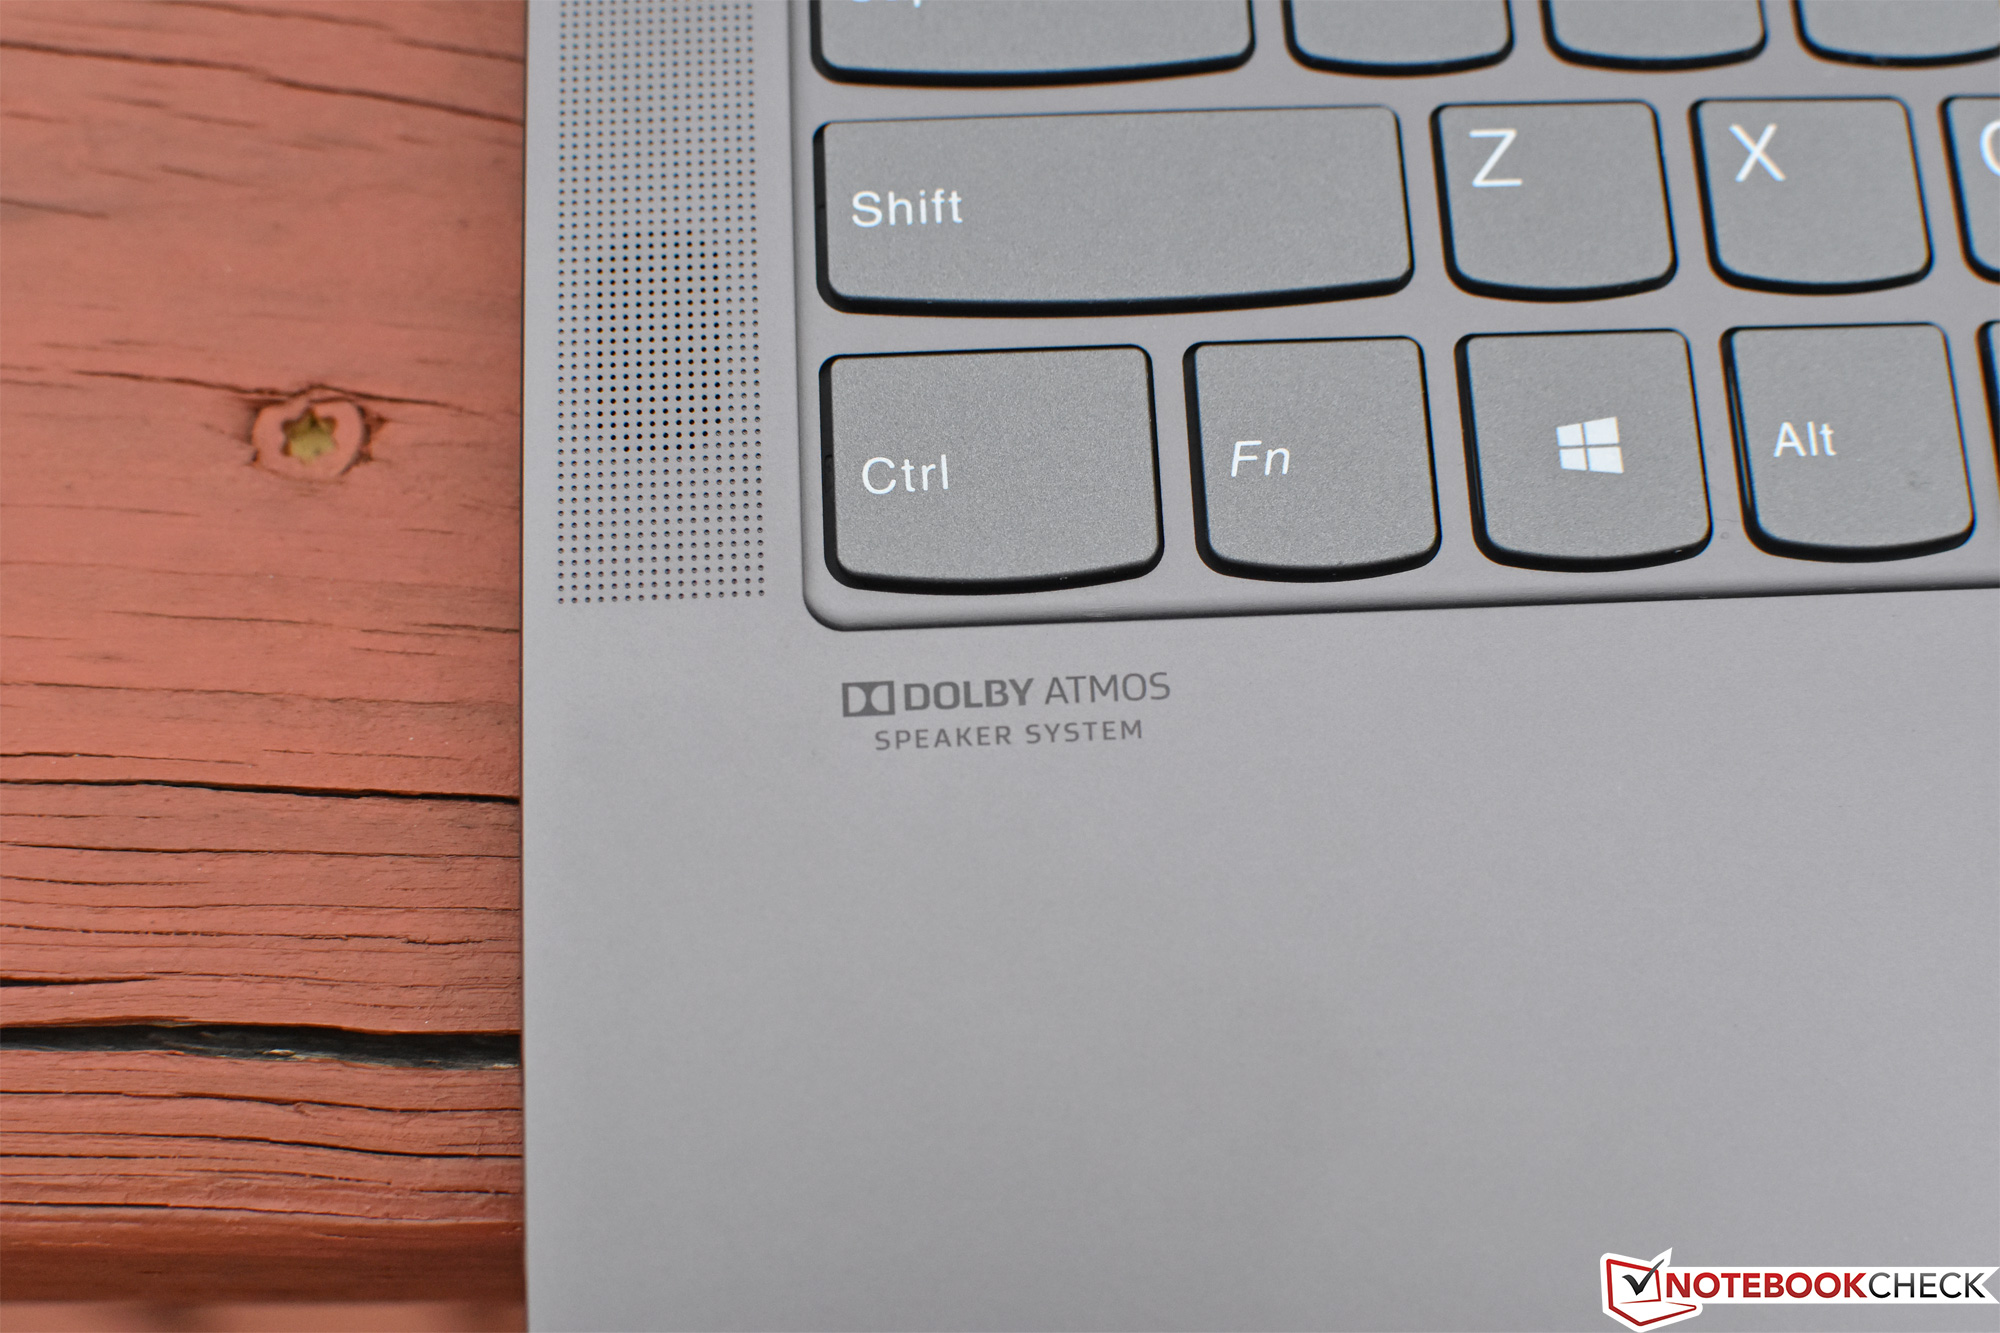
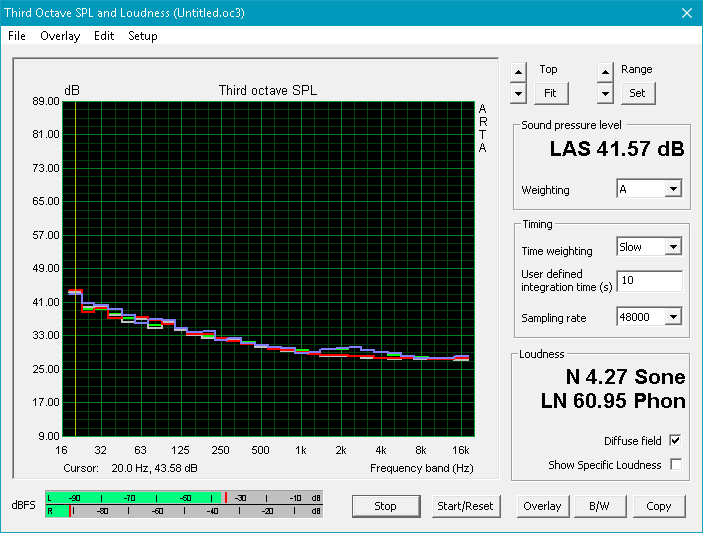
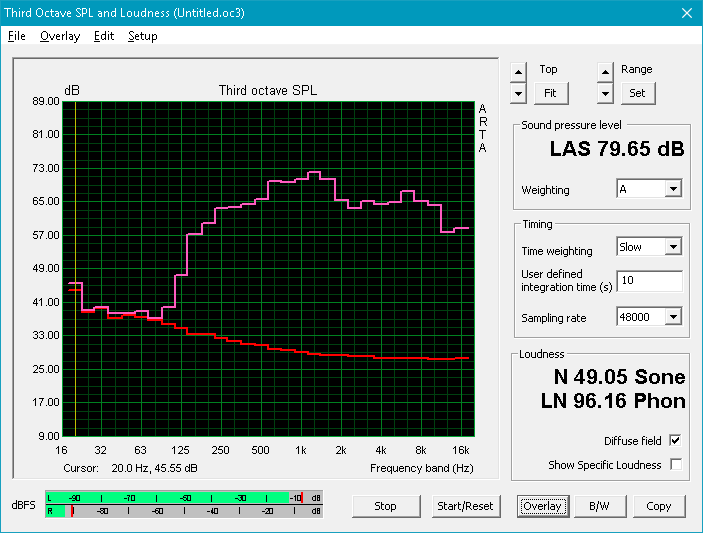
The IdeaPad S940 features four Dolby Atmos speakers, 2 W apiece. This results in substantially better audio performance than nearly every other laptop of its size. We measure 79.65 dB of volume, which is quite good. Bass is lower than ideal, of course, but it’s much better than (for instance) the XPS 13. Balance and linearity across the mids and highs are very good—just 4 to 5% away from the median on average. And the overall sound is linear, as well, with only a 12.9% difference from the median (versus the XPS 13’s 27.5%). That’s an impressive result for such a tiny device.
All of the other competitors perform comparably to the XPS. The S940 is truly in a league of its own in audio quality.
Lenovo IdeaPad S940-14IWL audio analysis
(±) | speaker loudness is average but good (79.7 dB)
Bass 100 - 315 Hz
(±) | reduced bass - on average 9.2% lower than median
(±) | linearity of bass is average (12.3% delta to prev. frequency)
Mids 400 - 2000 Hz
(+) | balanced mids - only 4% away from median
(+) | mids are linear (5.4% delta to prev. frequency)
Highs 2 - 16 kHz
(+) | balanced highs - only 0.9% away from median
(+) | highs are linear (4.2% delta to prev. frequency)
Overall 100 - 16.000 Hz
(±) | linearity of overall sound is average (15.2% difference to median)
Compared to same class
» 34% of all tested devices in this class were better, 5% similar, 61% worse
» The best had a delta of 5%, average was 18%, worst was 53%
Compared to all devices tested
» 21% of all tested devices were better, 4% similar, 75% worse
» The best had a delta of 4%, average was 24%, worst was 134%
Dell XPS 13 9380 i7 4K audio analysis
(±) | speaker loudness is average but good (75.3 dB)
Bass 100 - 315 Hz
(-) | nearly no bass - on average 18.5% lower than median
(±) | linearity of bass is average (8.1% delta to prev. frequency)
Mids 400 - 2000 Hz
(±) | higher mids - on average 7.7% higher than median
(±) | linearity of mids is average (11.5% delta to prev. frequency)
Highs 2 - 16 kHz
(±) | higher highs - on average 6.2% higher than median
(±) | linearity of highs is average (10.5% delta to prev. frequency)
Overall 100 - 16.000 Hz
(±) | linearity of overall sound is average (28.5% difference to median)
Compared to same class
» 90% of all tested devices in this class were better, 2% similar, 8% worse
» The best had a delta of 5%, average was 18%, worst was 53%
Compared to all devices tested
» 86% of all tested devices were better, 3% similar, 12% worse
» The best had a delta of 4%, average was 24%, worst was 134%
Energy Management
Power Consumption
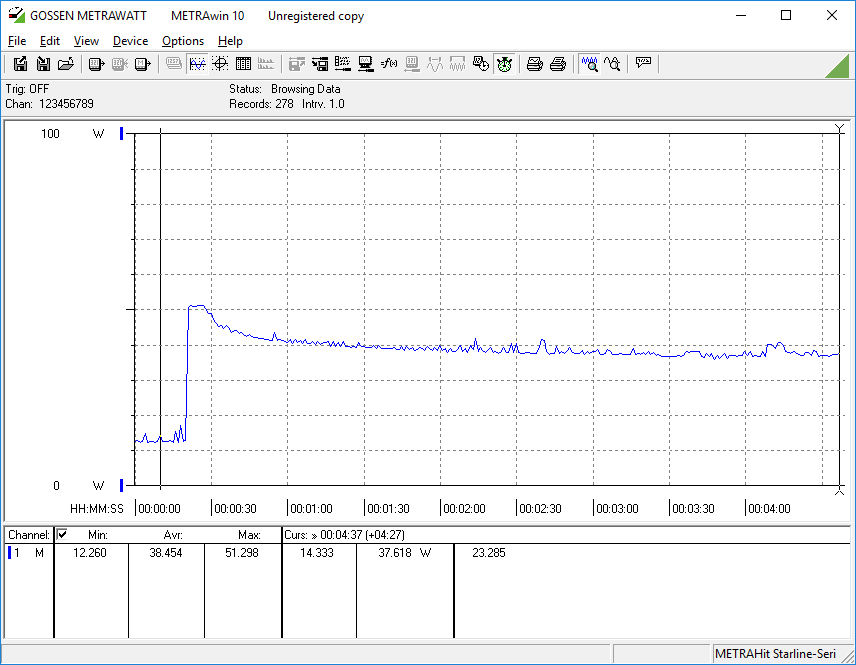
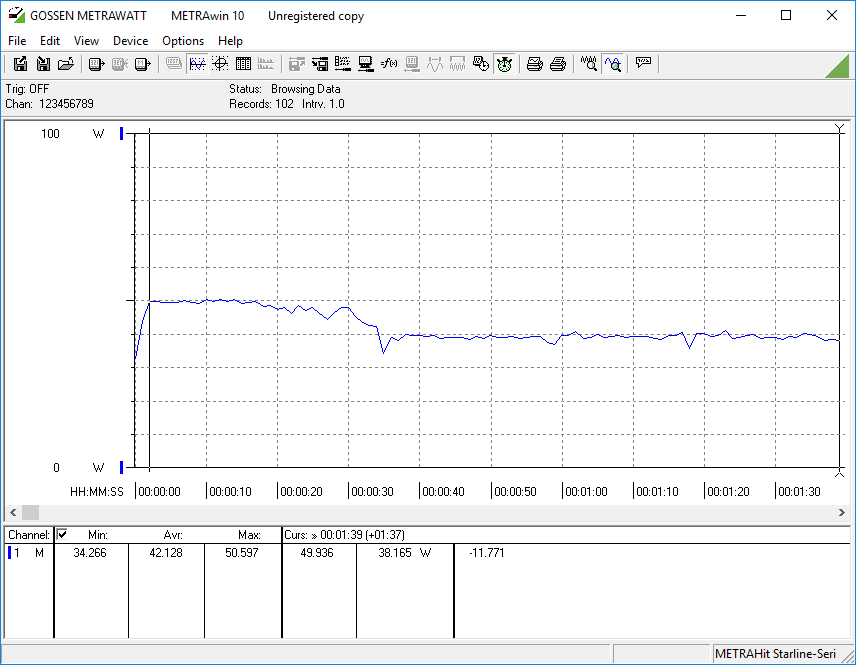
Probably partially thanks to its stunning 4K display, the S940 posts higher than average power consumption values relative to its direct competitors. Even while idling, the machine uses 10.2 W average, which is some 16% above that of the next highest consumer, the XPS 13 (8.6 W). Under load, this usage increases to 42.1 W average (less than the XPS thanks to lower clock rates and fan speeds over sustained load periods), with a maximum of 53.6 W. The MacBook Pro and Yoga C930 outstrip these load measurements, but they also perform better correspondingly.
| Off / Standby | |
| Idle | |
| Load |
|
Key:
min: | |
| Lenovo IdeaPad S940-14IWL i7-8565U, UHD Graphics 620, Samsung SSD PM981 MZVLB512HAJQ, IPS, 3840x2160, 14" | Dell XPS 13 9380 i7 4K i7-8565U, UHD Graphics 620, Samsung SSD PM981 MZVLB512HAJQ, IPS, 3840x2160, 13.3" | Apple MacBook Pro 13 2018 Touchbar i5 i5-8259U, Iris Plus Graphics 655, , IPS, 2560x1600, 13.3" | Asus ZenBook 13 UX333FA i5-8265U, UHD Graphics 620, WDC PC SN520 SDAPNUW-256G, IPS, 1920x1080, 13.3" | Lenovo Yoga C930-13IKB 81C4 i5-8550U, UHD Graphics 620, SK hynix PC401 HFS256GD9TNG, IPS, 1920x1080, 13.9" | Lenovo Yoga 530-14ARR-81H9000VGE R7 2700U, Vega 10, SK hynix BC501 HFM256GDHTNG, IPS, 1920x1080, 14" | |
|---|---|---|---|---|---|---|
| Power Consumption | 7% | 4% | 38% | 6% | 24% | |
| Idle Minimum * (Watt) | 5.2 | 5.2 -0% | 2.3 56% | 1.6 69% | 3.4 35% | 4.3 17% |
| Idle Average * (Watt) | 10.2 | 8.6 16% | 8.7 15% | 4.6 55% | 7.5 26% | 6.4 37% |
| Idle Maximum * (Watt) | 11.9 | 10.5 12% | 12.2 -3% | 7.3 39% | 11.8 1% | 7.8 34% |
| Load Average * (Watt) | 42.1 | 44.2 -5% | 53.3 -27% | 37.9 10% | 47.7 -13% | 34 19% |
| Load Maximum * (Watt) | 53.6 | 47.5 11% | 64 -19% | 44.8 16% | 63.2 -18% | 47.8 11% |
* ... smaller is better
Battery Life
Unfortunately, the S940 suffers surprisingly short battery life in spite of its fairly standard battery capacity of 52 Wh. Our Wi-Fi Surfing benchmark resulted in just 4 hours and 59 minutes total runtime, which is 55% below the XPS 13’s 7 hours and 44 minutes and nearly half that of the MacBook Pro 13 and Asus ZenBook 13. Since screen brightness is held close to constant across all models in this test, the bright display can’t serve as a valid excuse here. This, perhaps more than anything else, could be a deal-breaker for those looking to snag a laptop for long days at work or school.
It’s probably a safe assumption that the FHD display should result in significantly better battery runtimes. While the UHD display truly is a thing of beauty, unless battery life simply isn’t a concern, we’d highly recommend considering saving the cash and downgrading to that panel option instead.
| Lenovo IdeaPad S940-14IWL i7-8565U, UHD Graphics 620, 52 Wh | Dell XPS 13 9380 i7 4K i7-8565U, UHD Graphics 620, 52 Wh | Apple MacBook Pro 13 2018 Touchbar i5 i5-8259U, Iris Plus Graphics 655, 58 Wh | Asus ZenBook 13 UX333FA i5-8265U, UHD Graphics 620, 50 Wh | Lenovo ThinkPad X1 Carbon 2018-20KGS5DU00 i5-8550U, UHD Graphics 620, 57 Wh | Lenovo Yoga C930-13IKB 81C4 i5-8550U, UHD Graphics 620, 60 Wh | Lenovo Yoga 530-14ARR-81H9000VGE R7 2700U, Vega 10, 45 Wh | |
|---|---|---|---|---|---|---|---|
| Battery runtime | 54% | 94% | 119% | 80% | 122% | 28% | |
| Reader / Idle (h) | 8.4 | 27.8 231% | 11.7 39% | ||||
| WiFi v1.3 (h) | 5 | 7.7 54% | 9.7 94% | 9.9 98% | 9 80% | 11.1 122% | 6.7 34% |
| Load (h) | 1.7 | 2.2 29% | 1.9 12% | ||||
| Witcher 3 ultra (h) | 1.6 |
Pros
Cons
Verdict
The IdeaPad S940 is an absolutely gorgeous device. It’s one of the smallest and lightest 14-inch laptops we’ve reviewed to date, and it would fit fairly well on both a kitchen table or in a boardroom. But while it’s tiny, it still feels relatively sturdy in its build, with a rigid display lid, perfectly-tuned hinges, and very little flex across the breadth of the case. It also is host to one of the most impressive—and incredibly bright—4K HDR displays we’ve seen in a laptop. Supplementing that display are not two, but four deceptively powerful Dolby Atmos speakers as well… and while physics remains an inevitable constraint, they provide an audio experience that far exceeds that of practically any other laptop of its size. It’s almost silent under nearly all conditions, and barely audible even under load. And finally, in spite of its thinness, the input devices are fairly decent also—with a very good glass clickpad accompanying a shallow but still serviceable keyboard.
The IdeaPad S940 is a beautiful laptop that, as configured (with the 4K display and Core i7 CPU), makes a few crucial missteps that render it difficult to recommend for most uses. We look forward to evaluating an FHD configuration with a Core i5 CPU at some point, which we hope might resolve some of these disappointments.
If only the entire package were so remarkable. Unfortunately, from here, things take a turn for the less impressive. Port selection is somewhat thin, with two Thunderbolt 3.0 ports (no dedicated charging port) alongside just one other USB Type-C port and a headset jack. Power consumption is on the high side and battery life is disappointingly short—with under 5 hours measured in our web surfing benchmark. But most troubling of all is the machine’s unwillingness—or perhaps inability—to properly cool itself: sustained loads result in temperatures climbing quickly into the 90s centigrade, after which point they never recover lower. The result is below average CPU performance for the Core i7 chip on our review unit. But the laptop is equally uninterested in cooling itself while idling and under normal usage—a negligence which results in much higher than normal idle surface temperatures and less-than-comfortable lap-based use in many situations.
So, unfortunately, the practical uses for the S940—at least, with the aforementioned stunning UHD display—are thinner than they otherwise could be. It’s likely that the FHD display option should appreciably improve the battery life, though we haven’t yet tested such a configuration, so we can’t say for sure. If CPU performance isn’t important, perhaps that inadequacy can be overlooked by some as well—or, again, perhaps the Core i5 might perform just as well at a much lower cost. That also might assist somewhat on the temperature front, which could improve the overall situation. As configured, though, despite its absolutely beautiful featherweight construction and display, it’s hard to recommend the $2,000 S940 over the company’s own business flagship, the X1 Carbon, or any number of other close competitors (all of whom perform better in most of these categories), such as the Dell XPS 13 or MacBook Pro 13.
Lenovo IdeaPad S940-14IWL
- 06/27/2019 v6 (old)
Steve Schardein
Price comparison
