 Deutsch
 English
 Español
 Français
 Italiano
 Nederlands
 Polski
 Português
 Русский
 Türkçe
 Svenska
 Chinese
 Magyar
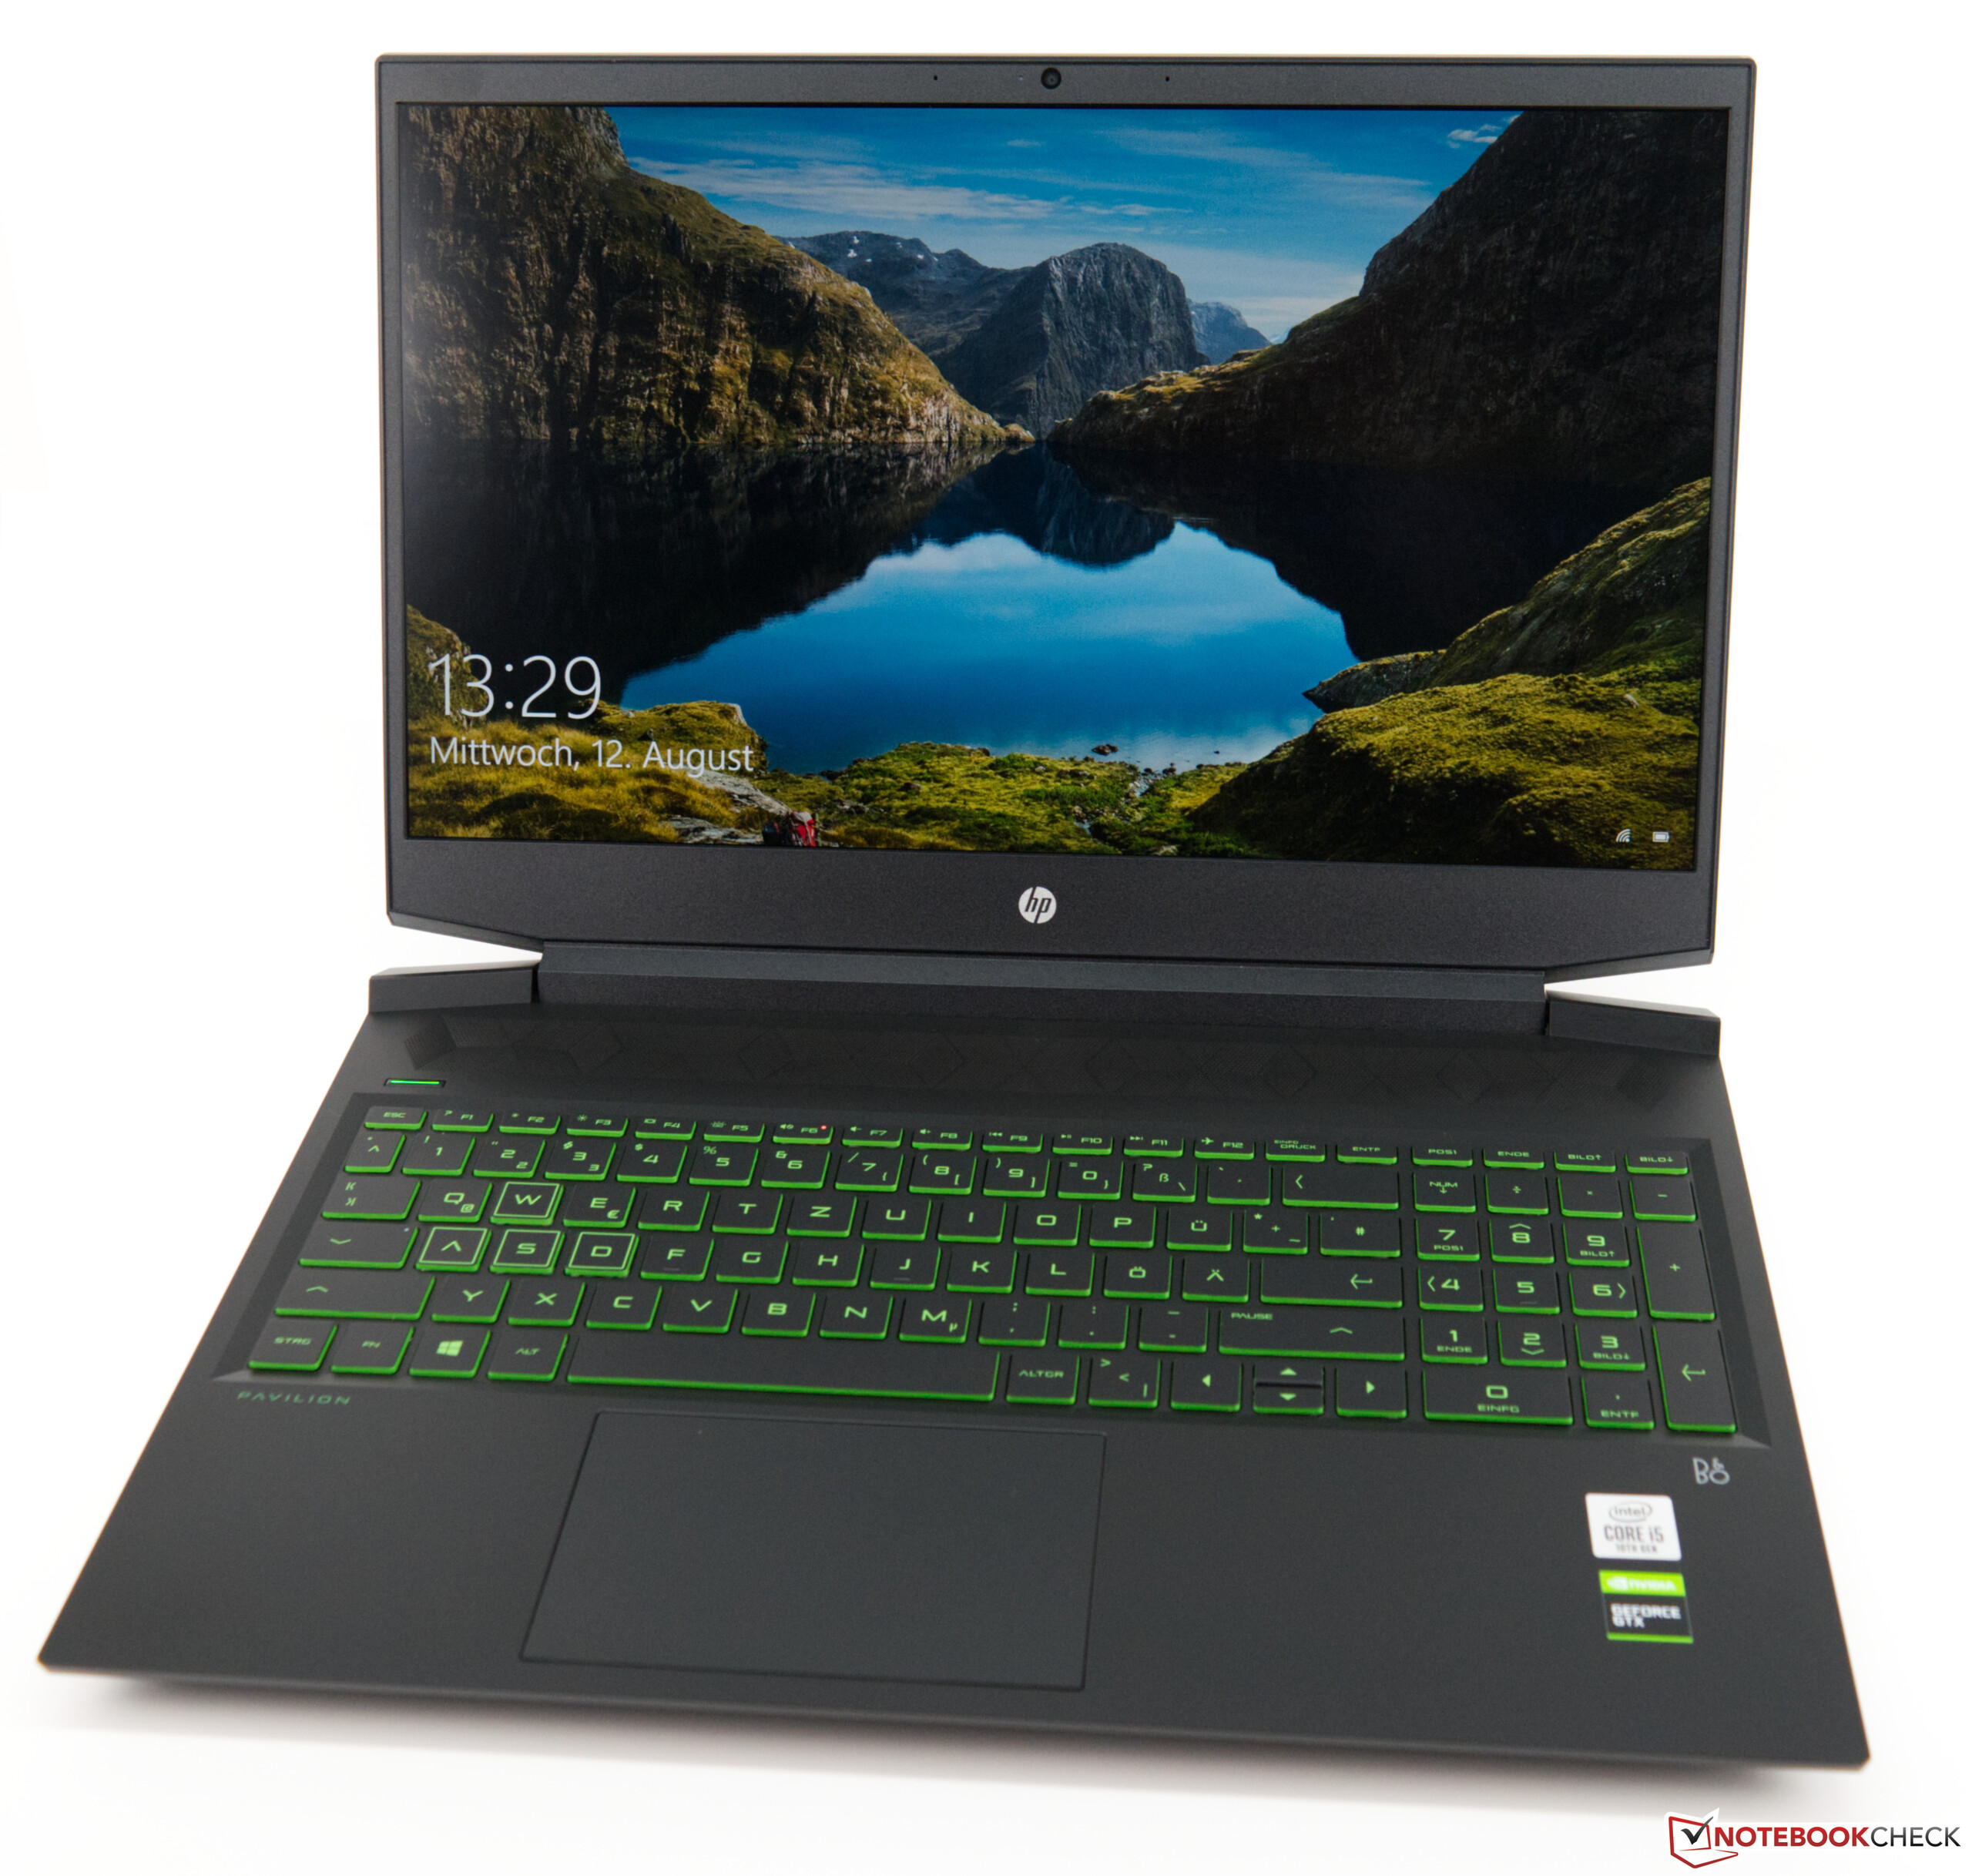
HP Pavilion Gaming 16 Laptop Review: Low-priced 16-inch laptop with a GeForce GPU
The Pavilion-branded gaming laptops from HP offer a great level of performance at a low price. This holds true for the Pavilion Gaming 16, which we have in our test lab right now. Our review device retails for 900 Euros (~$1,067). For this money, users will get an Intel Core i5-10300H, an NVIDIA GeForce GTX 1650 Ti, 16 GB of RAM and a 512 GB SSD.
Those who need more performance can get a configuration with a Core i7 chip and an RTX graphics card from NVIDIA. However, such a configuration will cost considerably more than 1,000 Euros (~$1,185).
For comparison purposes we included several similarly priced gaming laptops in this review, all of which you can see in the chart below.
Rating | Date | Model | Weight | Height | Size | Resolution | Best Price |
|---|---|---|---|---|---|---|---|
| 79.9 % | 08/2020 | HP Pavilion Gaming 16-a0242ng i5-10300H, GeForce GTX 1650 Ti Mobile | 2.2 kg | 23.5 mm | 16.10" | 1920x1080 | |
| 83.7 % | 06/2020 | Dell G5 15 SE 5505 P89F R7 4800H, Radeon RX 5600M | 2.4 kg | 21.6 mm | 15.60" | 1920x1080 | |
| 82.7 % | 06/2020 | Asus TUF Gaming A15 FA506IV-HN172 R7 4800H, GeForce RTX 2060 Mobile | 2.2 kg | 24.9 mm | 15.60" | 1920x1080 | |
| 82.3 % | 11/2019 | Xiaomi Mi Gaming Laptop 2019 i7-9750H, GeForce RTX 2060 Mobile | 2.6 kg | 21 mm | 15.60" | 1920x1080 | |
| 83.3 % | 07/2020 | Lenovo Legion 5 15IMH05H i5-10300H, GeForce RTX 2060 Mobile | 2.5 kg | 26.1 mm | 15.60" | 1920x1080 | |
| 79.5 % | 07/2020 | MSI Bravo 15 A4DCR R7 4800H, Radeon RX 5300M | 2 kg | 22 mm | 15.60" | 1920x1080 |
Case - Plastic everywhere
The housing is made mostly of plastic. The case of the HP Pavilion Gaming 16 comes in the black colour scheme. A few green colour accents adorn the device, making it seem less stern. There are no other case adornments. The housing is very rigid. The chassis exhibits little to no flex. The display lid is not as rigid as the chassis. However, that is not something to worry about. When poking the screen with a finger, there is no ripple effect. The hinges are not tight and allow the device to be opened with one hand. There is some slight screen-wobbling.


Because the HP Pavilion Gaming 16 is a 16.1-inch laptop, it does not offer that much more screen real estate than its 15.6-inch counterparts. When compared to other competing devices, the Pavilion Gaming 16 is slightly wider. The depth of the Pavilion Gaming 16 is slightly smaller than that of the Xiaomi Mi gaming laptop. Our review device is rather slim. Weighing in at 2.2 kg, the Pavilion Gaming 16 is one of the lightest devices in our comparison chart.
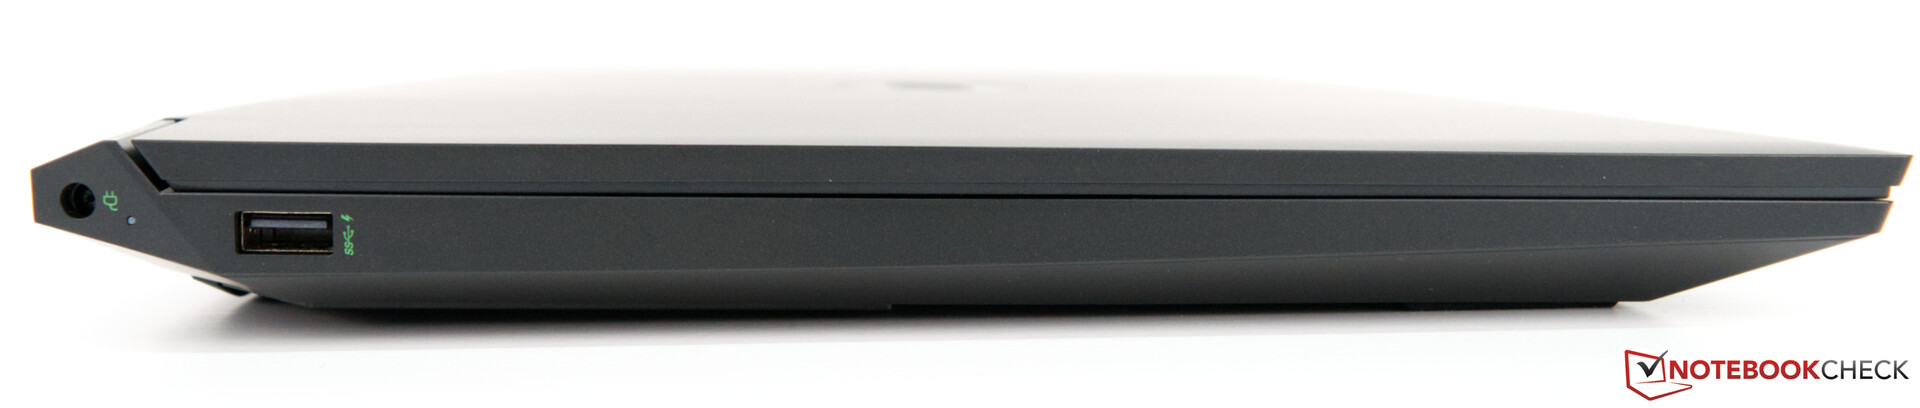
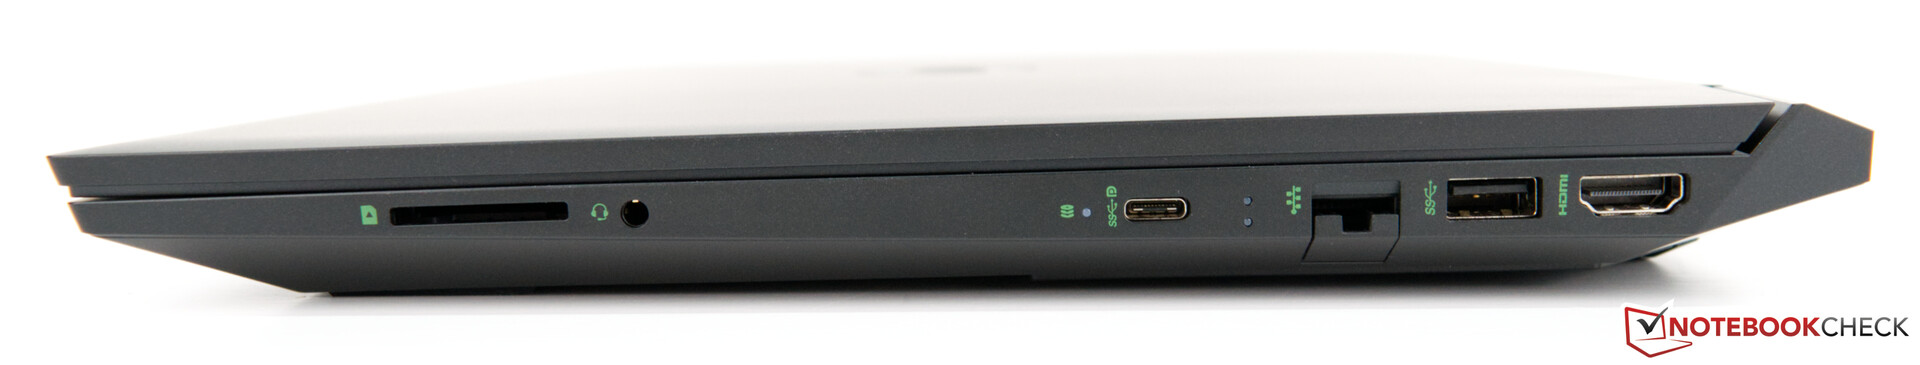
Connectivity - Only the basics
When it comes to the ports, the HP Pavilion Gaming 16 offers only the basics. All in all, there are three USB ports, one of which is a Type-C port. However, the USB-C port cannot be used with all external devices. That being said, it can output a DisplayPort signal in combination with an adapter. If users decide to game on an external display, then they will have only two USB Type-A ports at their disposal, one of which is going to be occupied by a mouse. Things are going to be much simpler if you opt to output a video signal to an external display via the HDMI port. The device also features a Gigabit Ethernet port. All the ports are located on the two sides of the Pavilion Gaming 16. Because the ports are very close to the back of the device, there should not be any problems when using a mouse right next to the laptop.
SD Card Reader
The HP Pavilion Gaming 16 comes with an SD card reader, which operates at USB 3.0 speeds. The benchmarks that we conducted with our reference-grade SD card (Toshiba Exceria Pro SDXC 64 GB UHS-II) reveal this to be the case.
| SD Card Reader | |
| average JPG Copy Test (av. of 3 runs) | |
| Average of class Gaming (19 - 202, n=99, last 2 years) | |
| Xiaomi Mi Gaming Laptop 2019 (Toshiba Exceria Pro SDXC 64 GB UHS-II) | |
| HP Pavilion Gaming 16-a0242ng (Toshiba Exceria Pro SDXC 64 GB UHS-II) | |
| Dell G5 15 SE 5505 P89F (Toshiba Exceria Pro SDXC 64 GB UHS-II) | |
| maximum AS SSD Seq Read Test (1GB) | |
| Average of class Gaming (25.8 - 269, n=93, last 2 years) | |
| HP Pavilion Gaming 16-a0242ng (Toshiba Exceria Pro SDXC 64 GB UHS-II) | |
| Xiaomi Mi Gaming Laptop 2019 (Toshiba Exceria Pro SDXC 64 GB UHS-II) | |
| Dell G5 15 SE 5505 P89F (Toshiba Exceria Pro SDXC 64 GB UHS-II) | |
Communication
Unfortunately, the Wi-Fi module does not support Wi-Fi 6. This is why the Pavilion Gaming 16 has somewhat lower data transfer rates than the devices that support Wi-Fi 6. Here our review laptop lands a spot in the middle of our compassion chart. We did not encounter any problems with wireless networking. Users can also rely on wired networking if they so choose, which works flawlessly. Here, speeds of up to 1 Gb/s are possible.
Web Camera
The integrated web camera (0.9 MP) offers a maximum resolution of 1280x720. The image quality is very poor (sharpness, detail, etc.). Moreover, there is a lot of noise under poor lighting conditions. The Delta E colour deviation of 9.44 is high. It is far away from the optimal value (Delta E less than 3).


Accessories
There are no accessories. Besides the device and the charger, users will find only a safety brochure and a warranty brochure in the box.
Maintenance
There is no maintenance hatch, which means that users will have to remove the bottom cover to gain access to the internal components, which can be upgraded or replaced if need be.
Warranty
The HP Pavilion Gaming 16 comes with a 12-month warranty. Buyers can extend the warranty duration to 36 months by purchasing a Care Pack on HP’s website, which costs about 70 Euros (~$83).
Input Devices - Usable, but with old flaws
Keyboard and Touchpad


We have already seen this chiclet-style keyboard in the somewhat bigger 17.3-inch device. All in all, the input devices are very usable and are on the same level as the rest of the competition. The keys have a short travel distance and a clear actuation point. They also put up some resistance, which is why the keyboard does not feel mushy when typing. However, the larger keys are not as well stabilised as the letter keys or the number keys on the numeric pad. After some getting used to, we did not have any problems with this keyboard. Moreover, it comes with a backlight, which offers two brightness levels.
The Pavilion Gaming 16 has a larger ClickPad than the Pavilion Gaming 17. It has the same width of 11.5 cm, but it has a depth of 7.5 cm (the Gaming 17’s trackpad had a depth of 6 cm). The larger touchpad makes much better use of the space below the keyboard. The input device fits well with the overall design. The ClickPad has a very smooth surface. We encountered some problems with accuracy at the edges of the input device. However, this did not prove to be a major issue in day-to-day use, because the trackpad offers a large surface area, which is more than sufficient for multi-touch gestures. Both hardware buttons at the bottom of the input device produce an audible click when pressed and offer a clear actuation point.
Display - 16 inches and high contrast ratio

As we already mentioned, the HP Pavilion Gaming 16 has a 16.1-inch display. It has a native resolution of 1920x1080 and a pixel density of 137 PPI.
The panel offers an average display brightness of 306 cd/m². This is the second-best result behind only the MSI Bravo 15. Thanks to a low black value and a good brightness level, the panel has a high contrast ratio. However, the HP Gaming 16 loses to the competition when it comes to response times. Here, the competing devices deliver much better results. There is some backlight bleeding at the top of the screen. The display does not suffer from PWM flickering. This makes the overall package look a bit better.
| |||||||||||||||||||||||||
Brightness Distribution: 91 %
Center on Battery: 319 cd/m²
Contrast: 1772:1 (Black: 0.18 cd/m²)
ΔE Color 4 | 0.5-29.43 Ø5, calibrated: 3.52
ΔE Greyscale 1.53 | 0.57-98 Ø5.3
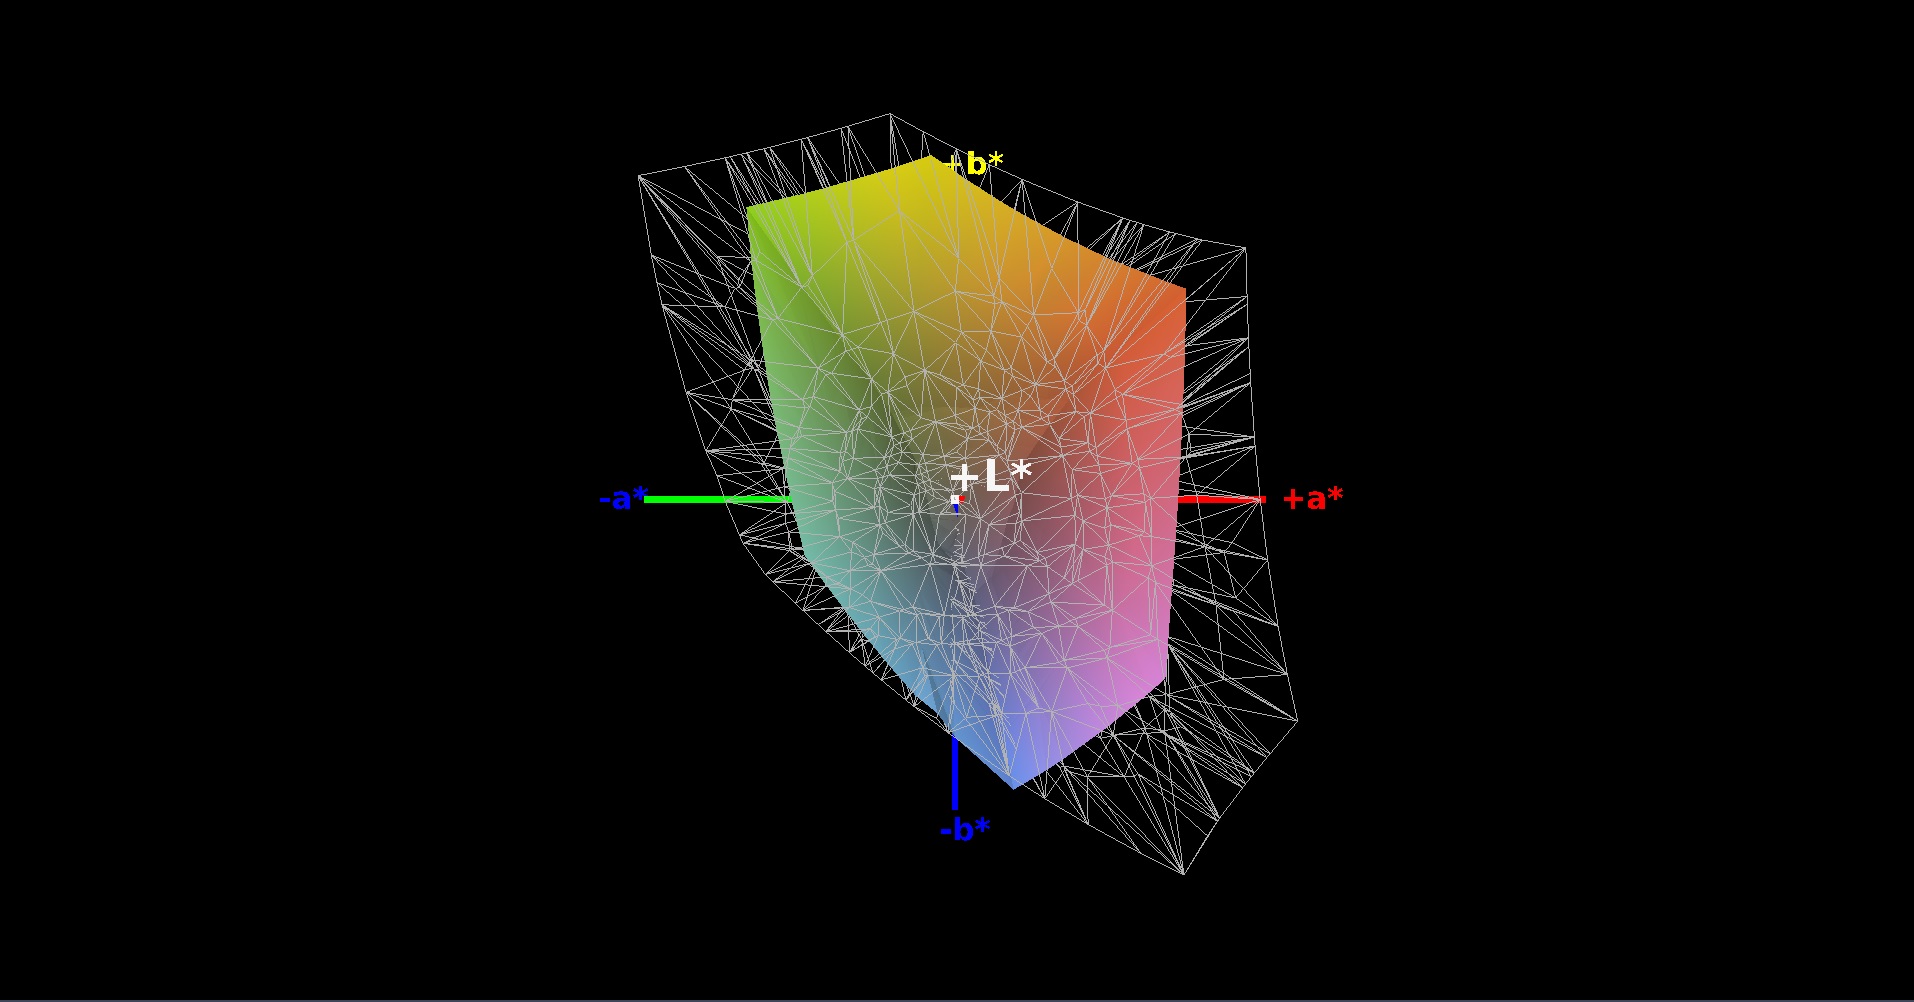
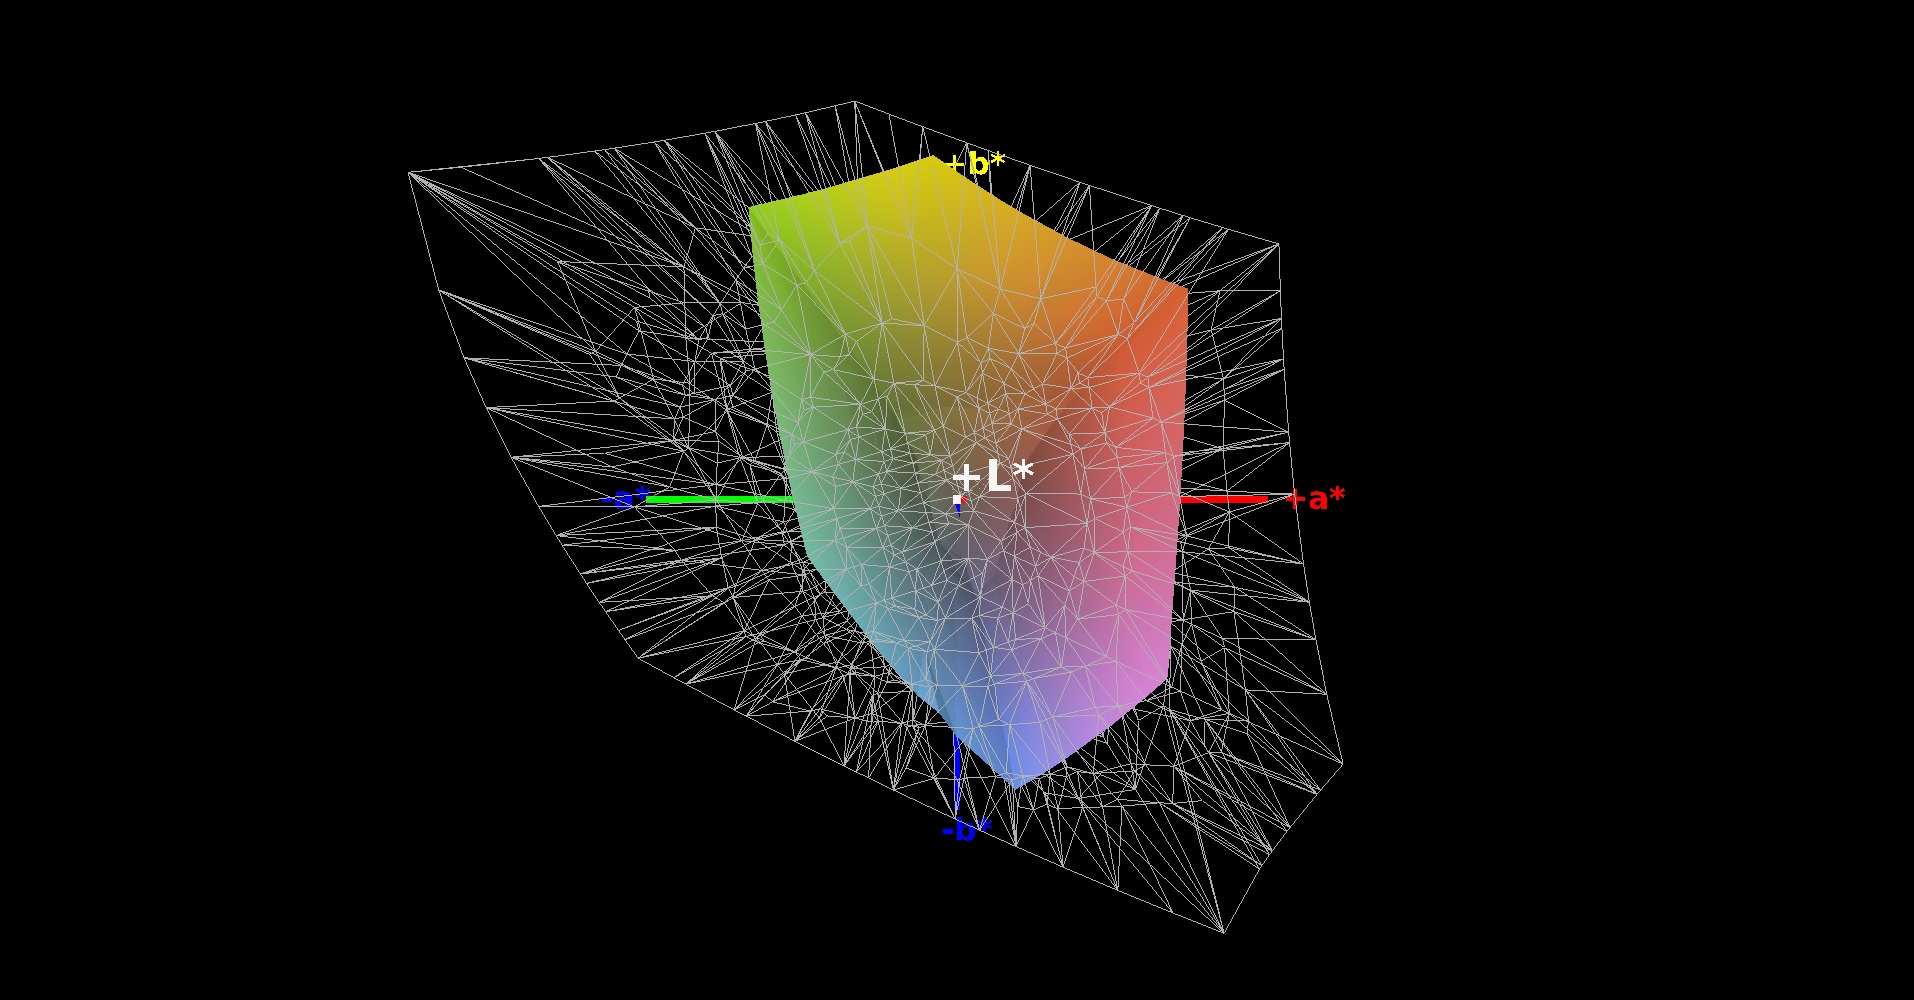
60% sRGB (Argyll 1.6.3 3D)
38% AdobeRGB 1998 (Argyll 1.6.3 3D)
41.77% AdobeRGB 1998 (Argyll 2.2.0 3D)
60.7% sRGB (Argyll 2.2.0 3D)
40.42% Display P3 (Argyll 2.2.0 3D)
Gamma: 2.39
| HP Pavilion Gaming 16-a0242ng BOE08F6, IPS, 1920x1080, 16.10 | Dell G5 15 SE 5505 P89F BOE NV156FH, WVA, 1920x1080, 15.60 | Asus TUF Gaming A15 FA506IV-HN172 LM156LF-2F01, IPS, 1920x1080, 15.60 | Xiaomi Mi Gaming Laptop 2019 NV156FHM-N4G (BOE0867), IPS, 1920x1080, 15.60 | Lenovo Legion 5 15IMH05H BOE CQ NV156FHM-NX1, IPS, 1920x1080, 15.60 | MSI Bravo 15 A4DCR AU Optronics B156HAN08.0 (AUO80ED), IPS-Level, 1920x1080, 15.60 | |
|---|---|---|---|---|---|---|
| Display | 52% | -4% | 57% | -4% | 49% | |
| Display P3 Coverage | 40.42 | 63 56% | 38.92 -4% | 65.2 61% | 38.8 -4% | 62 53% |
| sRGB Coverage | 60.7 | 90.1 48% | 58.5 -4% | 92.1 52% | 57.8 -5% | 86.8 43% |
| AdobeRGB 1998 Coverage | 41.77 | 64.1 53% | 40.22 -4% | 66.4 59% | 40.09 -4% | 62.7 50% |
| Response Times | 59% | 21% | 71% | 42% | 65% | |
| Response Time Grey 50% / Grey 80% * | 43.2 ? | 20.4 ? 53% | 34 ? 21% | 8.8 ? 80% | 26 ? 40% | 16 ? 63% |
| Response Time Black / White * | 30.4 ? | 10.8 ? 64% | 24 ? 21% | 12 ? 61% | 17 ? 44% | 10.4 ? 66% |
| PWM Frequency | 198.4 ? | |||||
| Screen | -6% | -31% | 2% | -26% | -15% | |
| Brightness middle | 319 | 292 -8% | 280 -12% | 316 -1% | 301 -6% | 311 -3% |
| Brightness | 306 | 290 -5% | 254 -17% | 295 -4% | 277 -9% | 313 2% |
| Brightness Distribution | 91 | 77 -15% | 88 -3% | 87 -4% | 77 -15% | 88 -3% |
| Black Level * | 0.18 | 0.27 -50% | 0.15 17% | 0.23 -28% | 0.26 -44% | 0.43 -139% |
| Contrast | 1772 | 1081 -39% | 1867 5% | 1374 -22% | 1158 -35% | 723 -59% |
| Colorchecker dE 2000 * | 4 | 3.99 -0% | 5.89 -47% | 3.84 4% | 5.12 -28% | 4.5 -13% |
| Colorchecker dE 2000 max. * | 11.18 | 6.11 45% | 19 -70% | 5.69 49% | 8.86 21% | 7.97 29% |
| Colorchecker dE 2000 calibrated * | 3.52 | 3.02 14% | 4.79 -36% | 1.64 53% | 4.88 -39% | 2.65 25% |
| Greyscale dE 2000 * | 1.53 | 3.3 -116% | 4.08 -167% | 3.66 -139% | 3.47 -127% | 3.3 -116% |
| Gamma | 2.39 92% | 2.25 98% | 2.33 94% | 2.62 84% | 2.37 93% | 2.129 103% |
| CCT | 6533 99% | 7047 92% | 7303 89% | 7165 91% | 7062 92% | 7227 90% |
| Color Space (Percent of AdobeRGB 1998) | 38 | 58.1 53% | 37 -3% | 60 58% | 37 -3% | 63 66% |
| Color Space (Percent of sRGB) | 60 | 89.7 50% | 58 -3% | 92 53% | 57 -5% | 86 43% |
| Total Average (Program / Settings) | 35% /
13% | -5% /
-19% | 43% /
21% | 4% /
-14% | 33% /
7% |
* ... smaller is better
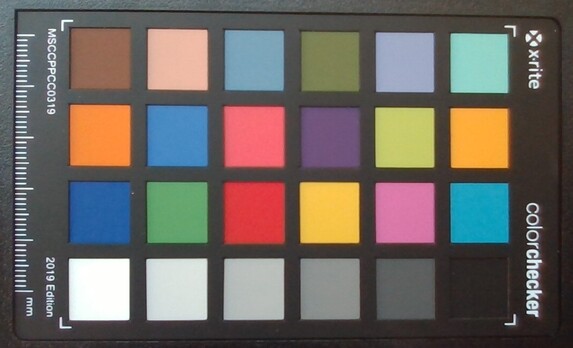
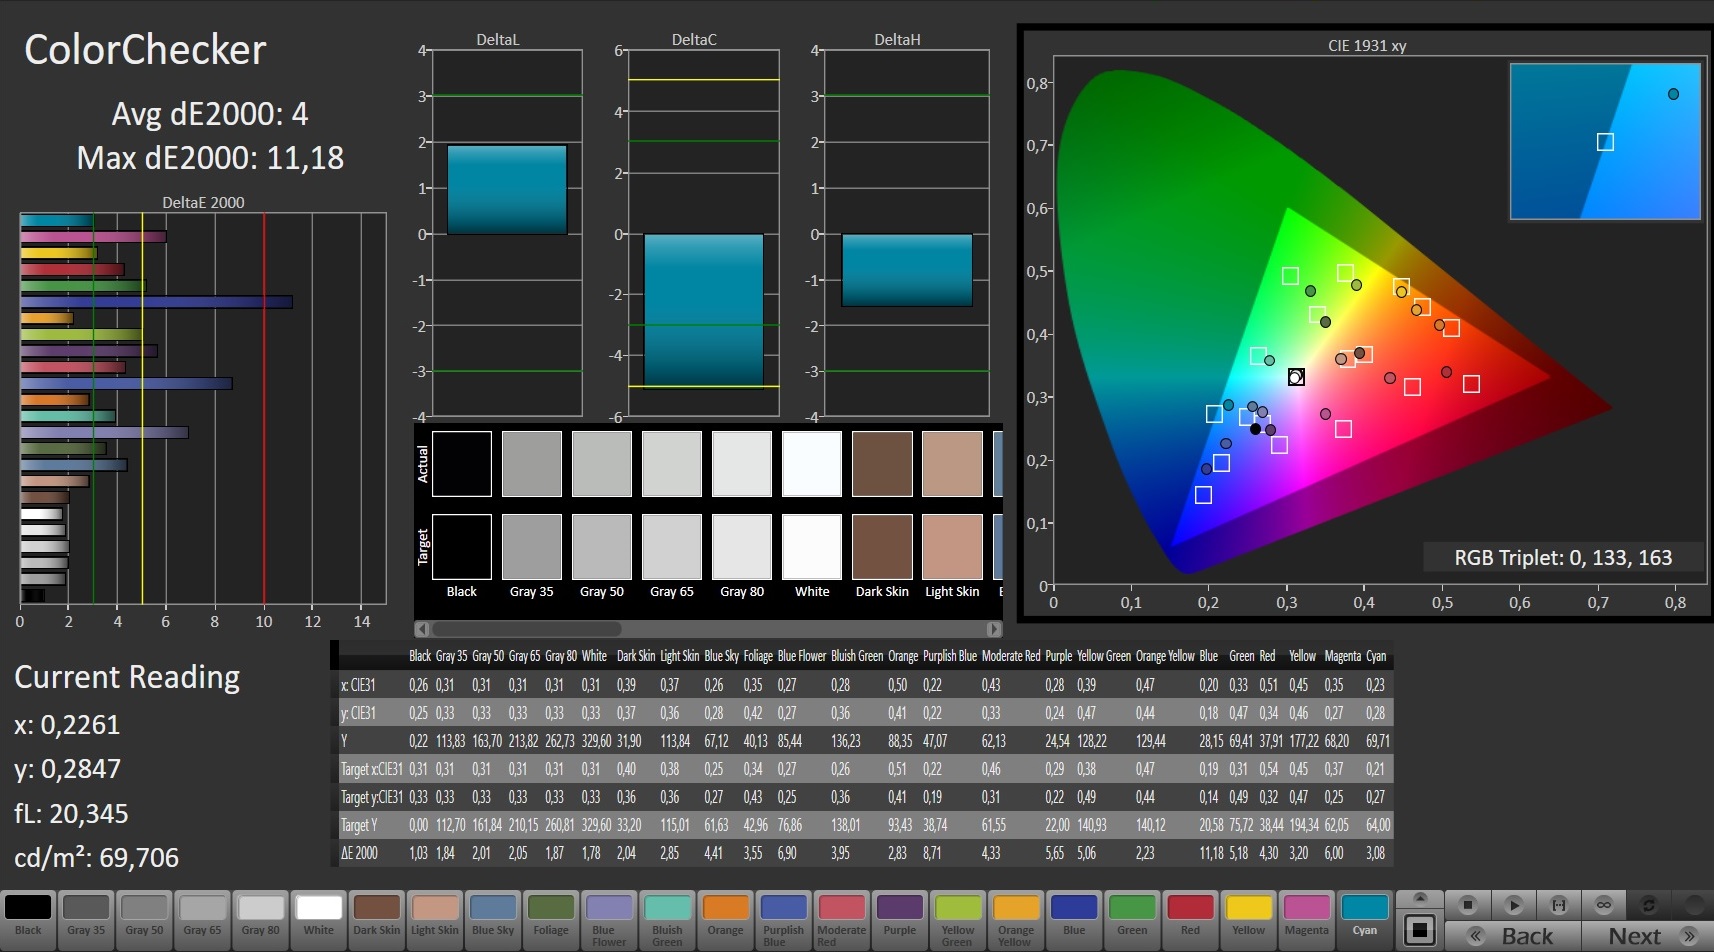
Straight out of the box, the DeltaE2000 colour deviations against the sRGB colour space are not very high, which means that the Pavilion Gaming 16 comes with a factory-calibrated panel. Our own calibration shows that the colour reproduction can still be slightly improved. We saw improvements in both colour accuracy and grayscale tracking. Our review device achieves only mediocre results when it comes to colour-space coverage. However, these results are normal for a gaming notebook.


Display Response Times
| ↔ Response Time Black to White | ||
|---|---|---|
| 30.4 ms ... rise ↗ and fall ↘ combined | ↗ 16.4 ms rise | 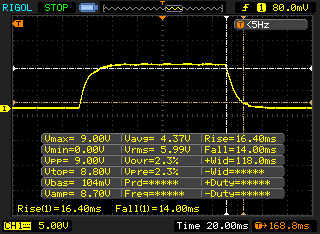 |
| ↘ 14 ms fall | ||
| The screen shows slow response rates in our tests and will be unsatisfactory for gamers. In comparison, all tested devices range from 0.1 (minimum) to 240 (maximum) ms. » 80 % of all devices are better. This means that the measured response time is worse than the average of all tested devices (21.5 ms). | ||
| ↔ Response Time 50% Grey to 80% Grey | ||
| 43.2 ms ... rise ↗ and fall ↘ combined | ↗ 22 ms rise |  |
| ↘ 21.2 ms fall | ||
| The screen shows slow response rates in our tests and will be unsatisfactory for gamers. In comparison, all tested devices range from 0.2 (minimum) to 636 (maximum) ms. » 68 % of all devices are better. This means that the measured response time is worse than the average of all tested devices (33.7 ms). | ||
Screen Flickering / PWM (Pulse-Width Modulation)
| Screen flickering / PWM not detected |  | ||
In comparison: 53 % of all tested devices do not use PWM to dim the display. If PWM was detected, an average of 17853 (minimum: 5 - maximum: 3846000) Hz was measured. | |||
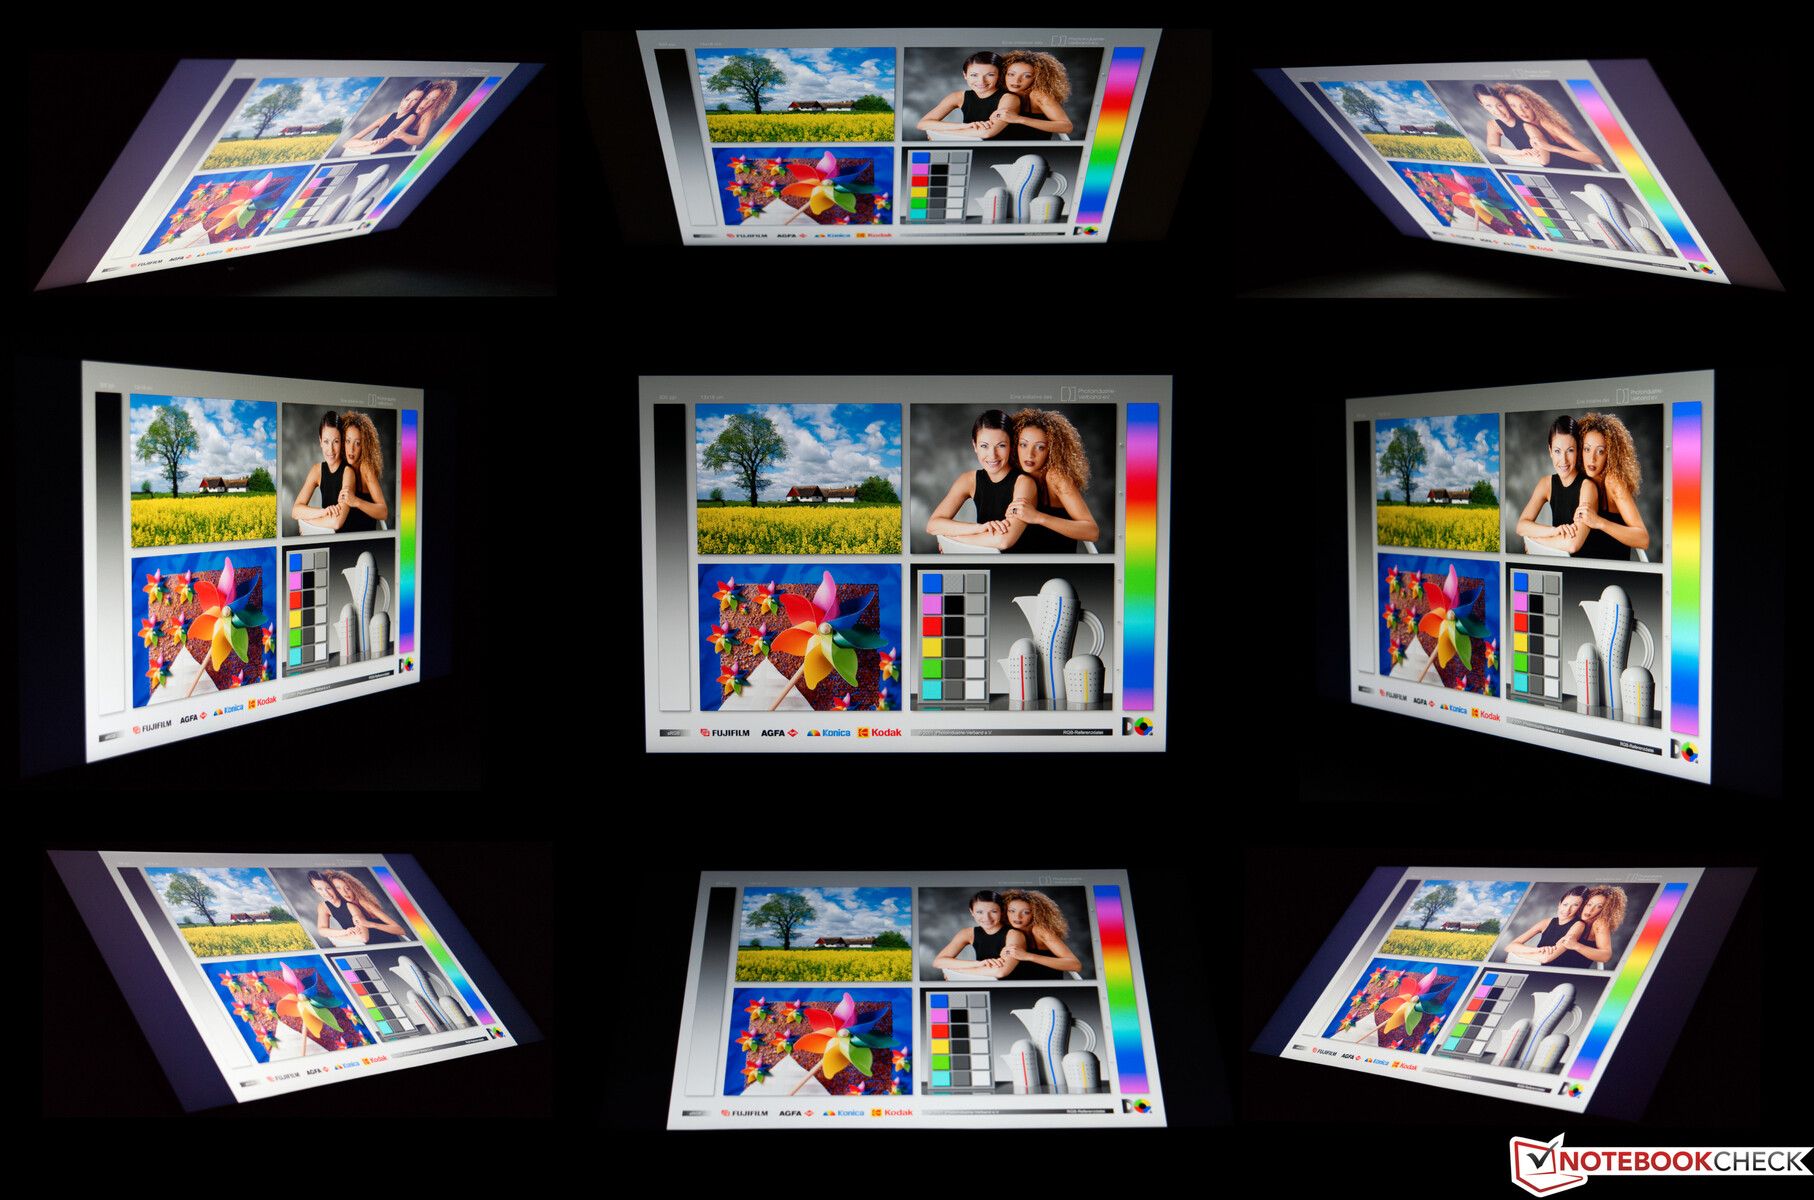
The IPS panel offers great viewing angles. The colours become slightly distorted only at extreme angles. The device is not built for outdoor use, which is reflected in our images. Those who want to use the laptop outdoors should do so in the shade.


Performance - not surprising, but sufficient
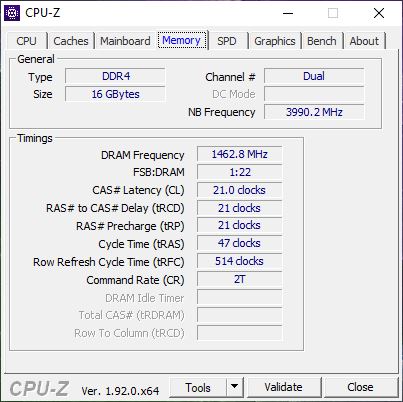
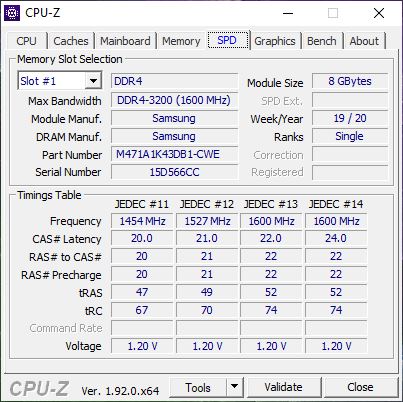
The combination of an Intel Core i5-10300H and an NVIDIA GeForce GTX 1650 Ti offers a good level of performance for 1080p gaming. The system also has 16 GB of RAM and a 512 GB SSD.
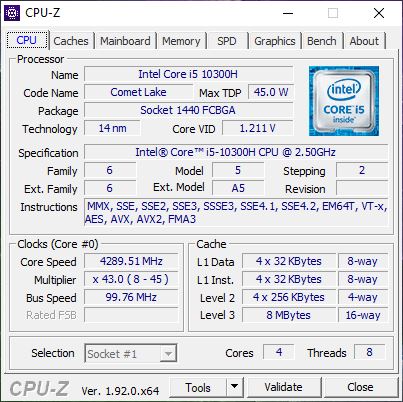


Processor
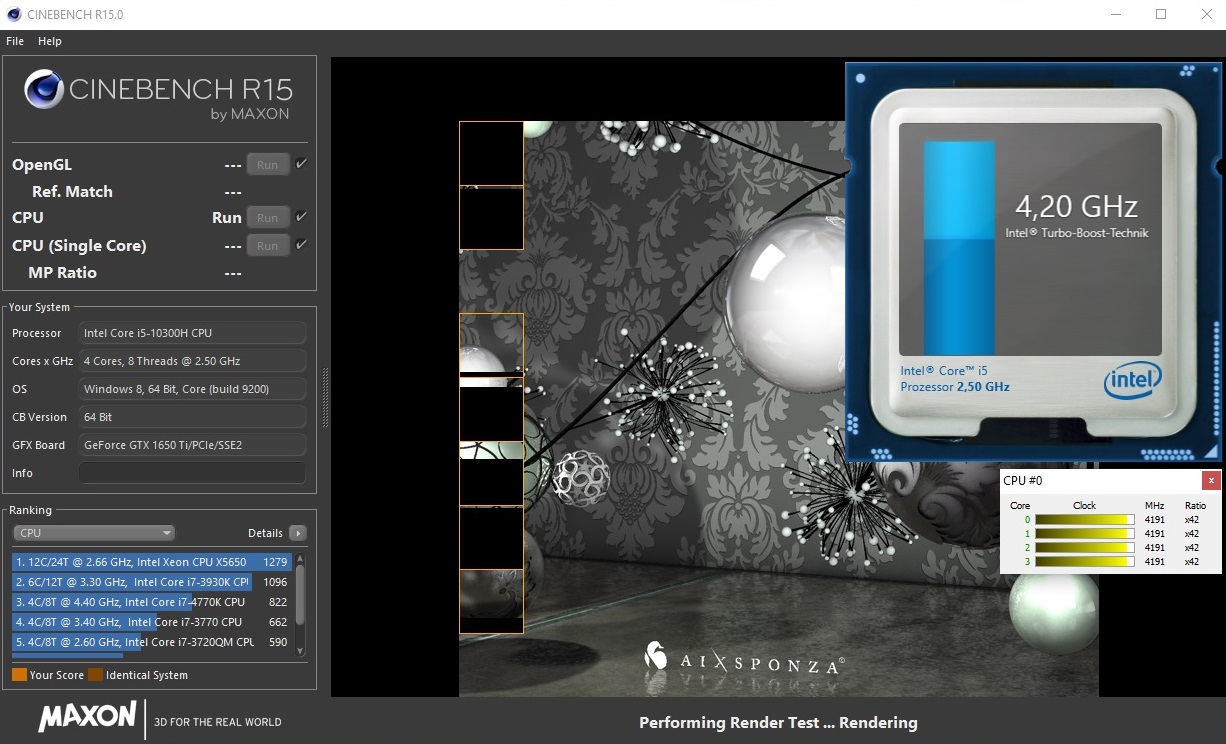
The Intel Core i5-10300H is a 4-core/8-thread chip with a base clock of 2.5 GHz. A single core can turbo up to 4.5 GHz. The all-core turbo is 4.2 GHz. In our review, the Core i5-10300H battles against the AMD Ryzen 7 4800H. The Intel processor is able to keep up only in single-core benchmarks. In the multi-core benchmarks, it is thoroughly beaten by the AMD part.
The HP Pavilion Gaming 16 does very well in our first stress test. There are no significant performance drops in our multi-core Cinebench R15 continuous loop. The average score after 50 benchmark runs amounts to 871 points.
You can find out how the Core i5-10300H stacks up against other processors on our CPU Benchmarks page.


* ... smaller is better
System Performance
Our review device performs somewhat worse than the competition in the PCMark 10 benchmarks. Nevertheless, the Pavilion Gaming 16 is not inferior to other competing devices, because it feels very responsive in day-to-day use.
| PCMark 8 Home Score Accelerated v2 | 4455 points | |
| PCMark 8 Creative Score Accelerated v2 | 6793 points | |
| PCMark 8 Work Score Accelerated v2 | 5176 points | |
| PCMark 10 Score | 4868 points | |
Help | ||
DPC Latencies
LatencyMon reveals no latency issues when opening several browser tabs in Edge. However, the latencies significantly increase when playing back 4K video. The utilisation of the iGPU amounts to 58% in our 4K video test.

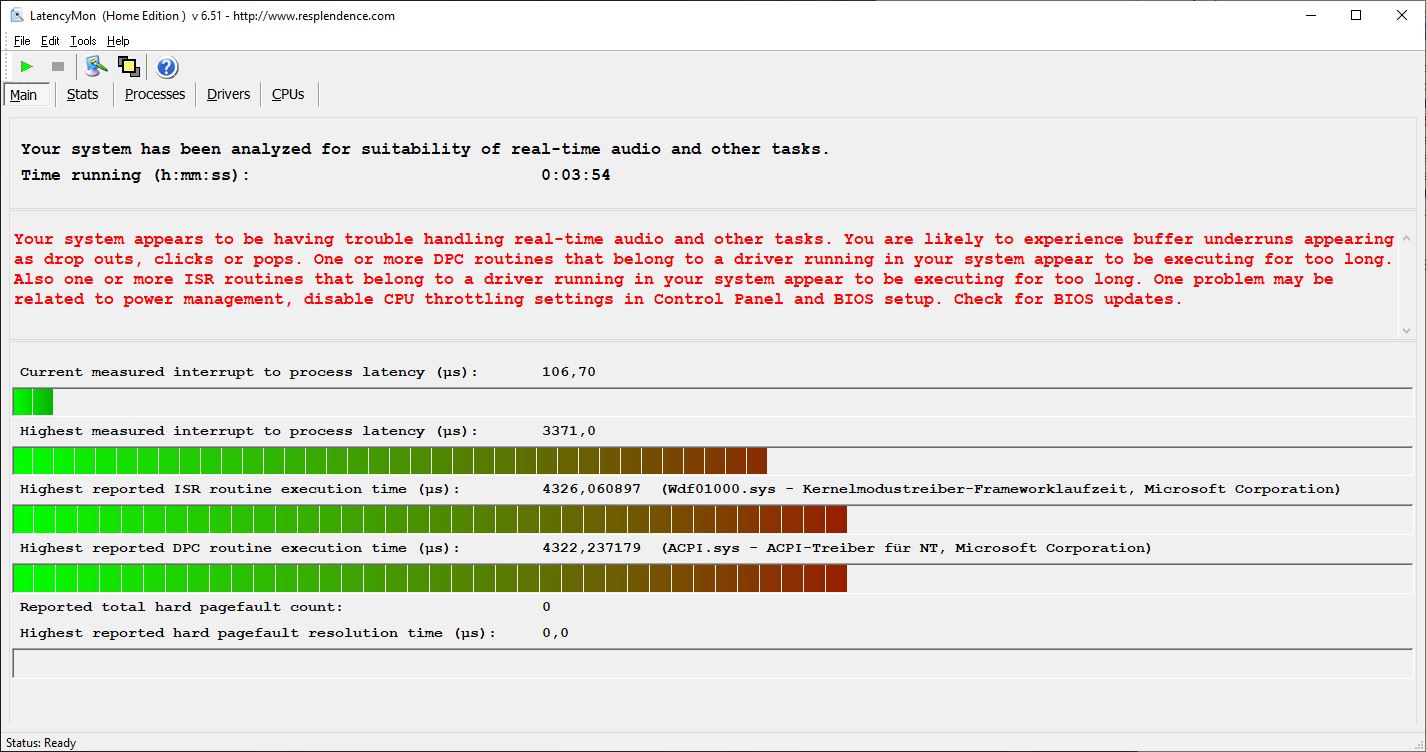

| DPC Latencies / LatencyMon - interrupt to process latency (max), Web, Youtube, Prime95 | |
| HP Pavilion Gaming 16-a0242ng | |
* ... smaller is better
Storage Devices

The HP Pavilion Gaming 16 comes with a fast 512 GB SDD. The Intel SSD was able to achieve good results in our benchmarks. Here, the 4K read speed is particularly noteworthy. The transfer rates when copying files are also good. All in all, the system feels very snappy because of the fast storage device. However, 512 GB of storage space is not enough for a gaming laptop, given the sizes of modern games. Howbeit, users can add a second 2.5-inch storage device if they run out of storage space.
You can find out how the storage device in the Pavilion Gaming 16 stacks up against other storage devices on our HDD/SSD Benchmarks page.
| HP Pavilion Gaming 16-a0242ng Intel SSD 660p SSDPEKNW512G8 | Dell G5 15 SE 5505 P89F Samsung PM991 MZ9LQ512HALU | Asus TUF Gaming A15 FA506IV-HN172 Kingston OM8PCP3512F-AB | Xiaomi Mi Gaming Laptop 2019 Toshiba XG6 KXG60ZNV512G | Lenovo Legion 5 15IMH05H Samsung PM991 MZALQ512HALU | MSI Bravo 15 A4DCR Samsung PM981a MZVLB1T0HBLR | |
|---|---|---|---|---|---|---|
| AS SSD | 17% | 11% | 114% | 29% | 155% | |
| Seq Read | 1438 | 1386 -4% | 1682 17% | 2772 93% | 2012 40% | 2730 90% |
| Seq Write | 905 | 1234 36% | 904 0% | 2489 175% | 1261 39% | 2513 178% |
| 4K Read | 50.3 | 41.32 -18% | 60.2 20% | 48.62 -3% | 43.66 -13% | 61.4 22% |
| 4K Write | 111.7 | 128 15% | 164.8 48% | 136.6 22% | 109.3 -2% | 156.1 40% |
| 4K-64 Read | 324 | 854 164% | 472.5 46% | 1393 330% | 851 163% | 1780 449% |
| 4K-64 Write | 729 | 721 -1% | 845 16% | 1450 99% | 780 7% | 1920 163% |
| Access Time Read * | 0.105 | 0.098 7% | 0.087 17% | 0.088 16% | 0.117 -11% | 0.063 40% |
| Access Time Write * | 0.047 | 0.095 -102% | 0.02 57% | 0.03 36% | 0.036 23% | 0.025 47% |
| Score Read | 518 | 1034 100% | 701 35% | 1719 232% | 1096 112% | 2114 308% |
| Score Write | 931 | 973 5% | 1101 18% | 1835 97% | 1016 9% | 2327 150% |
| Score Total | 1707 | 2536 49% | 2143 26% | 4424 159% | 2643 55% | 5518 223% |
| Copy ISO MB/s | 1145 | 1284 12% | 675 -41% | 1481 29% | ||
| Copy Program MB/s | 602 | 401.9 -33% | 248.4 -59% | 467.5 -22% | ||
| Copy Game MB/s | 929 | 1013 9% | 535 -42% | 734 -21% |
* ... smaller is better

Continuous read speed: DiskSpd Read Loop, Queue Depth 8
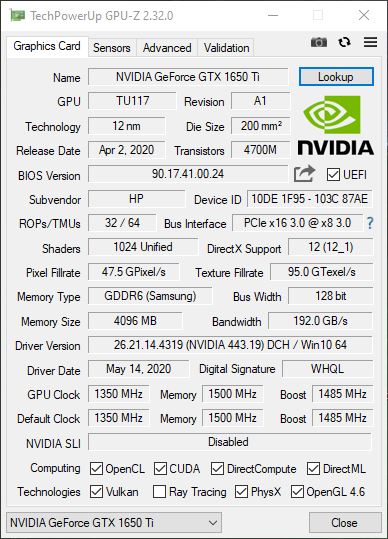
Graphics Card
The Pavilion Gaming 16 comes with an NVIDIA GeForce GTX 1650 Ti, which is responsible for 3D rendering. Thanks to NVIDIA Optimus technology, the system is able to save energy in 2D applications, because the iGPU is utilised in such applications.
The dedicated GPU features 4 GB of GDDR6 VRAM. The HP Gaming 16 has no chance against the competition. The GeForce GTX 1650 Ti is simply too slow to be able to keep up. The Pavilion Gaming 16 is able to fully utilise the GeForce GTX 1650 Ti, which means that our review device performs as well as it possibly can.
You can find out how the GPU in the Pavilion Gaming 16 stacks up against other graphics cards on our GPU Benchmarks page.
| 3DMark 11 Performance | 12461 points | |
| 3DMark Ice Storm Standard Score | 101019 points | |
| 3DMark Cloud Gate Standard Score | 27911 points | |
| 3DMark Fire Strike Score | 8780 points | |
| 3DMark Fire Strike Extreme Score | 4315 points | |
| 3DMark Time Spy Score | 3748 points | |
Help | ||
Gaming Performance
In our gaming benchmarks, the GeForce GTX 1650 Ti performs exactly the way it is supposed to. The Pavilion Gaming 16 is thoroughly beaten by the competition, which is not surprising. It has a slower graphics card after all. Nevertheless, the Gaming 16 offers a sufficient level of GPU performance to run some current titles on the highest settings.
| The Witcher 3 | |
| 1920x1080 High Graphics & Postprocessing (Nvidia HairWorks Off) | |
| Average of class Gaming (17.5 - 449, n=164, last 2 years) | |
| Lenovo Legion 5 15IMH05H | |
| Xiaomi Mi Gaming Laptop 2019 | |
| Asus TUF Gaming A15 FA506IV-HN172 | |
| Dell G5 15 SE 5505 P89F | |
| HP Pavilion Gaming 16-a0242ng | |
| MSI Bravo 15 A4DCR | |
| 1920x1080 Ultra Graphics & Postprocessing (HBAO+) | |
| Average of class Gaming (8.61 - 216, n=224, last 2 years) | |
| Lenovo Legion 5 15IMH05H | |
| Dell G5 15 SE 5505 P89F | |
| Xiaomi Mi Gaming Laptop 2019 | |
| Asus TUF Gaming A15 FA506IV-HN172 | |
| MSI Bravo 15 A4DCR | |
| HP Pavilion Gaming 16-a0242ng | |
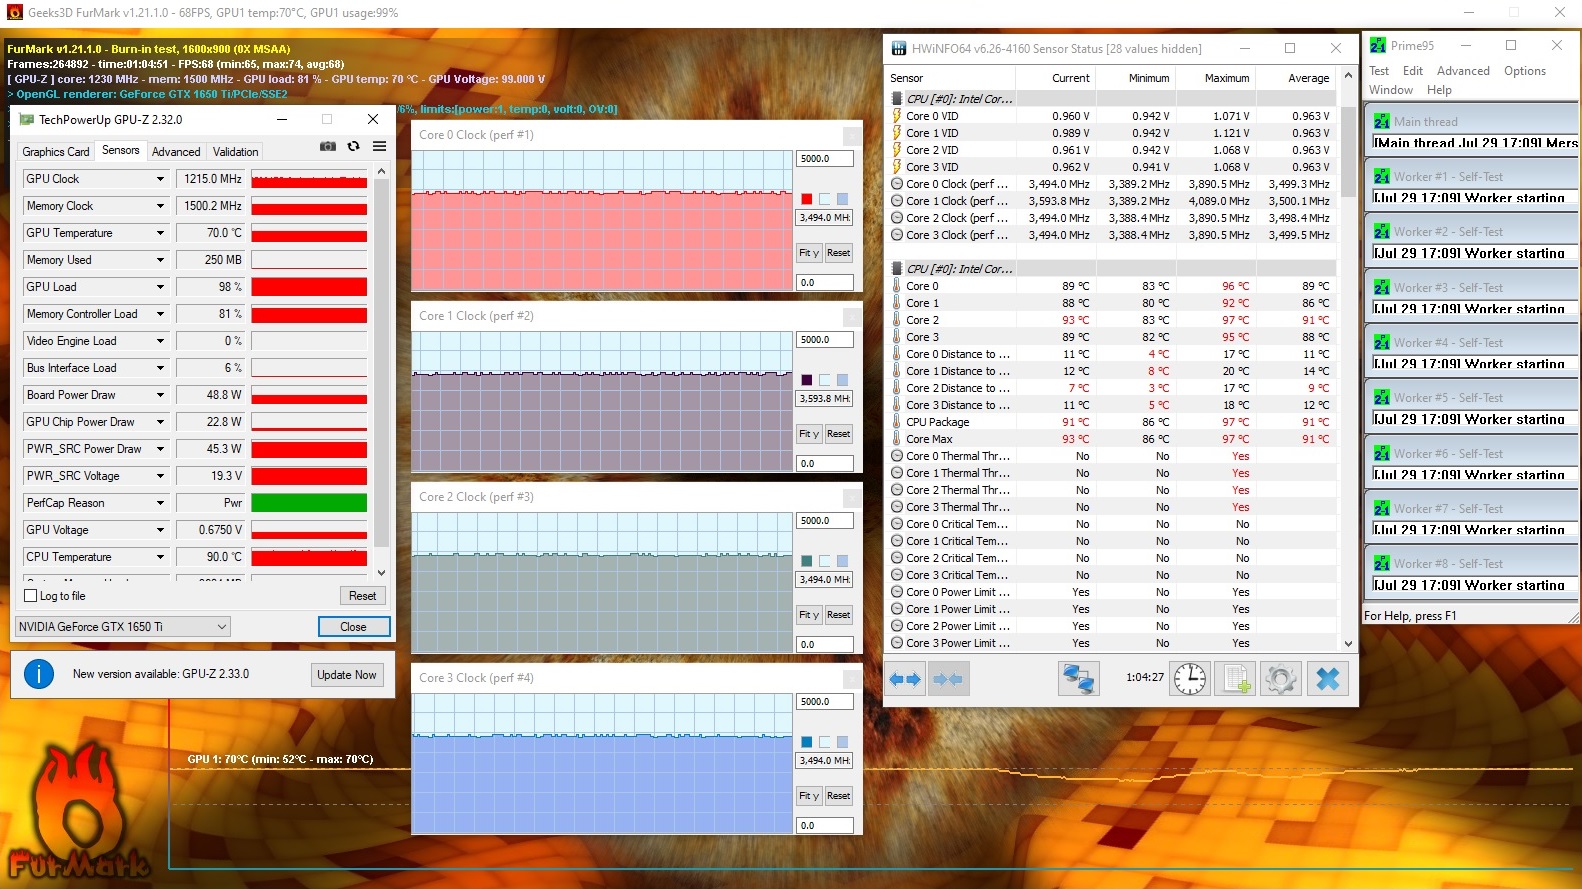
Our gaming stress test with The Witcher 3 reveals that long gaming sessions should not be marred by flagging GPU performance.
| low | med. | high | ultra | |
| BioShock Infinite (2013) | 309 | 251 | 227 | 99 |
| GTA V (2015) | 173 | 165 | 107 | 53.2 |
| The Witcher 3 (2015) | 202 | 123 | 69.2 | 36.6 |
| Dota 2 Reborn (2015) | 136.2 | 123.8 | 117.1 | 113 |
| Rise of the Tomb Raider (2016) | 181 | 124 | 68.3 | 58.9 |
| Final Fantasy XV Benchmark (2018) | 107 | 55.2 | 40.9 | |
| X-Plane 11.11 (2018) | 90.1 | 81.4 | 69.5 | |
| Far Cry 5 (2018) | 119 | 67 | 62 | 58 |
| Strange Brigade (2018) | 230 | 95 | 75.2 | 62.7 |
| Far Cry New Dawn (2019) | 104 | 66 | 62 | 57 |
| Borderlands 3 (2019) | 122 | 63.4 | 40.8 | 30.5 |
Emissions - Long-lasting, but also loud and hot
System Noise
Gaming laptops have a bad reputation when it comes to system noise. When idle, the HP Pavilion Gaming 16 is very quiet and sometimes completely silent. However, under load, both fans start to spin at a high RPM. The sound pressure level peaked at 54 dB(A). Under load, the fan noise amounted to 48 dB(A) on average, which is still very audible. Moreover, because the fans produce high-frequency noise, the laptop sounds somewhat louder than it actually is.
Noise Level
| Idle |
| 25 / 33 / 42 dB(A) |
| Load |
| 48 / 54 dB(A) |
 | ||
30 dB silent 40 dB(A) audible 50 dB(A) loud |
||
min: | ||
Temperature
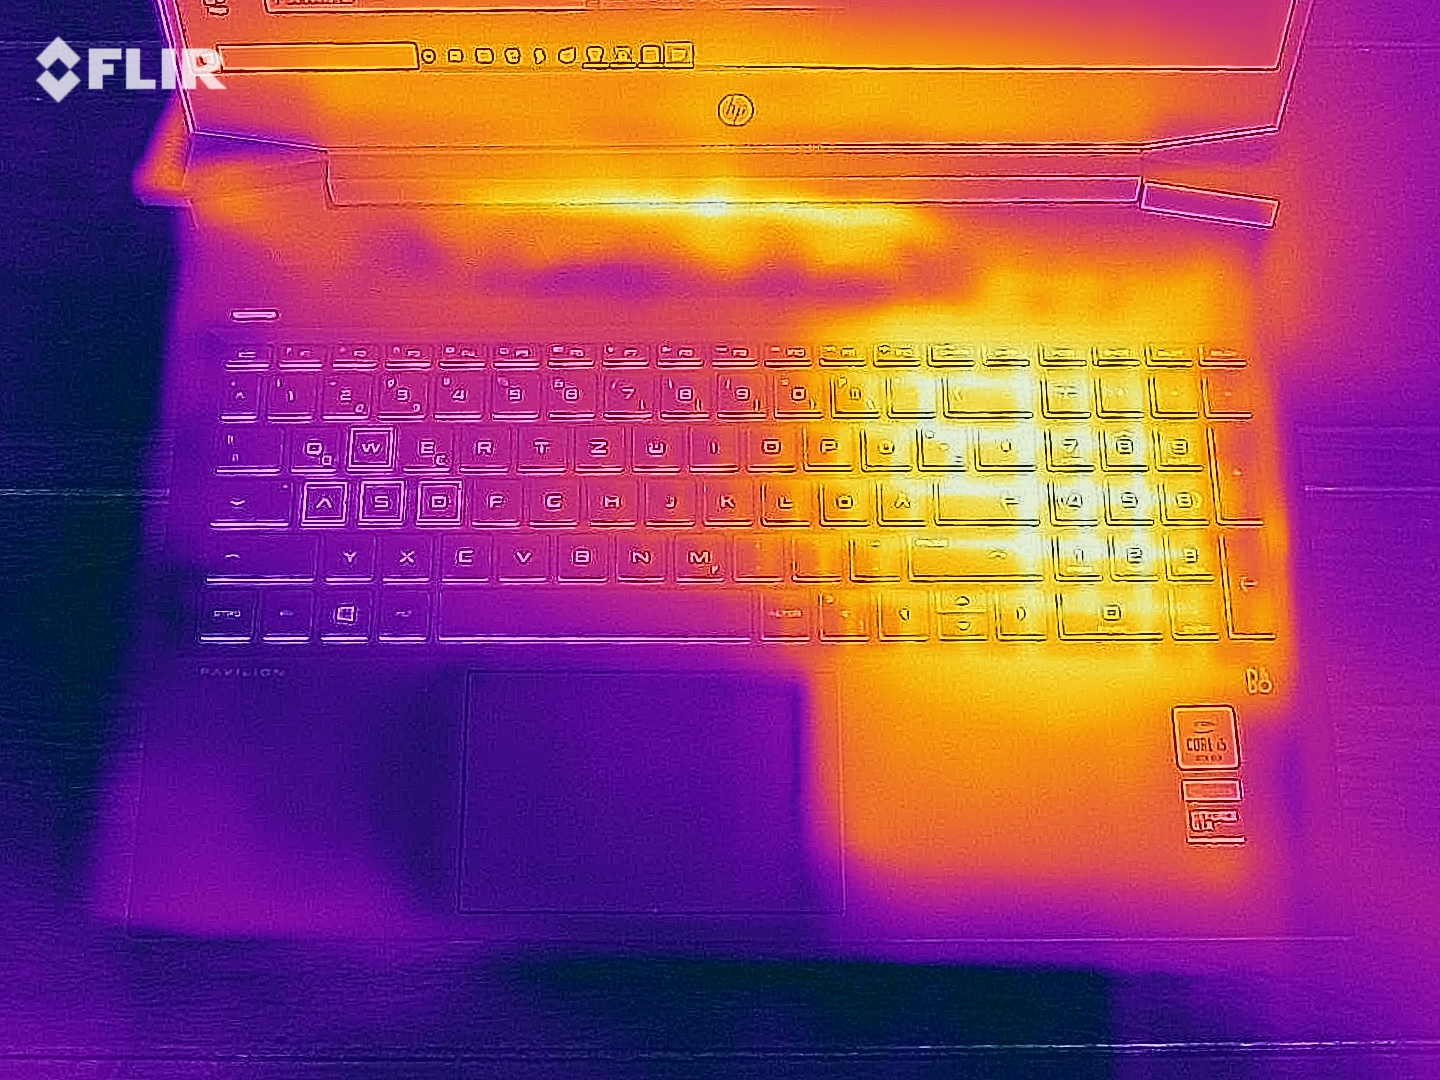
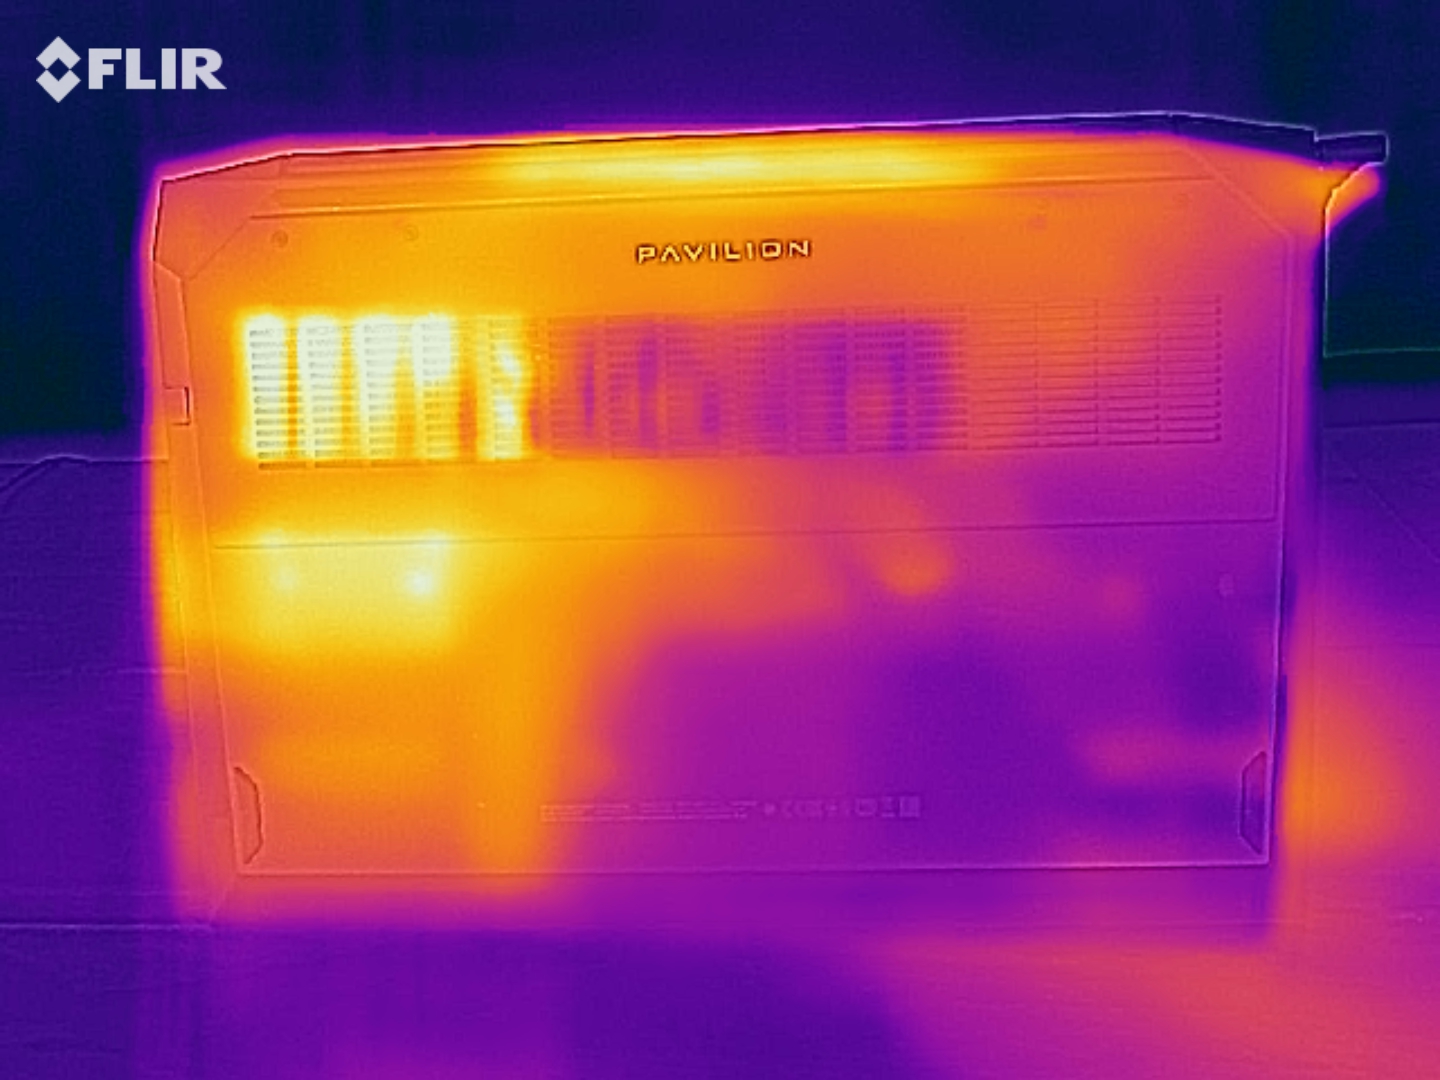
The slim chassis requires the cooling system to work hard to keep the internal components from overheating. The 50 °C (122 °F) mark is only exceeded at one measurement point. However, temperatures at many other areas reach 49°C (120.2°F), which means that they are not much cooler than the hottest area. Due to high temperatures, users should abstain from long gaming sessions on the lap.
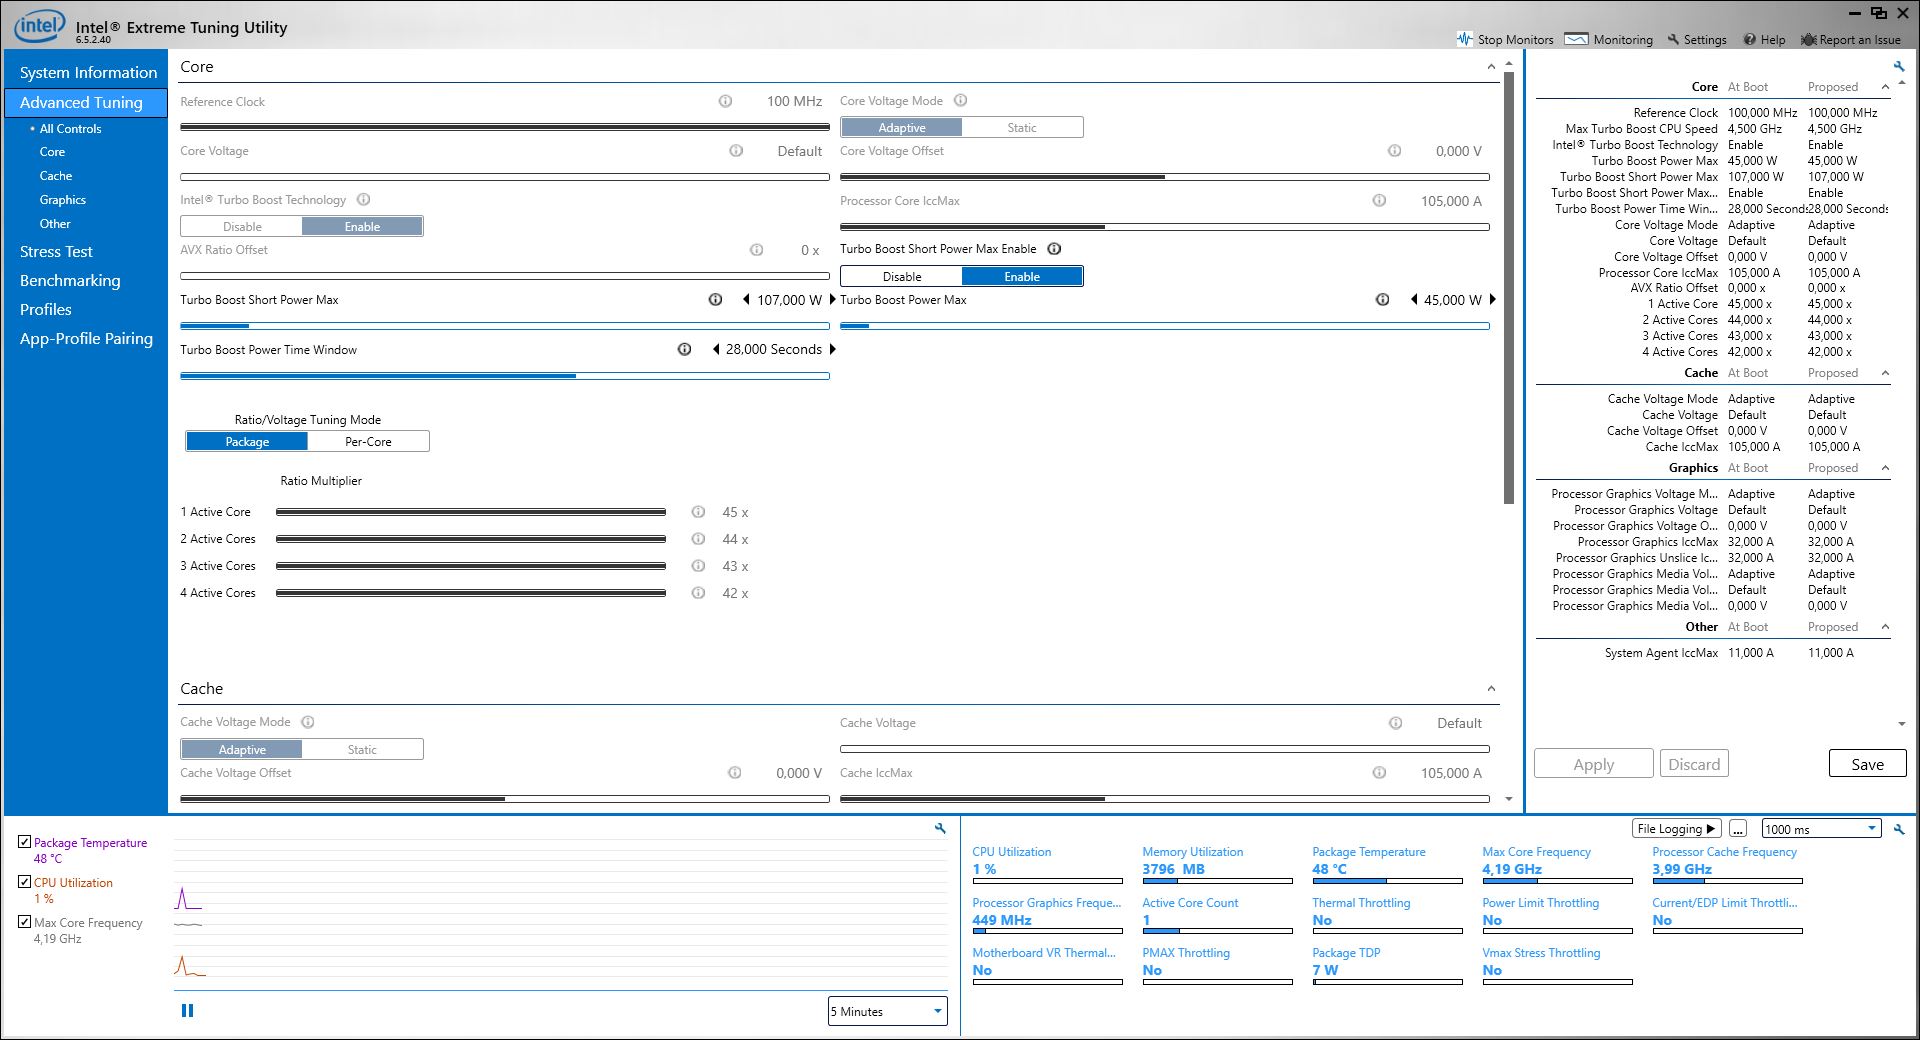
During our stress test we paid close attention to the CPU and GPU temperatures. Here, the CPU temperatures reached 97 °C (206.6 °F). The GPU temperatures peaked at 70 °C (158 °F). Despite high temperatures, the CPU frequencies remained well above the base clock (2.5 GHz). However, because of the high temperatures the CPU is not able to maintain its maximum boost clock. The CPU ran at 3.5 GHz on average in our one-hour long stress test.
(-) The maximum temperature on the upper side is 49 °C / 120 F, compared to the average of 40.4 °C / 105 F, ranging from 21.2 to 68.8 °C for the class Gaming.
(-) The bottom heats up to a maximum of 50 °C / 122 F, compared to the average of 43.2 °C / 110 F
(+) In idle usage, the average temperature for the upper side is 27.6 °C / 82 F, compared to the device average of 33.8 °C / 93 F.
(-) Playing The Witcher 3, the average temperature for the upper side is 39.1 °C / 102 F, compared to the device average of 33.8 °C / 93 F.
(-) The palmrests and touchpad can get very hot to the touch with a maximum of 41 °C / 105.8 F.
(-) The average temperature of the palmrest area of similar devices was 28.9 °C / 84 F (-12.1 °C / -21.8 F).
Speakers
The sound system from Bang & Olufsen is located above the keyboard and produces enough sound to fill a small room. However, the sound lacks bass. This cannot be rectified even via the included Bang-&-Olufsen utility.
There are no distortions or background noise at full volume. For a perfect listening experience we recommend using a set of headphones. During our review, the 3.5 mm audio jack worked without any issues.
HP Pavilion Gaming 16-a0242ng audio analysis
(±) | speaker loudness is average but good (75 dB)
Bass 100 - 315 Hz
(-) | nearly no bass - on average 19.4% lower than median
(±) | linearity of bass is average (14.3% delta to prev. frequency)
Mids 400 - 2000 Hz
(+) | balanced mids - only 1.6% away from median
(+) | mids are linear (3.5% delta to prev. frequency)
Highs 2 - 16 kHz
(+) | balanced highs - only 3.9% away from median
(+) | highs are linear (5.8% delta to prev. frequency)
Overall 100 - 16.000 Hz
(±) | linearity of overall sound is average (17.8% difference to median)
Compared to same class
» 50% of all tested devices in this class were better, 10% similar, 40% worse
» The best had a delta of 6%, average was 18%, worst was 132%
Compared to all devices tested
» 31% of all tested devices were better, 8% similar, 61% worse
» The best had a delta of 4%, average was 25%, worst was 134%
Energy Management
Energy Consumption
The HP Pavilion Gaming 16 draws considerably less power than competing devices, because it has weaker hardware. This is true not only under full load but also under low load and when idle. The Pavilion Gaming 16 draws only 3 to 18 watts when idle. The energy consumption peaks at 144 watts under full load. Our review device comes with a 150-watt power adapter, which is able to supply enough energy to the notebook to keep it from discharging even during our stress test.


| Off / Standby | |
| Idle | |
| Load |
|
| HP Pavilion Gaming 16-a0242ng i5-10300H, GeForce GTX 1650 Ti Mobile | Dell G5 15 SE 5505 P89F R7 4800H, Radeon RX 5600M | Asus TUF Gaming A15 FA506IV-HN172 R7 4800H, GeForce RTX 2060 Mobile | Xiaomi Mi Gaming Laptop 2019 i7-9750H, GeForce RTX 2060 Mobile | Lenovo Legion 5 15IMH05H i5-10300H, GeForce RTX 2060 Mobile | MSI Bravo 15 A4DCR R7 4800H, Radeon RX 5300M | Average of class Gaming | |
|---|---|---|---|---|---|---|---|
| Power Consumption | -40% | -36% | -79% | -15% | -71% | -138% | |
| Idle Minimum * | 3 | 6.5 -117% | 5.4 -80% | 10 -233% | 3.2 -7% | 11 -267% | 13.9 ? -363% |
| Idle Average * | 7 | 10.6 -51% | 10 -43% | 13 -86% | 8.3 -19% | 14 -100% | 19.2 ? -174% |
| Idle Maximum * | 18 | 11 39% | 10.5 42% | 20 -11% | 8.7 52% | 25 -39% | 27.1 ? -51% |
| Load Average * | 86 | 84.1 2% | 135 -57% | 100 -16% | 82 5% | 72 16% | 111.6 ? -30% |
| Witcher 3 ultra * | 82 | 152.9 -86% | 144 -76% | 159 -94% | 151 -84% | 100 -22% | |
| Load Maximum * | 144 | 180.4 -25% | 147 -2% | 196 -36% | 195 -35% | 163 -13% | 251 ? -74% |
* ... smaller is better
Battery Life
The built-in 52 Wh battery in the HP Pavilion Gaming 16 lasted eight hours in our Wi-Fi test. For this test, we lowered the display brightness to 150 cd/m². At full brightness, the battery died two hour earlier in our Wi-Fi test. When compared to the competition, the Pavilion Gaming 16 is far ahead and can reaffirm itself with its long battery life.
However, users should be aware that the CPU and GPU performance is slightly reduced when running on battery power.


| HP Pavilion Gaming 16-a0242ng i5-10300H, GeForce GTX 1650 Ti Mobile, 52 Wh | Dell G5 15 SE 5505 P89F R7 4800H, Radeon RX 5600M, 51 Wh | Asus TUF Gaming A15 FA506IV-HN172 R7 4800H, GeForce RTX 2060 Mobile, 48 Wh | Xiaomi Mi Gaming Laptop 2019 i7-9750H, GeForce RTX 2060 Mobile, 55 Wh | Lenovo Legion 5 15IMH05H i5-10300H, GeForce RTX 2060 Mobile, 60 Wh | MSI Bravo 15 A4DCR R7 4800H, Radeon RX 5300M, 51 Wh | Average of class Gaming | |
|---|---|---|---|---|---|---|---|
| Battery Runtime | -28% | -27% | -57% | -14% | -53% | -32% | |
| Reader / Idle | 992 | 671 -32% | 587 -41% | 370 -63% | 848 -15% | 418 -58% | 539 ? -46% |
| H.264 | 531 | 322 -39% | 554 4% | 397 ? -25% | |||
| WiFi v1.3 | 496 | 372 -25% | 370 -25% | 264 -47% | 433 -13% | 268 -46% | 366 ? -26% |
| Load | 120 | 87 -27% | 116 -3% | 48 -60% | 84 -30% | 53 -56% | 83.9 ? -30% |


Pros
Cons
Verdict - Good performance, low price

The HP Pavilion Gaming 16 is a low-priced gaming notebook with good hardware. Despite a bigger screen, the device is barely larger than comparable 15.6-inch laptops. We have taken a close look at the configuration with the Intel Core i5-10300H and the NVIDIA GeForce GTX 1650 Ti. Currently, our review device retails for about 900 Euros (~$1,068), which is entirely justified given the specifications. The amount of storage space can be criticised, because 512 GB is not much for a gaming laptop. However, users can easily expand the storage capacity. In our review, the Pavilion Gaming 16 delivered a good level of performance, even though the GeForce GTX 1650 Ti is a low-end dedicated graphics card. Having said that, the GPU is still powerful enough to be able to run many video games at 1080p on the highest settings.
The HP Pavilion Gaming 16 is a gaming laptop with a very good price-to-performance ratio.
Users will have to make do with relatively poor multi-core performance, because the Core i5-10300H has only four cores. When it comes to the ports, the Pavilion Gaming 16 offers the bare minimum. An additional USB Type-A port would have come in handy. Wi-Fi 6 would also be a welcome inclusion. However, our review device comes with 16 GB of RAM and an IPS display with a good contrast ratio.
HP Pavilion Gaming 16-a0242ng
-
08/19/2020 v7
Sebastian Bade
More articles related to this device
HP Pavilion Gaming 16-a0242ng (Pavilion Gaming 16 Series)Related Articles

Pricecompare
