Dell Latitude 3510 Review: Good Battery Life Despite Small Battery

Dell’s Latitude 3510 is an entry-level 15.6-inch business notebook. Our review unit was equipped with a Core i3-10110U. Its competitors are devices such as the HP Probook 455 G7, Acer Extensa 15 EX215-51, or Lenovo Thinkpad E15.
Rating | Date | Model | Weight | Height | Size | Resolution | Price |
|---|---|---|---|---|---|---|---|
| 81 % v7 (old) | 12 / 2020 | Dell Latitude 15 3510 NK2MC i3-10110U, UHD Graphics 620 | 1.9 kg | 18 mm | 15.60" | 1920x1080 | |
| 83.9 % v7 (old) | 11 / 2020 | Lenovo ThinkPad E15 Gen2-20T9S00K00 R7 4700U, Vega 7 | 1.8 kg | 18.9 mm | 15.60" | 1920x1080 | |
| 82.6 % v7 (old) | 07 / 2020 | HP ProBook 455 G7-175W8EA R7 4700U, Vega 7 | 1.8 kg | 19 mm | 15.60" | 1920x1080 | |
| 76.6 % v7 (old) | 02 / 2020 | Acer Extensa 15 EX215-51-56UX i5-10210U, UHD Graphics 620 | 1.9 kg | 19.9 mm | 15.60" | 1920x1080 |
Case & Connectivity – Latitude in Plastic
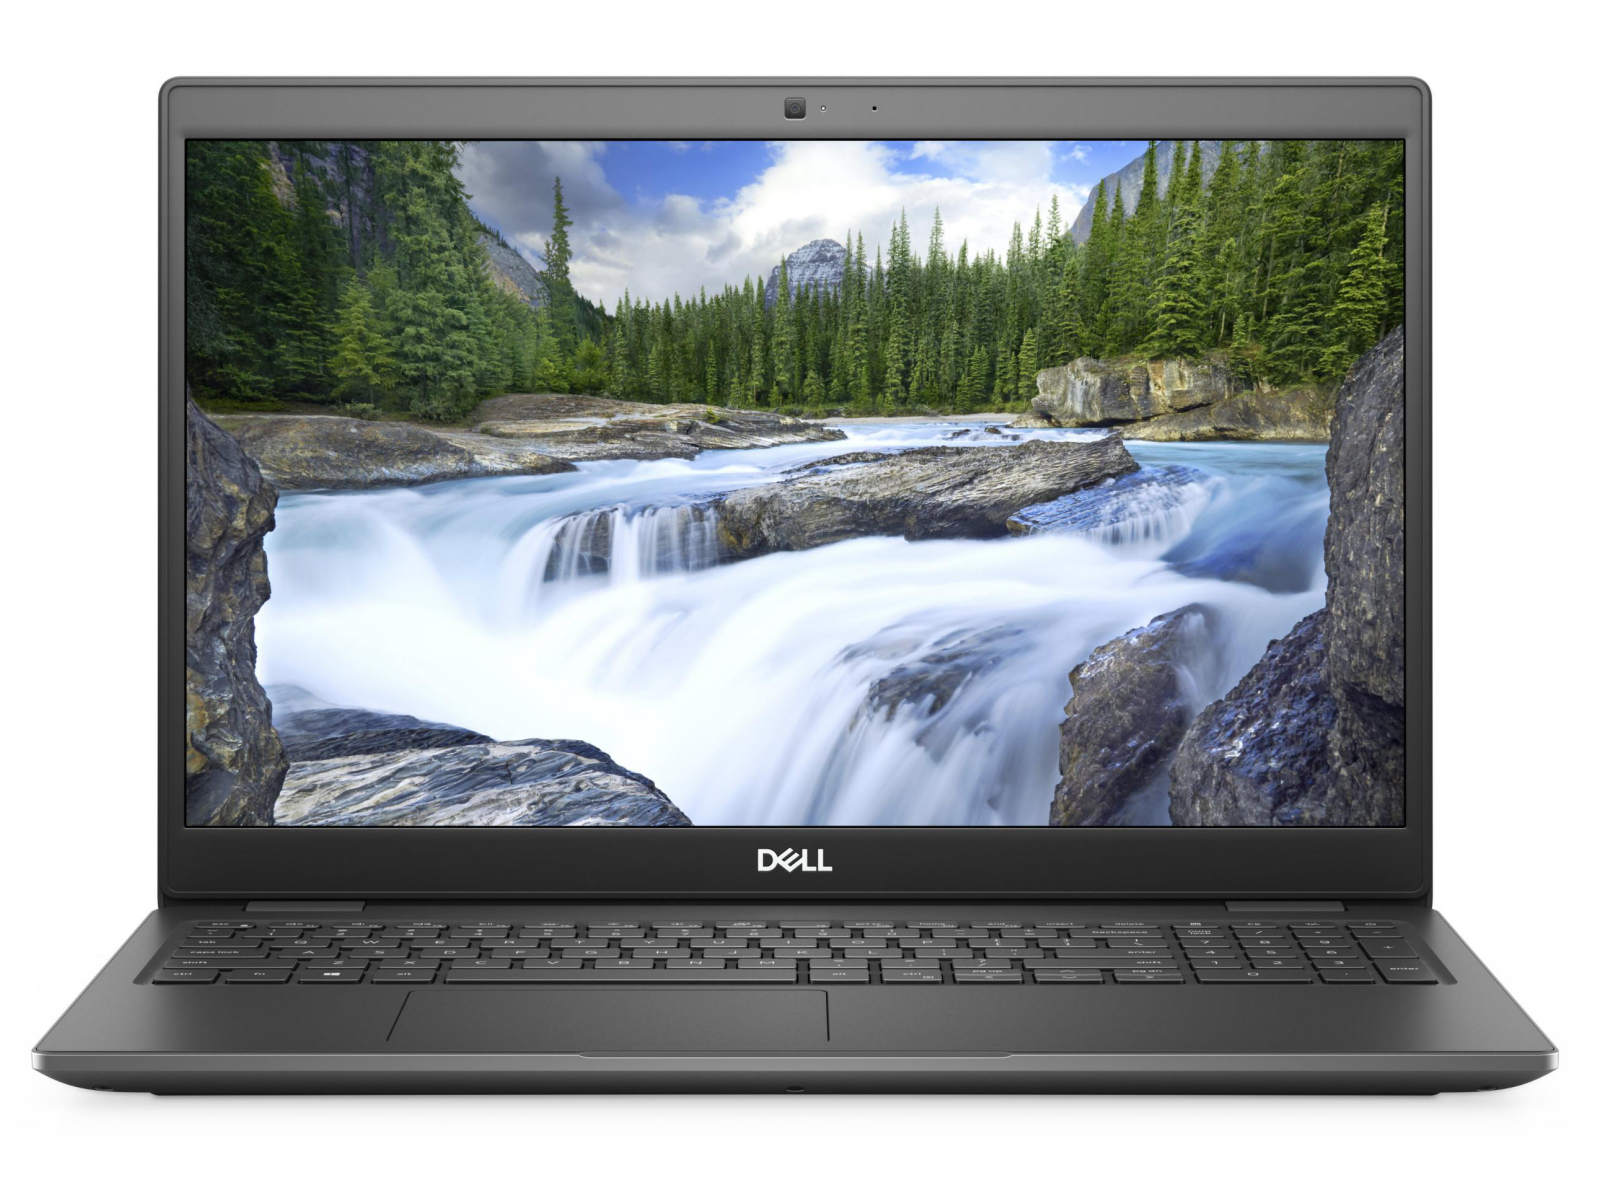
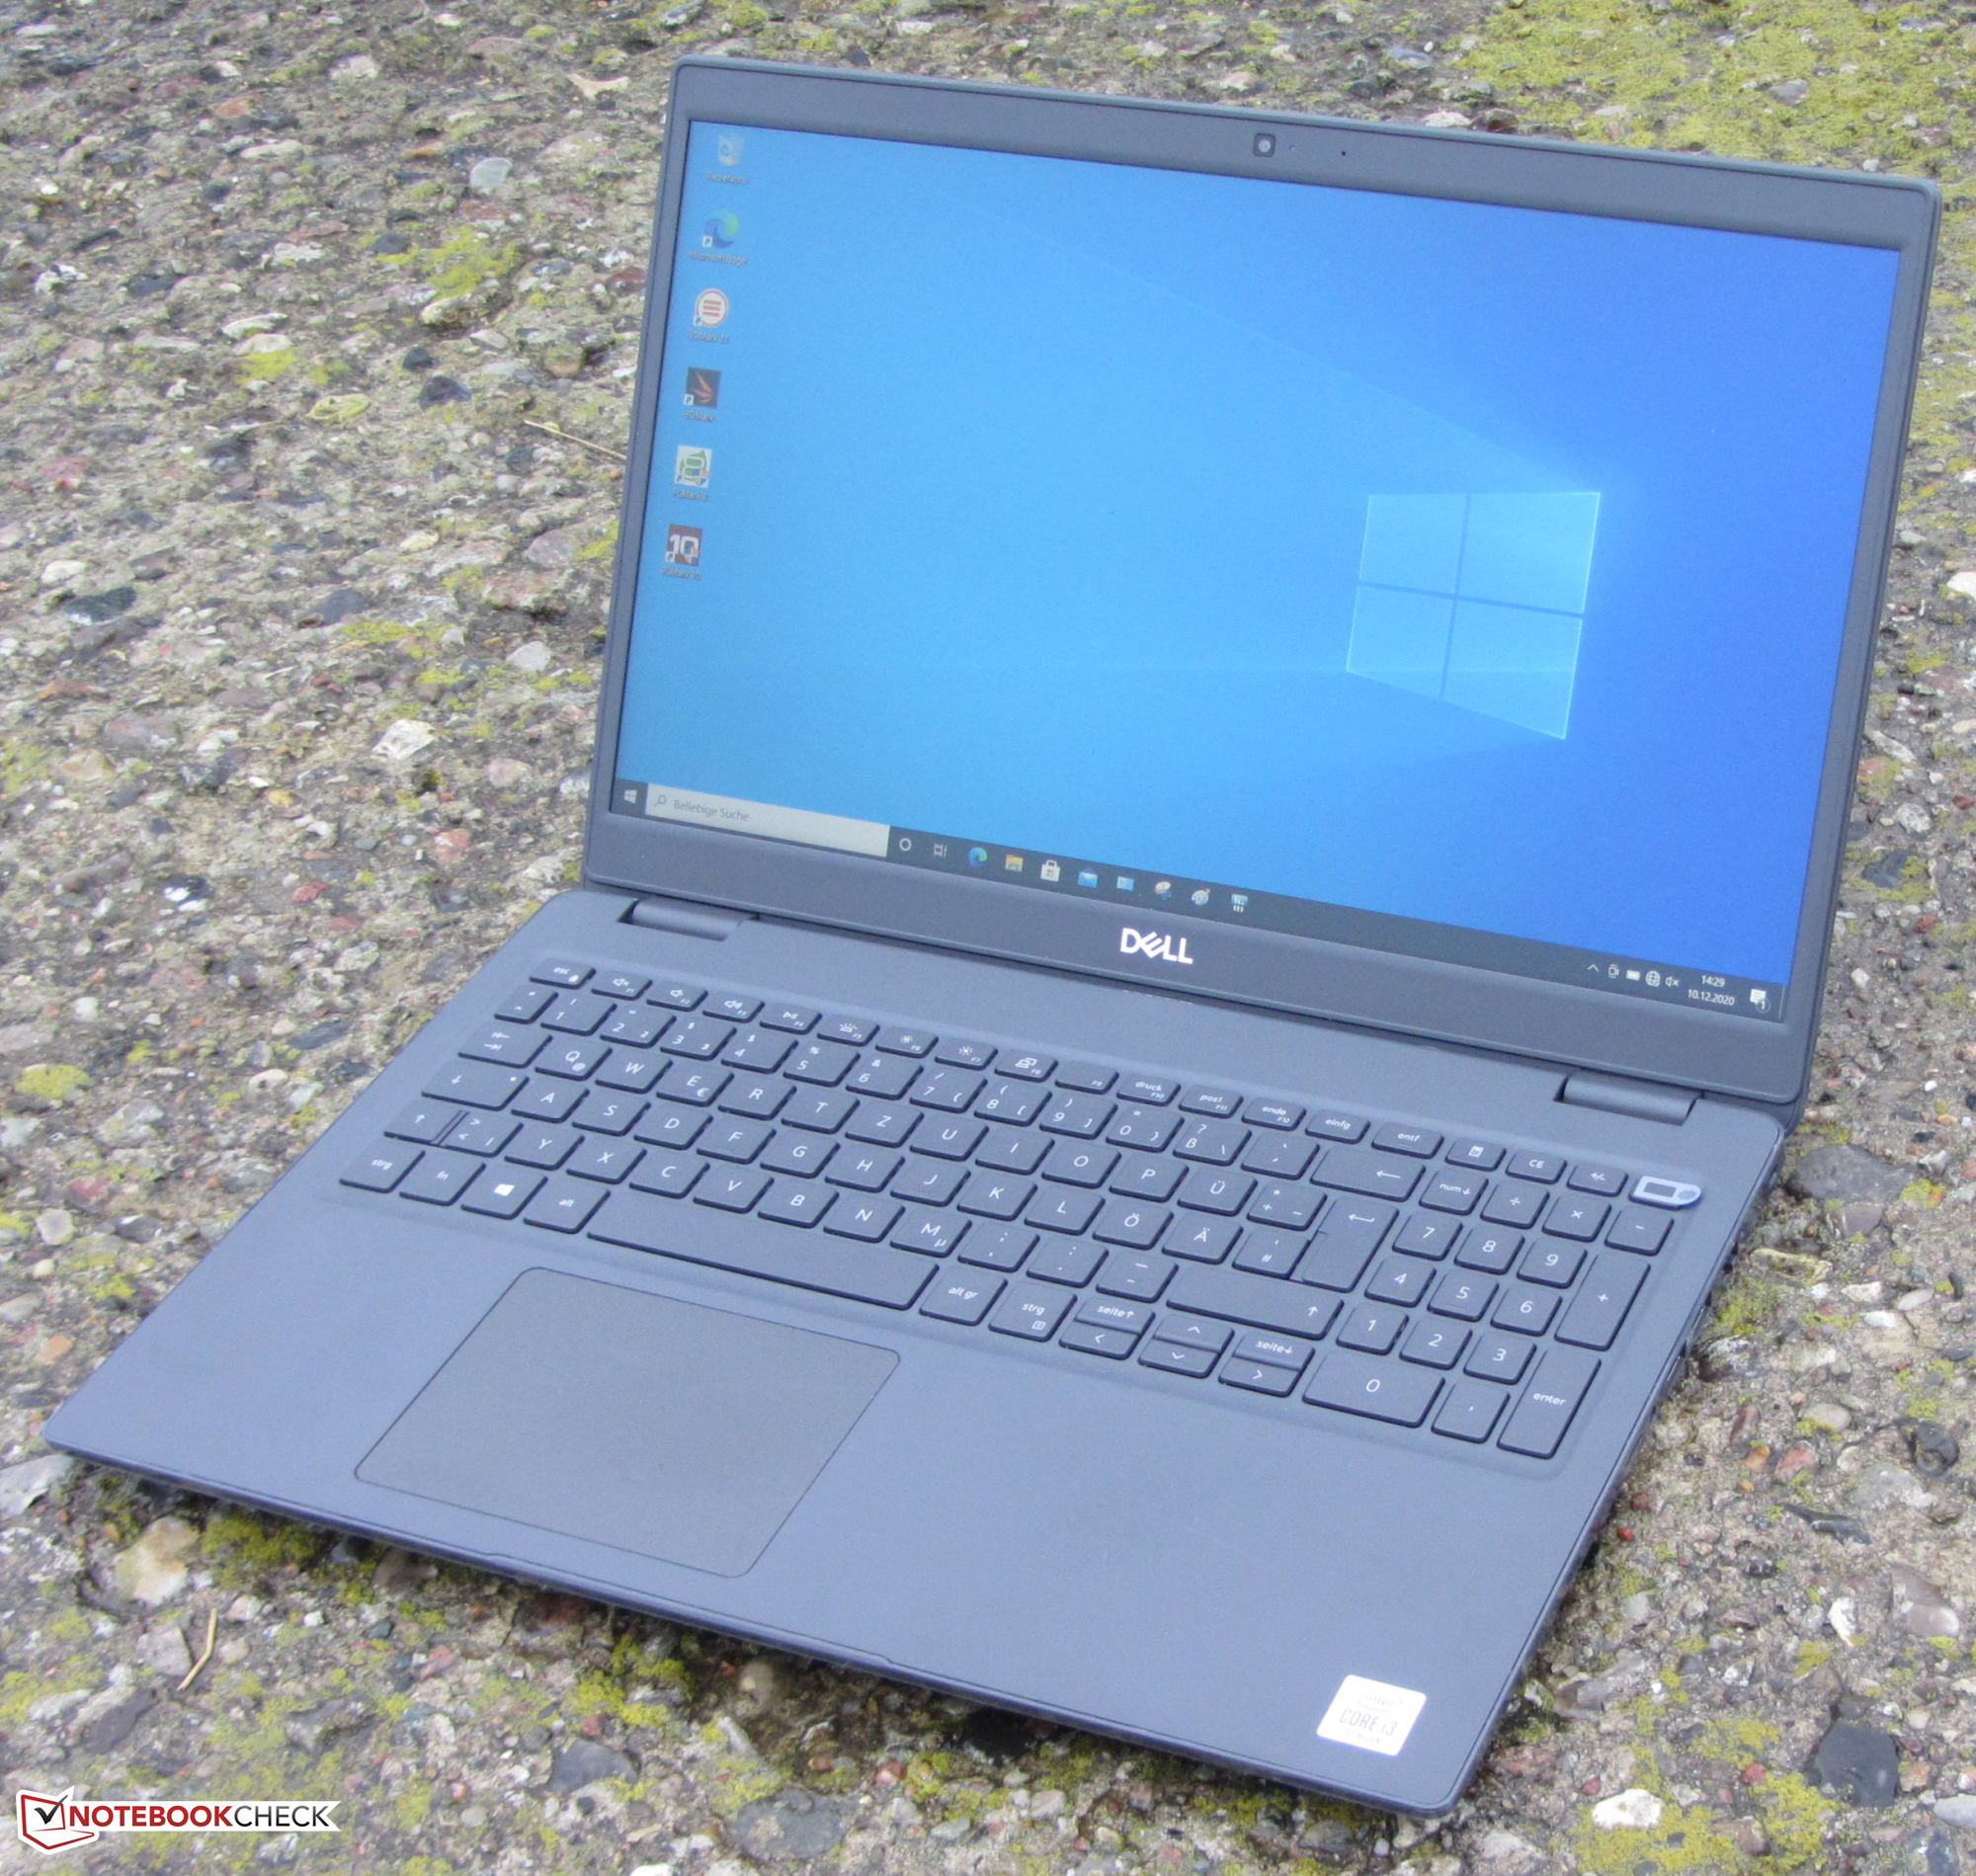
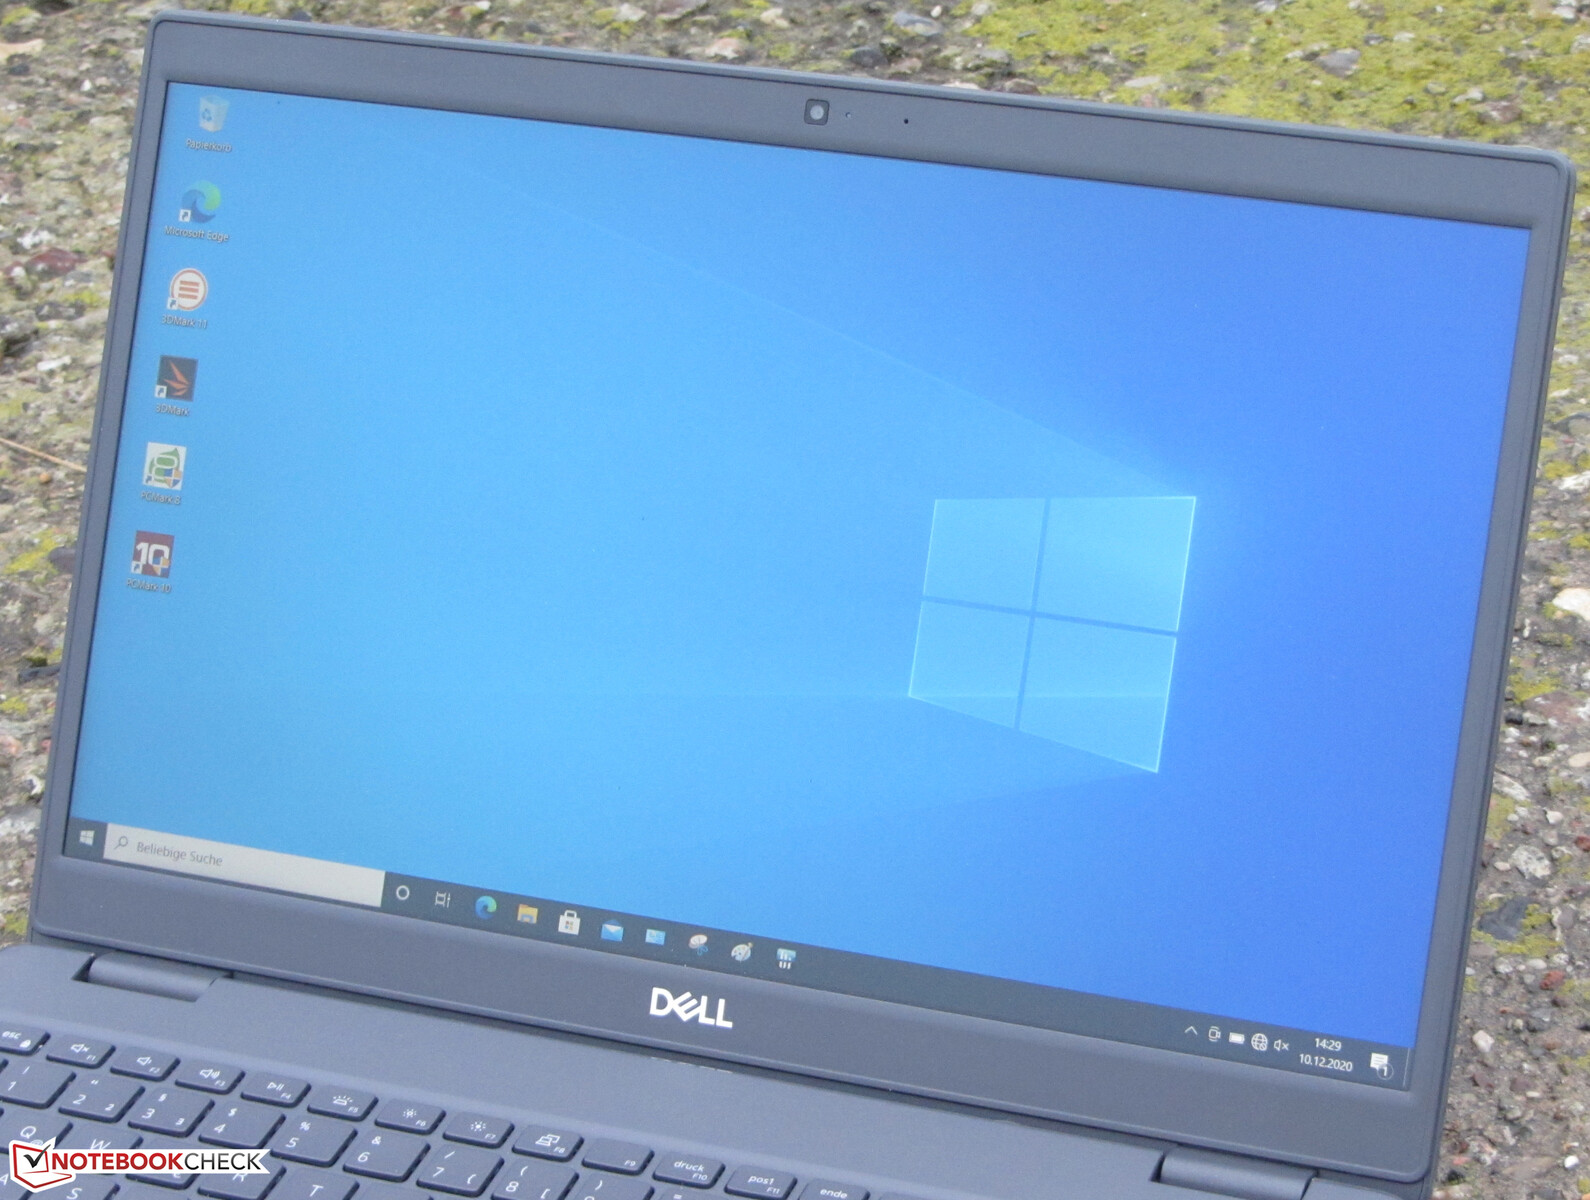
The Latitude’s case lacks high-quality premium materials. Instead, Dell clads its entry-level business notebook in gray plastic with a matte roughened surface. The sides are an exception as they are made out of smooth glossy plastic. Overall chassis quality was okay. Sturdiness was not. The battery is not user replaceable. The internal hardware can be accessed by removing the bottom cover.
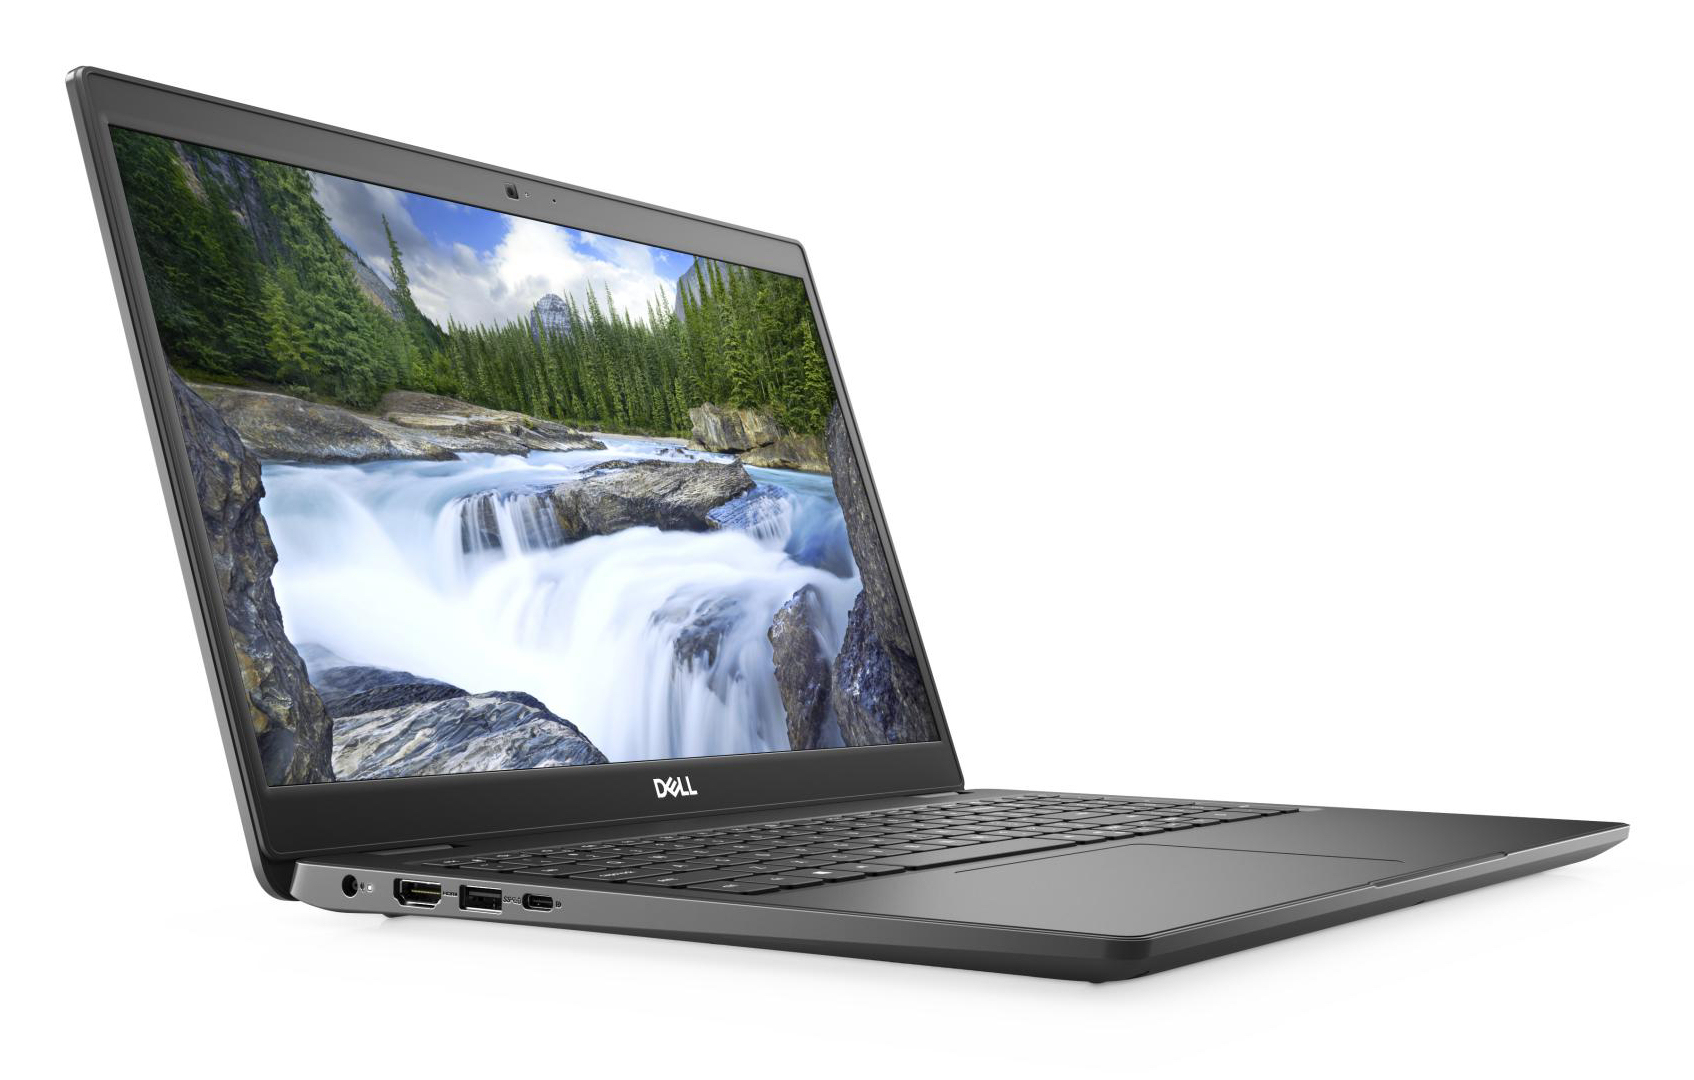
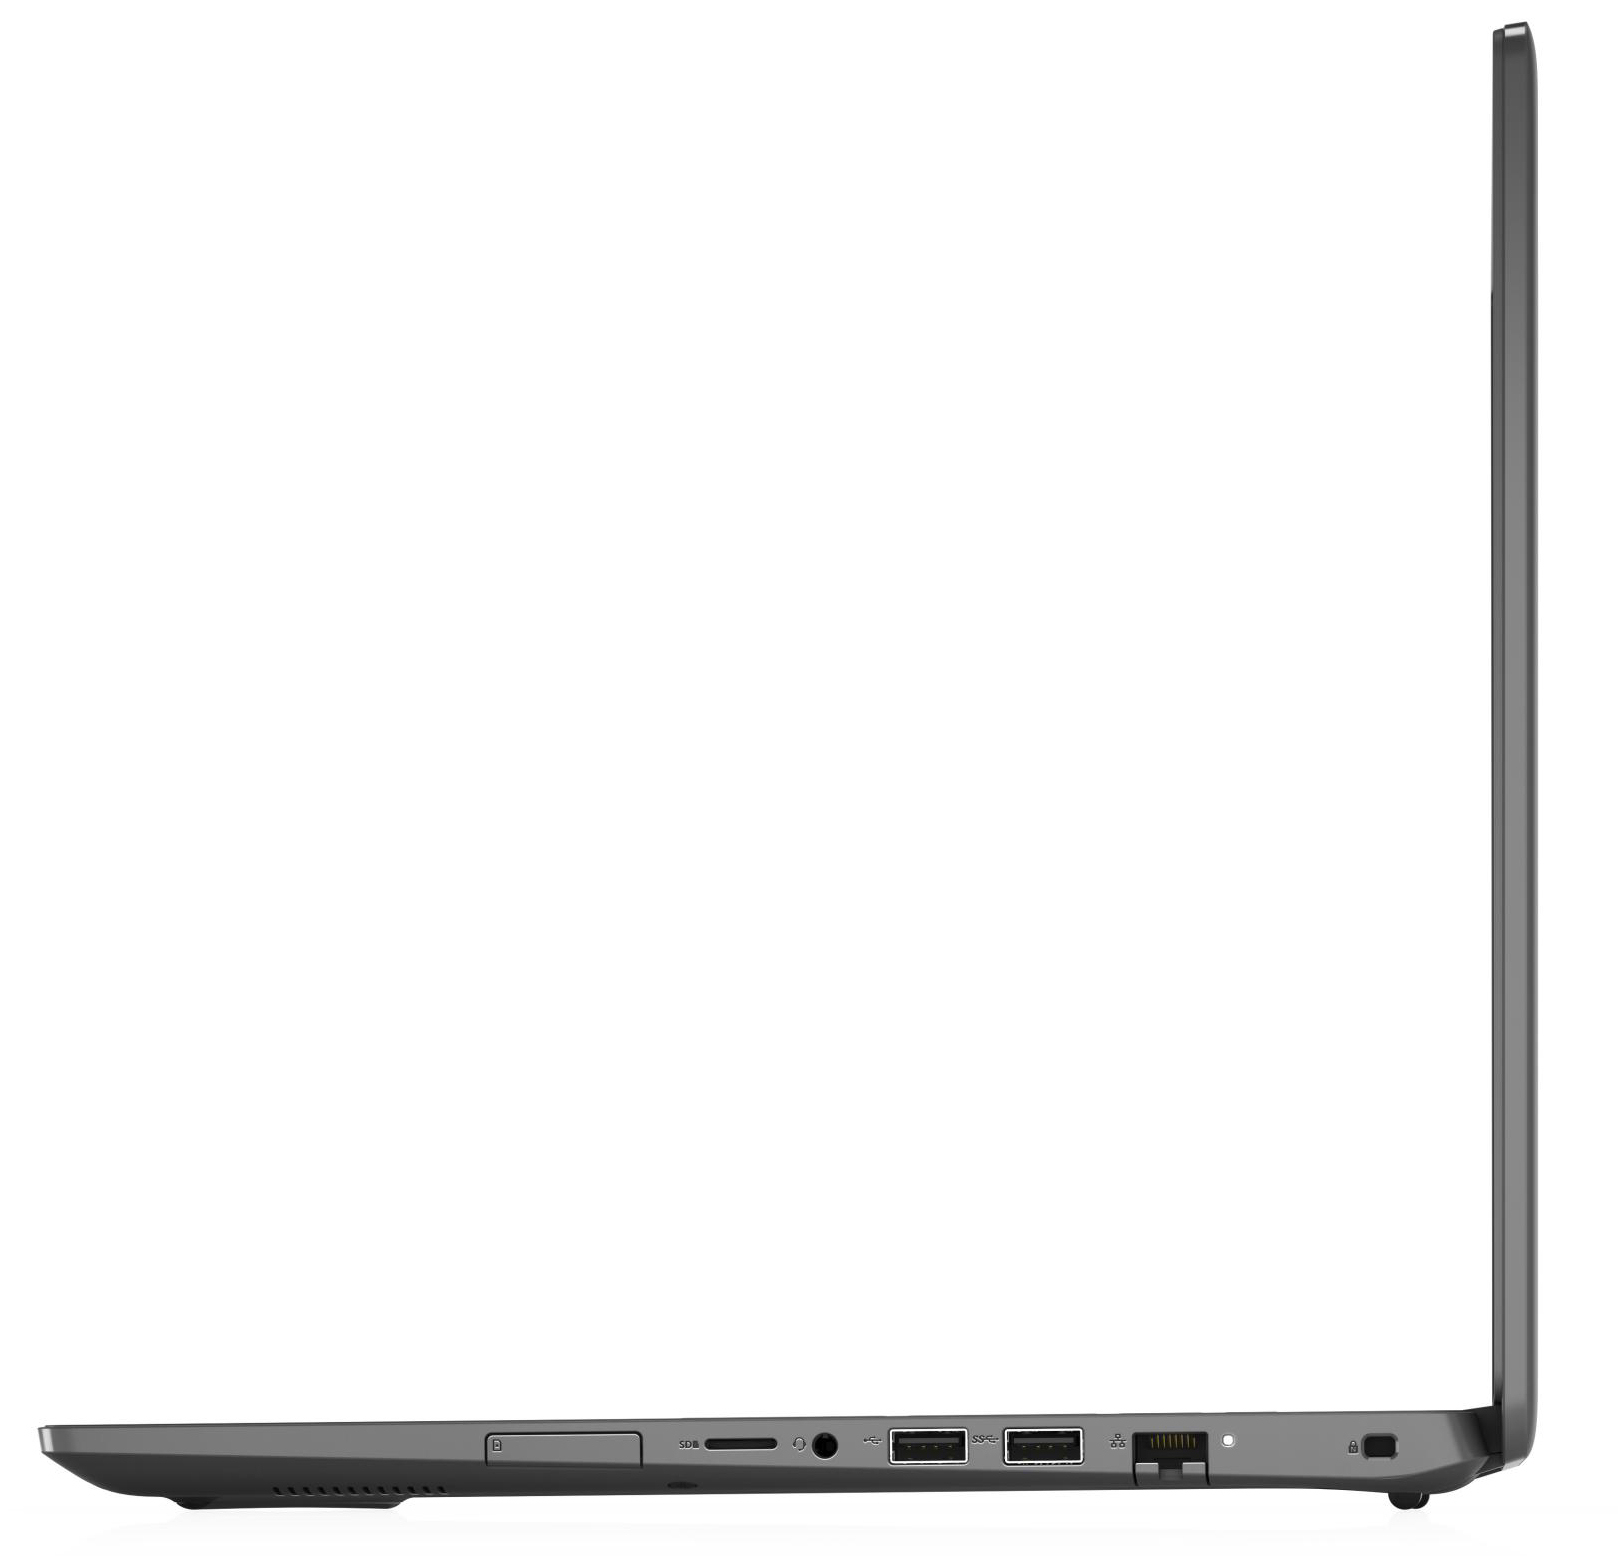
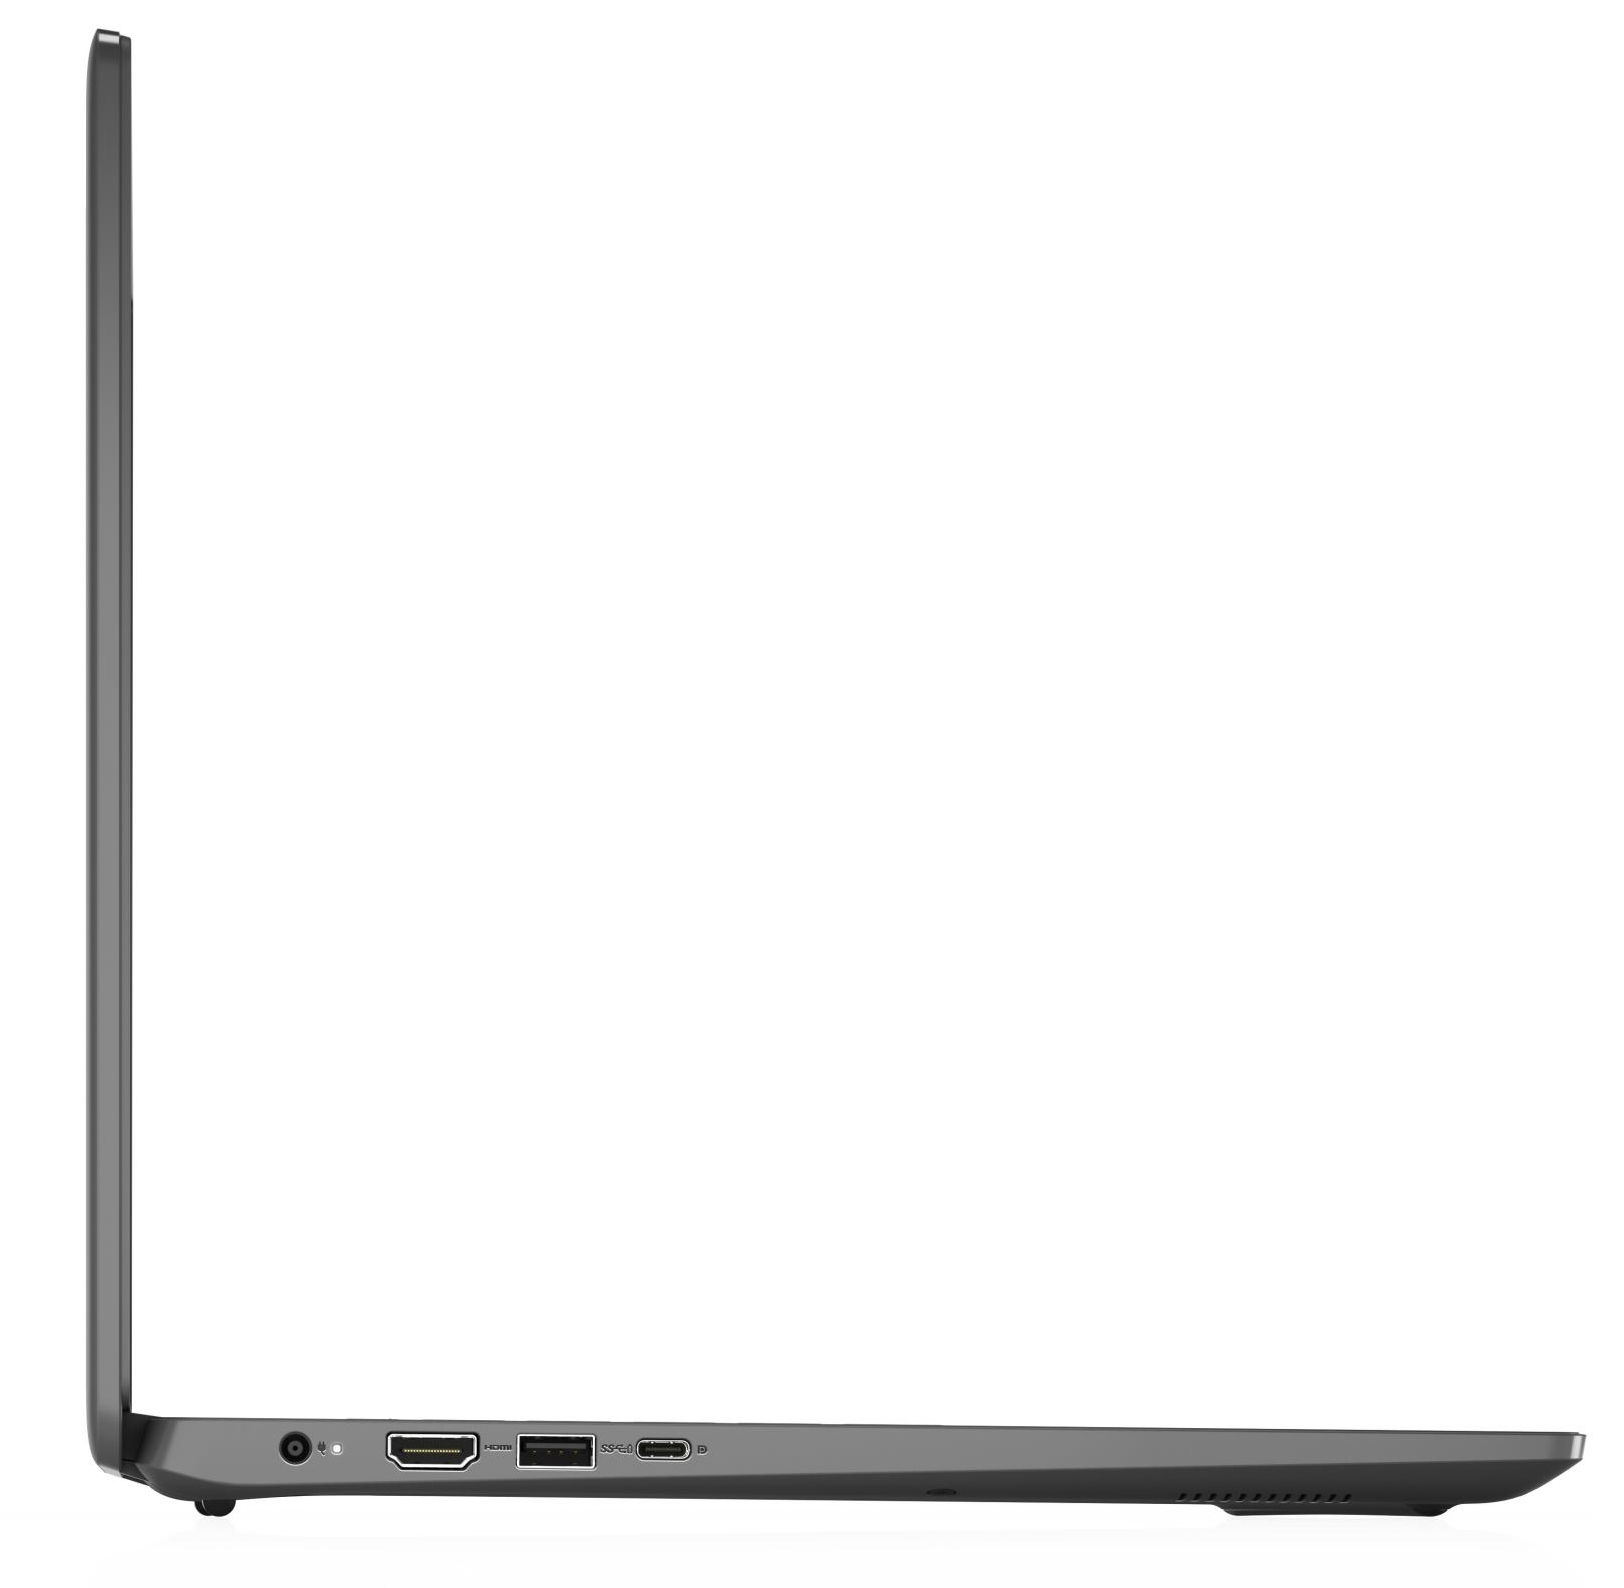
A total of three USB-A ports (1x USB 2.0, 2x USB 3.2 Gen 1) as well as a single USB-C port (USB 3.2 Gen 1) are available. The latter supports Power Delivery and DisplayPort via USB-C. Combined with the HDMI port, the Latitude 3510 features a total of two display outputs.
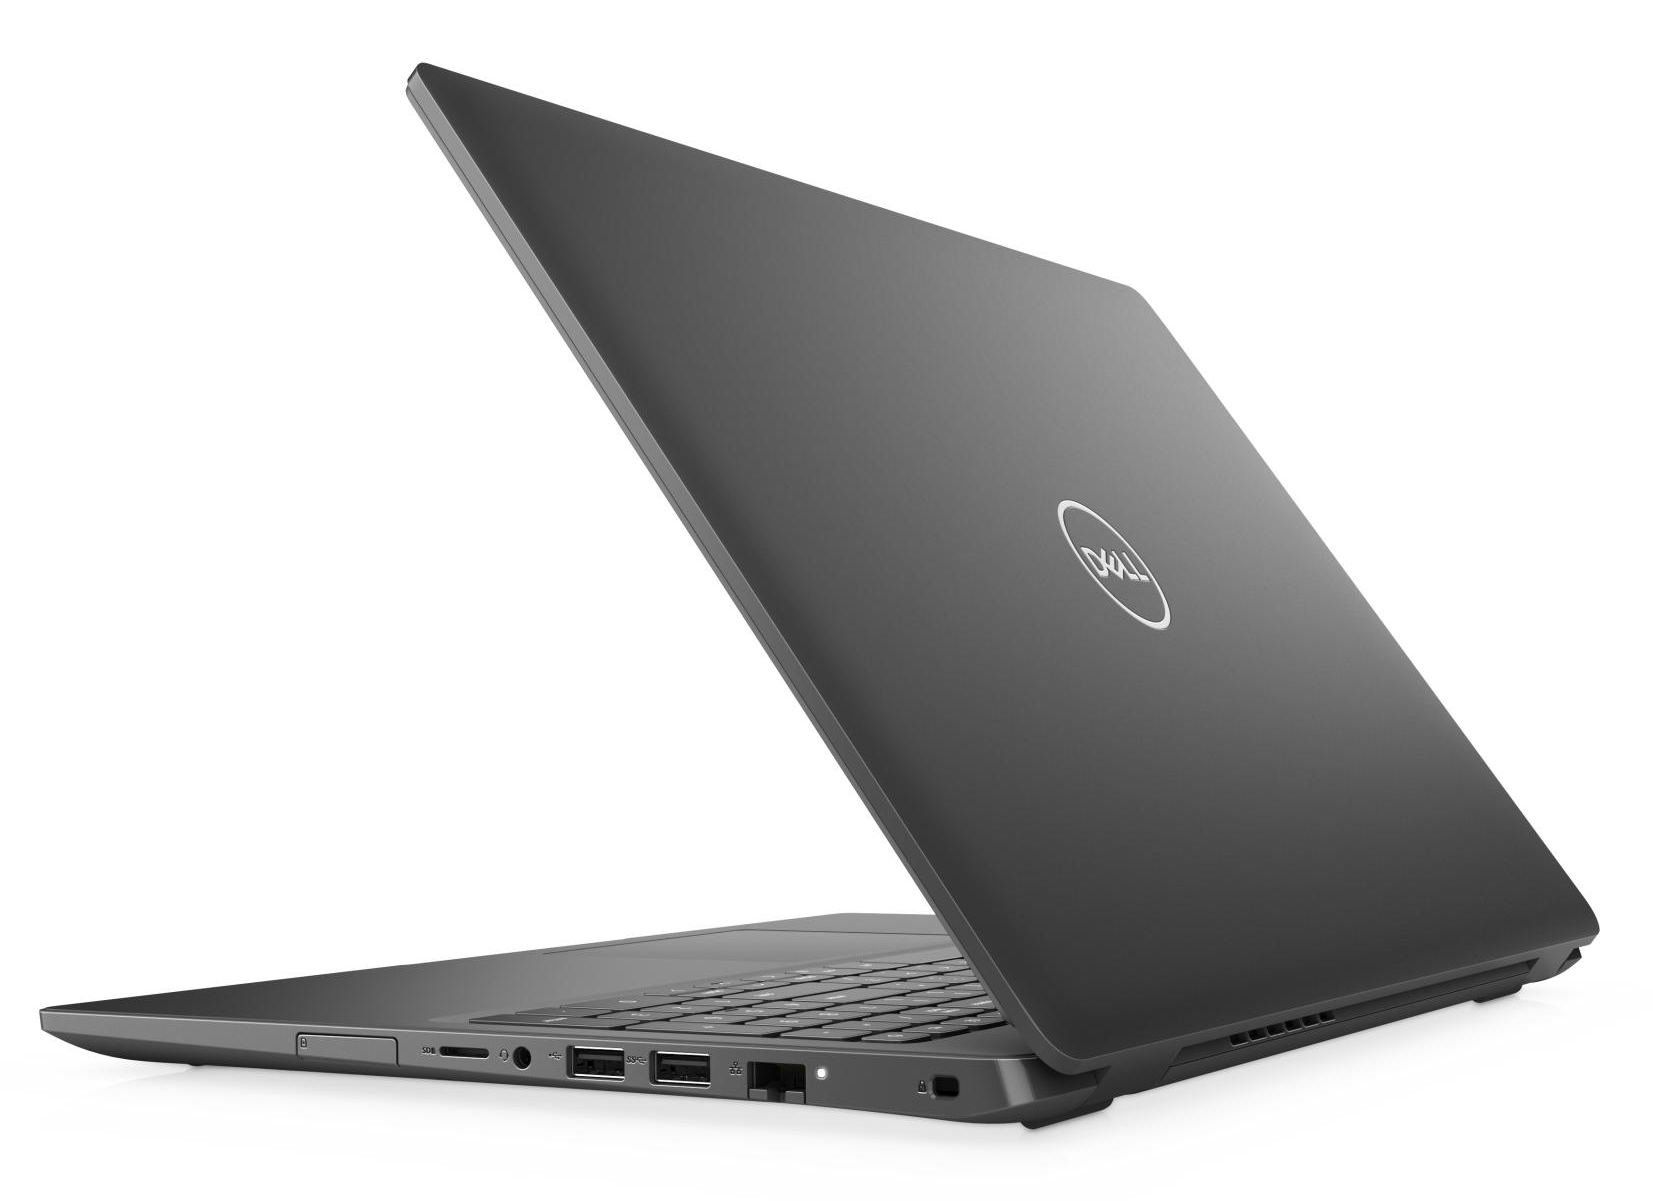
When benchmarked with our 64 GB Toshiba Exceria Pro M501 microSDXC reference card the card reader peaked at just 27.5 MB/s (copying large blocks of data) and 20.5 MB/s (copying 250 JPEG files with 5 MB each). It is thus of the slower variety.
Intel’s AX201 Wi-Fi chip supports 802.11 a/b/g/n/ac/ax as well as Bluetooth 5. It performed well under ideal conditions (no other Wi-Fi devices nearby, low distance between notebook and server, connected to our Netgear Nighthawk AX12 reference router).
Dell also offers Latitude SKUs with built-in LTE modems. Our review unit did not feature one. It cannot be added retroactively either since the laptop lacks the SIM slot, the antennas, and the necessary port.
Connectivity


| SD Card Reader | |
| average JPG Copy Test (av. of 3 runs) | |
| HP ProBook 455 G7-175W8EA (Toshiba Exceria Pro SDXC 64 GB UHS-II) | |
| HP ProBook 450 G7 8WC04UT (Toshiba Exceria Pro SDXC 64 GB UHS-II) | |
| Average of class Office (19.8 - 198.5, n=22, last 2 years) | |
| Dell Latitude 15 3510 NK2MC (Toshiba Exceria Pro M501 microSDXC 64GB) | |
| maximum AS SSD Seq Read Test (1GB) | |
| HP ProBook 455 G7-175W8EA (Toshiba Exceria Pro SDXC 64 GB UHS-II) | |
| HP ProBook 450 G7 8WC04UT (Toshiba Exceria Pro SDXC 64 GB UHS-II) | |
| Average of class Office (27.4 - 249, n=21, last 2 years) | |
| Dell Latitude 15 3510 NK2MC (Toshiba Exceria Pro M501 microSDXC 64GB) | |


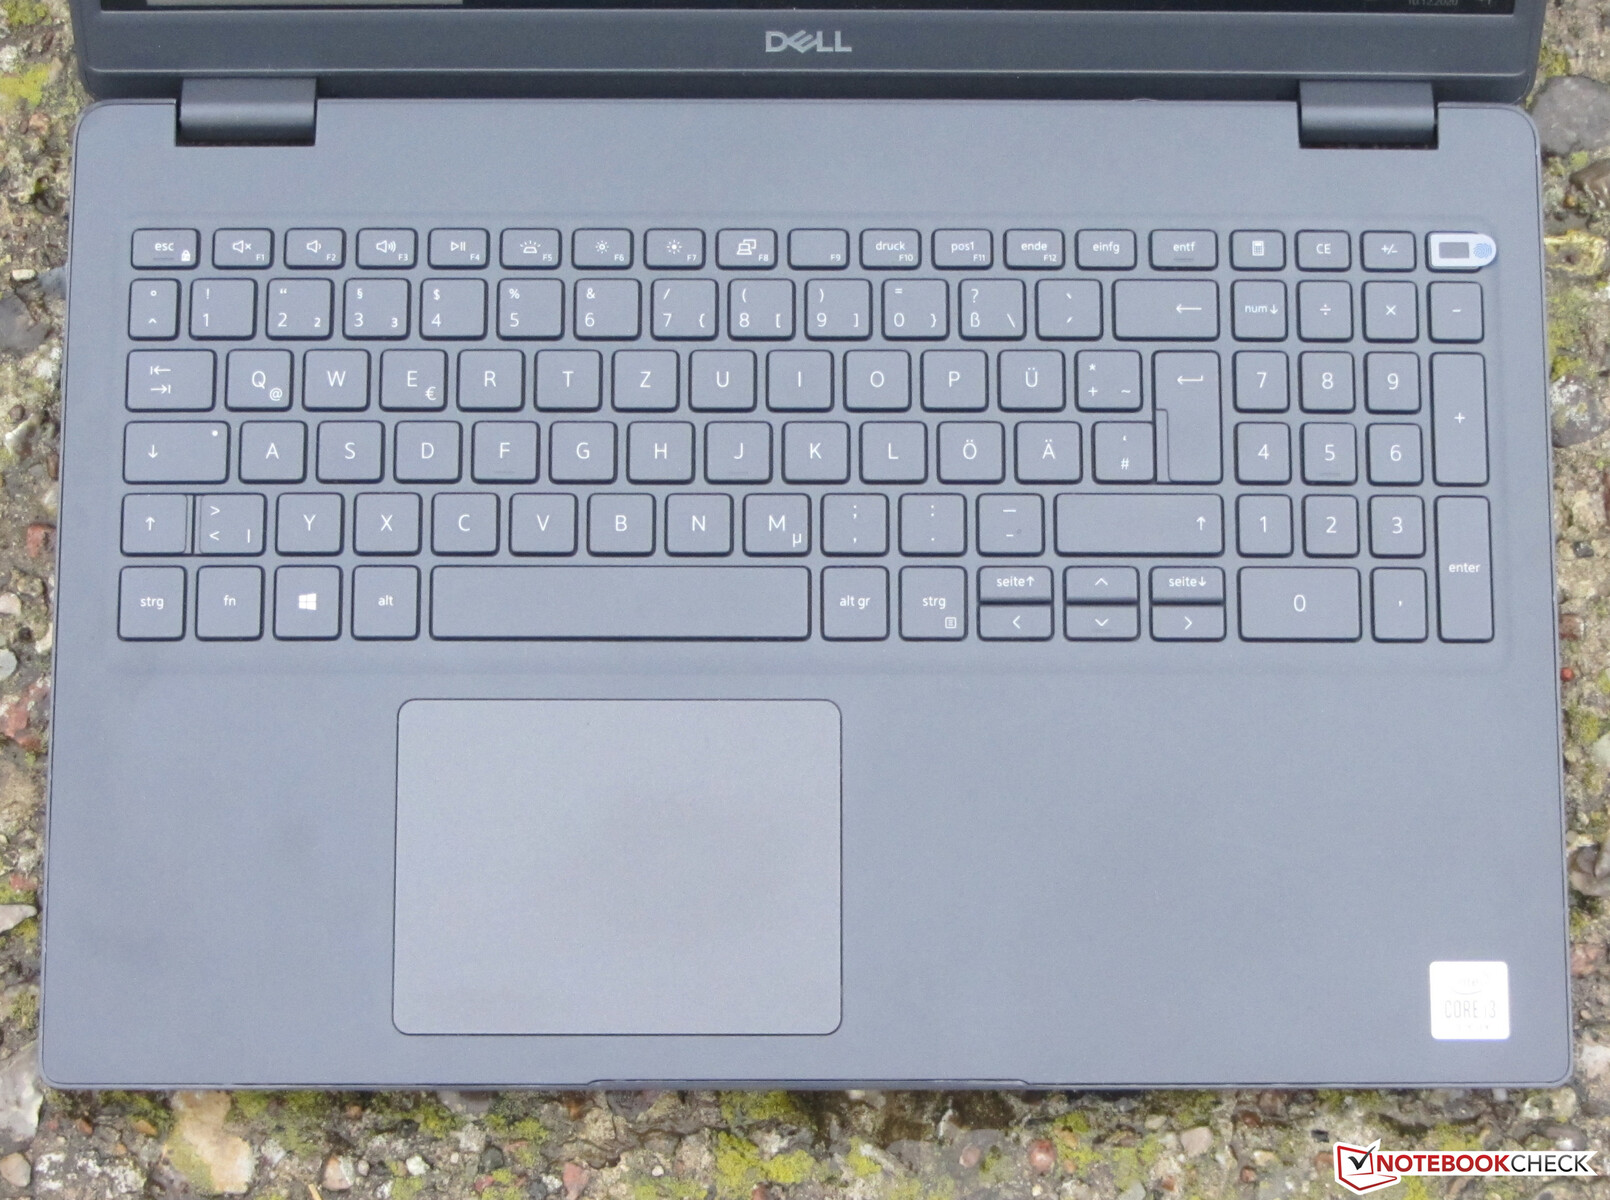
Input Devices – 3510 Features a Backlit Keyboard
The chiclet keyboard’s even smooth keys offer short key travel and a clear accentuation point. Overall key resistance was okay. The keyboard flexed slightly while typing. This was not an issue. The two-stage backlight can be turned on or off via a function key. All in all, the keyboard turned out to be suitable for everyday use.
The multitouch-capable clickpad (ca. 10.5 x 8 cm / 4.1 x 3.2 inches) registered input up to its very edges. The smooth surface rendered using it very easy and comfortable. The pad offers short travel and a clear accentuation point.
Display – Dell Laptop with Dim Display
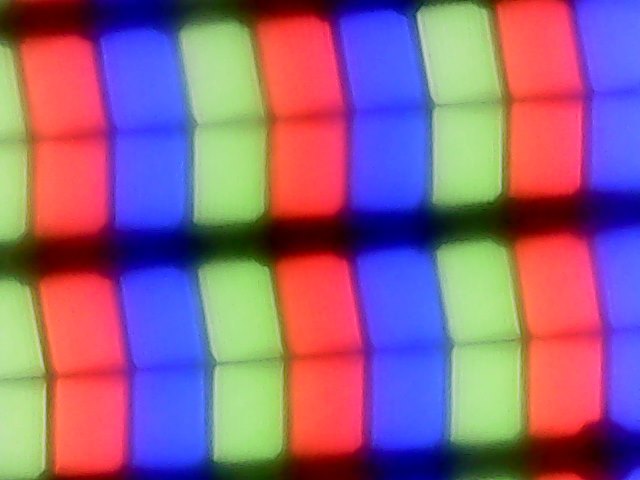
The Latitude’s matte 15.6-inch display runs at a native resolution of 1920 x 1080. Both brightness (235.9 nits) and contrast ratio (845:1) are too low. In order to be considered acceptable by us brightness has to be north of 300 nits and contrast ratios above 1,000:1.
The display flickered at a frequency of 250 Hz, which could use eye strain and/or headaches in sensitive users.
| |||||||||||||||||||||||||
Brightness Distribution: 86 %
Center on Battery: 230 cd/m²
Contrast: 845:1 (Black: 0.31 cd/m²)
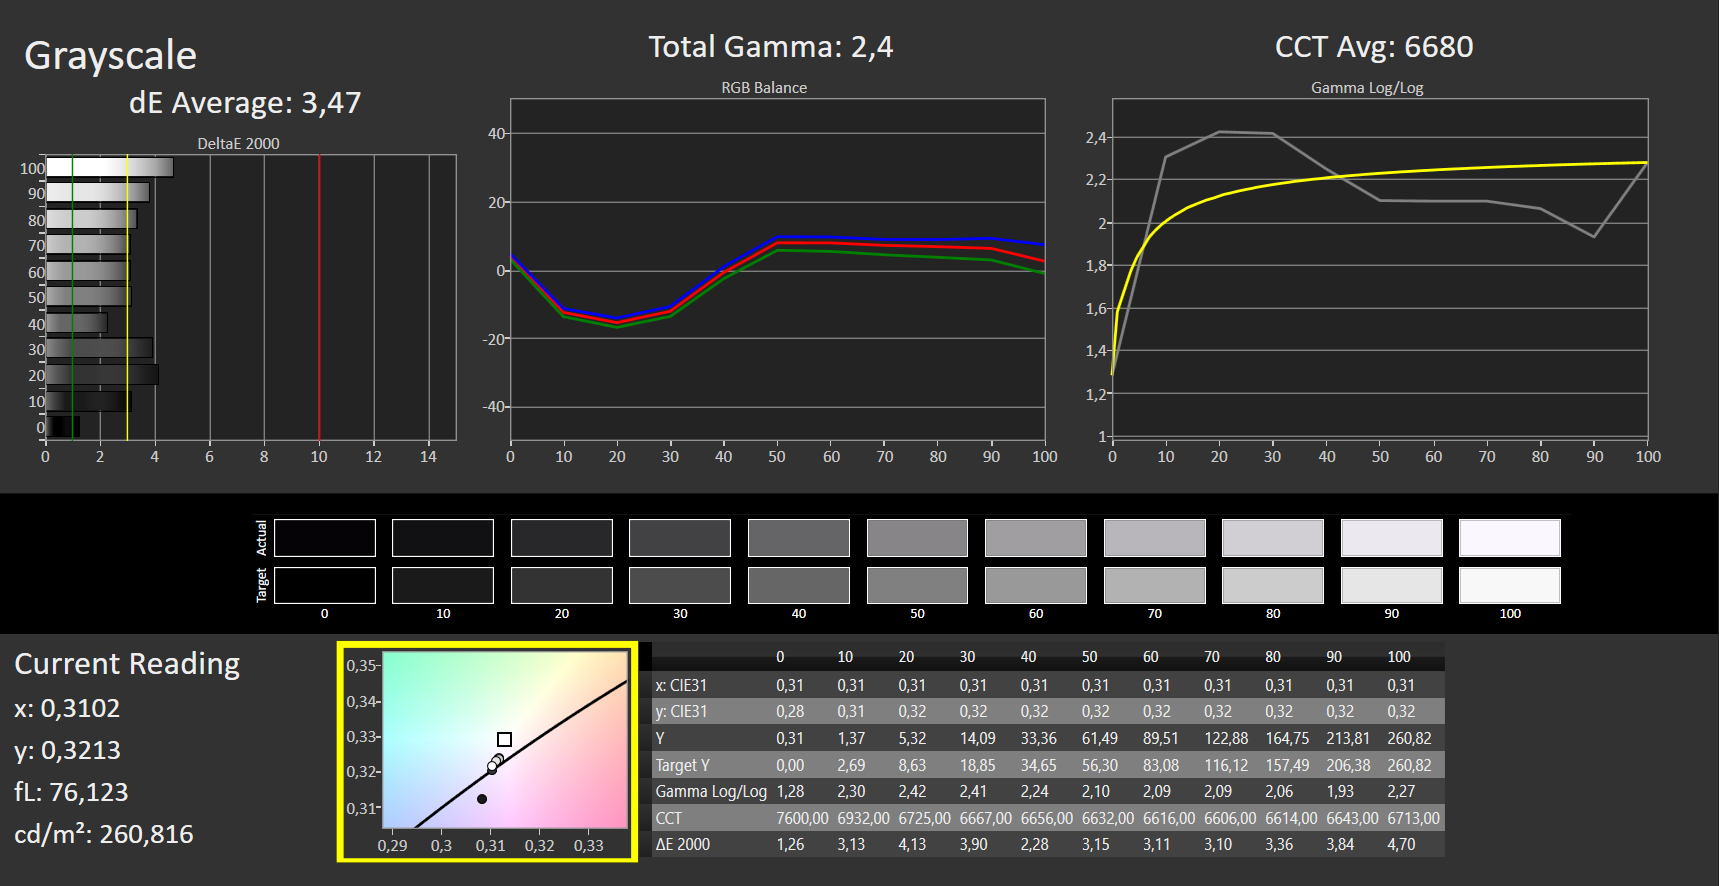
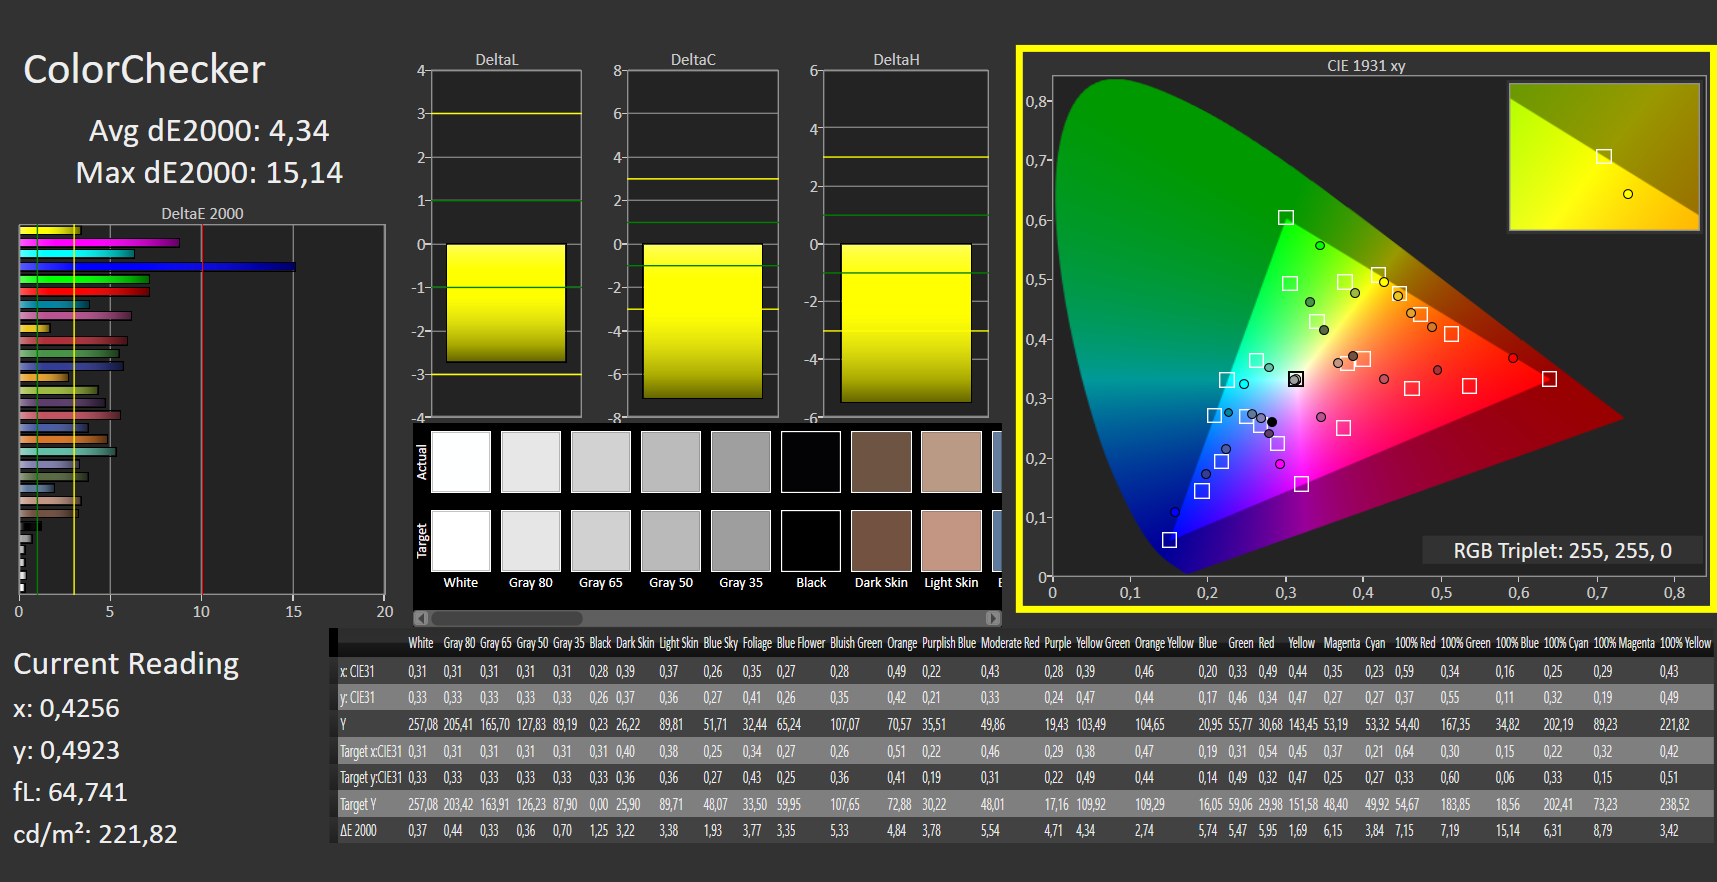
ΔE ColorChecker Calman: 4.92 | ∀{0.5-29.43 Ø4.71}
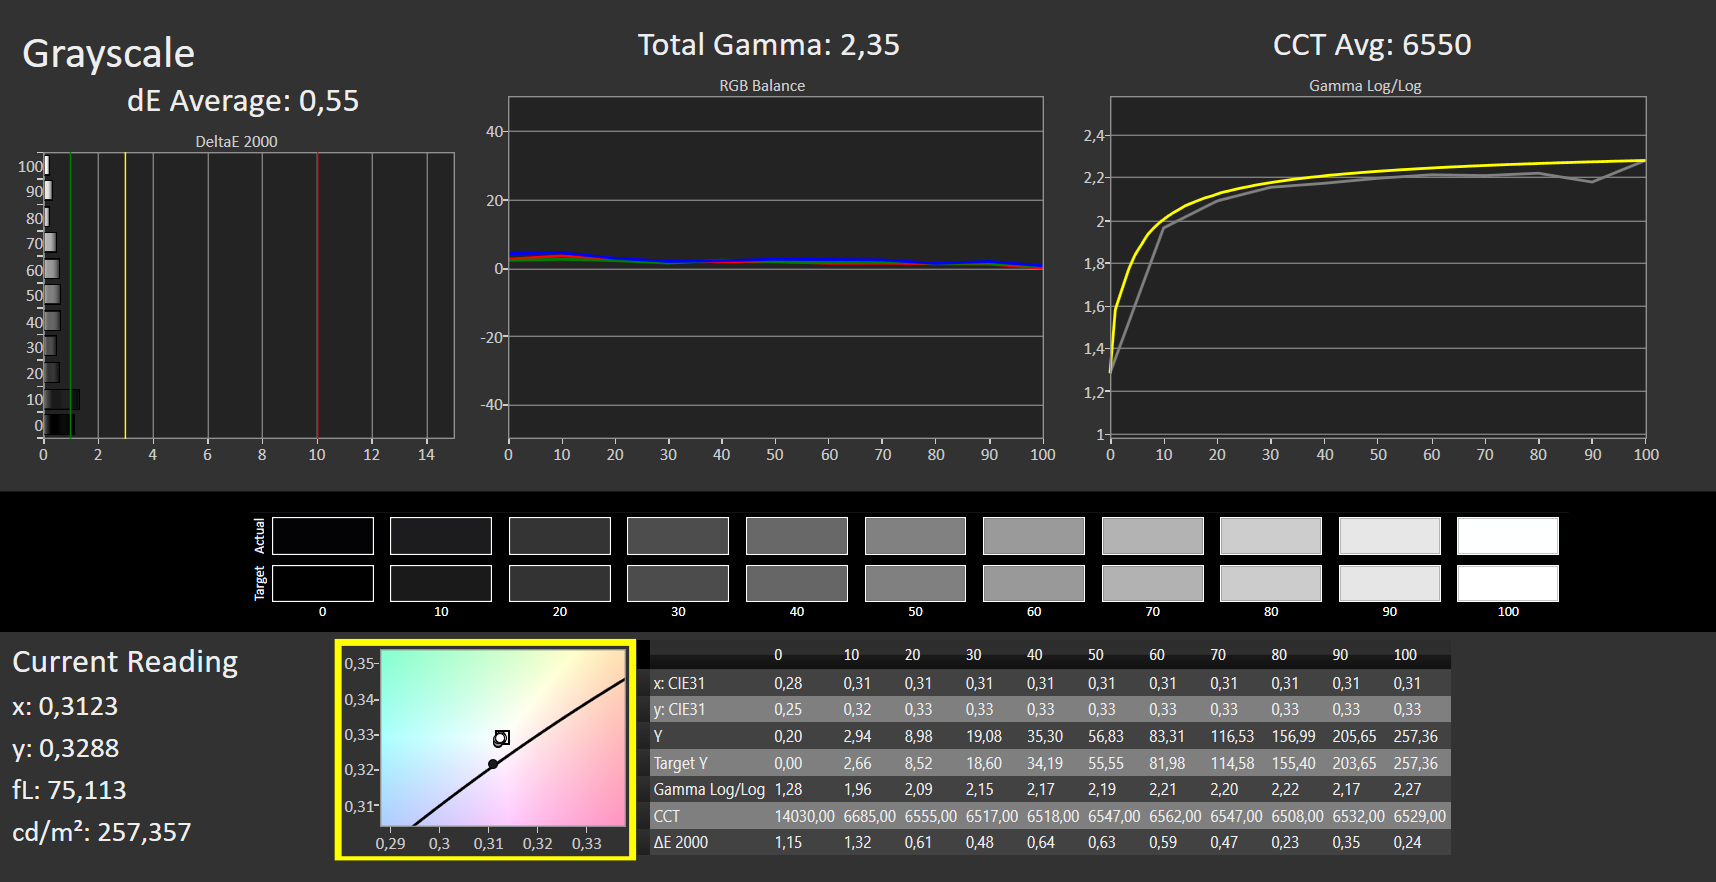
calibrated: 4.34
ΔE Greyscale Calman: 3.47 | ∀{0.09-98 Ø4.96}
61% sRGB (Argyll 1.6.3 3D)
39% AdobeRGB 1998 (Argyll 1.6.3 3D)
42.15% AdobeRGB 1998 (Argyll 3D)
61.3% sRGB (Argyll 3D)
40.78% Display P3 (Argyll 3D)
Gamma: 2.4
CCT: 6680 K
| Dell Latitude 15 3510 NK2MC Dell 156CL05, IPS, 1920x1080, 15.6" | Lenovo ThinkPad E15 Gen2-20T9S00K00 B156HAN02.1, IPS, 1920x1080, 15.6" | HP ProBook 450 G7 8WC04UT LG Philips LGD062E, IPS, 1920x1080, 15.6" | HP ProBook 455 G7-175W8EA AUO, B156HW02, IPS, 1920x1080, 15.6" | Acer Extensa 15 EX215-51-56UX BOE CQ NT156FHM-N61, TN LED, 1920x1080, 15.6" | |
|---|---|---|---|---|---|
| Display | -6% | -7% | -7% | -6% | |
| Display P3 Coverage (%) | 40.78 | 38.42 -6% | 37.9 -7% | 37.92 -7% | 38.17 -6% |
| sRGB Coverage (%) | 61.3 | 57.8 -6% | 56.5 -8% | 57.1 -7% | 57.5 -6% |
| AdobeRGB 1998 Coverage (%) | 42.15 | 39.69 -6% | 39.08 -7% | 39.18 -7% | 39.44 -6% |
| Response Times | -17% | -1% | -1% | 19% | |
| Response Time Grey 50% / Grey 80% * (ms) | 38 ? | 46.8 ? -23% | 35.2 ? 7% | 41 ? -8% | 41 ? -8% |
| Response Time Black / White * (ms) | 28 ? | 31.2 ? -11% | 30.4 ? -9% | 26 ? 7% | 15 ? 46% |
| PWM Frequency (Hz) | 250 | ||||
| Screen | -5% | -11% | 7% | -61% | |
| Brightness middle (cd/m²) | 262 | 249 -5% | 259.8 -1% | 282 8% | 203 -23% |
| Brightness (cd/m²) | 236 | 239 1% | 251 6% | 264 12% | 188 -20% |
| Brightness Distribution (%) | 86 | 87 1% | 91 6% | 88 2% | 87 1% |
| Black Level * (cd/m²) | 0.31 | 0.22 29% | 0.42 -35% | 0.19 39% | 0.635 -105% |
| Contrast (:1) | 845 | 1132 34% | 619 -27% | 1484 76% | 320 -62% |
| Colorchecker dE 2000 * | 4.92 | 6.7 -36% | 6.09 -24% | 5.56 -13% | 10.84 -120% |
| Colorchecker dE 2000 max. * | 15.83 | 19.7 -24% | 16.33 -3% | 19.07 -20% | 22.18 -40% |
| Colorchecker dE 2000 calibrated * | 4.34 | 4.4 -1% | 5.2 -20% | 4.5 -4% | 5.09 -17% |
| Greyscale dE 2000 * | 3.47 | 5.1 -47% | 3.7 -7% | 3.57 -3% | 12.87 -271% |
| Gamma | 2.4 92% | 2.48 89% | 2.56 86% | 2.61 84% | 2.58 85% |
| CCT | 6680 97% | 7277 89% | 6759 96% | 6895 94% | 15854 41% |
| Color Space (Percent of AdobeRGB 1998) (%) | 39 | 36.6 -6% | 35.7 -8% | 36 -8% | 36.4 -7% |
| Color Space (Percent of sRGB) (%) | 61 | 57.7 -5% | 56.2 -8% | 57 -7% | 57.4 -6% |
| Total Average (Program / Settings) | -9% /
-7% | -6% /
-9% | -0% /
4% | -16% /
-41% |
* ... smaller is better
Display Response Times
| ↔ Response Time Black to White | ||
|---|---|---|
| 28 ms ... rise ↗ and fall ↘ combined | ↗ 17 ms rise | 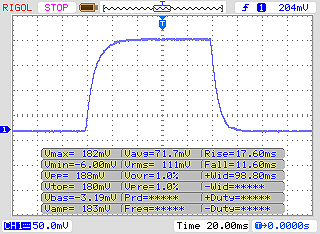 |
| ↘ 11 ms fall | ||
| The screen shows relatively slow response rates in our tests and may be too slow for gamers. In comparison, all tested devices range from 0.1 (minimum) to 240 (maximum) ms. » 71 % of all devices are better. This means that the measured response time is worse than the average of all tested devices (19.8 ms). | ||
| ↔ Response Time 50% Grey to 80% Grey | ||
| 38 ms ... rise ↗ and fall ↘ combined | ↗ 19 ms rise | 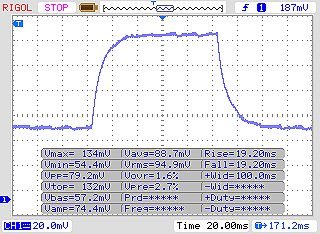 |
| ↘ 19 ms fall | ||
| The screen shows slow response rates in our tests and will be unsatisfactory for gamers. In comparison, all tested devices range from 0.165 (minimum) to 636 (maximum) ms. » 55 % of all devices are better. This means that the measured response time is worse than the average of all tested devices (30.9 ms). | ||
Screen Flickering / PWM (Pulse-Width Modulation)
| Screen flickering / PWM detected | 250 Hz | 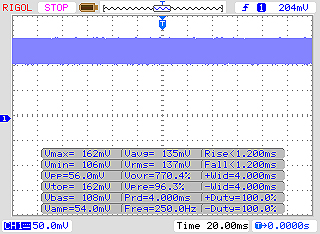 | |
The display backlight flickers at 250 Hz (worst case, e.g., utilizing PWM) . The frequency of 250 Hz is relatively low, so sensitive users will likely notice flickering and experience eyestrain at the stated brightness setting and below. In comparison: 52 % of all tested devices do not use PWM to dim the display. If PWM was detected, an average of 7741 (minimum: 5 - maximum: 343500) Hz was measured. | |||
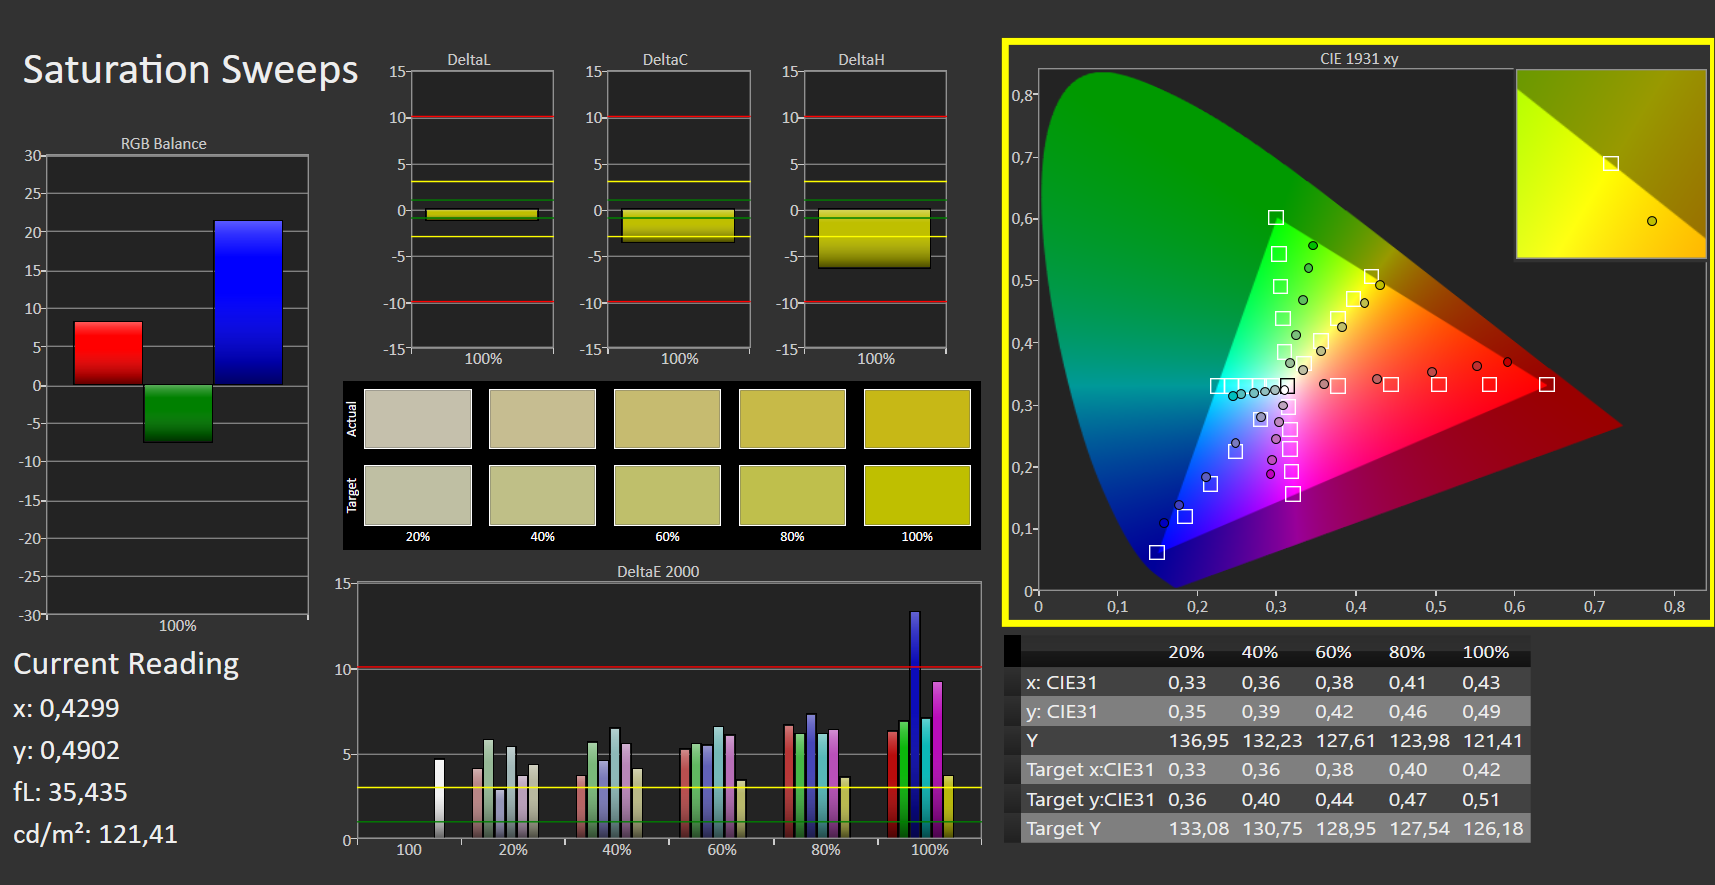
Colors were fairly accurate out of the box even though the recorded DeltaE 2000 deviation of 5 was higher than the ideal of 3. Neither AdobeRGB (39 %) nor sRGB (61 %) are completely covered.


Thanks to its wide viewing angles the IPS panel remained well readable from all sides. Outdoors, it was only usable on overcast days due to its low brightness.
Performance – Fast Enough for Office and Internet
Dell’s Latitude 3510 is a 15.6-inch entry-level business notebook. It offers enough performance for office and internet applications. Our review unit sold for less than $650 at the time of writing. Other SKUs are available as well.
Test Conditions
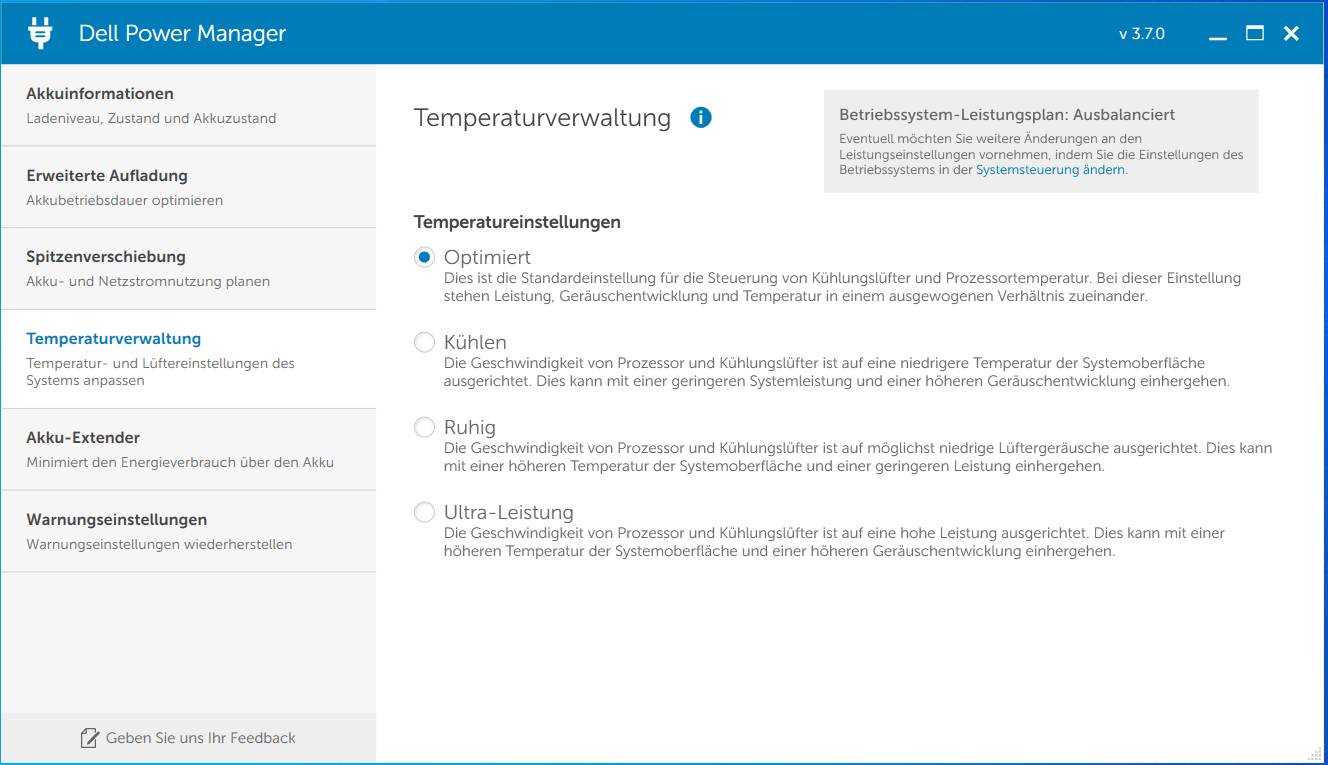
Dell’s Power Manager features various profiles affecting temperature and performance. We ran our tests in the “Optimized” profile. We found no performance gains when selecting “Ultra Performance”.
Processor
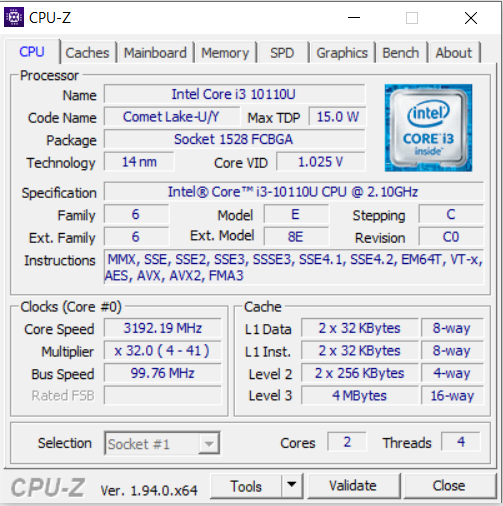
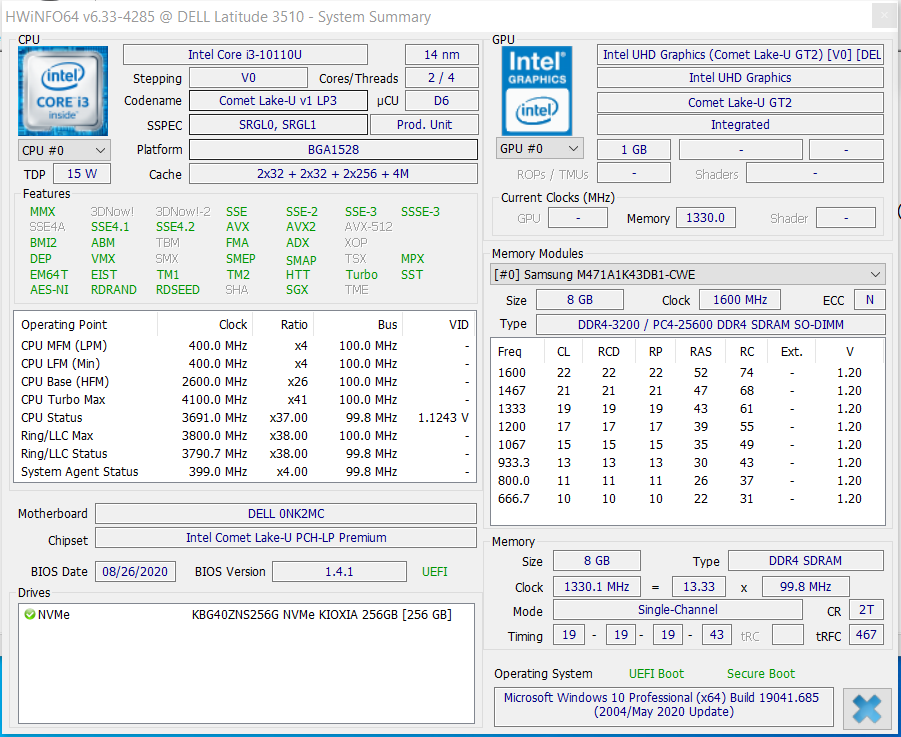
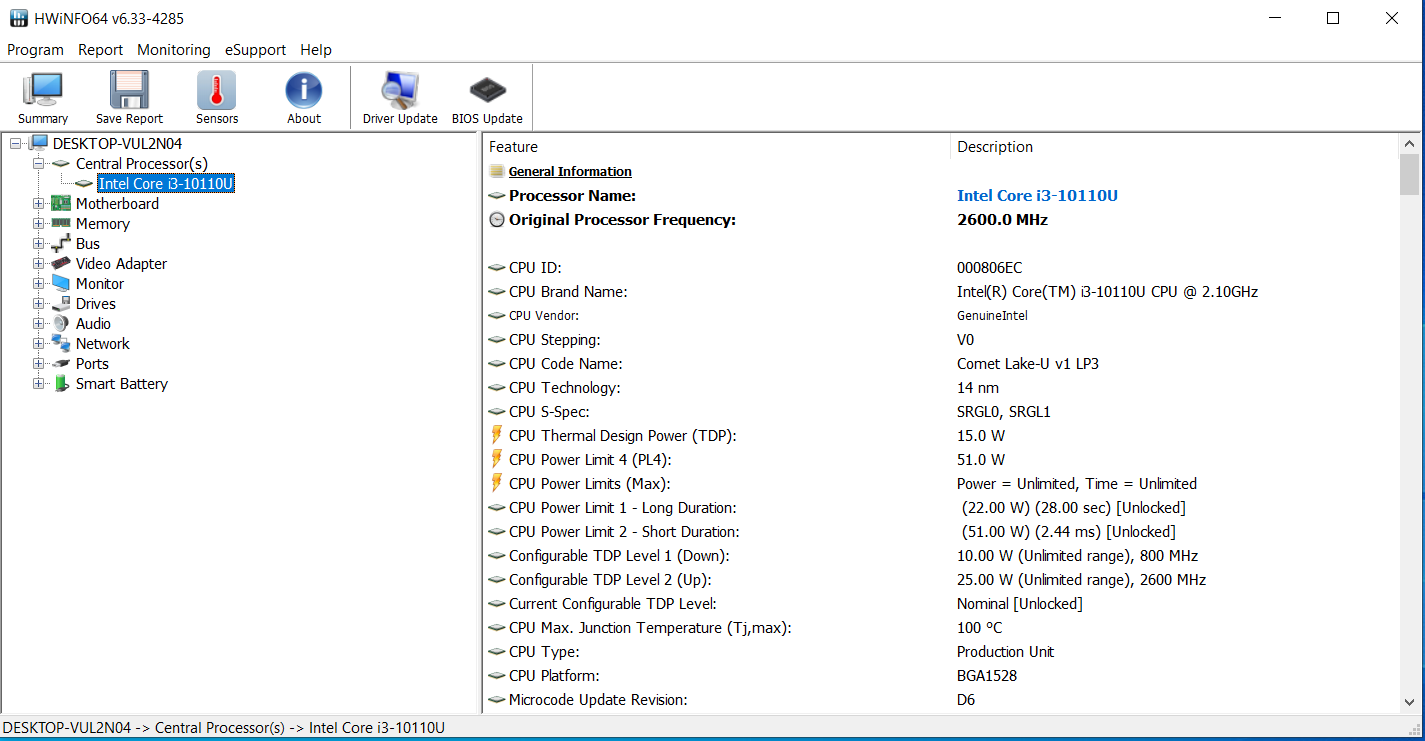
The Latitude features a Core i3-10110U (Comet Lake) dual-core processor running at a base clock speed of 2.1 GHz with a turbo boost of up to 4.1 GHz. Hyperthreading (two cores per thread) is supported.
Our CineBench CPU tests were performed at 2.8 to 3.7 GHz (single and multi-thread). On battery, clock speeds were between 1.9 to 2.3 GHz (multi-thread) and 1.5 to 2.3 GHz (single-thread).
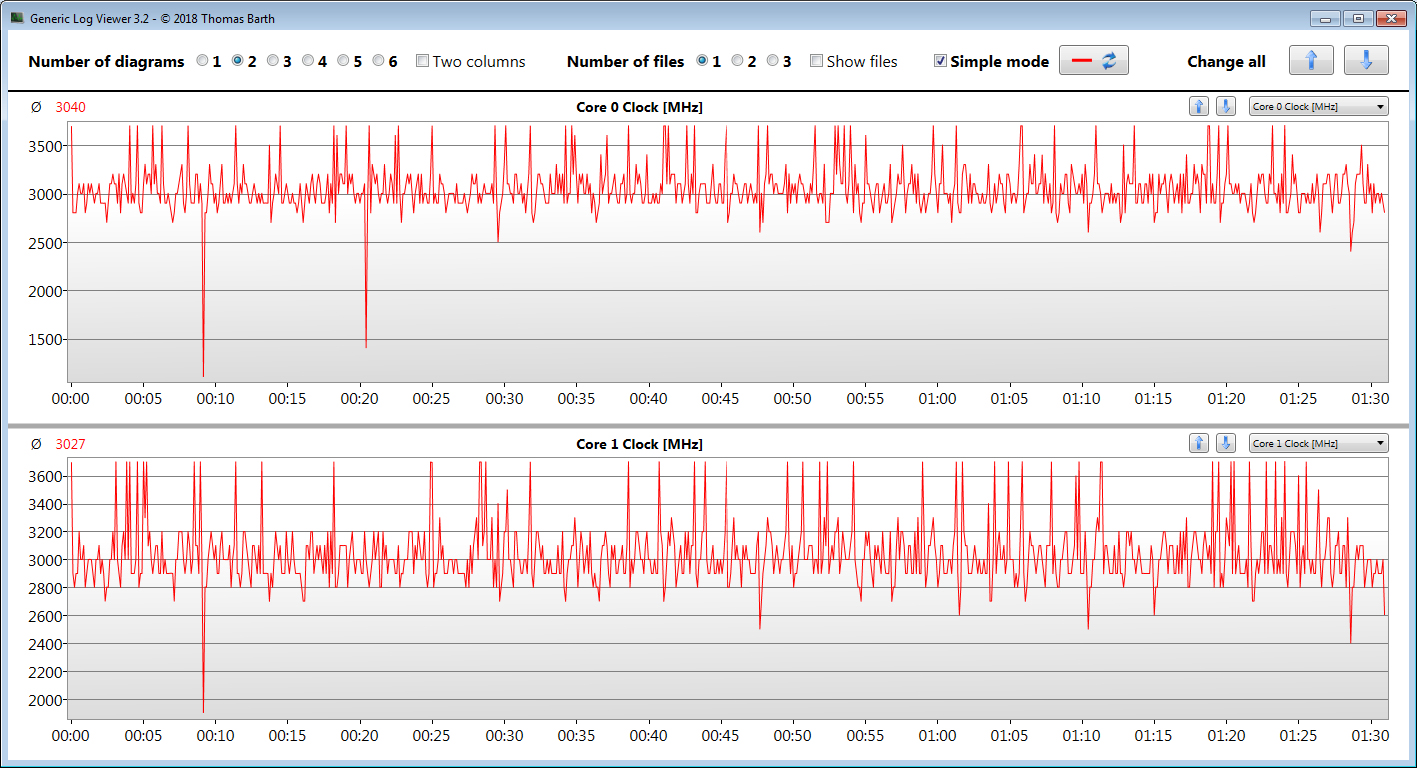
We run the CineBench R15 multi-thread test for at least 30 minutes in a loop in order to determine whether or not a processor is capable of utilizing high turbo-boost clock speeds under sustained load. In this case, turbo boost was applied throughout the test and fluctuated, however the scores obtained were consistent.
* ... smaller is better
System Performance
The system felt smooth and snappy. Our review unit was certainly not made to satisfy high performance requirements. The computer was more than fast enough for office and internet applications. Adding a secondary RAM module would improve overall performance slightly thanks to the benefits of a dual-channel RAM interface.
| PCMark 8 Home Score Accelerated v2 | 2898 points | |
| PCMark 8 Creative Score Accelerated v2 | 2958 points | |
| PCMark 8 Work Score Accelerated v2 | 4314 points | |
| PCMark 10 Score | 3360 points | |
Help | ||
DPC Latencies
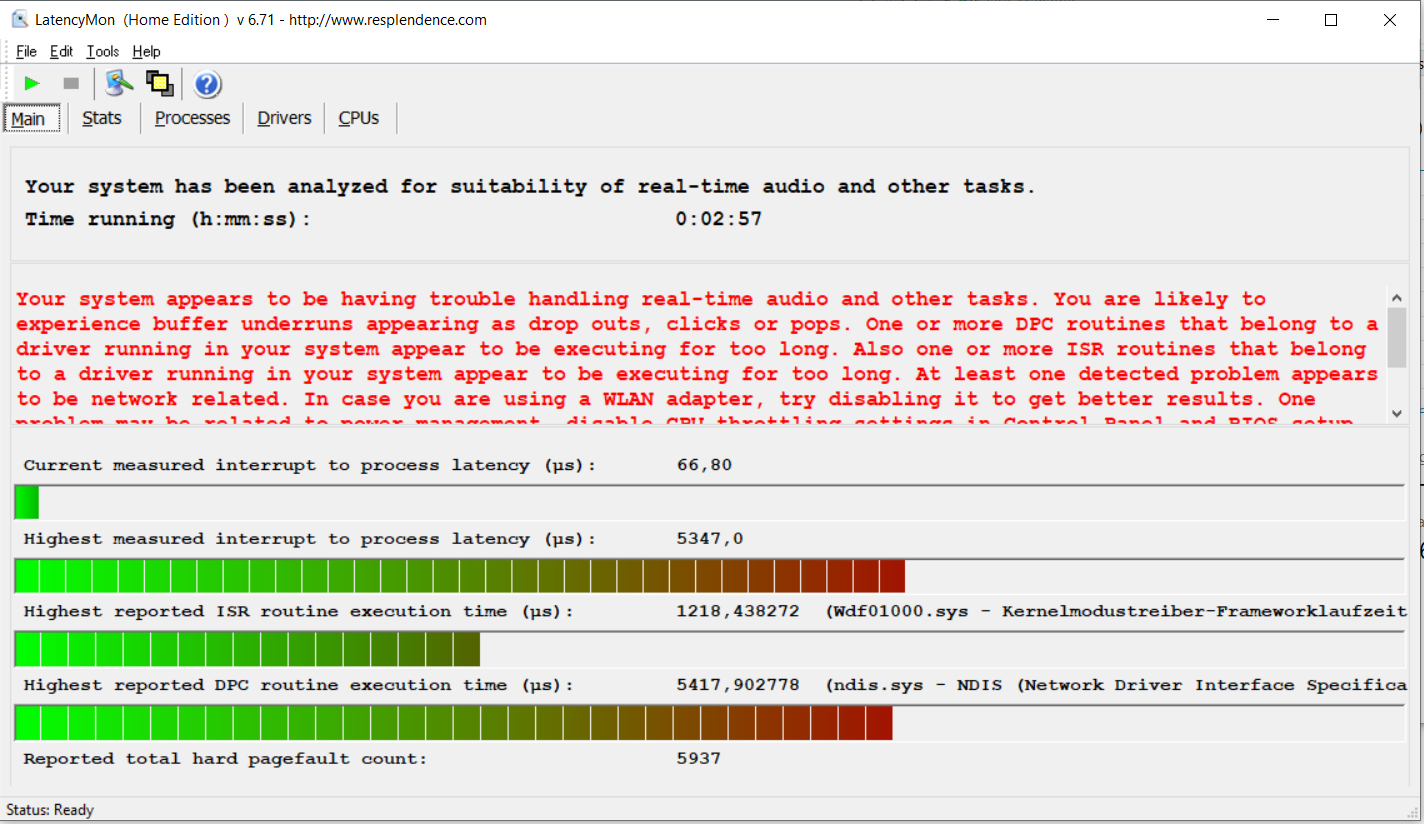
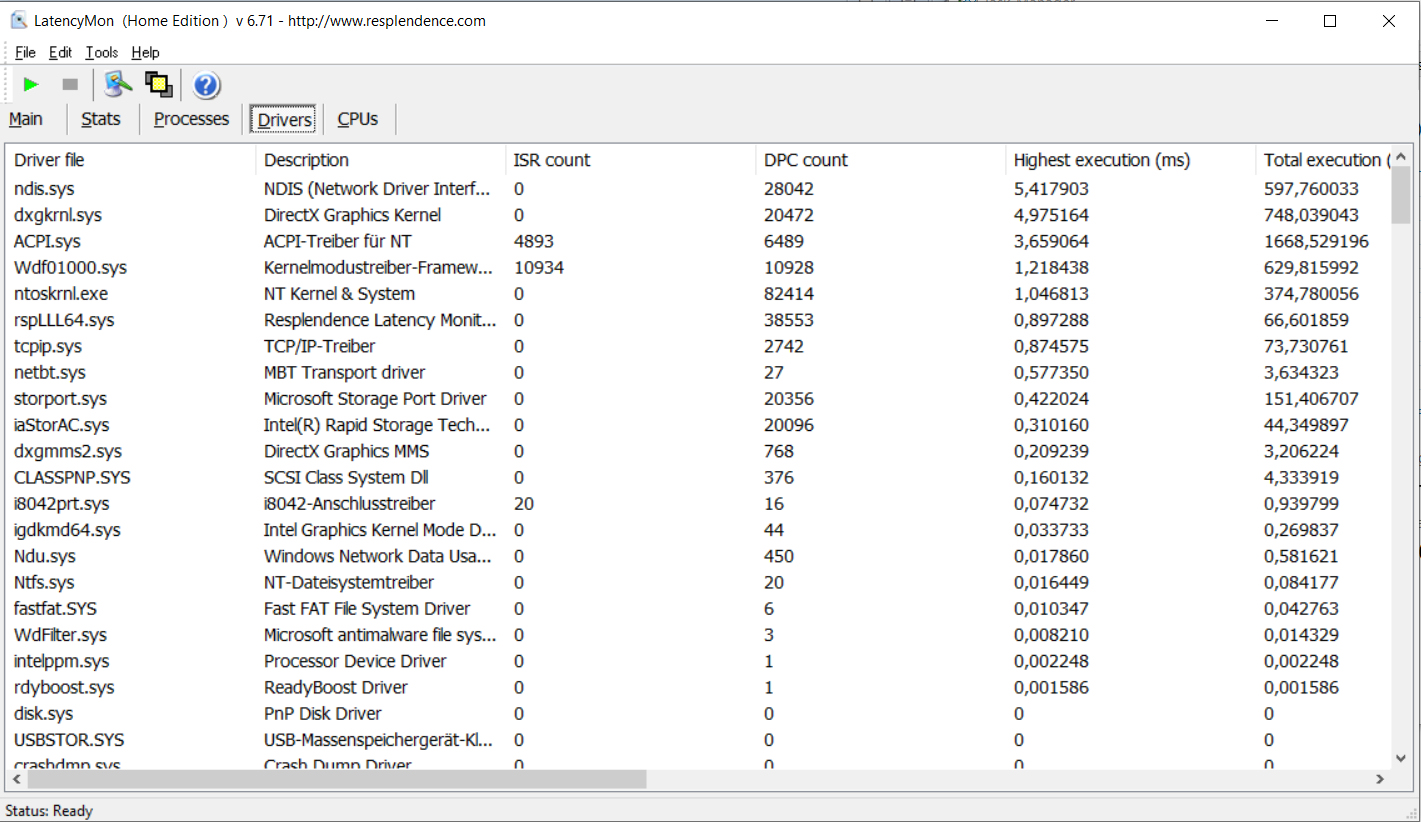
| DPC Latencies / LatencyMon - interrupt to process latency (max), Web, Youtube, Prime95 | |
| Dell Latitude 15 3510 NK2MC | |
| HP ProBook 450 G7 8WC04UT | |
| HP ProBook 455 G7-175W8EA | |
* ... smaller is better
Storage Devices
Dell’s SSD of choice is a 256 GB M.2-2230 Kioxia NVMe SSD. While its performance was adequate and decent it was certainly not one of the top contenders in this category.

| Dell Latitude 15 3510 NK2MC Toshiba KBG40ZNS256G NVMe | Lenovo ThinkPad E15 Gen2-20T9S00K00 Samsung PM991 MZALQ512HALU | HP ProBook 450 G7 8WC04UT Crucial P1 SSD CT1000P1SSD8 | HP ProBook 455 G7-175W8EA Samsung PM991 MZVLQ512HALU | Acer Extensa 15 EX215-51-56UX WDC PC SN520 SDAPNUW-512G | Average Toshiba KBG40ZNS256G NVMe | Average of class Office | |
|---|---|---|---|---|---|---|---|
| CrystalDiskMark 5.2 / 6 | 18% | -15% | 2% | 21% | -1% | 114% | |
| Write 4K (MB/s) | 150 | 104.9 -30% | 111.1 -26% | 141.9 -5% | 176.1 17% | 112.1 ? -25% | 153.2 ? 2% |
| Read 4K (MB/s) | 61.8 | 46.54 -25% | 56.3 -9% | 37.25 -40% | 50.4 -18% | 50.6 ? -18% | 73.4 ? 19% |
| Write Seq (MB/s) | 458 | 1333 191% | 559 22% | 998 118% | 1457 218% | 961 ? 110% | 2531 ? 453% |
| Read Seq (MB/s) | 1881 | 1565 -17% | 1348 -28% | 1233 -34% | 1424 -24% | 1562 ? -17% | 3292 ? 75% |
| Write 4K Q32T1 (MB/s) | 338.4 | 437.2 29% | 277.1 -18% | 338.4 0% | 381 13% | 299 ? -12% | 431 ? 27% |
| Read 4K Q32T1 (MB/s) | 447.3 | 498.9 12% | 312.1 -30% | 431.1 -4% | 436.5 -2% | 359 ? -20% | 516 ? 15% |
| Write Seq Q32T1 (MB/s) | 1563 | 1315 -16% | 1652 6% | 1367 -13% | 1455 -7% | 1366 ? -13% | 4178 ? 167% |
| Read Seq Q32T1 (MB/s) | 2422 | 2340 -3% | 1588 -34% | 2355 -3% | 1725 -29% | 2170 ? -10% | 6043 ? 150% |
| Write 4K Q8T8 (MB/s) | 877 | 380 ? | 952 ? | ||||
| Read 4K Q8T8 (MB/s) | 518 | 852 ? | 1346 ? | ||||
| AS SSD | 76% | 61% | 49% | 55% | 33% | 194% | |
| Seq Read (MB/s) | 1971 | 1934 -2% | 1155 -41% | 1929 -2% | 1542 -22% | 1752 ? -11% | 4333 ? 120% |
| Seq Write (MB/s) | 1130 | 1198 6% | 984 -13% | 1199 6% | 1249 11% | 720 ? -36% | 2766 ? 145% |
| 4K Read (MB/s) | 51.3 | 47.08 -8% | 48.85 -5% | 43.9 -14% | 38.79 -24% | 47.3 ? -8% | 58.3 ? 14% |
| 4K Write (MB/s) | 119.7 | 132.8 11% | 96.6 -19% | 116.2 -3% | 89.3 -25% | 118.6 ? -1% | 162.8 ? 36% |
| 4K-64 Read (MB/s) | 585 | 866 48% | 581 -1% | 897 53% | 966 65% | 866 ? 48% | 958 ? 64% |
| 4K-64 Write (MB/s) | 495.5 | 872 76% | 658 33% | 801 62% | 885 79% | 402 ? -19% | 1648 ? 233% |
| Access Time Read * (ms) | 0.107 | 0.116 -8% | 0.066 38% | 0.069 36% | 0.1034 ? 3% | 0.08407 ? 21% | |
| Access Time Write * (ms) | 0.22 | 0.03 86% | 0.207 6% | 0.033 85% | 0.044 80% | 0.3076 ? -40% | 0.05895 ? 73% |
| Score Read (Points) | 833 | 1106 33% | 745 -11% | 1134 36% | 1159 39% | 1088 ? 31% | 1450 ? 74% |
| Score Write (Points) | 728 | 1125 55% | 853 17% | 1037 42% | 1099 51% | 592 ? -19% | 2087 ? 187% |
| Score Total (Points) | 1962 | 2771 41% | 1986 1% | 2723 39% | 2842 45% | 2197 ? 12% | 4213 ? 115% |
| Copy ISO MB/s (MB/s) | 273.5 | 1258 360% | 2635 863% | 1409 415% | 894 227% | 926 ? 239% | 2543 ? 830% |
| Copy Program MB/s (MB/s) | 184.6 | 411.2 123% | 95.1 -48% | 70.2 -62% | 304.9 65% | 372 ? 102% | 791 ? 328% |
| Copy Game MB/s (MB/s) | 281 | 945 236% | 361.9 29% | 254.9 -9% | 642 128% | 714 ? 154% | 1632 ? 481% |
| Total Average (Program / Settings) | 47% /
54% | 23% /
33% | 26% /
32% | 38% /
42% | 16% /
20% | 154% /
165% |
* ... smaller is better
Sustained Read: DiskSpd Read Loop, Queue Depth 8
GPU Performance
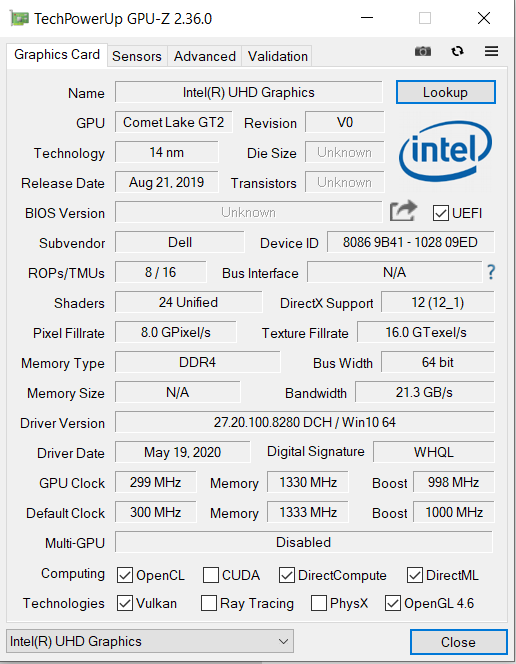
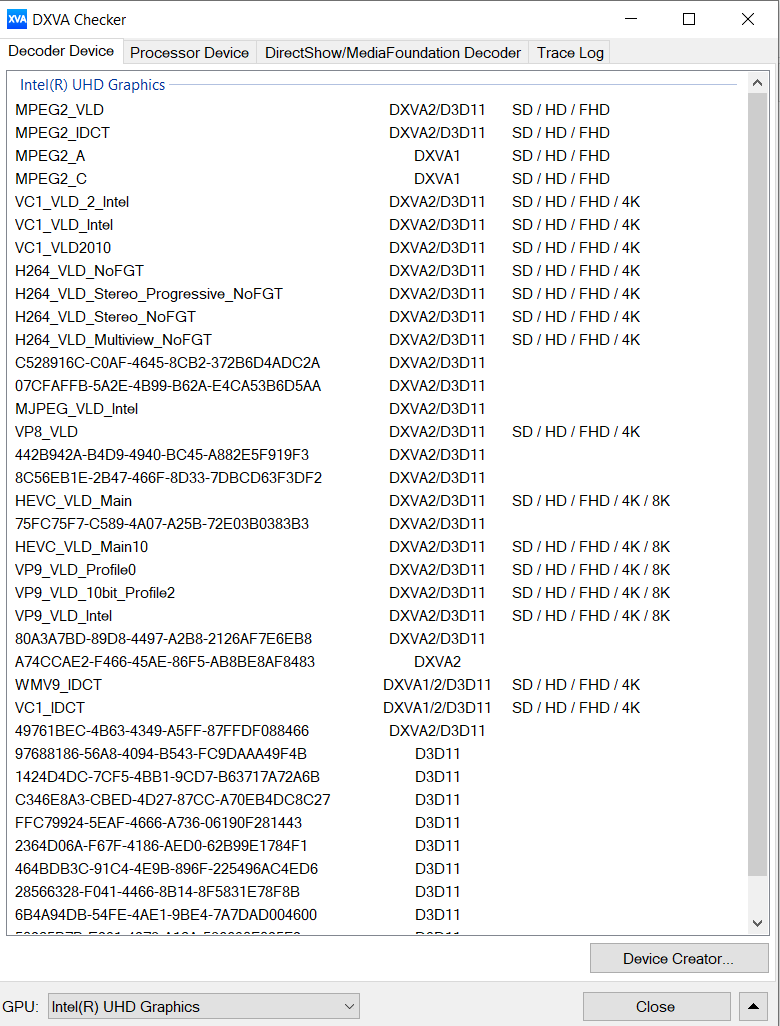
Intel’s UHD Graphics 620 supports DirectX 12 and runs at clock speeds between 300 and 1,000 MHz. Its 3DMark benchmark results were at a level expected of this GPU. Adding a secondary RAM module would improve overall performance slightly thanks to the benefits of a dual-channel RAM interface.
| 3DMark 11 Performance | 1690 points | |
| 3DMark Ice Storm Standard Score | 51185 points | |
| 3DMark Cloud Gate Standard Score | 5883 points | |
| 3DMark Fire Strike Score | 882 points | |
Help | ||
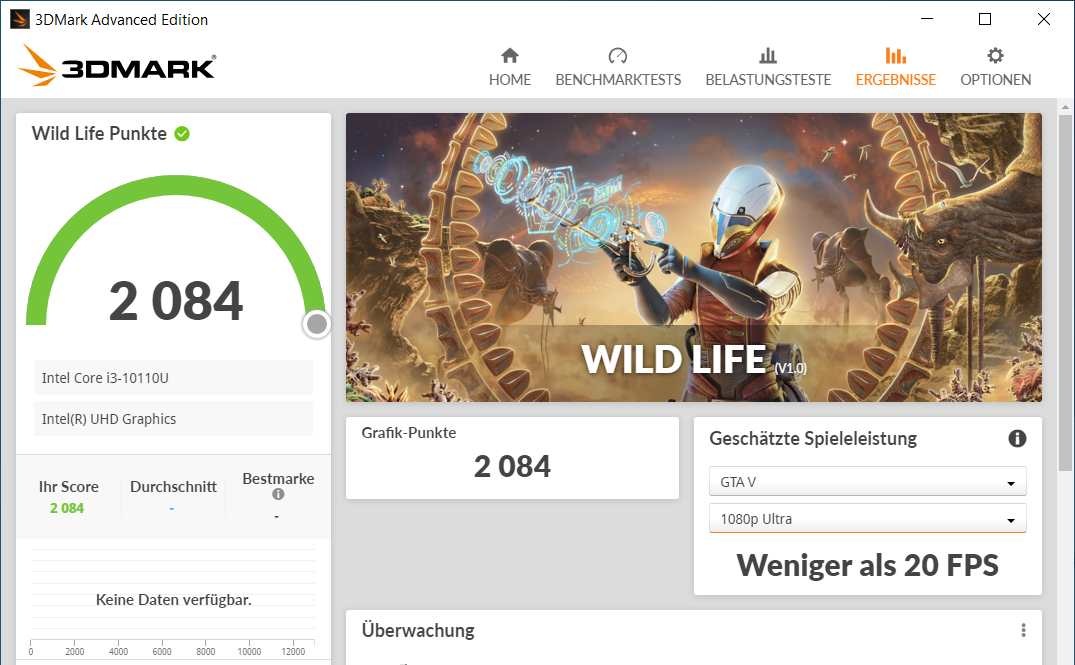
Gaming Performance
The Latitude is certainly no gaming notebook. It is capable of running games with low to moderate hardware requirements. Adding a secondary RAM module would increase frame rates slightly thanks to the benefits of a dual-channel RAM interface. Current titles, such as Cyberpunk 2077, are unplayable.
| low | med. | high | ultra | |
|---|---|---|---|---|
| BioShock Infinite (2013) | 42 | 28.5 | 23.5 | 7.5 |
| Dota 2 Reborn (2015) | 60 | 31 | 15.6 | 13.9 |
Emissions & Energy – Quiet and Cool Dell Computer
Noise Emissions
Overall noise levels were very low. The fan was off most of the time when idle, and the device thus silent. Under load, it only revved up slightly. The maximum sound pressure level recorded by us was just 35.1 dB(A).
Noise level
| Idle |
| 25 / 25 / 27.8 dB(A) |
| Load |
| 35.1 / 34.8 dB(A) |
 | ||
30 dB silent 40 dB(A) audible 50 dB(A) loud |
||
min: | ||
Temperature
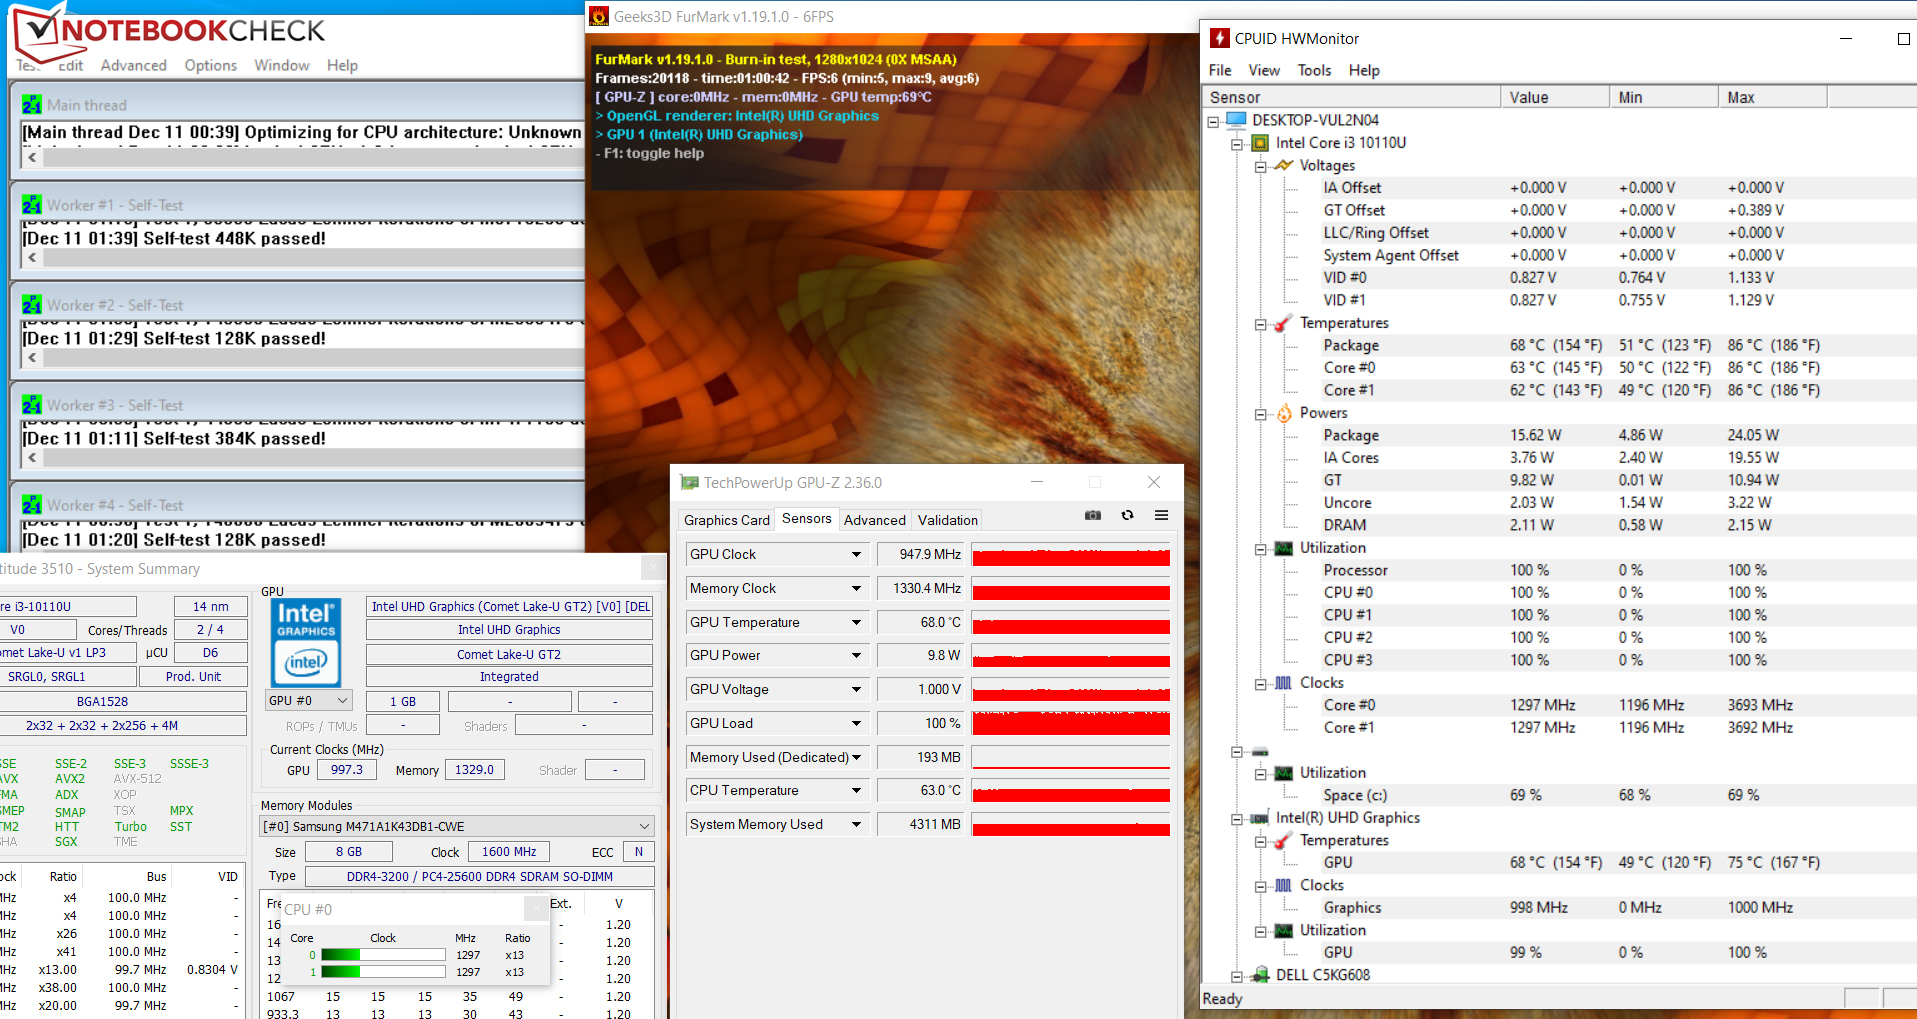
When running our stress test (Prime95 and FurMark simultaneously for at least one hour) the CPU maintained high clock speeds for the first few minutes before dropping to 1.1 to 1.2 GHz. GPU speeds decreased from an initial high of 1,000 MHz to 900 to 950 MHz. Clock speeds were identical on both mains and battery. Keep in mind that our stress test is an extreme load scenario that does not occur during everyday use. We use this test to determine potential throttling and stability issues.
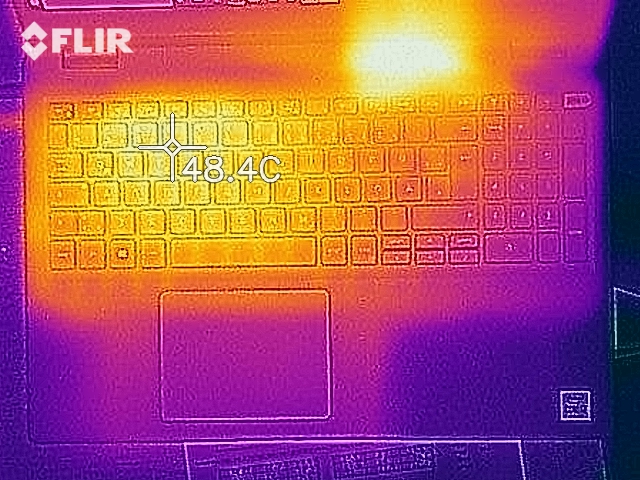
Overall, the 15.6-inch notebook remained comparatively cool. We found one single hot spot with more than 40 °C while running our stress test. Temperatures were much lower and inconspicuous under normal conditions.
(+) The maximum temperature on the upper side is 39 °C / 102 F, compared to the average of 34.3 °C / 94 F, ranging from 21.2 to 62.5 °C for the class Office.
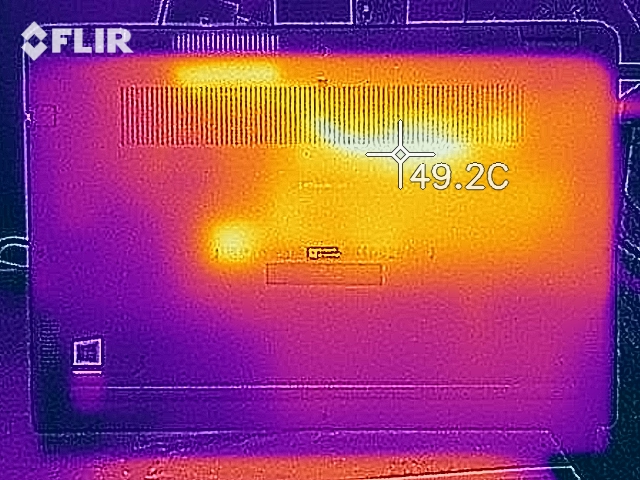
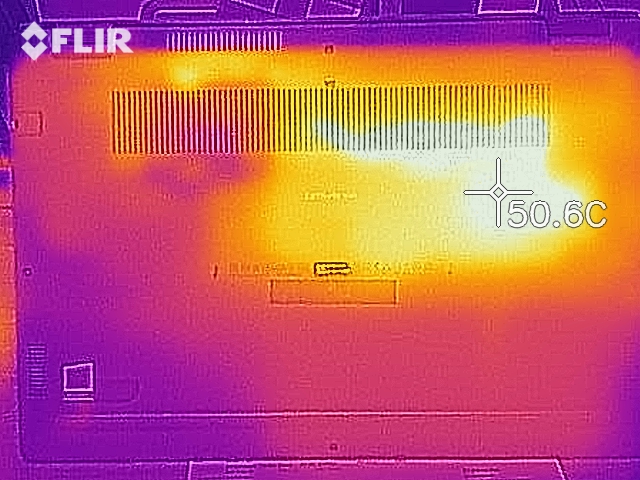
(±) The bottom heats up to a maximum of 40.6 °C / 105 F, compared to the average of 36.8 °C / 98 F
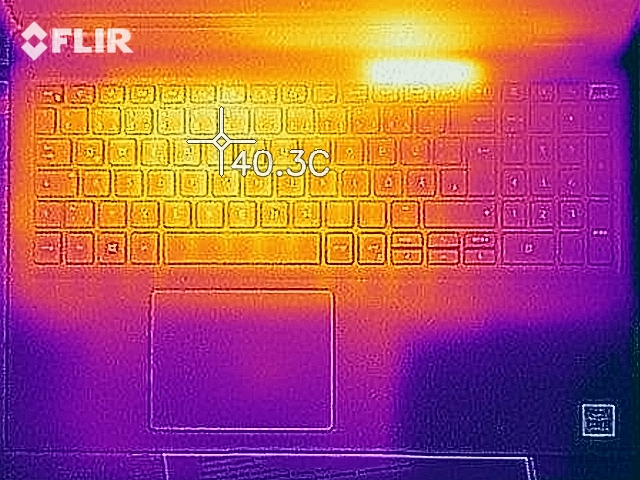
(+) In idle usage, the average temperature for the upper side is 24.1 °C / 75 F, compared to the device average of 29.5 °C / 85 F.
(+) The palmrests and touchpad are cooler than skin temperature with a maximum of 25 °C / 77 F and are therefore cool to the touch.
(+) The average temperature of the palmrest area of similar devices was 27.6 °C / 81.7 F (+2.6 °C / 4.7 F).
Speakers
The stereo speakers worked well and produced a decent soundscape that lacked bass.
Dell Latitude 15 3510 NK2MC audio analysis
(±) | speaker loudness is average but good (73.3 dB)
Bass 100 - 315 Hz
(-) | nearly no bass - on average 25.9% lower than median
(-) | bass is not linear (16.7% delta to prev. frequency)
Mids 400 - 2000 Hz
(±) | higher mids - on average 6.9% higher than median
(+) | mids are linear (6.4% delta to prev. frequency)
Highs 2 - 16 kHz
(+) | balanced highs - only 1.6% away from median
(+) | highs are linear (3.9% delta to prev. frequency)
Overall 100 - 16.000 Hz
(±) | linearity of overall sound is average (21.5% difference to median)
Compared to same class
» 54% of all tested devices in this class were better, 8% similar, 37% worse
» The best had a delta of 7%, average was 21%, worst was 53%
Compared to all devices tested
» 61% of all tested devices were better, 7% similar, 32% worse
» The best had a delta of 4%, average was 23%, worst was 134%
Power Consumption
Power consumption was at an expected level considering its internal hardware. When idle, it peaked at 9.7 W, and increased to 45 W while running our stress test (Prime95 and FurMark simultaneously for at least one hour). The power supply is rated at 65 W.
| Off / Standby | |
| Idle | |
| Load |
|
Key:
min: | |
Battery Life
Our Wi-Fi test simulates typical web browsing load via a script. With all power saving features disabled and display brightness normalized to 150 nits the Latitude 3510 ran for 7:45 hours.
Pros
Cons
Verdict

Dell’s Latitude 3510 is an inconspicuous business notebook powered by a Core i3 processor fast enough for office and internet applications. The device remained very quiet and cool overall.
Its poor price-performance ratio renders the Dell Latitude 3510 unattractive for consumers.
The CPU has access to 8 GB of RAM running in single-channel mode, thereby sacrificing some performance. This can be alleviated thanks to the fact that the notebook features two RAM slots. It supports up to 32 GB of RAM.
Battery life was decent and at a level on a par with its competitors. More expensive and powerful SKUs might run even longer thanks to their 53 Wh batteries. The Core i3-equipped Latitude has to make do with a 40 Wh battery.
The included Dell power supply plugs into the proprietary charging port. However, the device can also be charged via USB-C thanks to its support for Power Delivery, which we attempted successfully.
The FHD IPS display is its biggest weakness. Too dim, too low in contrast, poor color space coverage, and PWM flickering to boot. In return, it offers a matte surface as well as great viewing angles. A notebook in this price range has to offer more.
Dell Latitude 15 3510 NK2MC
- 12/18/2020 v7 (old)
Sascha Mölck
Price comparison

