Asus Zephyrus G14 GA401Q review: Alan Walker Special Edition 14-inch gaming laptop
The compact Zephyrus G14 was introduced last year, and it managed to impress us with the amount of power it packs into a small space. This year' new edition also offers even more power thanks to AMD and the new Zen 3 processors. The new Ryzen 9 5900HS was already impressive in the Asus Zephyrus G14 GA401QM in combination with the GeForce RTX 3060 laptop. The Special Edition with the Alan Walker design that has now been released is based on the same platform, although a small downgrade has been made in terms of the GPU with the implementation of the RTX 3050 Ti laptop model.
The Special Edition's design decorates the device, and with the matrix display on the display lid, it offers a very unique way to draw attention. In addition, there's a WQHD panel with a 120 Hz refresh rate; the resulting combination of the display and the unique design justifies the purchase price of about 1,850 Euros (~$2,145). At the moment, the Zephyrus G14 with the RTX 3060 costs around 1,800 Euros (~$2,088).
Possible contenders in comparison
Rating | Date | Model | Weight | Height | Size | Resolution | Price |
|---|---|---|---|---|---|---|---|
| 82.7 % v7 (old) | 10 / 2021 | Asus Zephyrus G14 GA401QEC R9 5900HS, GeForce RTX 3050 Ti Laptop GPU | 1.7 kg | 19.9 mm | 14.00" | 2560x1440 | |
| 83.5 % v7 (old) | 06 / 2021 | Asus Zephyrus G14 GA401QM R9 5900HS, GeForce RTX 3060 Laptop GPU | 1.7 kg | 19.9 mm | 14.00" | 1920x1080 | |
| 83.6 % v7 (old) | 03 / 2020 | Asus Zephyrus G14 GA401IV R9 4900HS, GeForce RTX 2060 Max-Q | 1.6 kg | 17.9 mm | 14.00" | 1920x1080 | |
| 87.5 % v7 (old) | 06 / 2021 | Razer Blade 14 Ryzen 9 RTX 3070 R9 5900HX, GeForce RTX 3070 Laptop GPU | 1.8 kg | 16.8 mm | 14.00" | 2560x1440 | |
| 83.2 % v7 (old) | 09 / 2021 | Schenker XMG Focus 15 i7-11800H, GeForce RTX 3050 Ti Laptop GPU | 1.9 kg | 22 mm | 15.60" | 1920x1080 | |
| 79.2 % v7 (old) | 09 / 2021 | MSI Katana GF66 11UG-220 i7-11800H, GeForce RTX 3070 Laptop GPU | 2.3 kg | 25 mm | 15.60" | 1920x1080 | |
| 82.2 % v7 (old) | 08 / 2021 | Acer Nitro 5 AN515-45-R1JH R7 5800H, GeForce RTX 3070 Laptop GPU | 2.3 kg | 23.9 mm | 15.60" | 2560x1440 |
Case
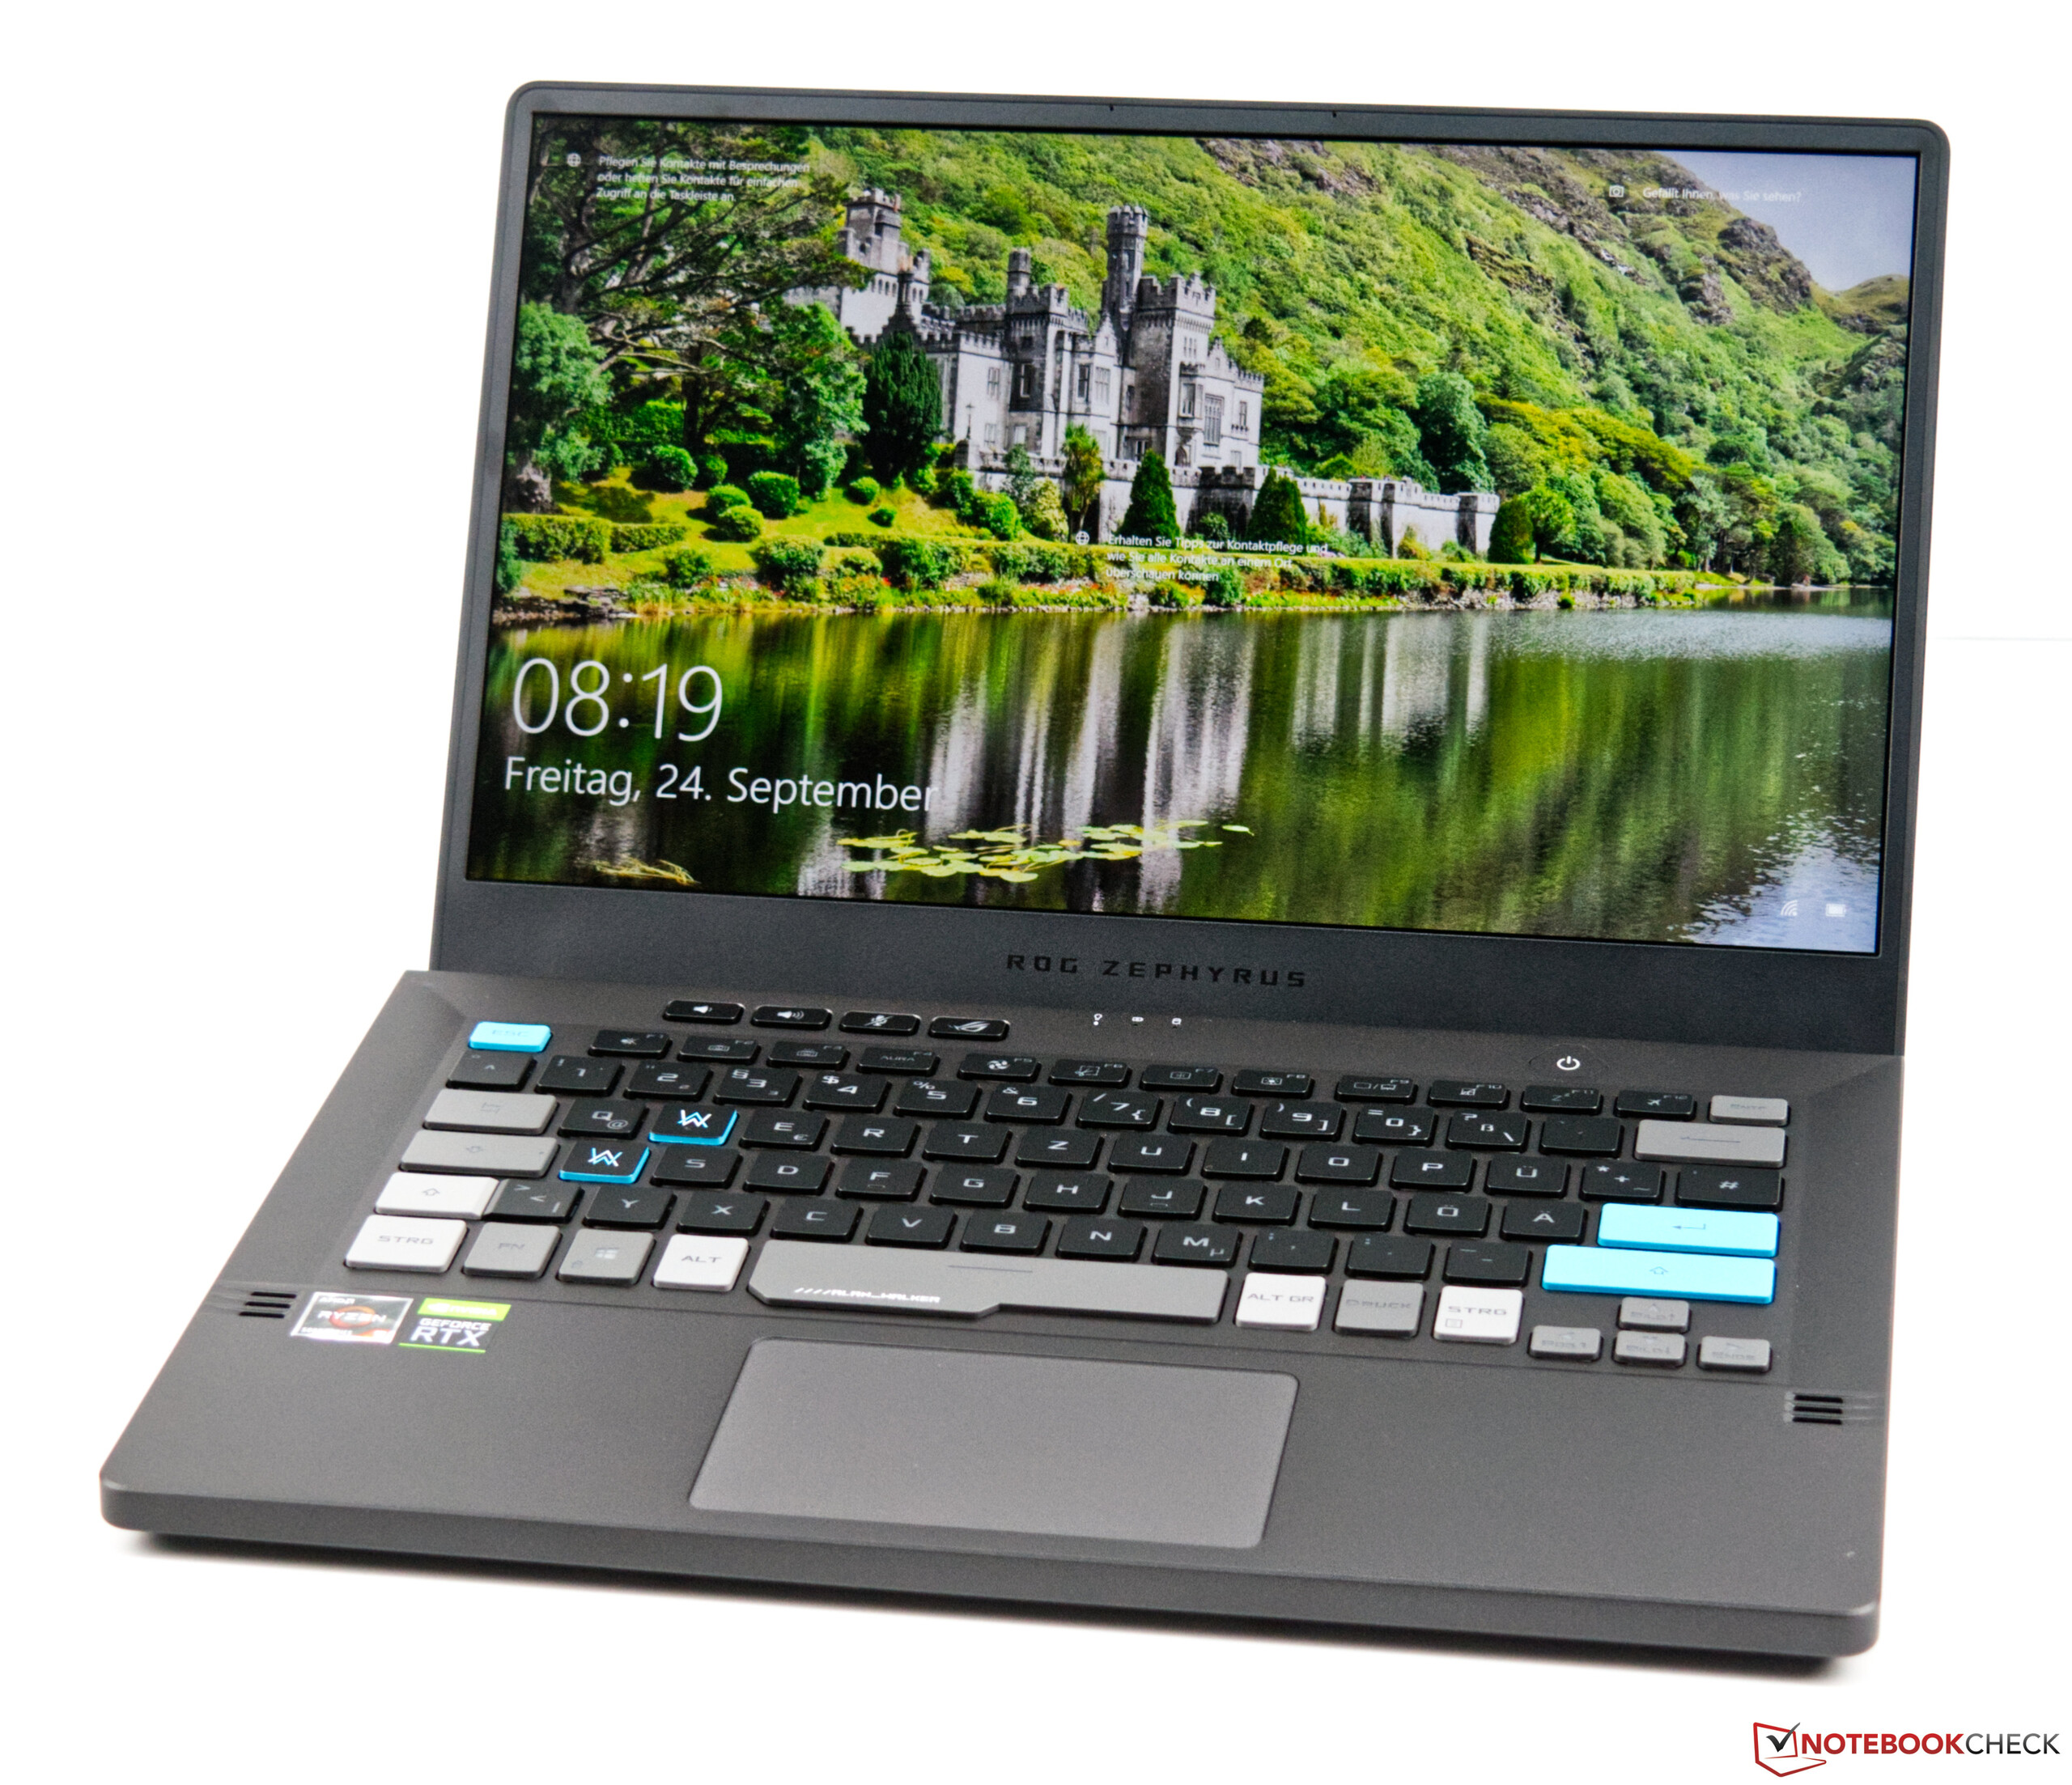
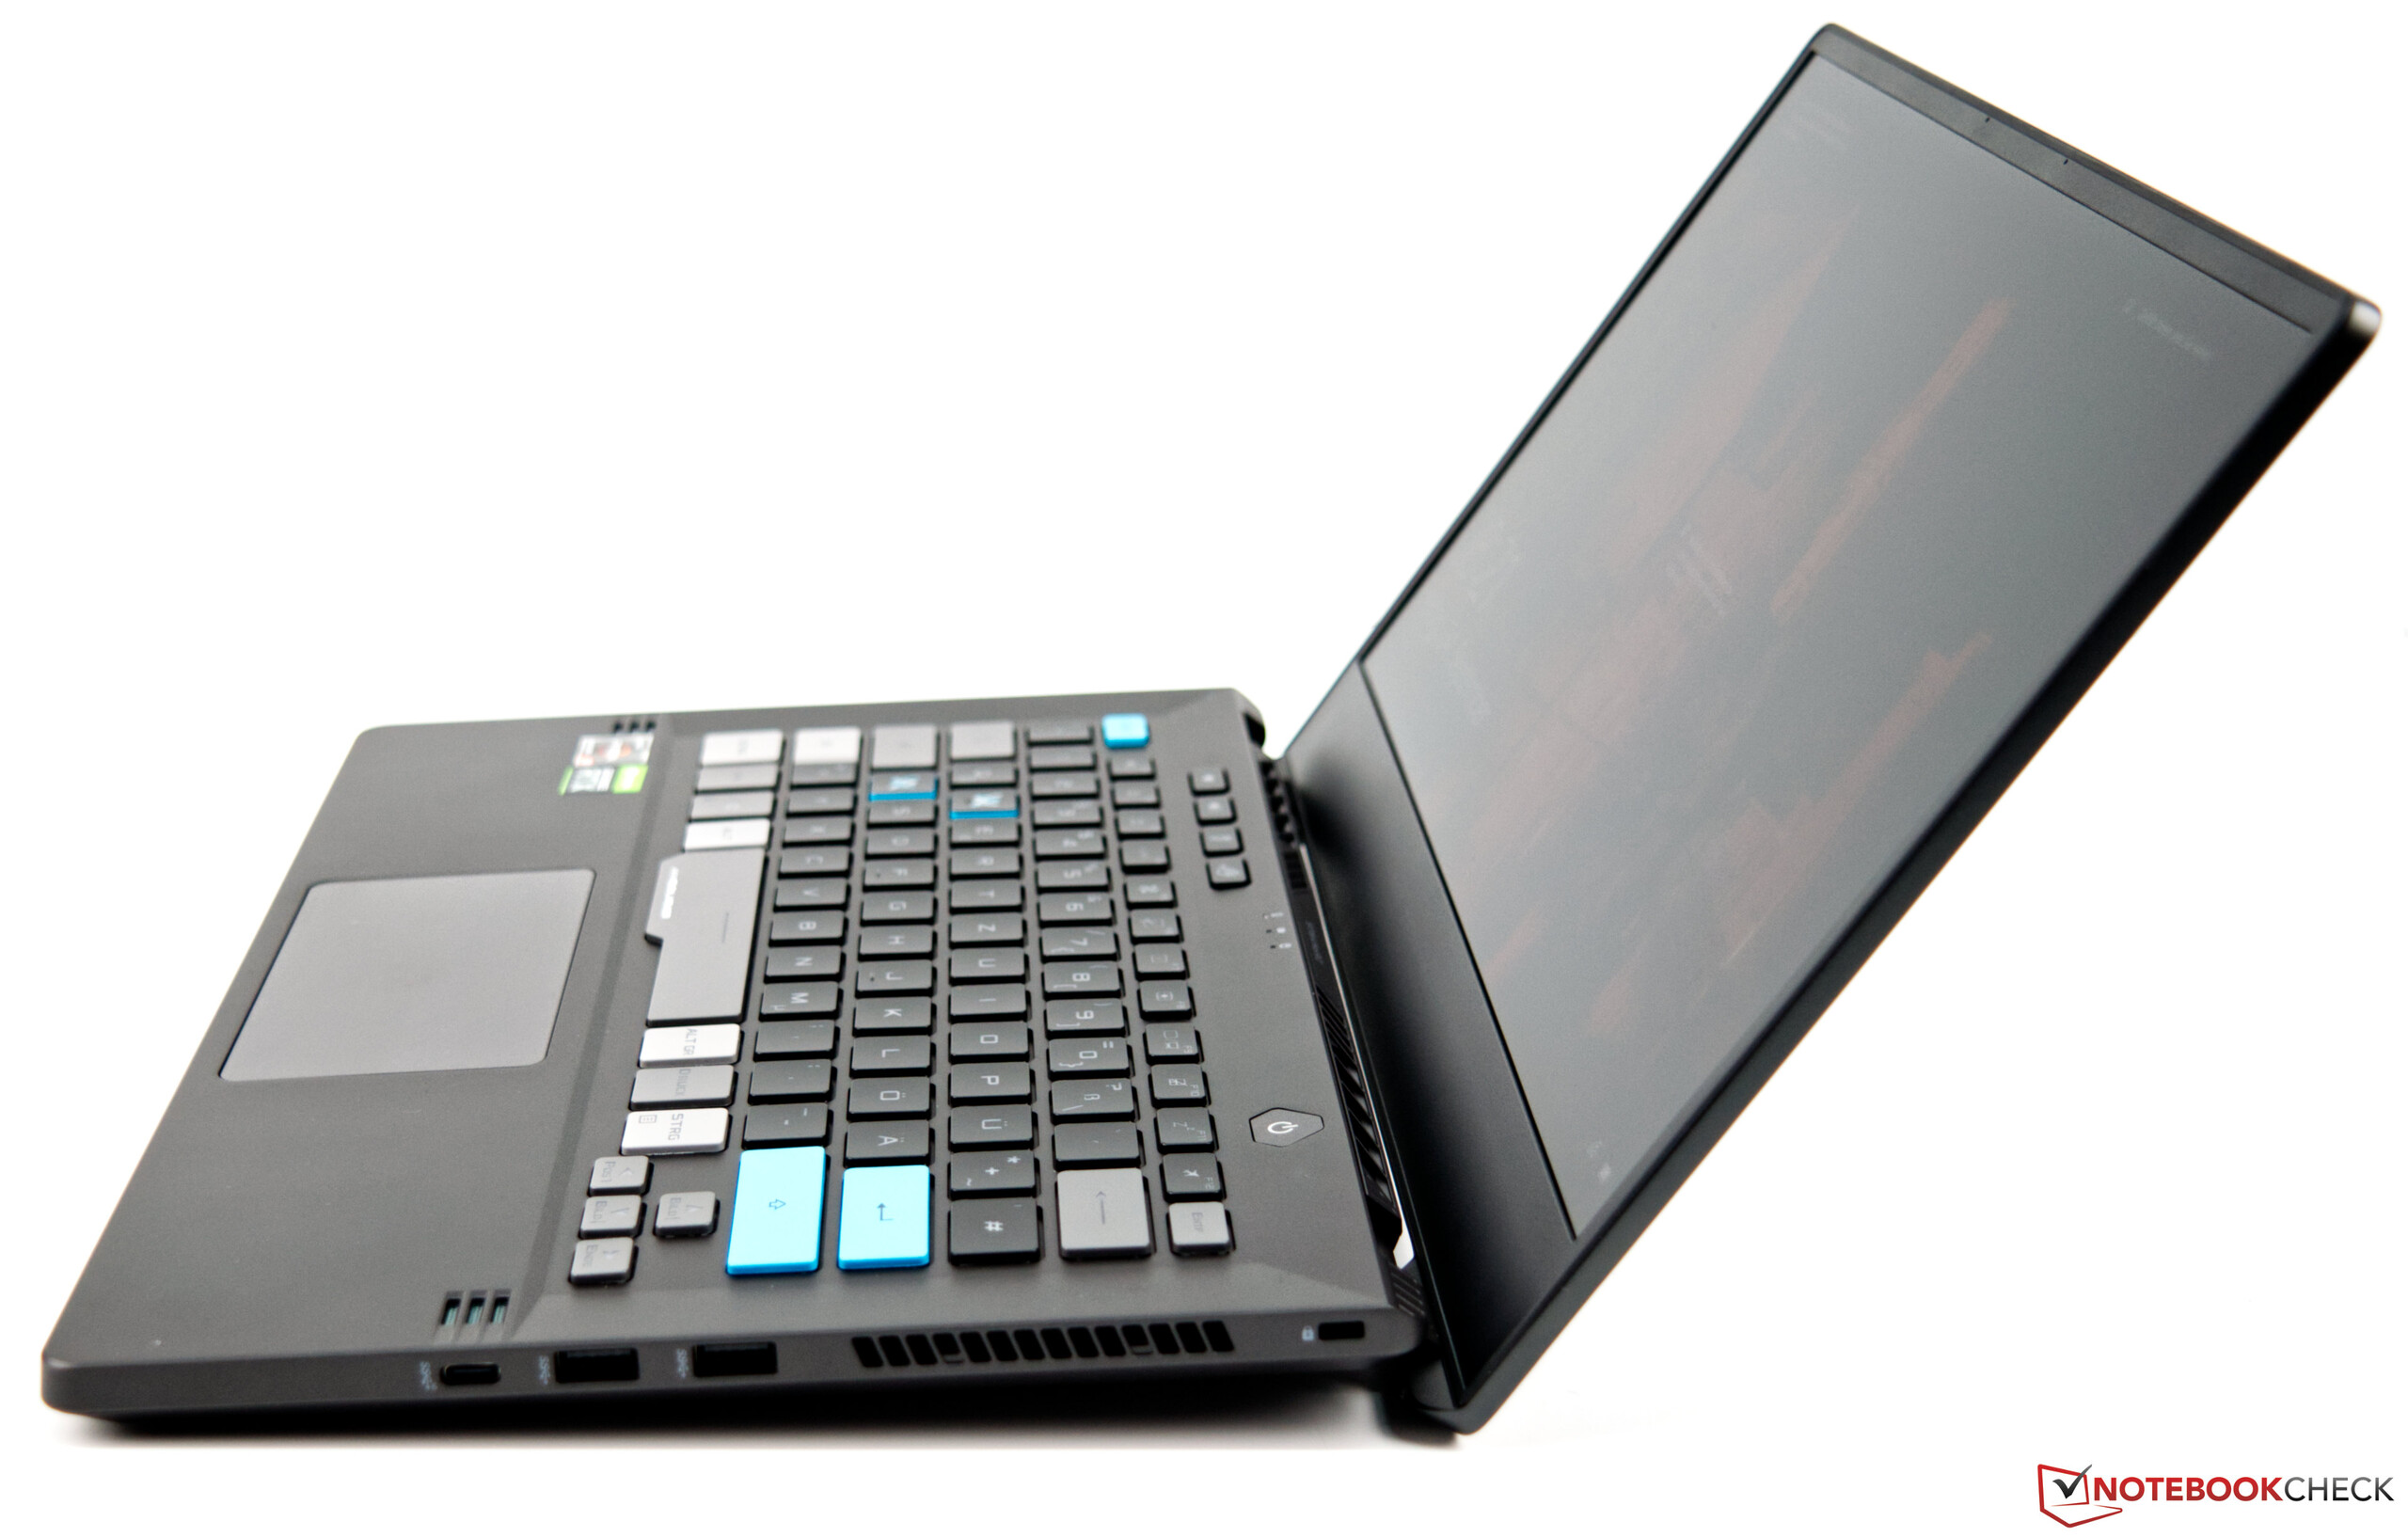
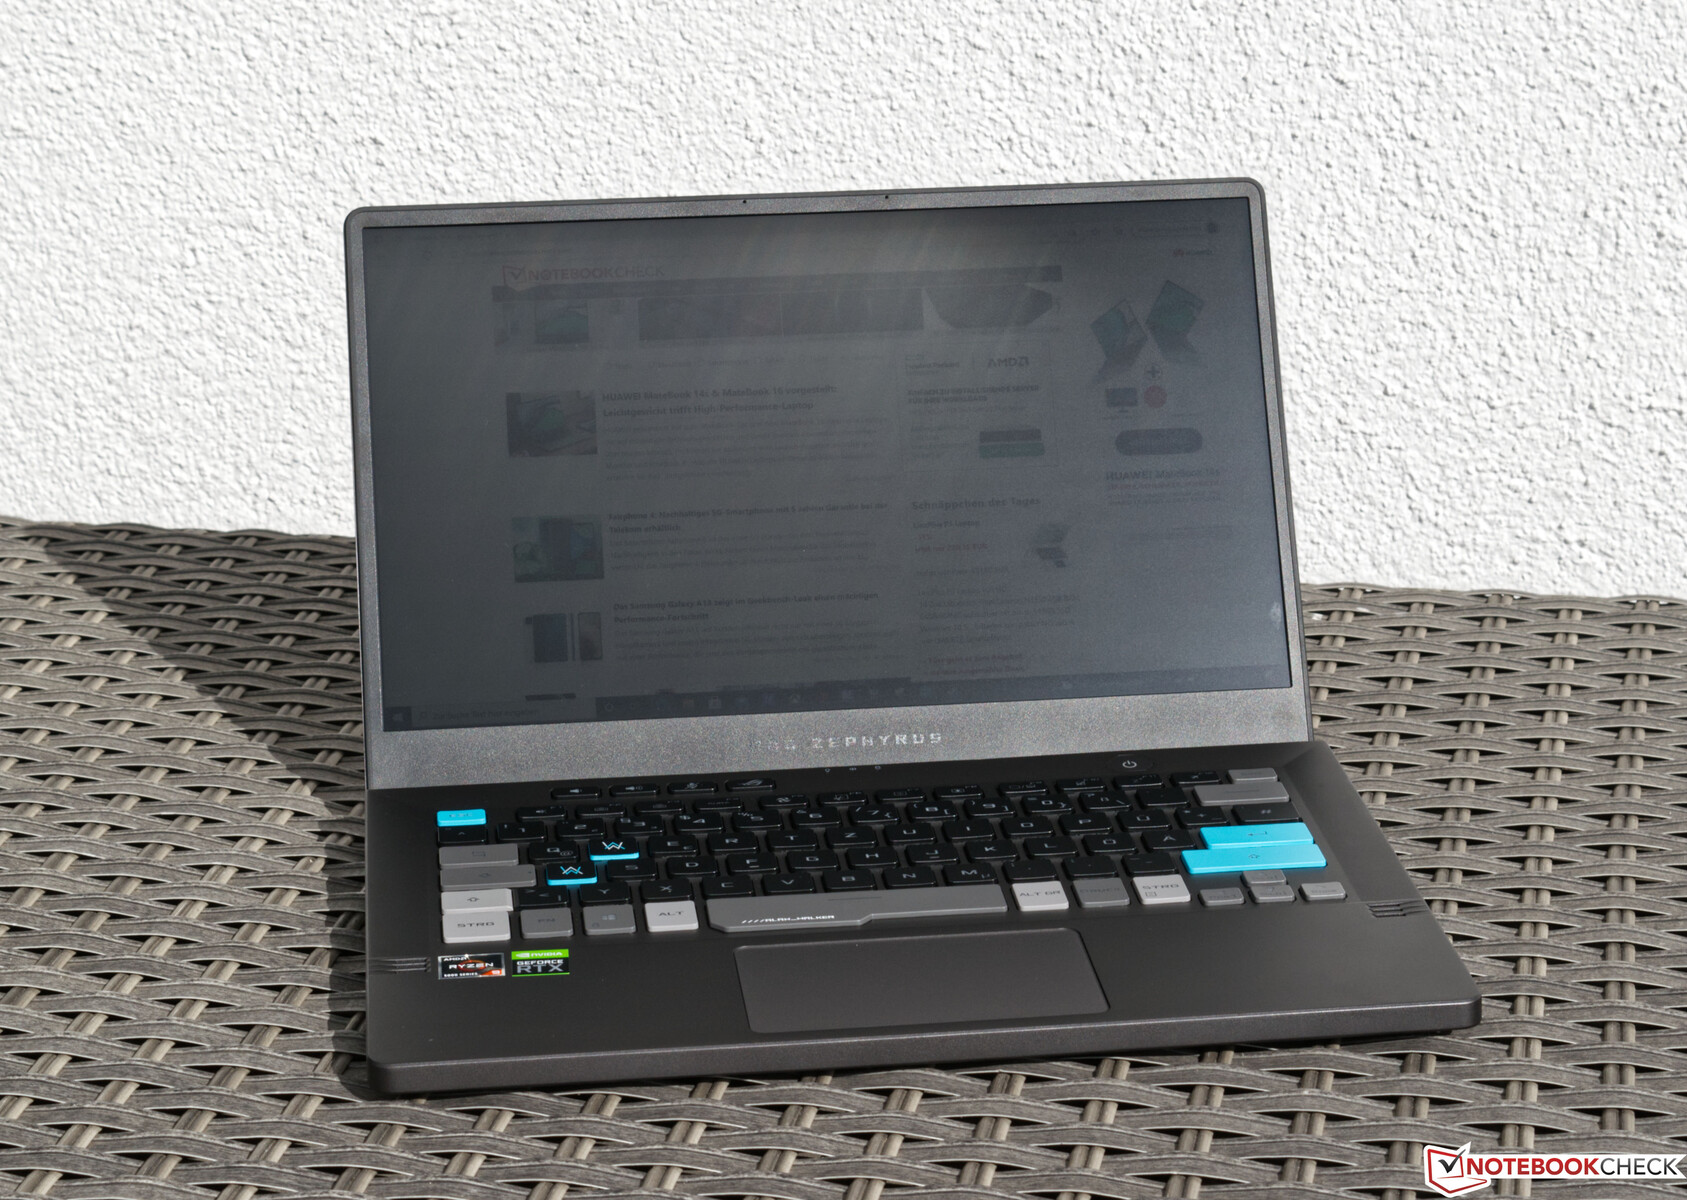
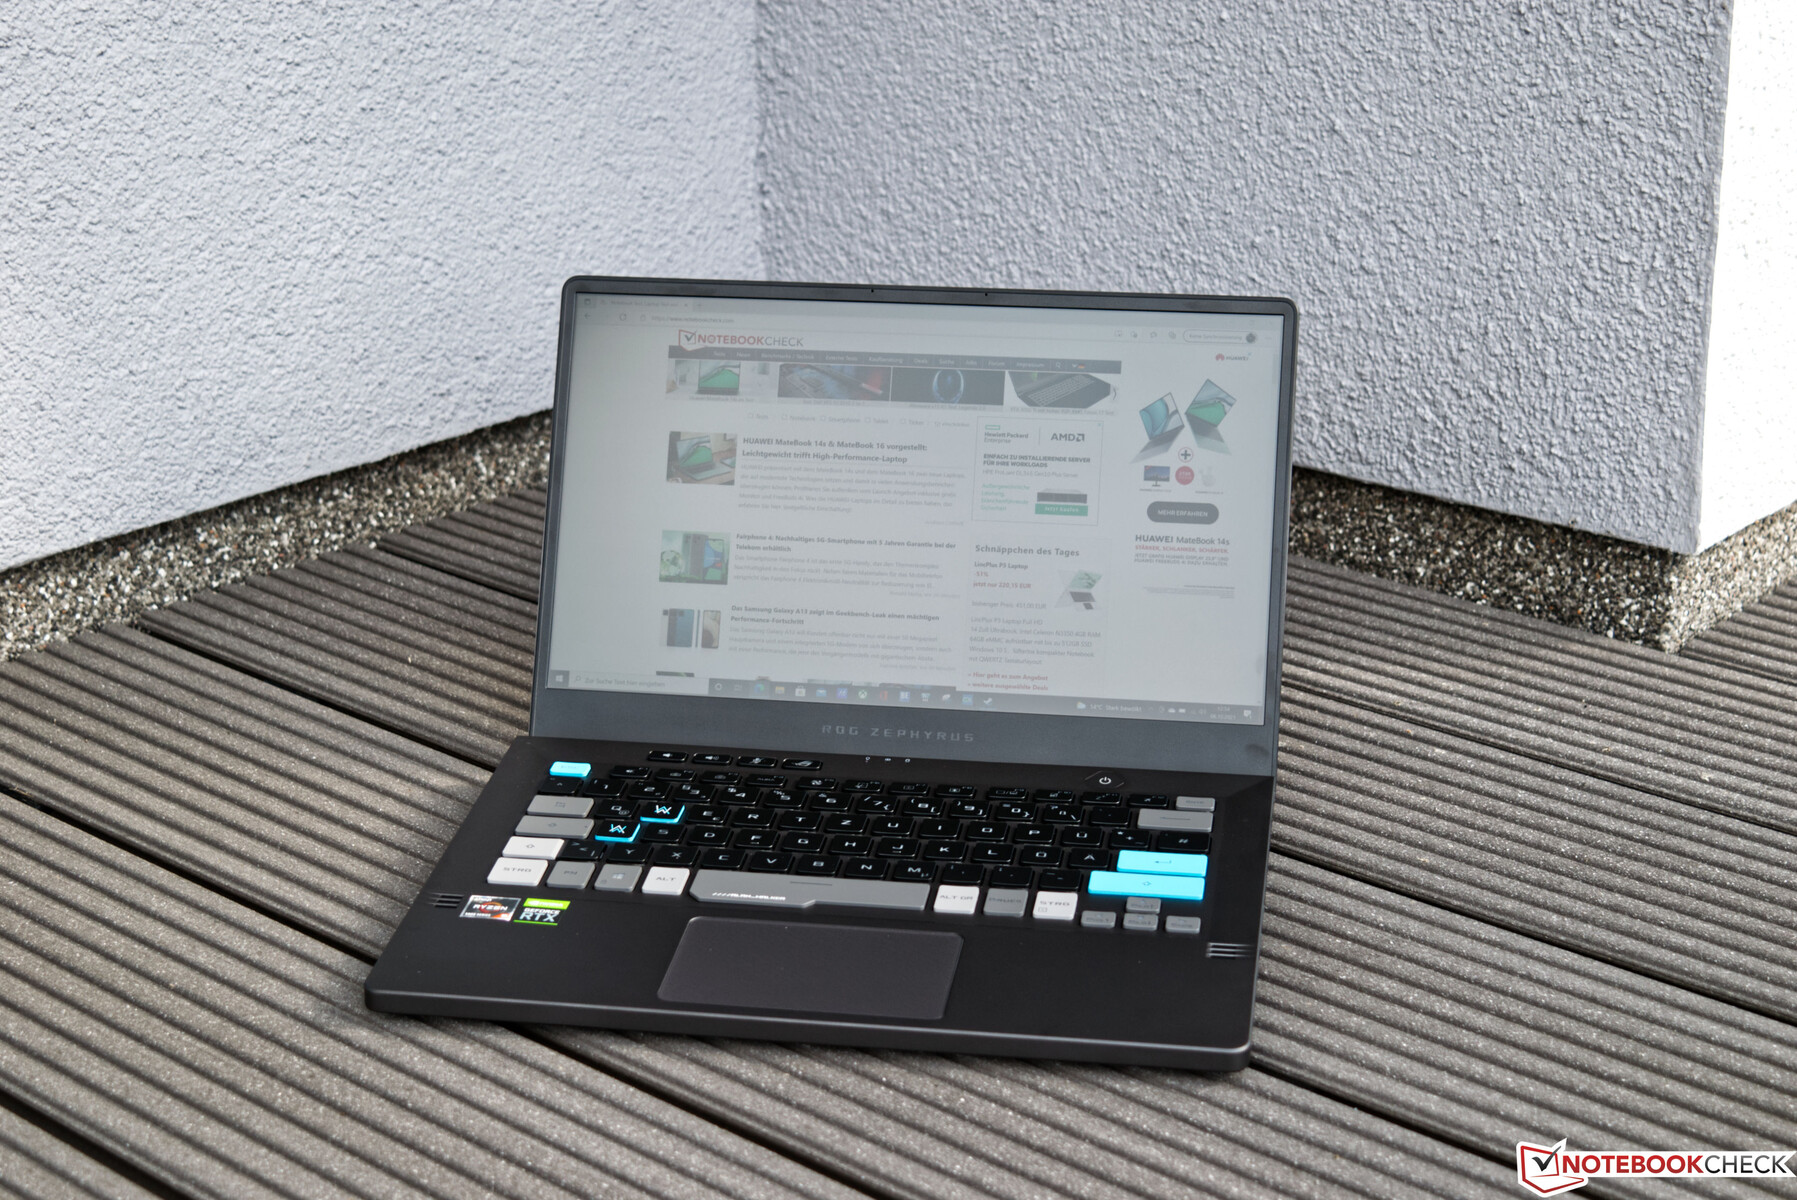
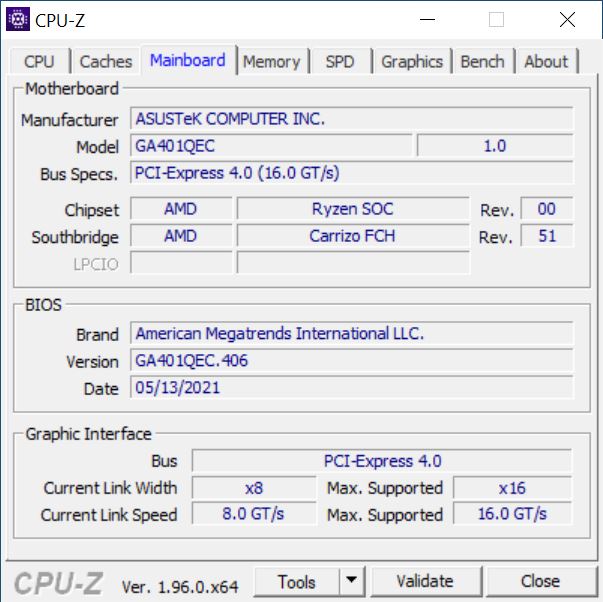
The case of the Zephyrus G14 in the Alan Walker Special Edition is based on the Asus Zephyrus G14 GA401QM, which we were able to review thoroughly. Please refer to that review for more details.
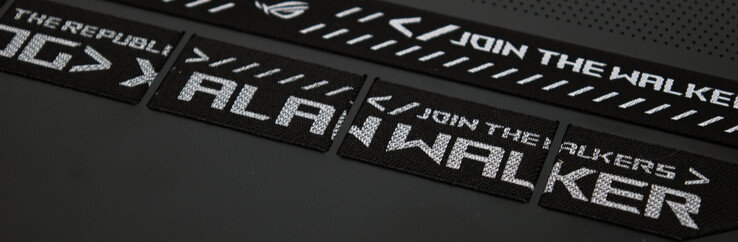
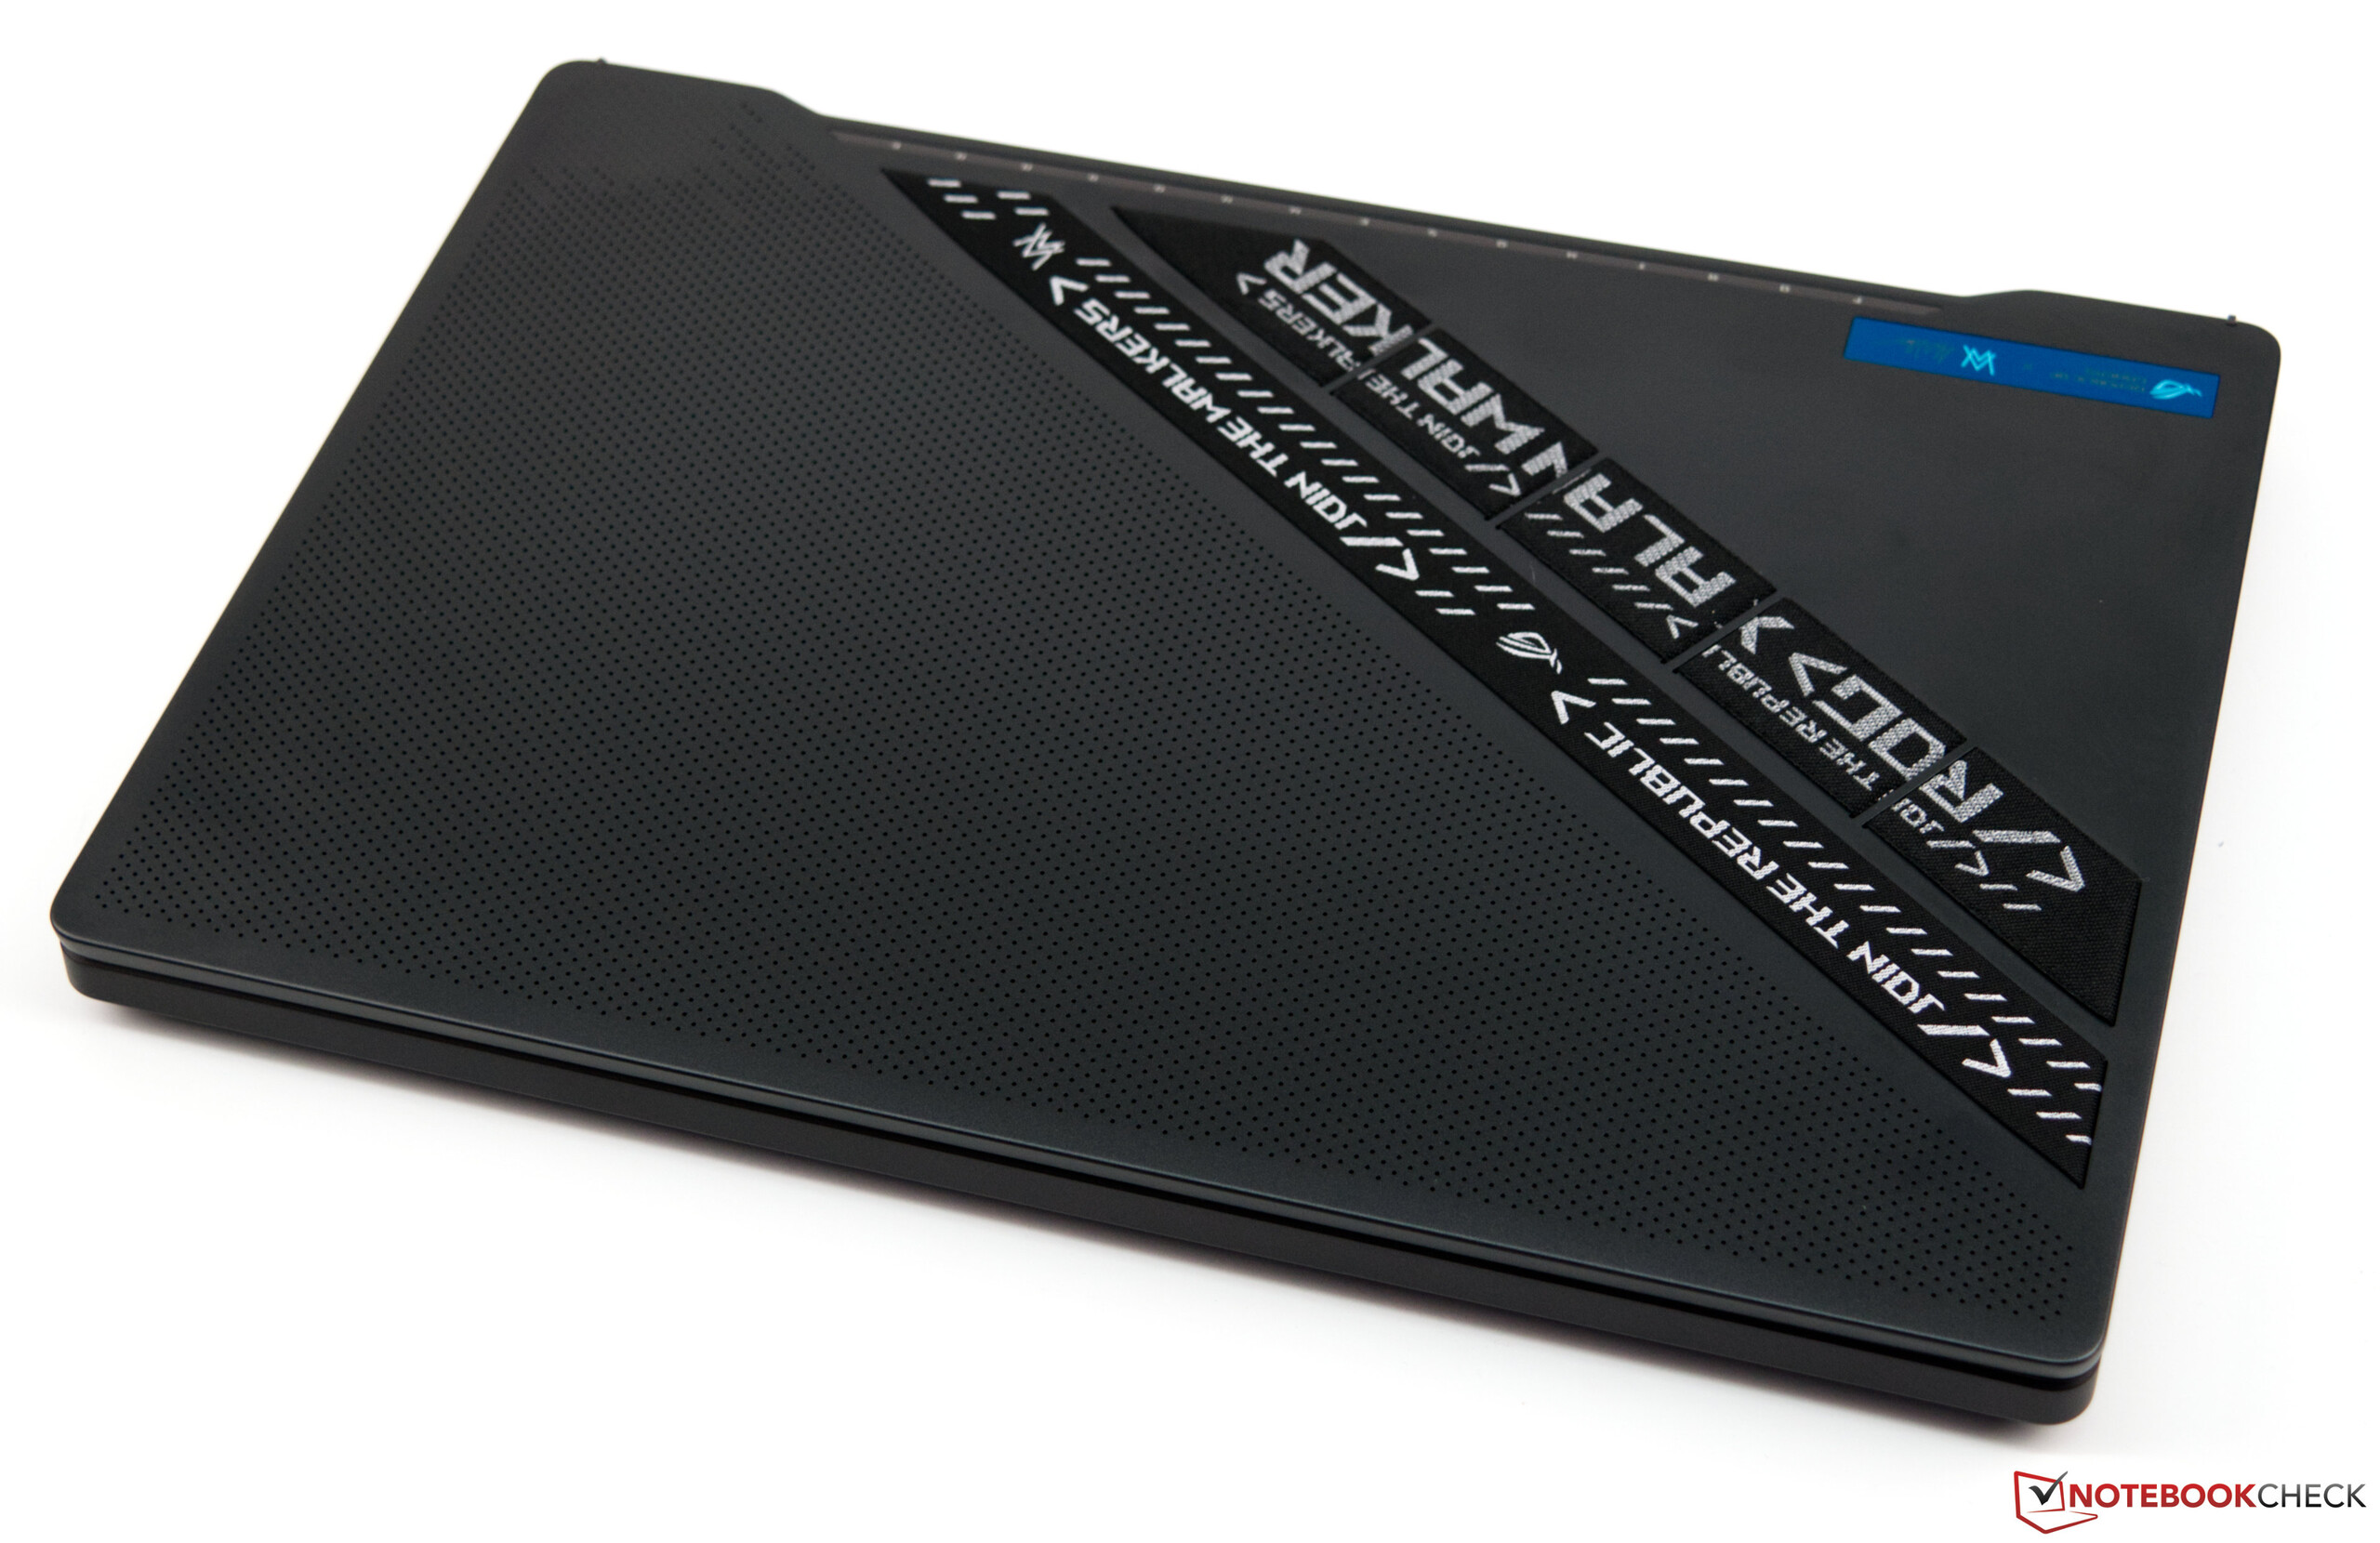
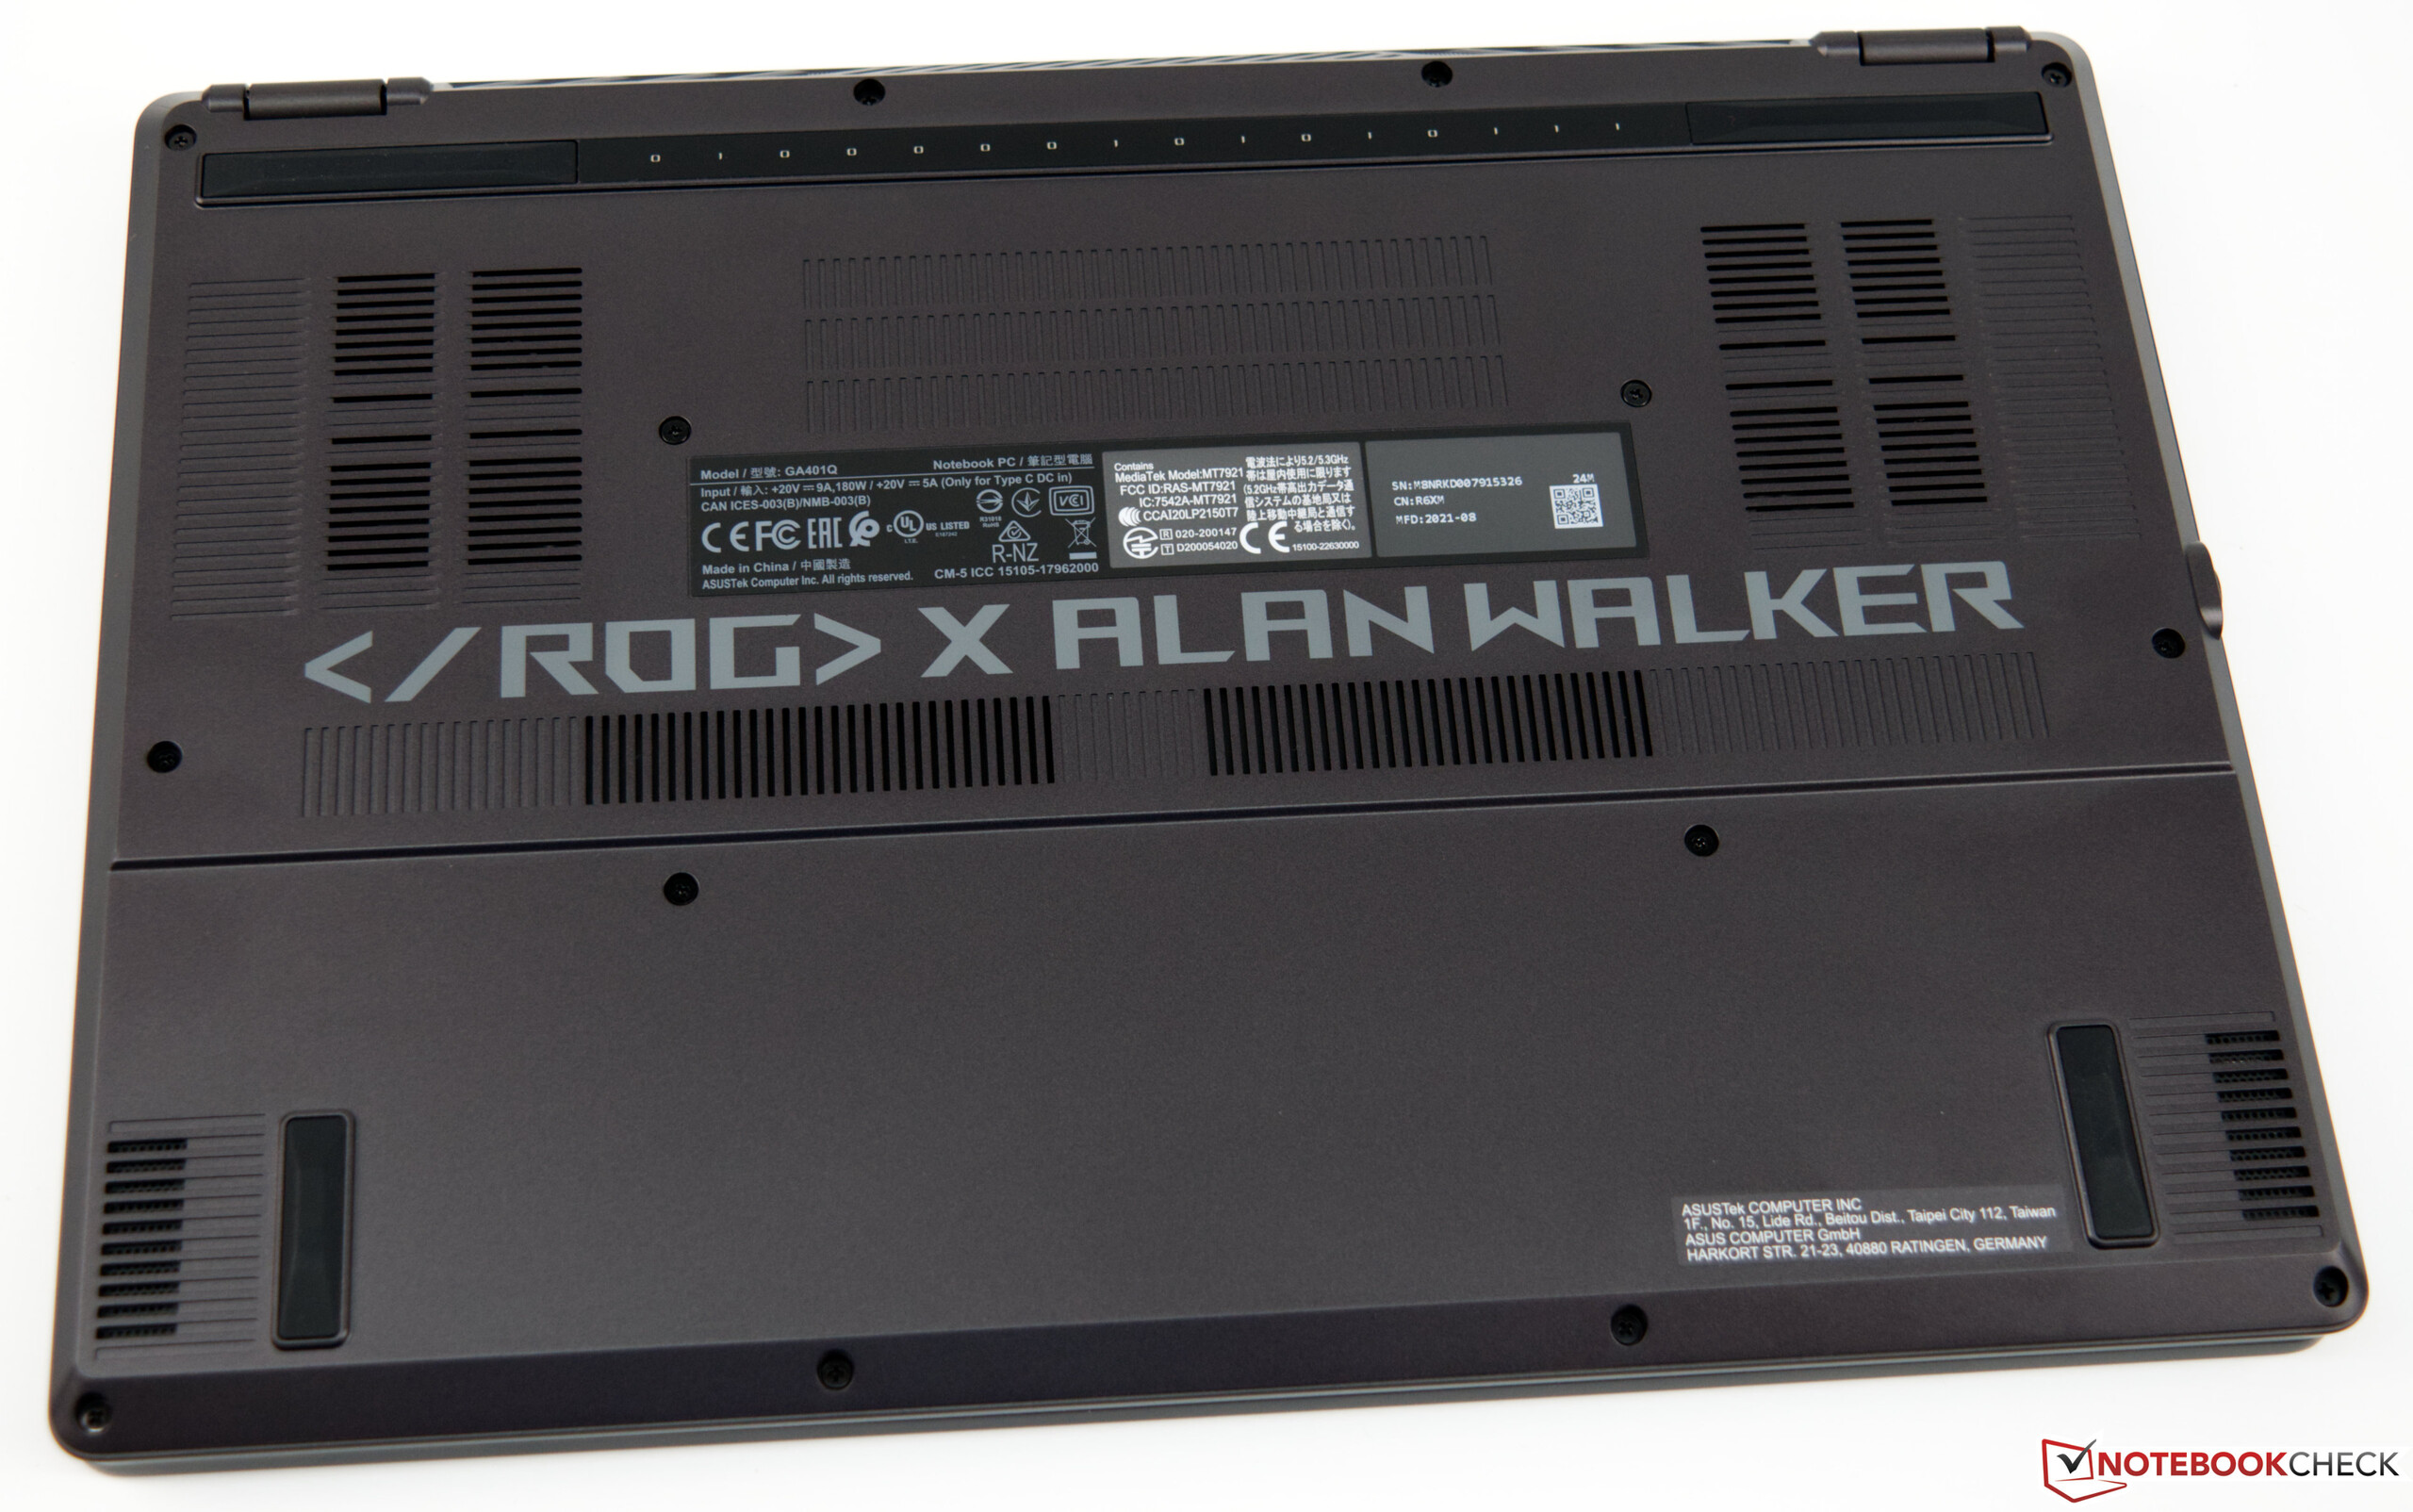
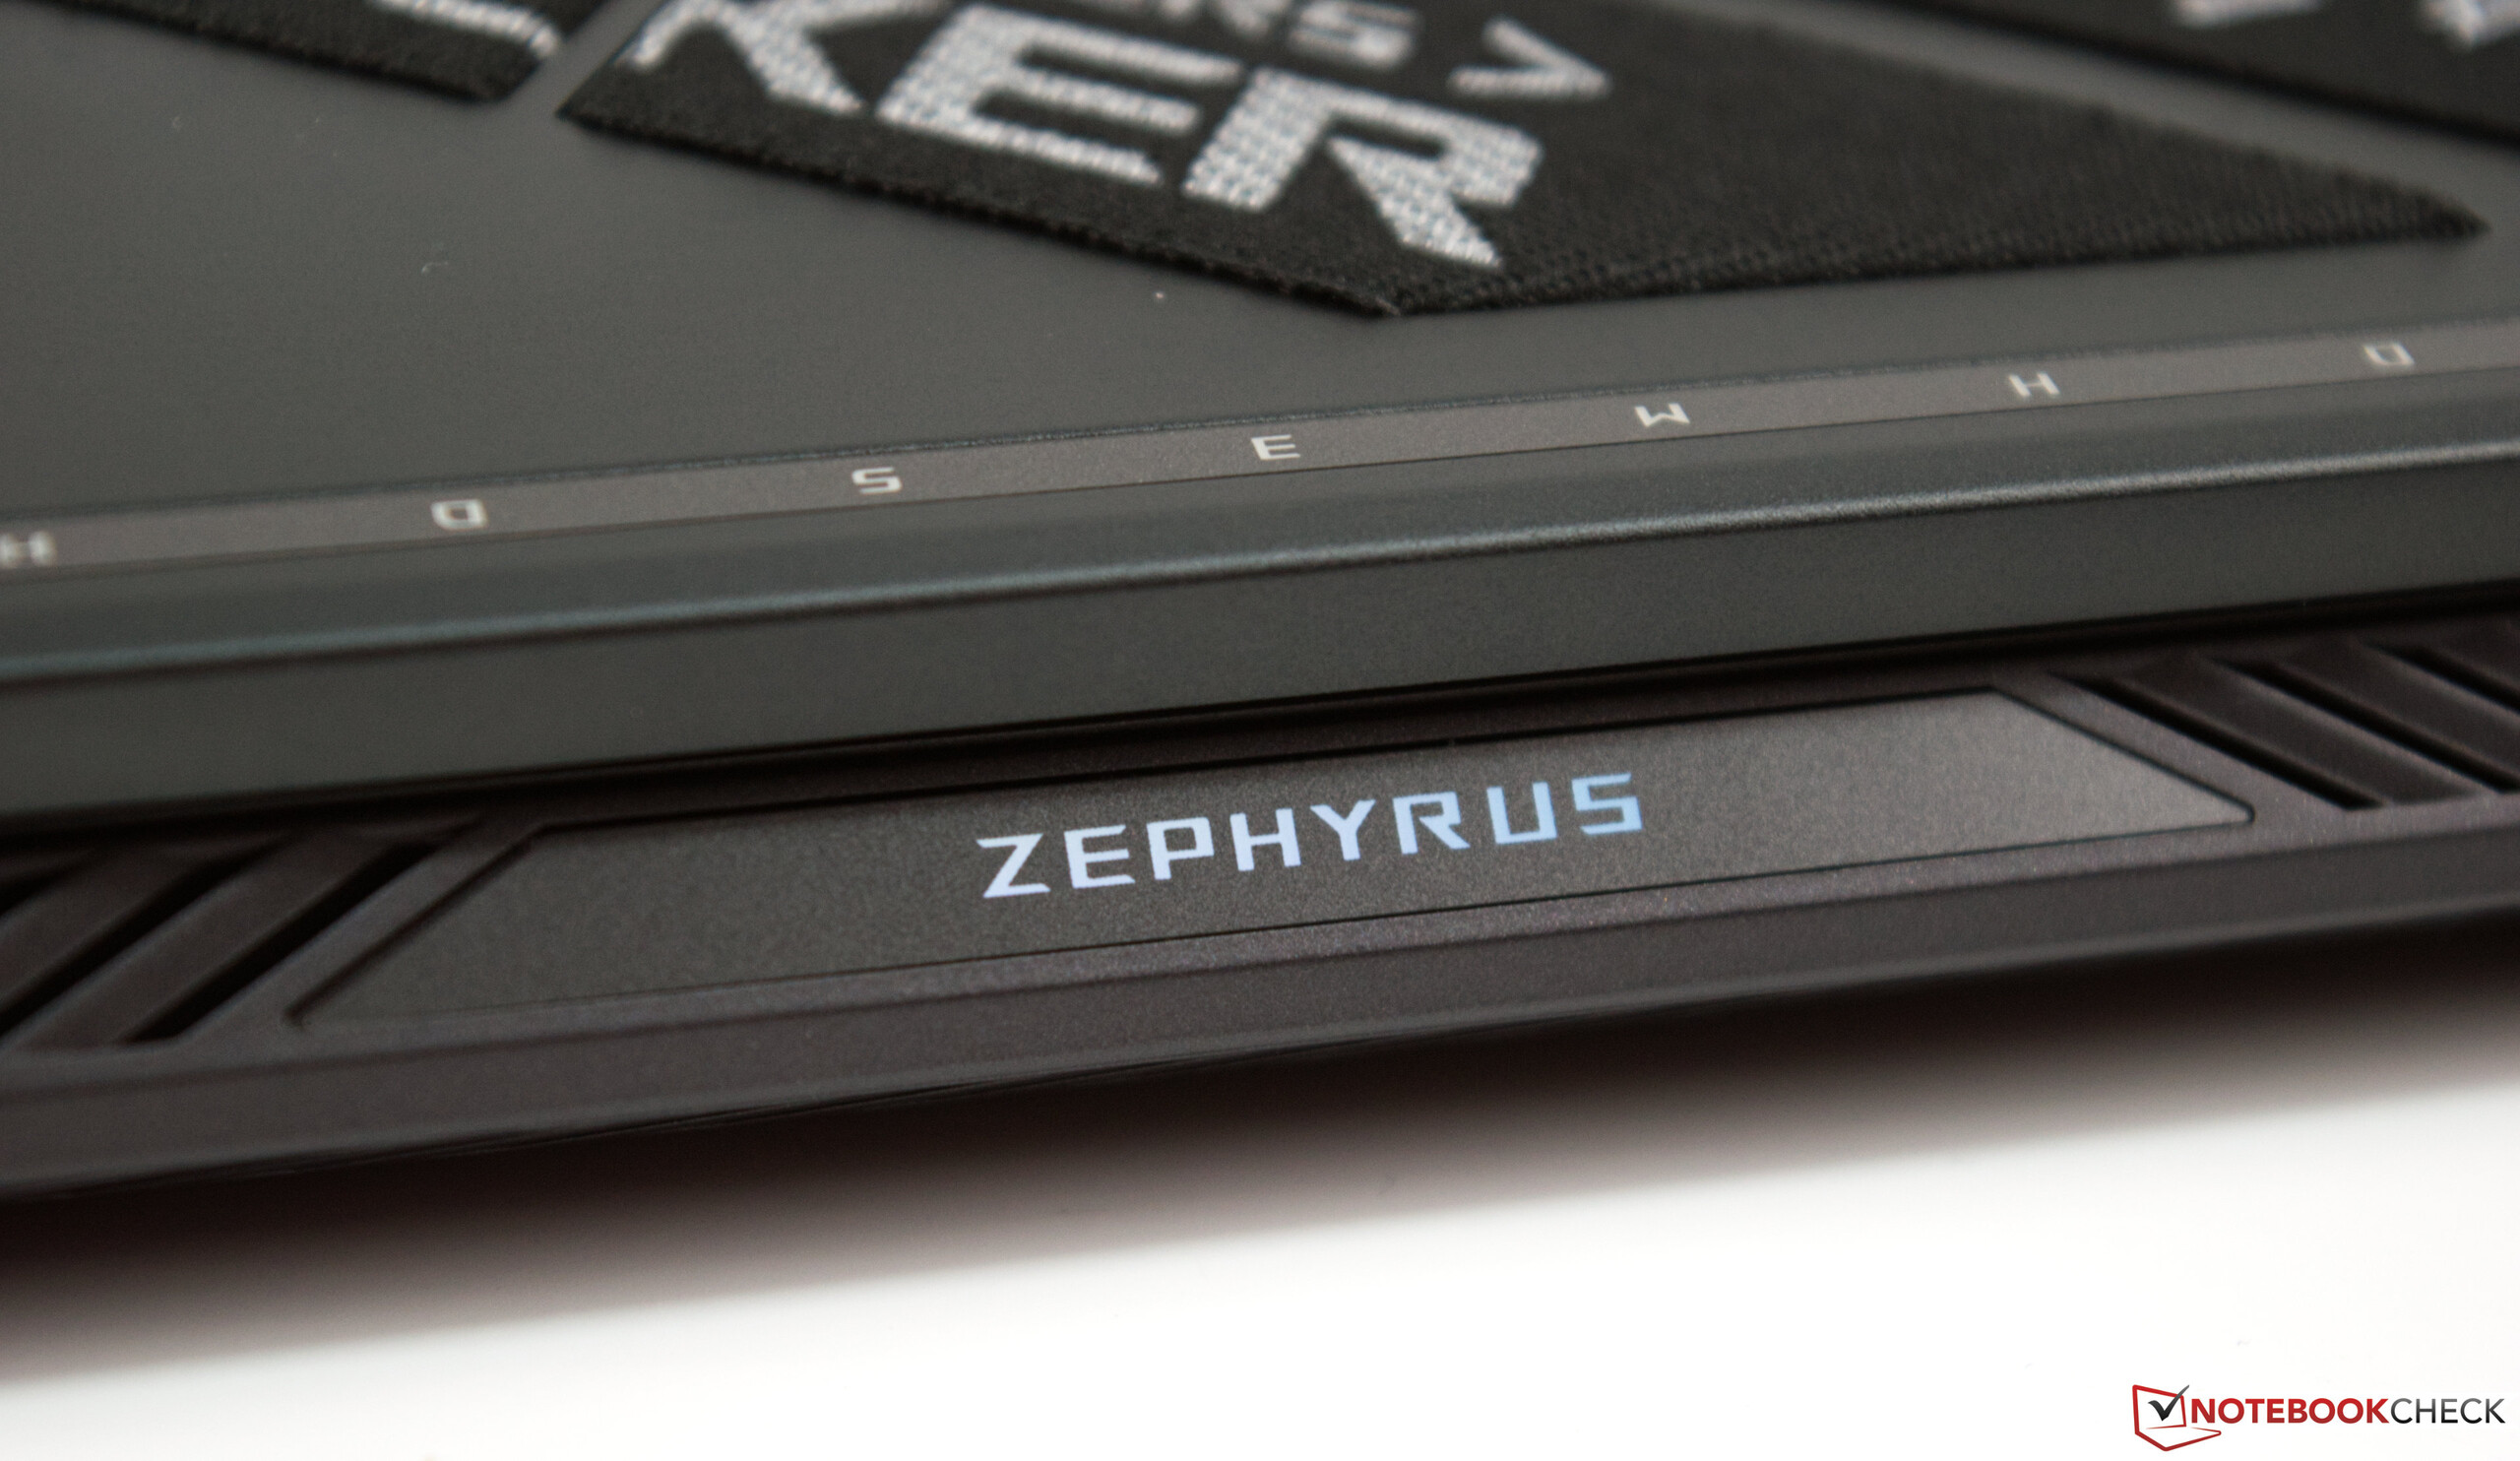
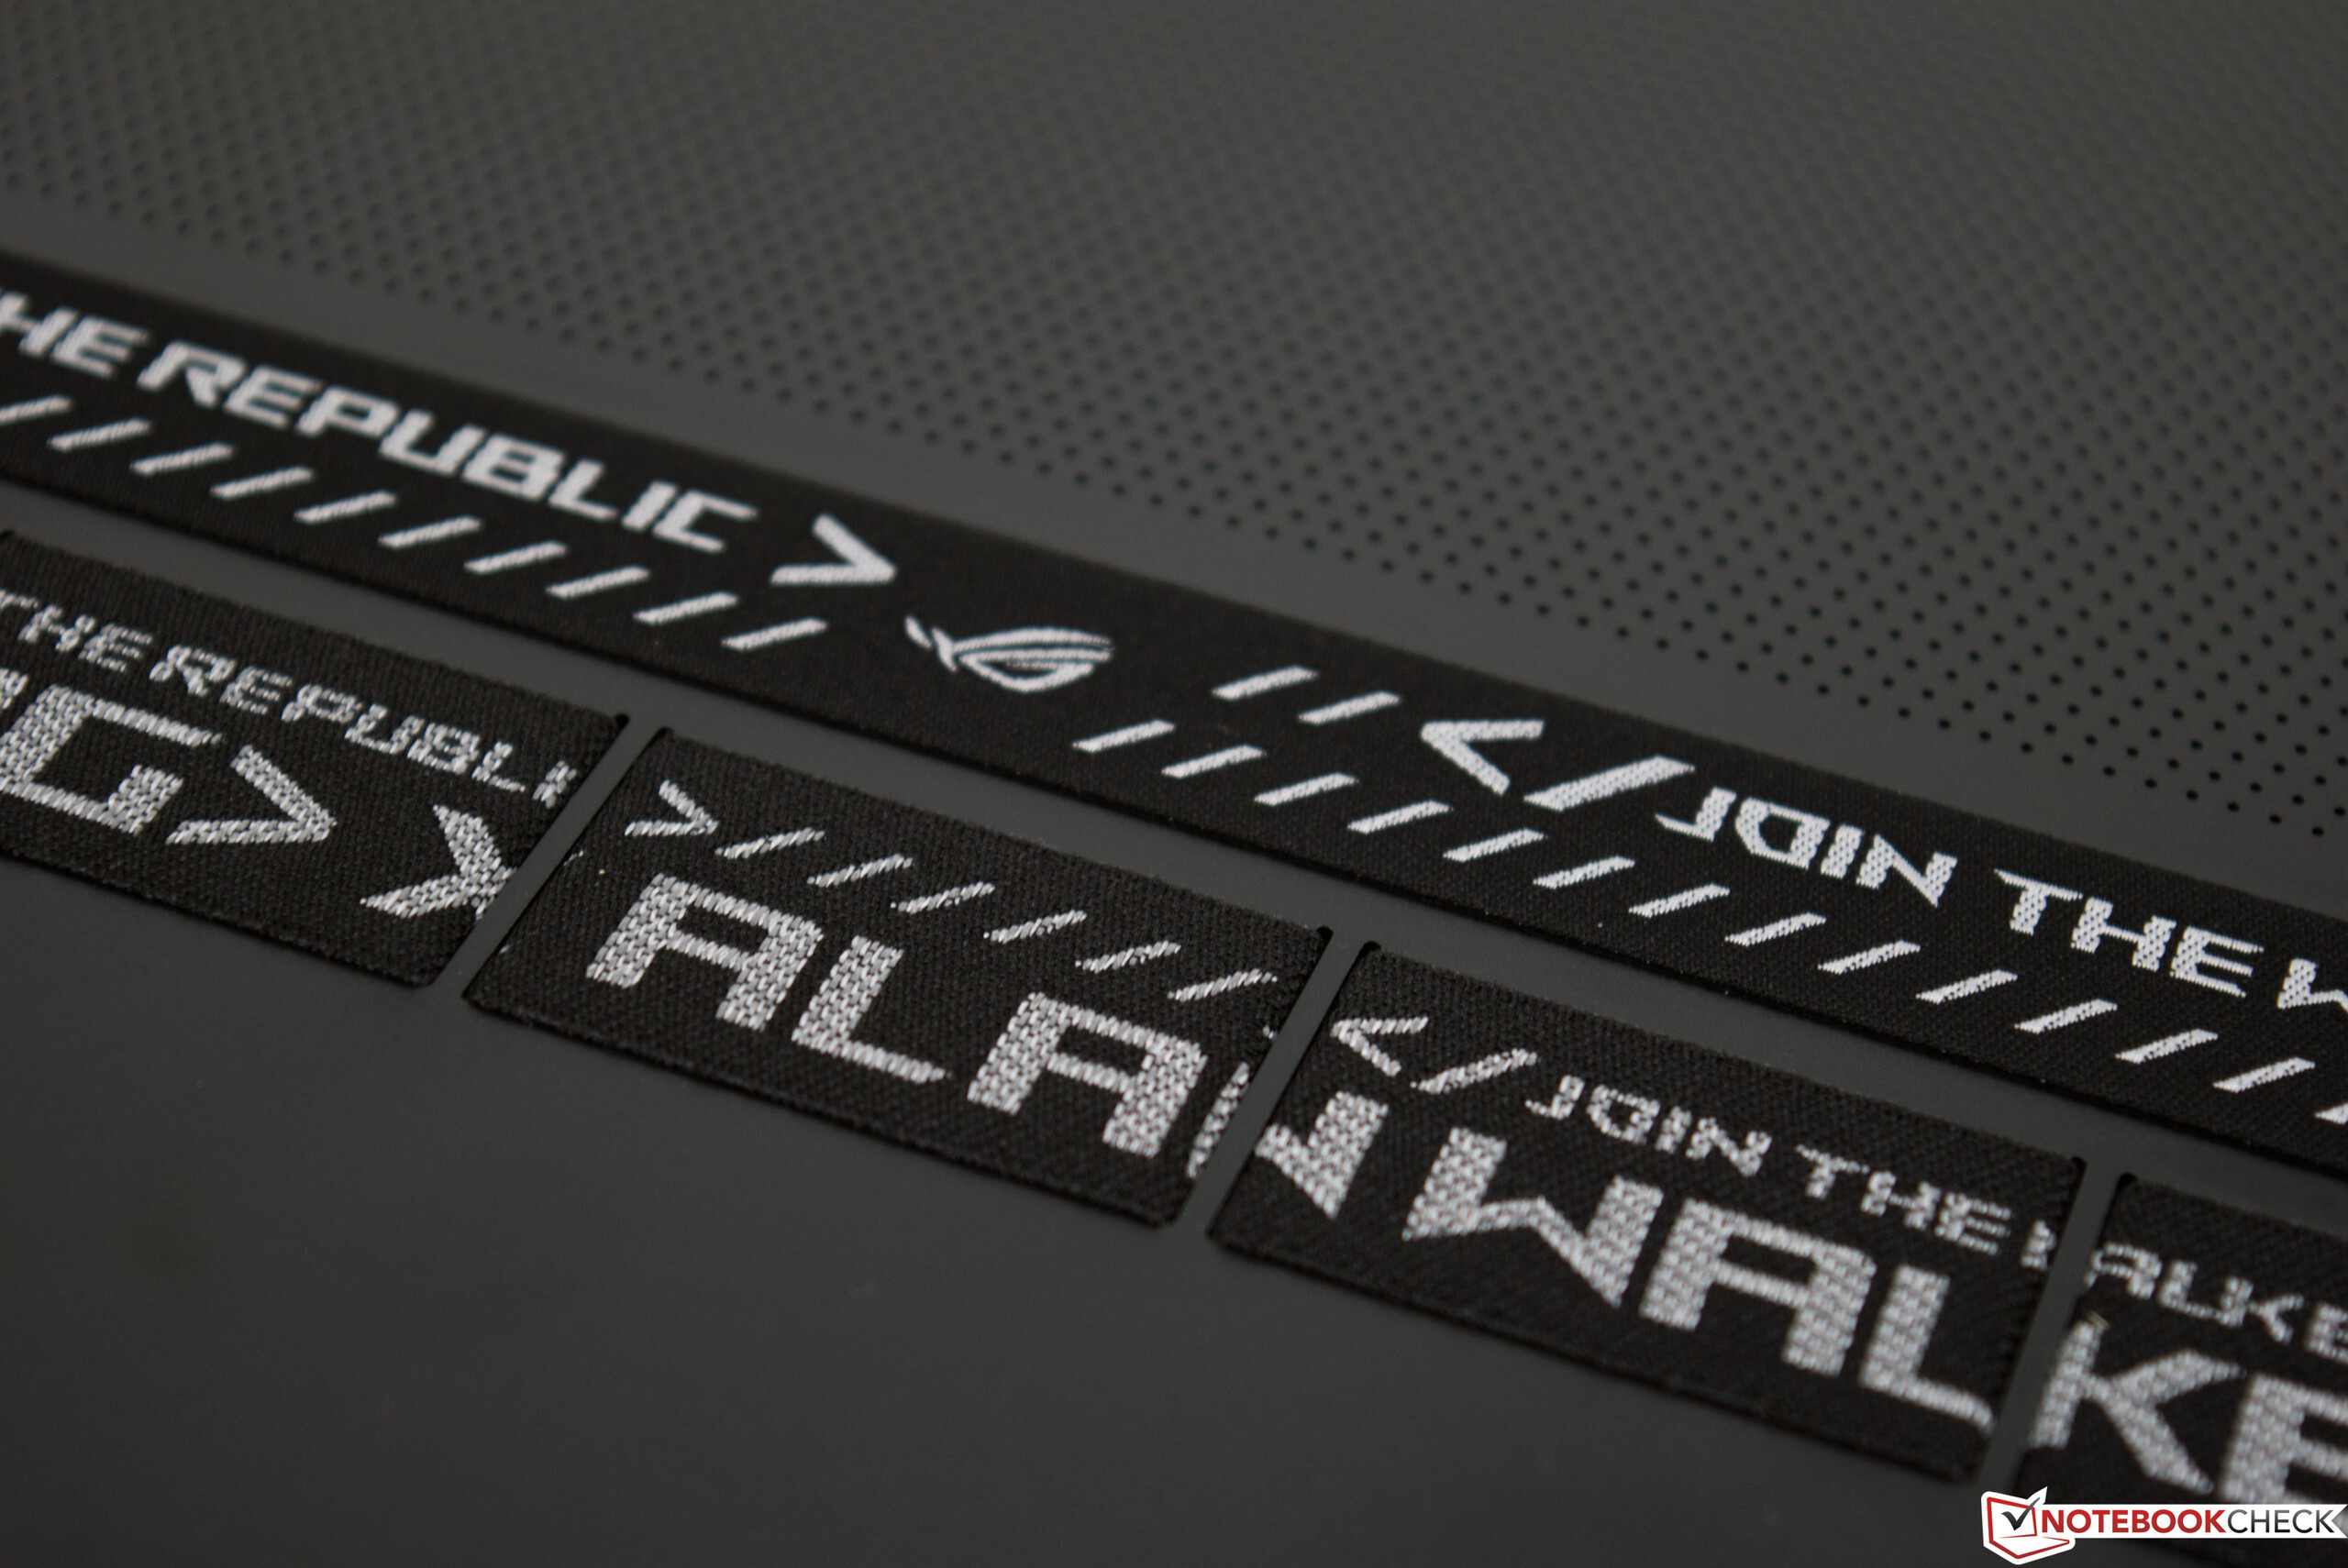
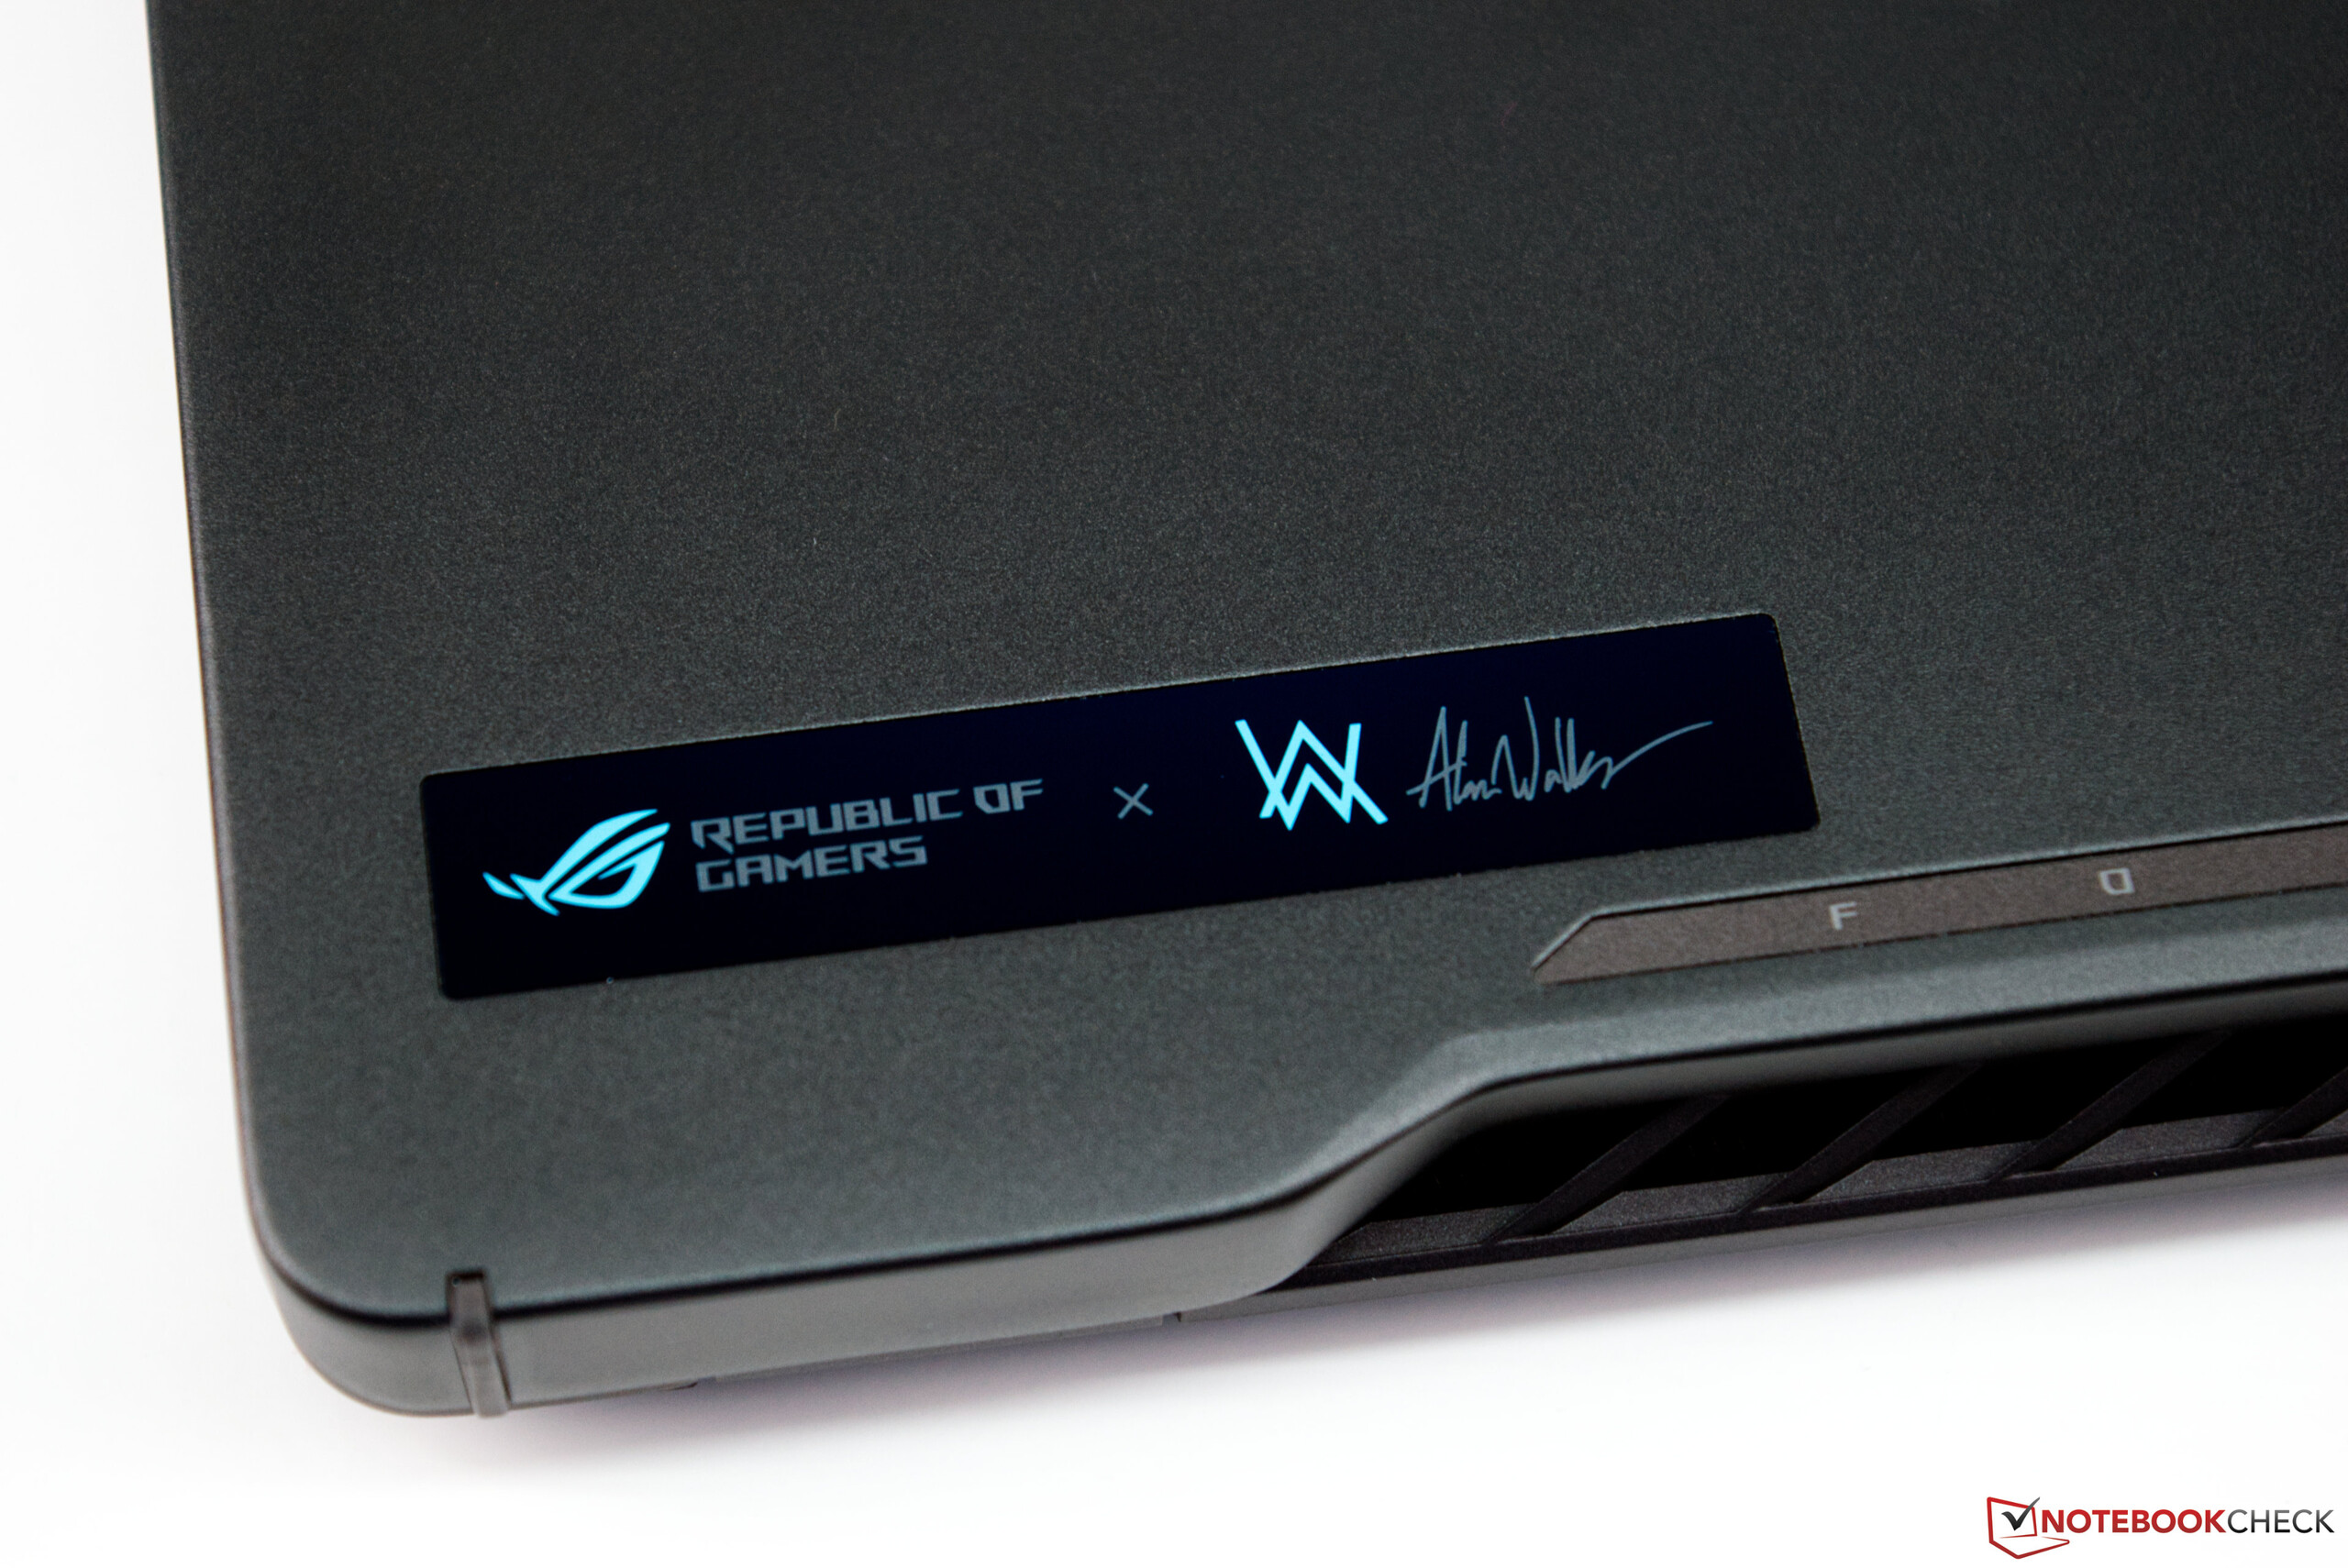
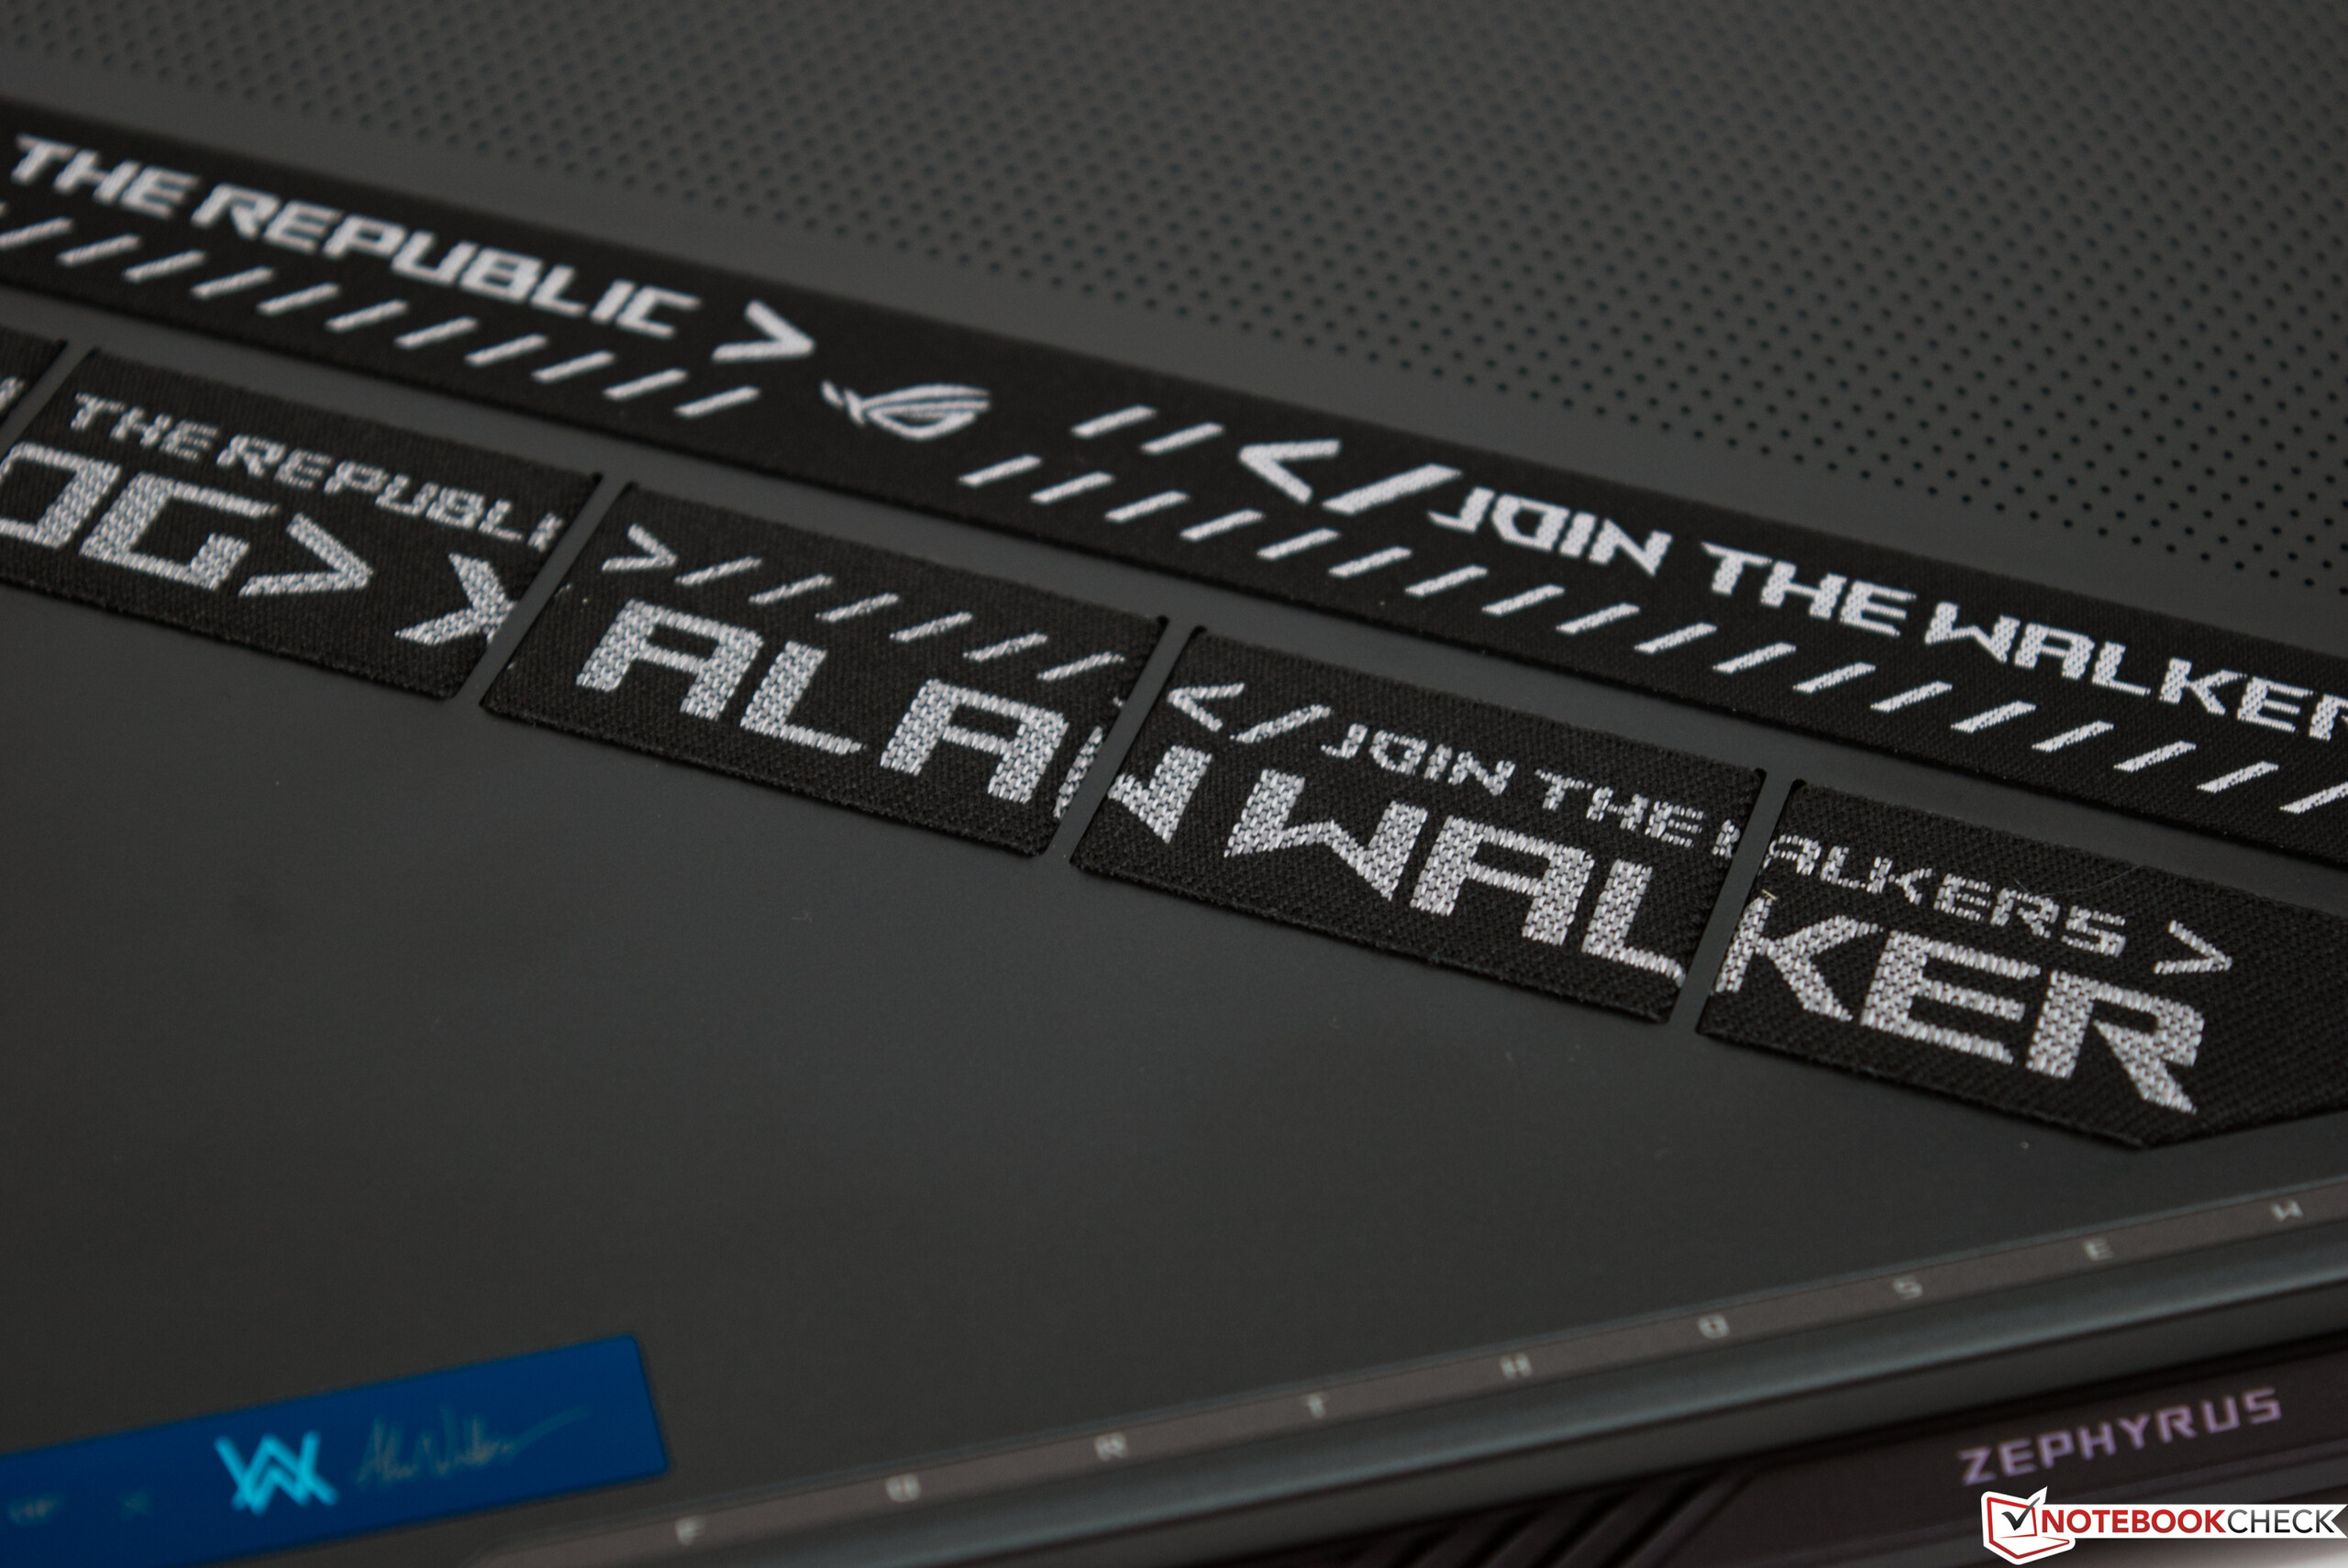
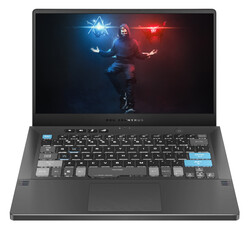
The modifications of the Special Edition are strictly visual, and they are clearly noticeable at first glance. Asus Republic of Gamers (ROG) and music producer Alan Walker have released the Asus Zephyrus G14 in this Special Edition as part of a collaboration. You can tell that the device is the Alan Walker Edition even when it's turned off, which is thanks to all the letters and signatures. Even the keyboard wasn't overlooked, since it has been decorated with the corresponding accents.
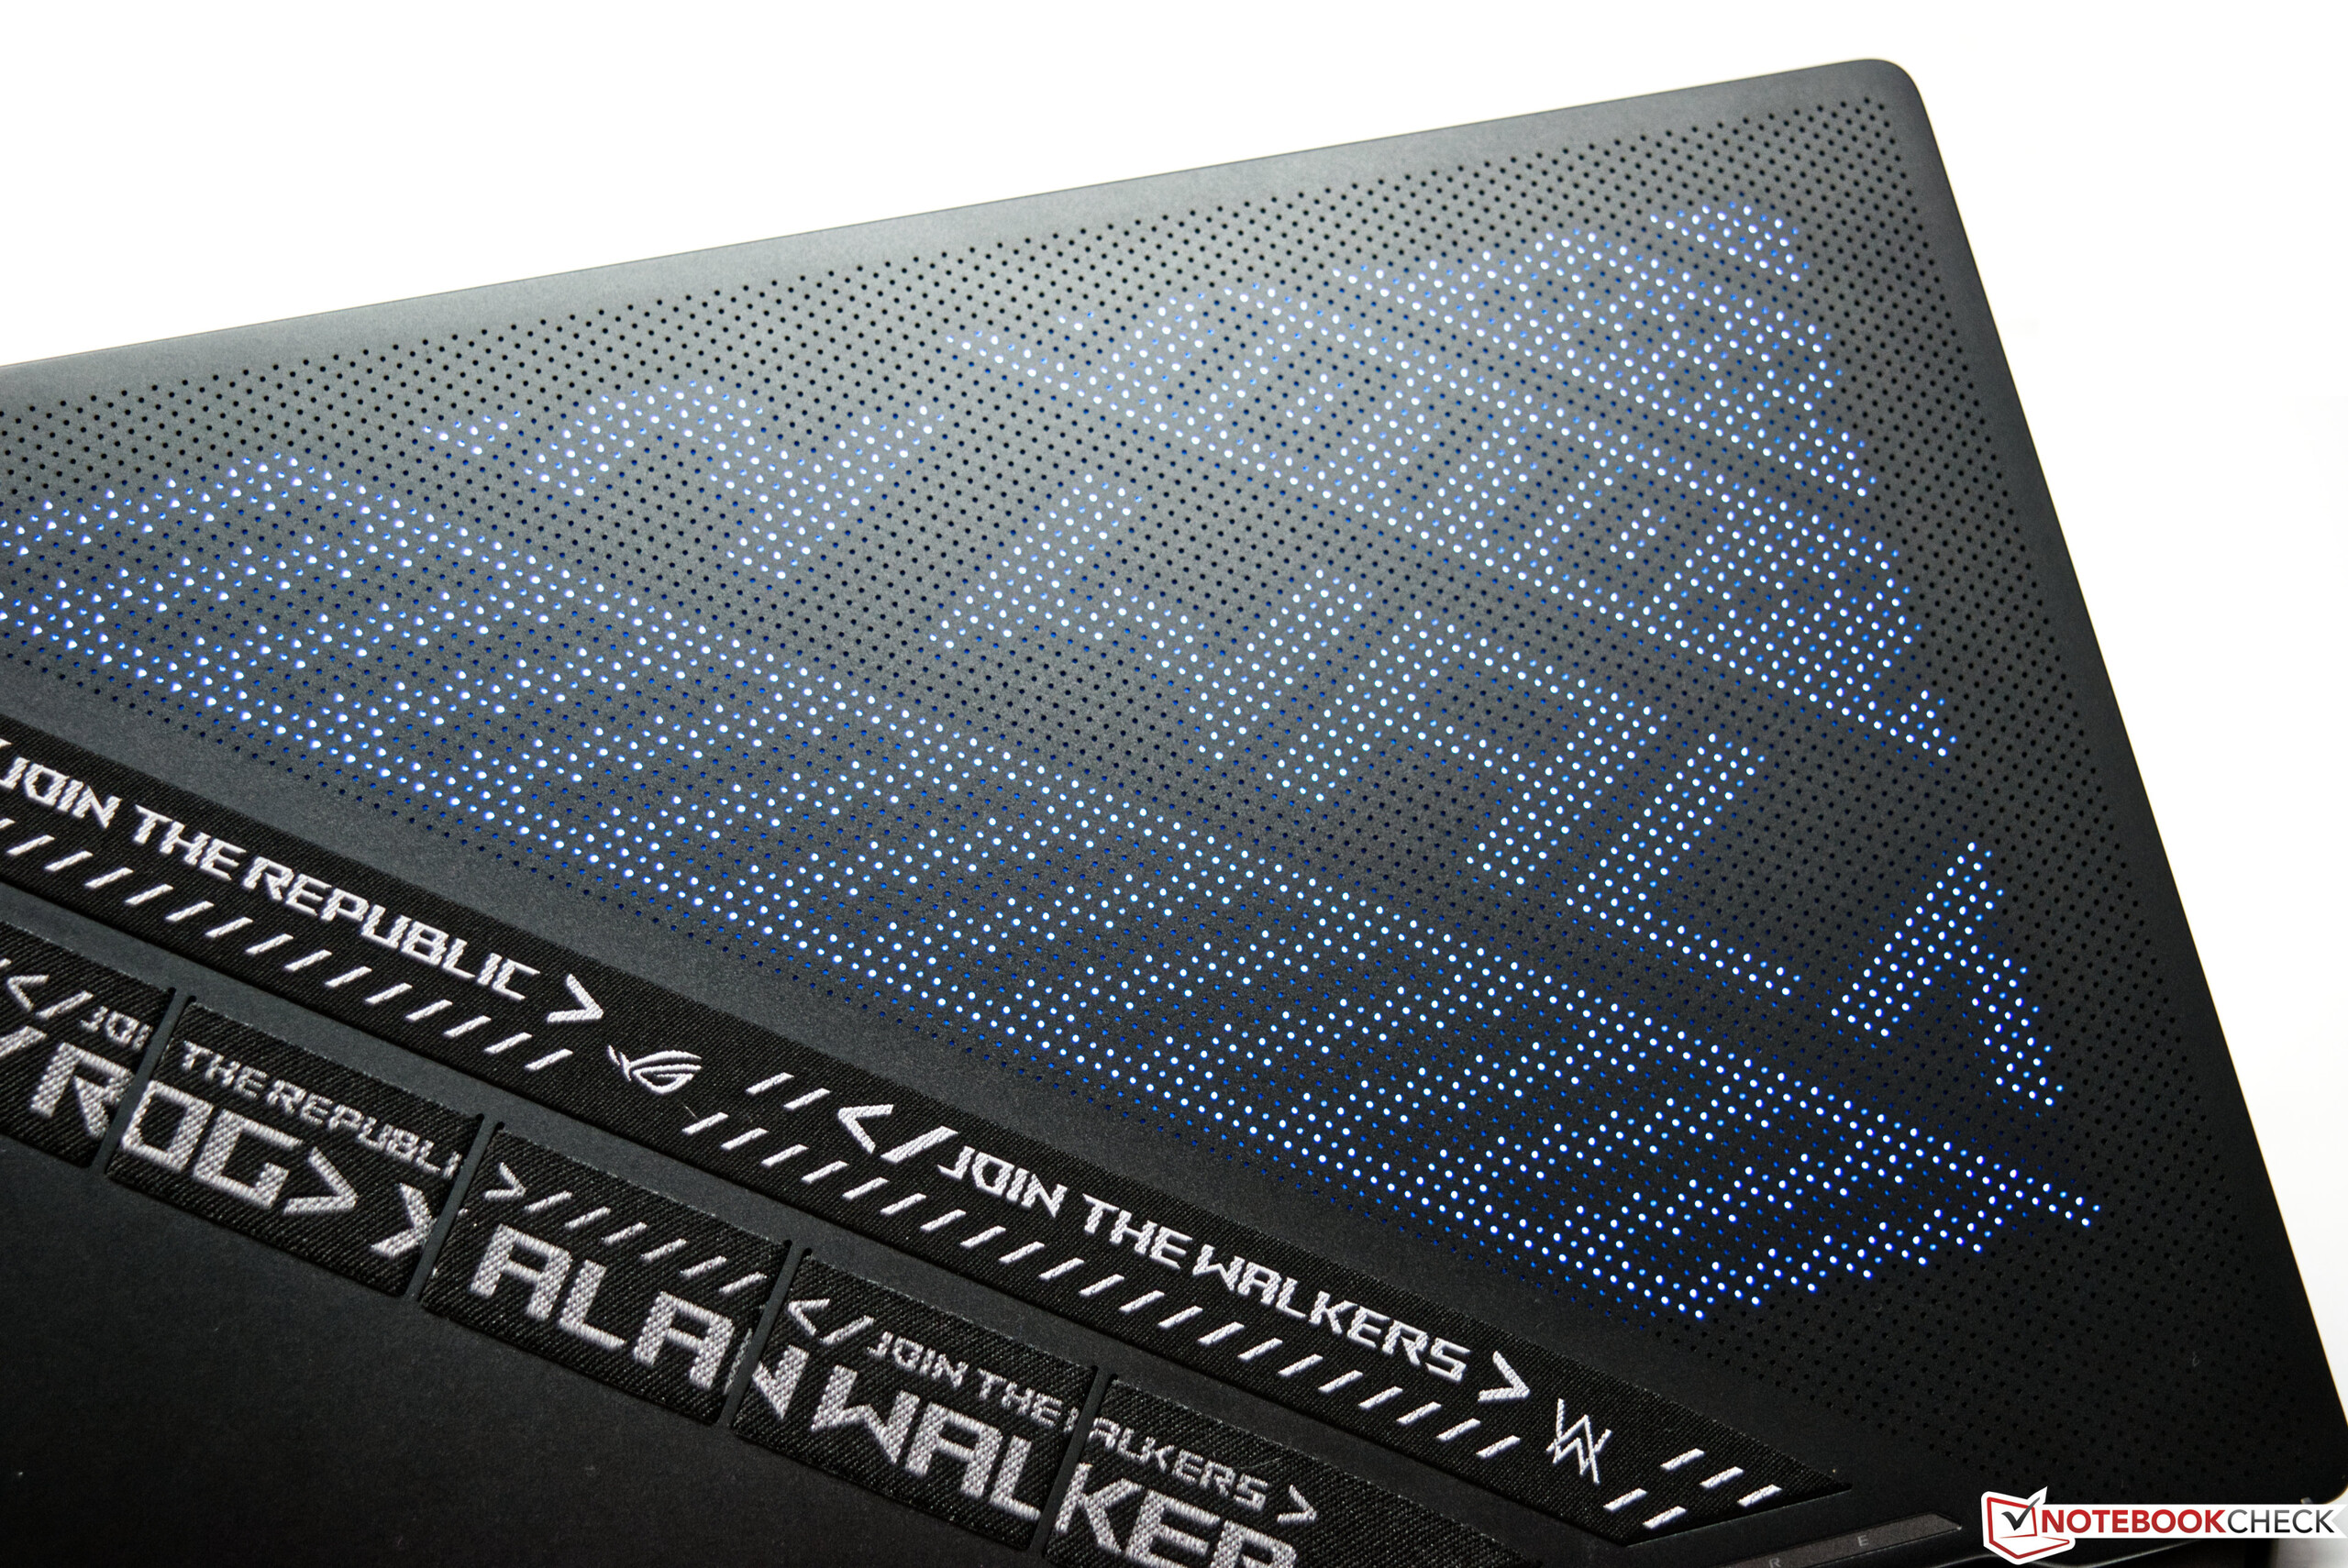
Asus has incorporated a great gimmick into the display lid: A matrix panel consisting of 1,215 LEDs that can be configured to show customized information in the form of scrolling text. But logos and system information can also be displayed there, but it makes little sense because the user can't see this information during normal use. As a result, the matrix panel is purely a nice-to-have feature.

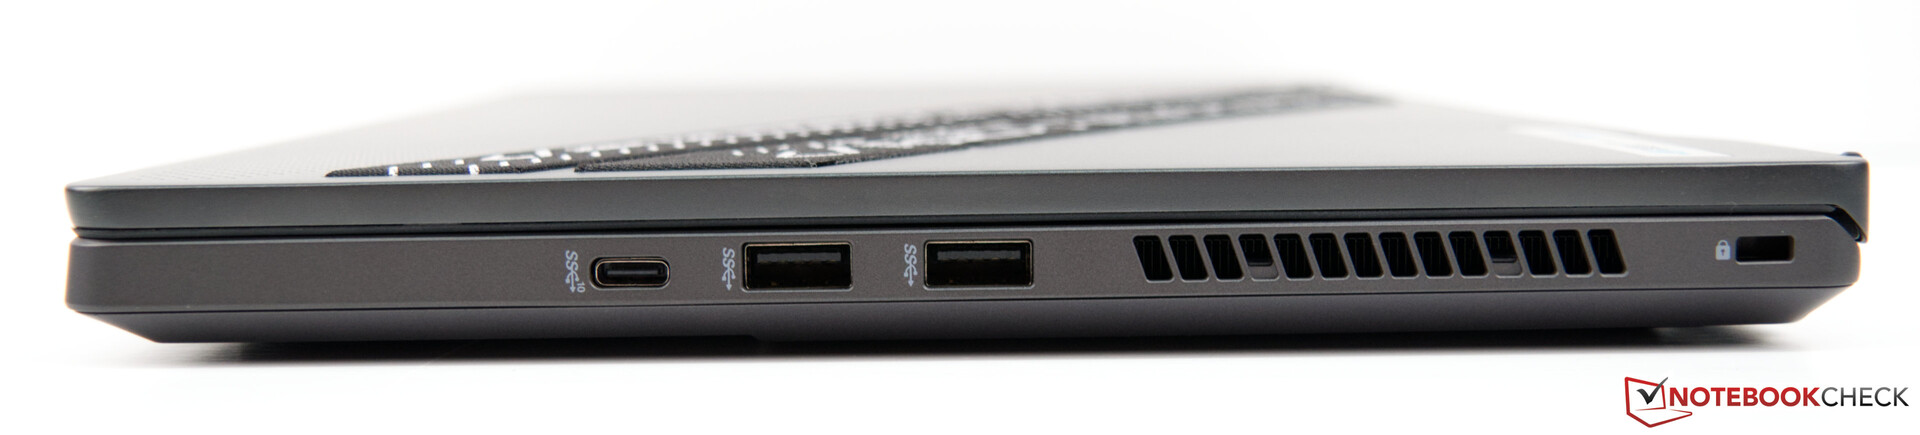
Connectivity
Display - WQHD and 120 Hz
Our review sample is equipped with a 120 Hz WQHD display. In combination with the diagonal size of 14 inches, this results in a pixel density of 210 ppi. Compared with the Full HD panel of the identically built Zephyrus G14, the WQHD display performs slightly better overall. In terms of brightness and its distribution, both displays achieve similarly good results, although the Schenker XMG Focus 15 has a much brighter display.
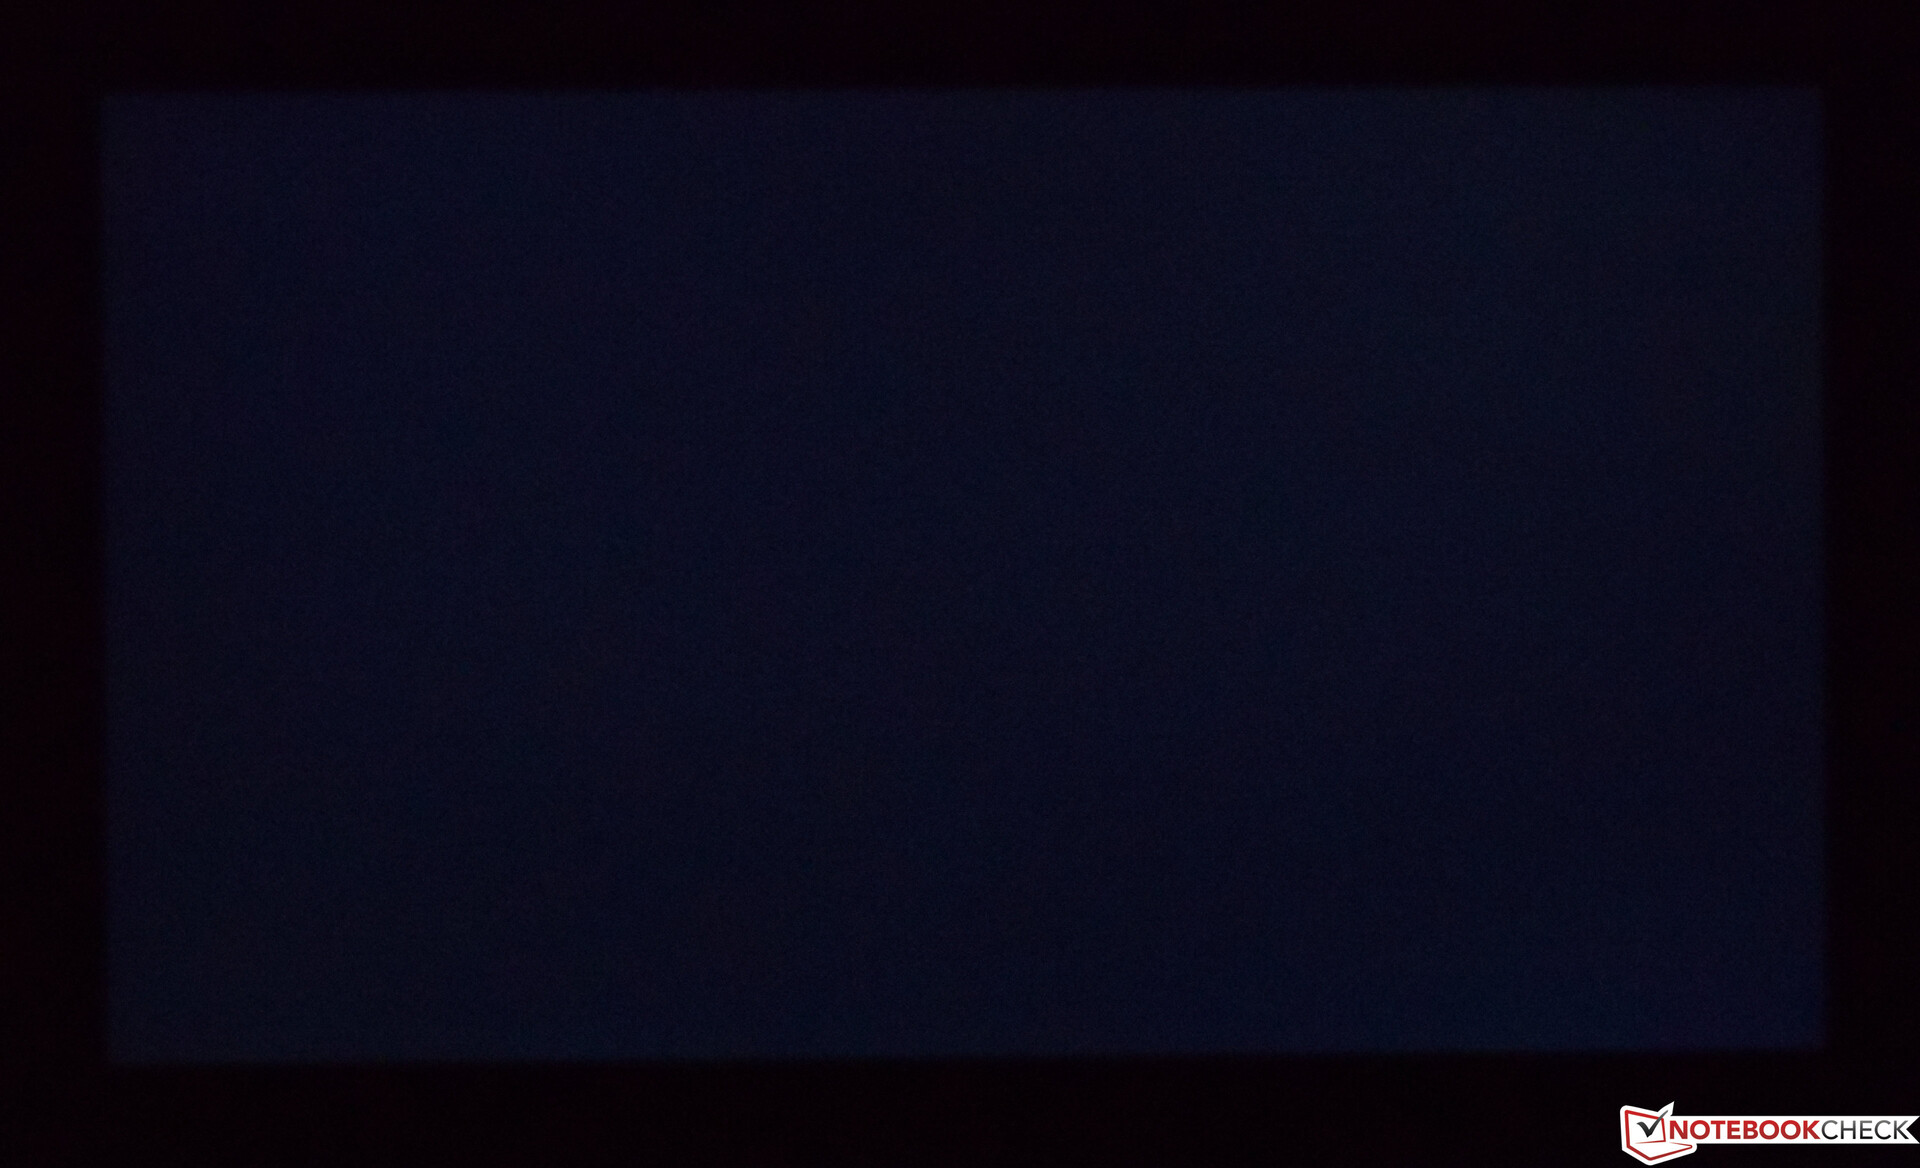
At 120 Hz, the WQHD panel is a little slower than the Full HD display with its 144 Hz, but this doesn't really matter in normal use. When it comes to backlight bleeding, our review sample impresses with a very good result in complete darkness - no bright spots are visible. Similarly, PWM is not an issue in our Zephyrus G14, nor in any of the other comparison devices in this review.
| |||||||||||||||||||||||||
Brightness Distribution: 89 %
Center on Battery: 196 cd/m²
Contrast: 925:1 (Black: 0.36 cd/m²)
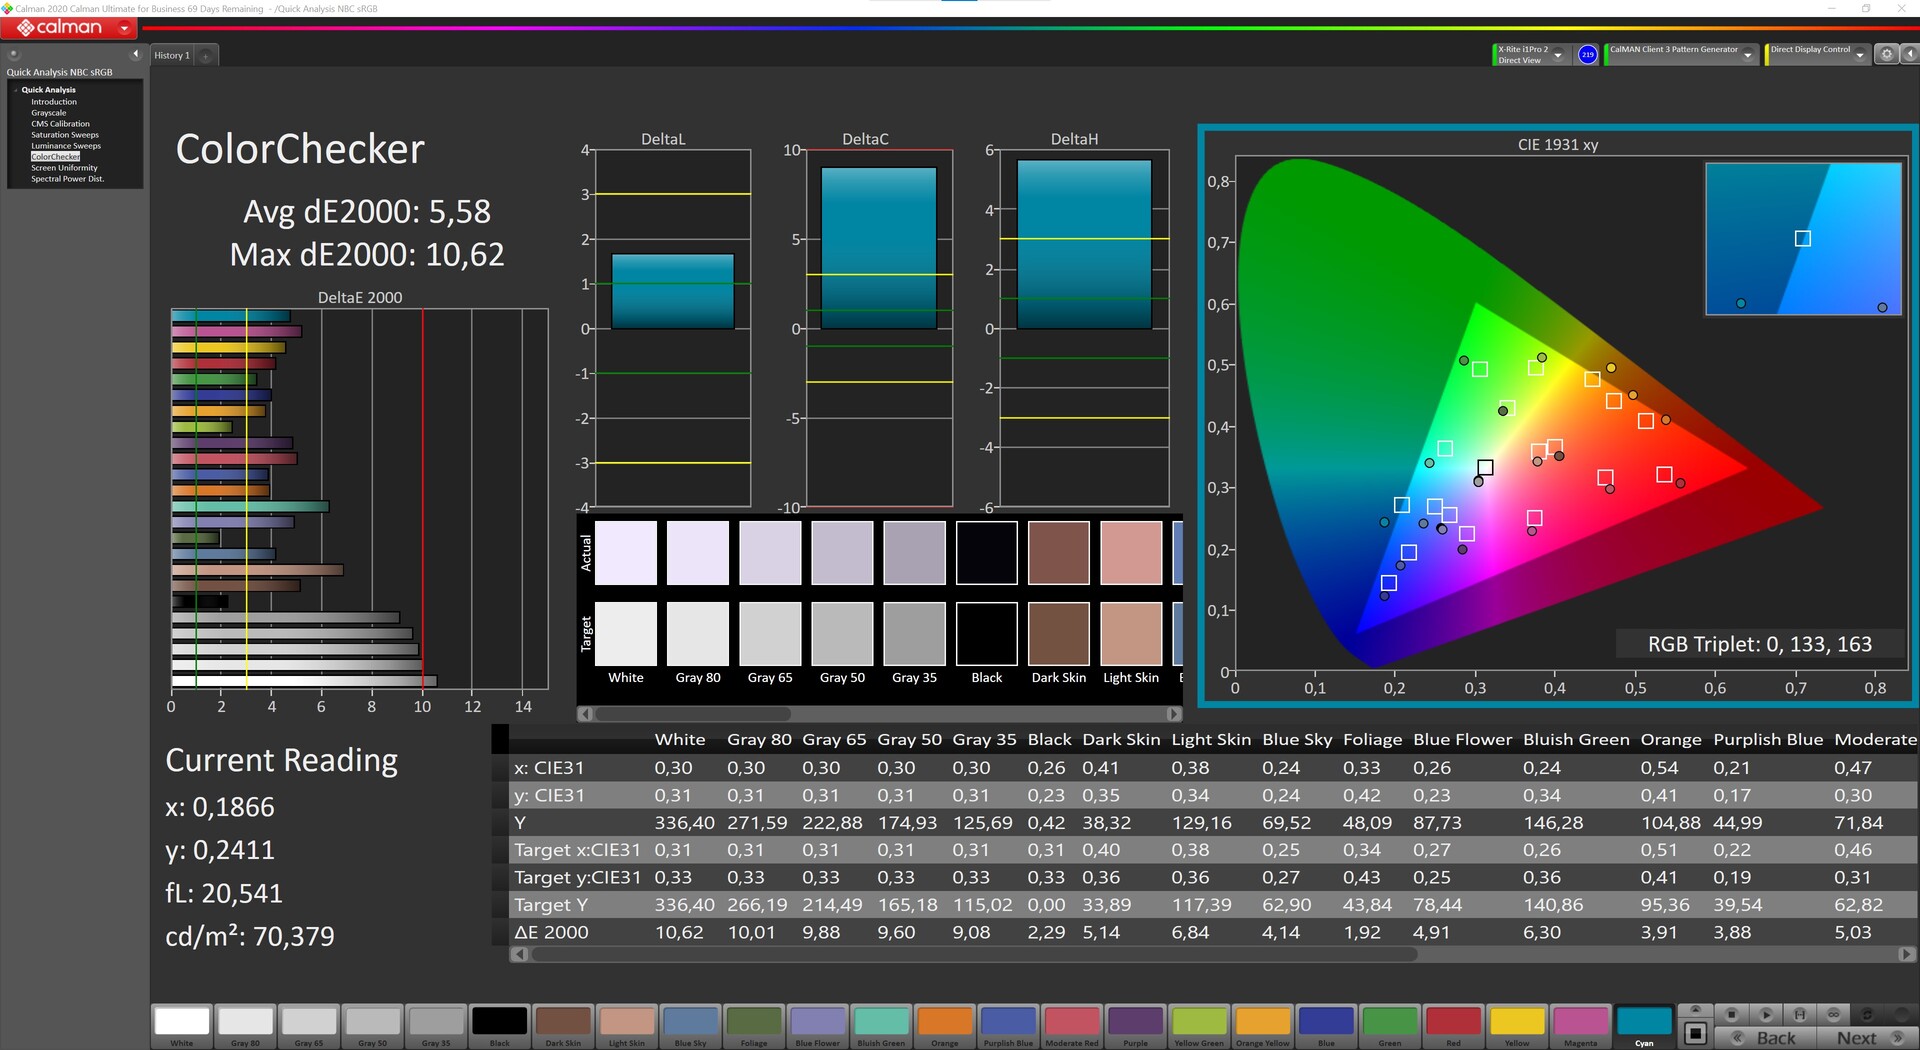
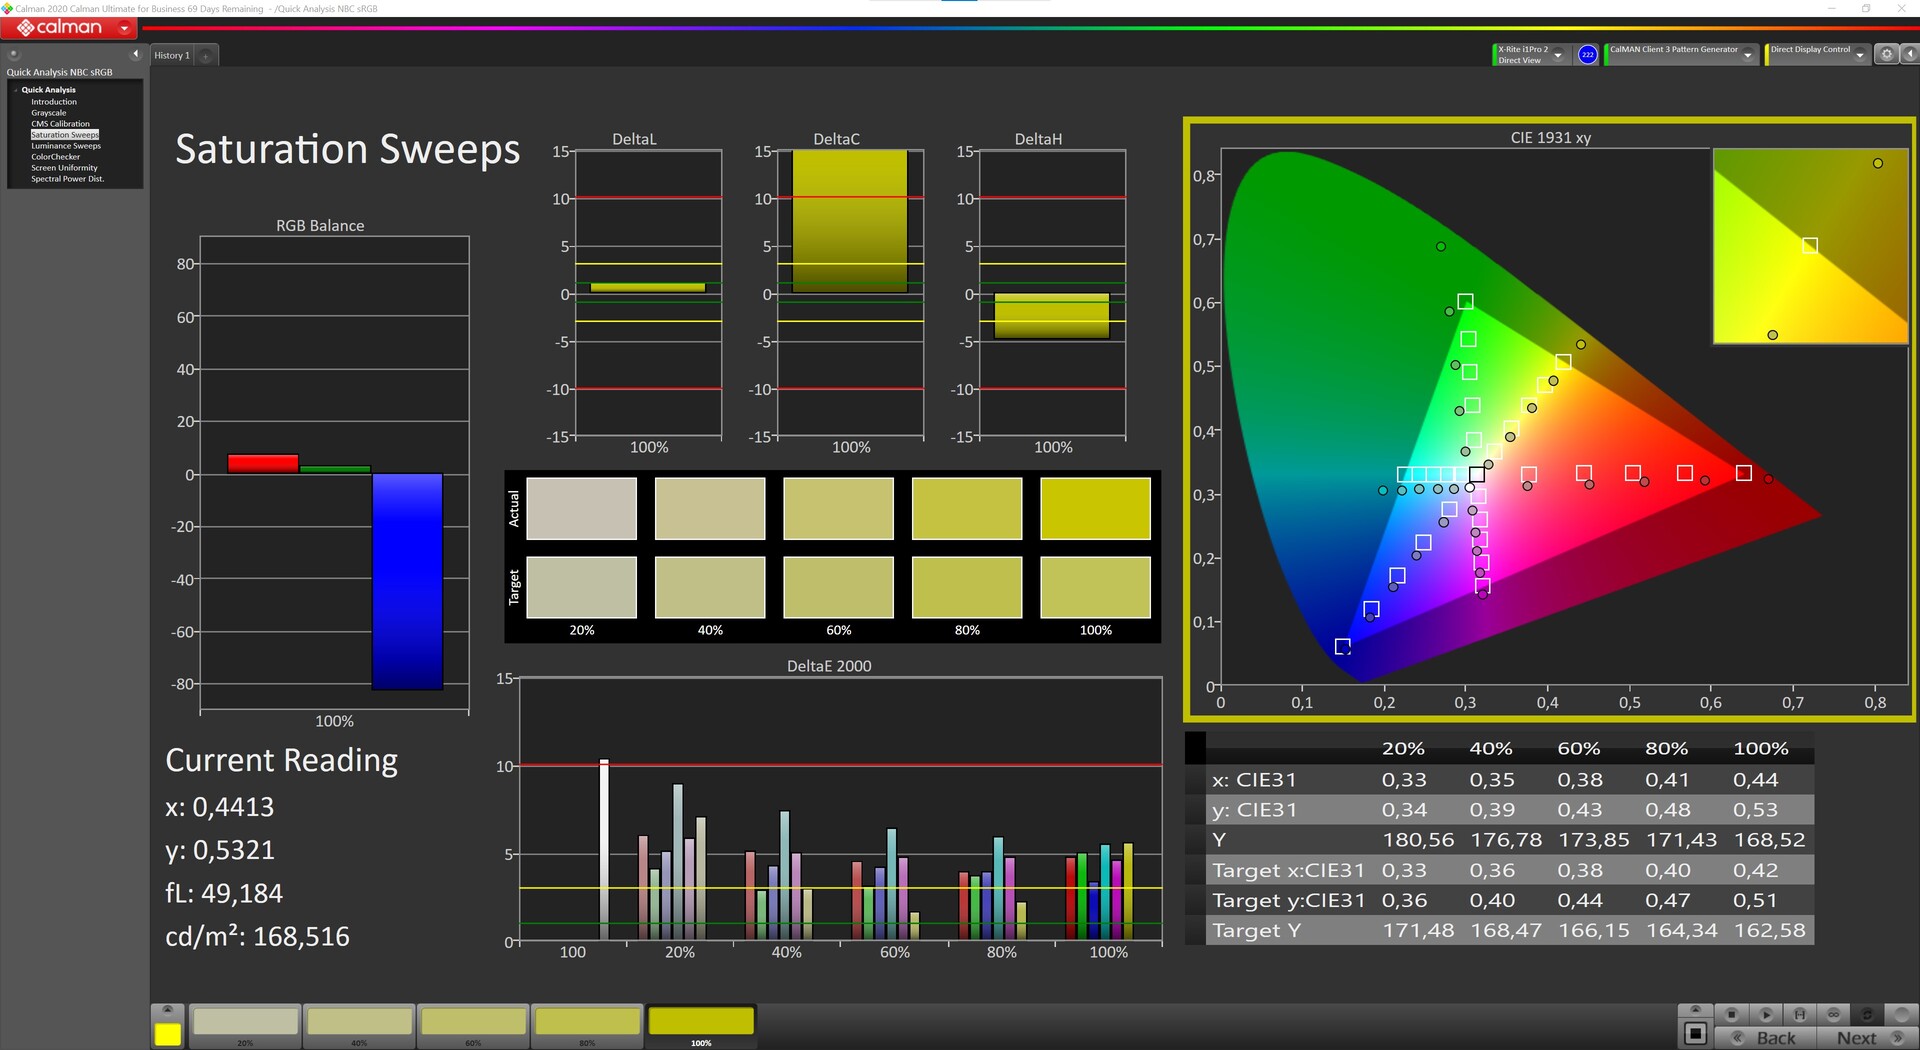
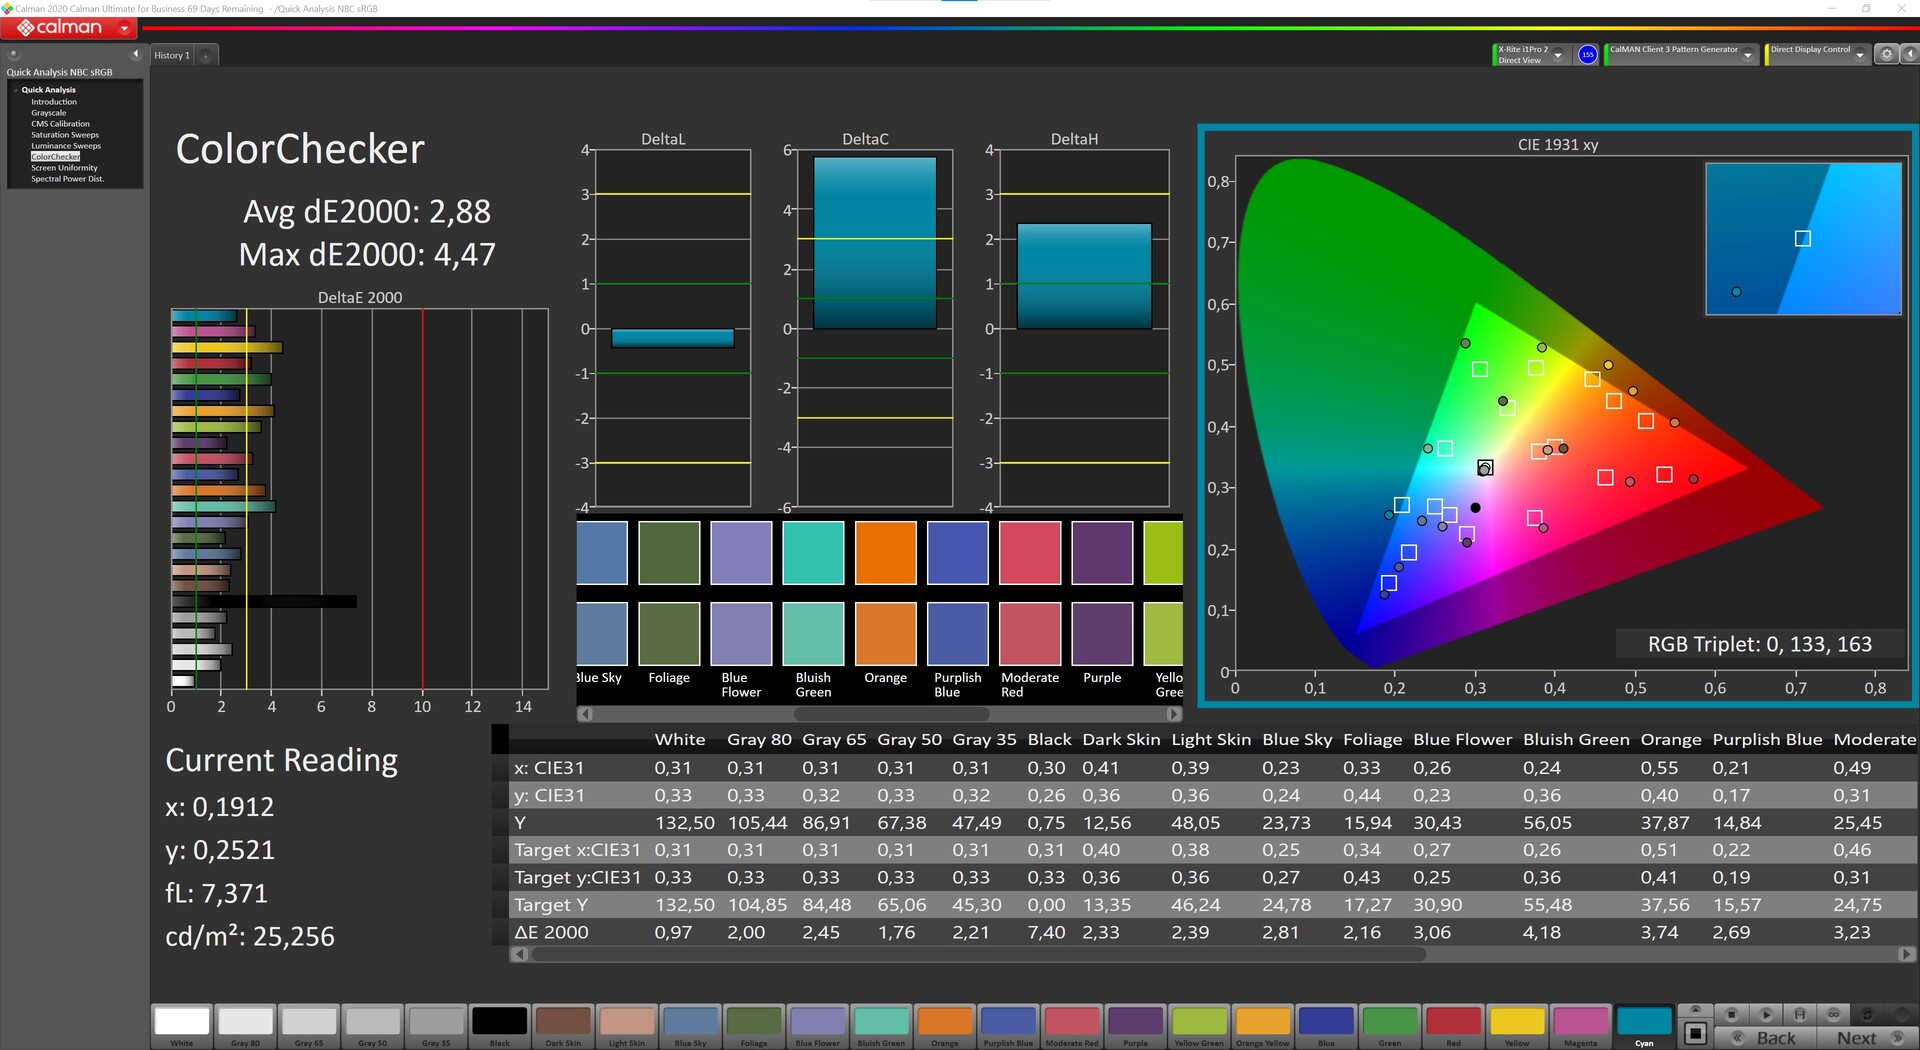
ΔE ColorChecker Calman: 5.58 | ∀{0.5-29.43 Ø4.73}
calibrated: 2.88
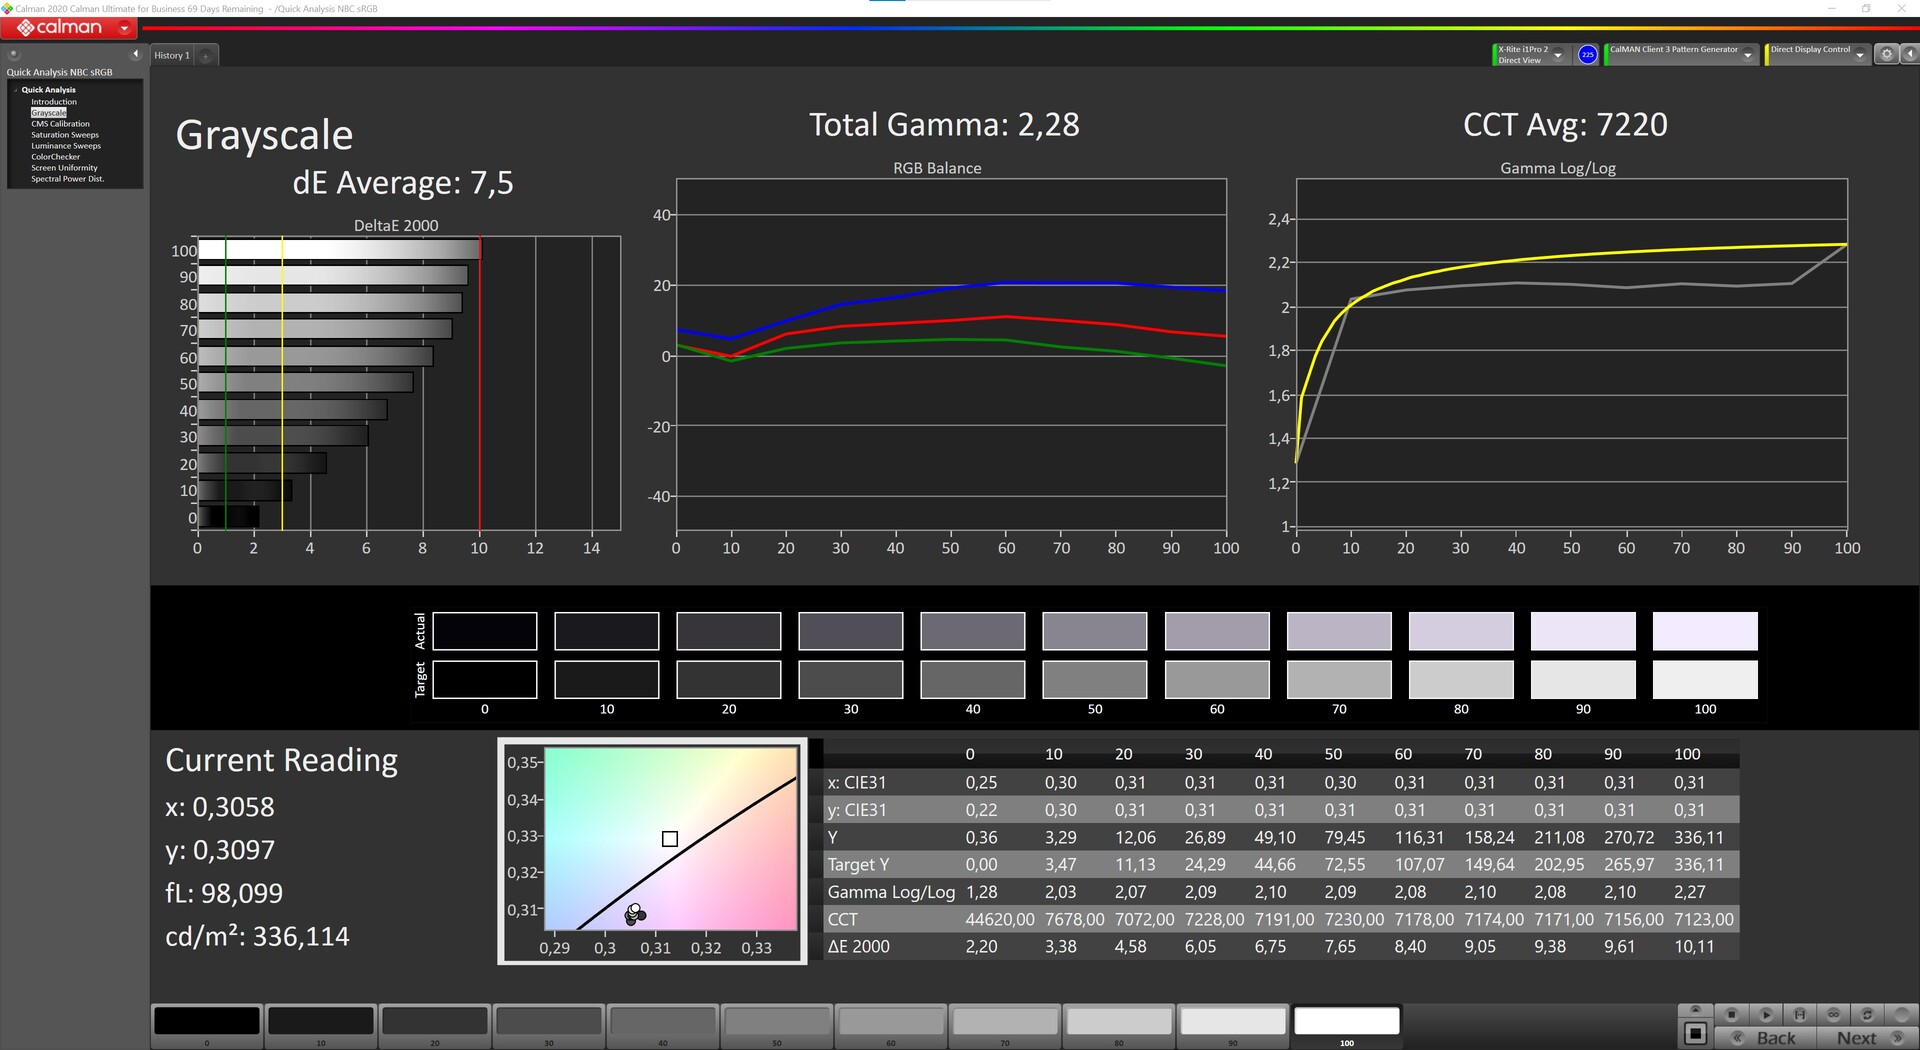
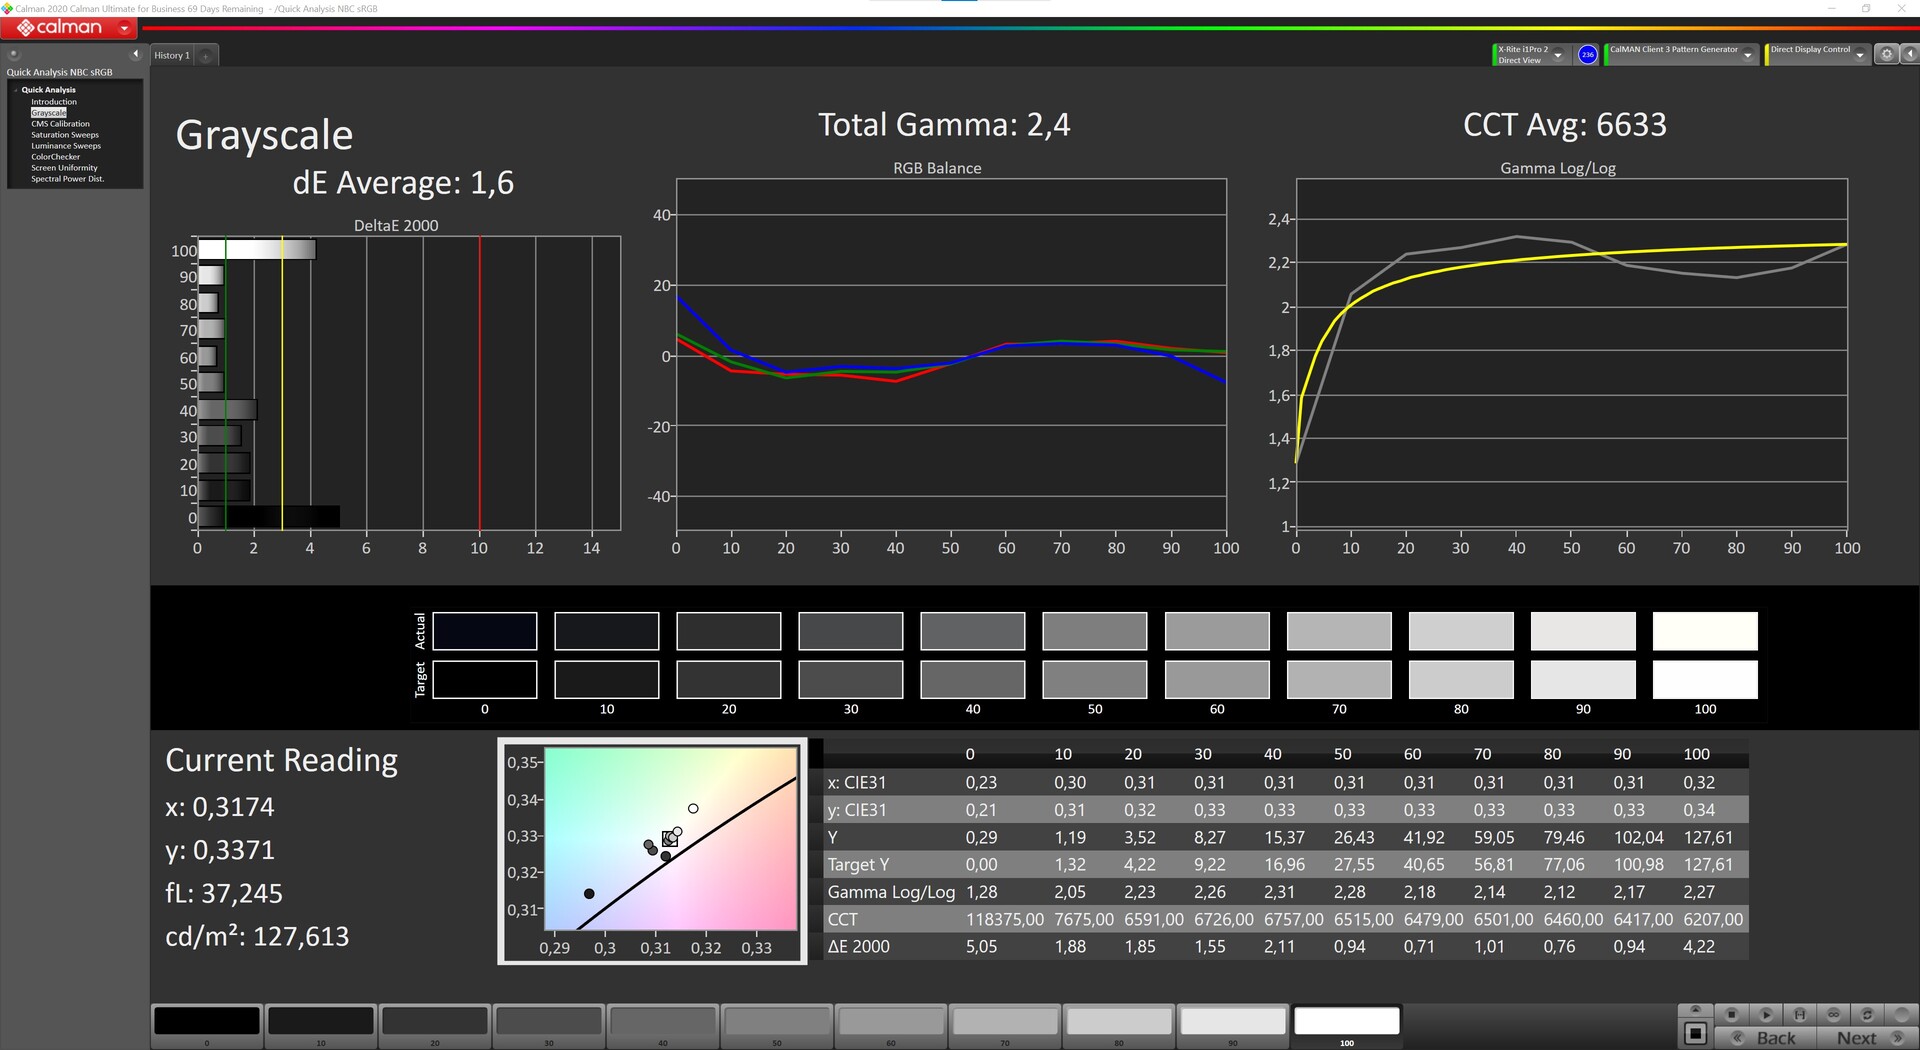
ΔE Greyscale Calman: 7.5 | ∀{0.09-98 Ø4.97}
84.5% AdobeRGB 1998 (Argyll 3D)
99.9% sRGB (Argyll 3D)
94.2% Display P3 (Argyll 3D)
Gamma: 2.28
CCT: 7220 K
| Asus Zephyrus G14 GA401QEC TL140BDXP01-0, IPS, 2560x1440, 14" | Asus Zephyrus G14 GA401QM LM140LF-1F02, IPS, 1920x1080, 14" | Asus Zephyrus G14 GA401IV CEC PA LM140LF-1F01, IPS, 1920x1080, 14" | Razer Blade 14 Ryzen 9 RTX 3070 TL140BDXP02-2, IPS, 2560x1440, 14" | Schenker XMG Focus 15 LG Philips LP156WFG-SPB5, IPS, 1920x1080, 15.6" | MSI Katana GF66 11UG-220 AU Optronics B156HAN08.0, IPS, 1920x1080, 15.6" | Acer Nitro 5 AN515-45-R1JH BOE BOE09B8, IPS, 2560x1440, 15.6" | |
|---|---|---|---|---|---|---|---|
| Display | -19% | -19% | 1% | -19% | -20% | -18% | |
| Display P3 Coverage (%) | 94.2 | 68.1 -28% | 66.5 -29% | 97.2 3% | 64.6 -31% | 65.4 -31% | 66.2 -30% |
| sRGB Coverage (%) | 99.9 | 92.4 -8% | 92 -8% | 99.9 0% | 95.3 -5% | 91.3 -9% | 96.3 -4% |
| AdobeRGB 1998 Coverage (%) | 84.5 | 67.7 -20% | 67.2 -20% | 85.4 1% | 66.5 -21% | 66.7 -21% | 67.1 -21% |
| Response Times | -216% | -299% | -31% | -19% | -12% | -2% | |
| Response Time Grey 50% / Grey 80% * (ms) | 20 ? | 34.4 ? -72% | 43.6 ? -118% | 16.4 ? 18% | 18 ? 10% | 7.4 ? 63% | 14 ? 30% |
| Response Time Black / White * (ms) | 6 ? | 27.6 ? -360% | 34.8 ? -480% | 10.8 ? -80% | 8.8 ? -47% | 11.2 ? -87% | 8 ? -33% |
| PWM Frequency (Hz) | |||||||
| Screen | 6% | 26% | 24% | 33% | 15% | -0% | |
| Brightness middle (cd/m²) | 333 | 329.4 -1% | 322.2 -3% | 331.1 -1% | 418 26% | 307 -8% | 349 5% |
| Brightness (cd/m²) | 317 | 311 -2% | 302 -5% | 318 0% | 376 19% | 321 1% | 304 -4% |
| Brightness Distribution (%) | 89 | 90 1% | 87 -2% | 91 2% | 83 -7% | 83 -7% | 79 -11% |
| Black Level * (cd/m²) | 0.36 | 0.39 -8% | 0.26 28% | 0.36 -0% | 0.41 -14% | 0.27 25% | 0.535 -49% |
| Contrast (:1) | 925 | 845 -9% | 1239 34% | 920 -1% | 1020 10% | 1137 23% | 652 -30% |
| Colorchecker dE 2000 * | 5.58 | 4.01 28% | 2.43 56% | 2.25 60% | 1.67 70% | 4.67 16% | 3.11 44% |
| Colorchecker dE 2000 max. * | 10.62 | 8.21 23% | 5.07 52% | 4.62 56% | 3.88 63% | 7.53 29% | 9.57 10% |
| Colorchecker dE 2000 calibrated * | 2.88 | 3.89 -35% | 2.29 20% | 0.98 66% | 2.41 16% | ||
| Greyscale dE 2000 * | 7.5 | 3.2 57% | 3.3 56% | 1.7 77% | 2.9 61% | 4.5 40% | 5 33% |
| Gamma | 2.28 96% | 2.2 100% | 2.22 99% | 2.3 96% | 2.26 97% | 2.276 97% | 2.36 93% |
| CCT | 7220 90% | 7070 92% | 6902 94% | 6751 96% | 6209 105% | 6824 95% | 6976 93% |
| Color Space (Percent of AdobeRGB 1998) (%) | 60 | ||||||
| Color Space (Percent of sRGB) (%) | 91.9 | ||||||
| Total Average (Program / Settings) | -76% /
-31% | -97% /
-30% | -2% /
10% | -2% /
14% | -6% /
4% | -7% /
-5% |
* ... smaller is better
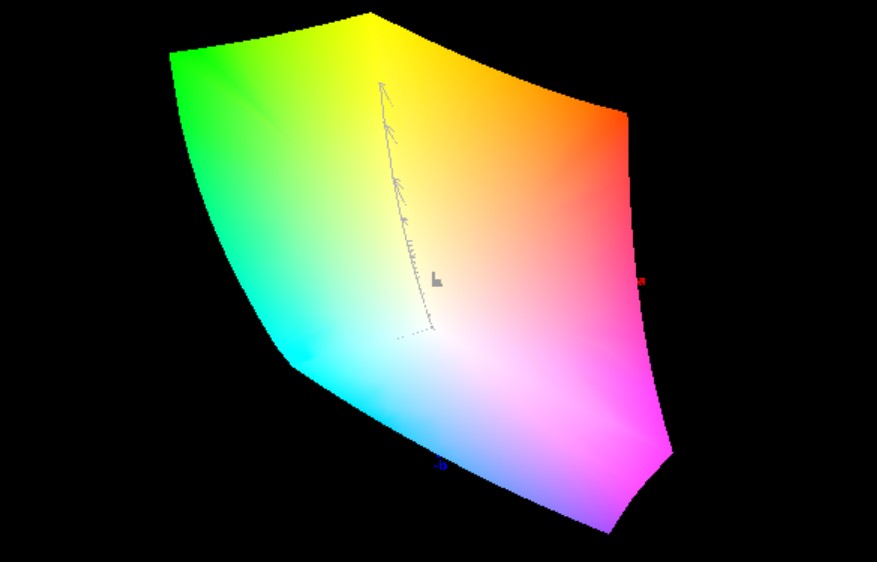
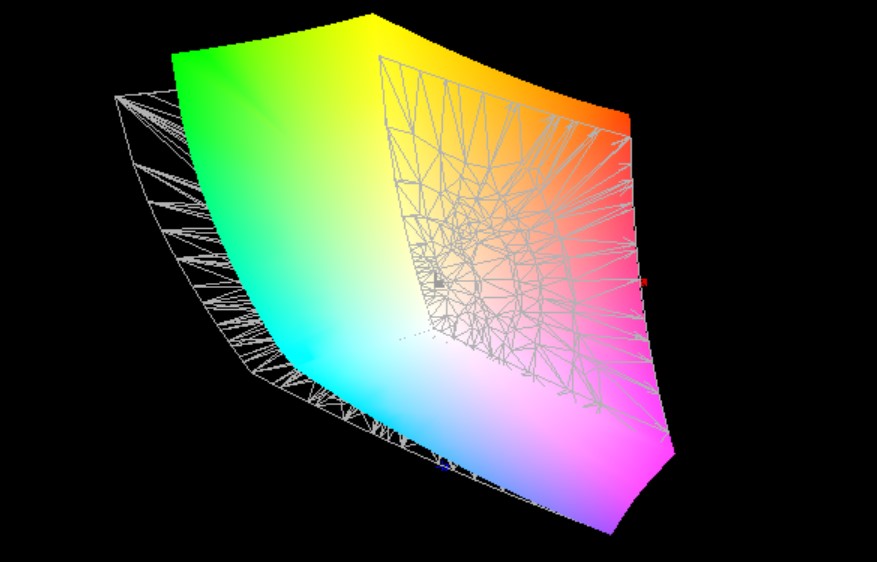
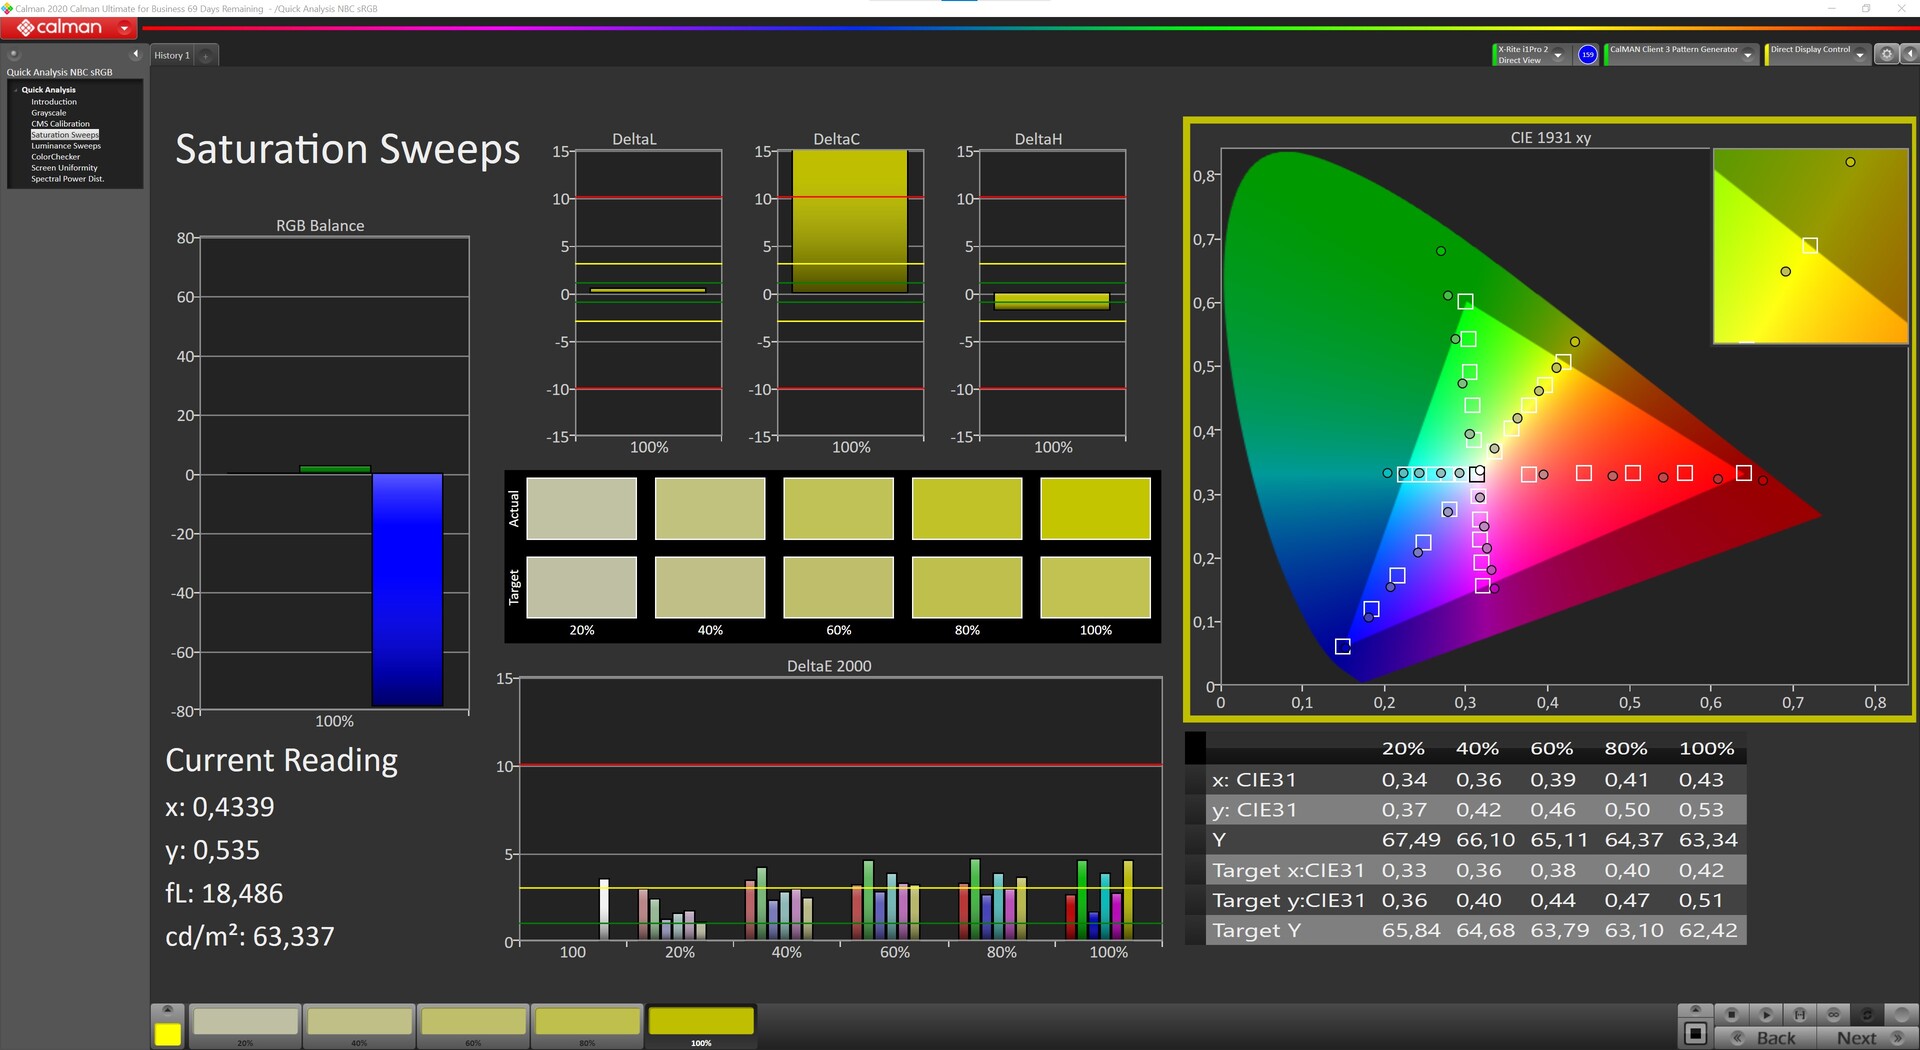
Out of the box, the DeltaE 2000 color deviations measured are clearly too high compared to the sRGB color space. This suggests that Asus is shipping the Zephyrus G14 with an uncalibrated display. Following our calibration, the DeltaE 2000 color deviations were significantly reduced both in grayscales as well as in colors. Our review sample scores well in terms of color-space coverage, meaning that it can be used for professional purposes without any issues.
Display Response Times
| ↔ Response Time Black to White | ||
|---|---|---|
| 6 ms ... rise ↗ and fall ↘ combined | ↗ 2 ms rise | 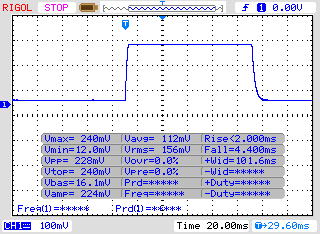 |
| ↘ 4 ms fall | ||
| The screen shows very fast response rates in our tests and should be very well suited for fast-paced gaming. In comparison, all tested devices range from 0.1 (minimum) to 240 (maximum) ms. » 18 % of all devices are better. This means that the measured response time is better than the average of all tested devices (19.9 ms). | ||
| ↔ Response Time 50% Grey to 80% Grey | ||
| 20 ms ... rise ↗ and fall ↘ combined | ↗ 11 ms rise | 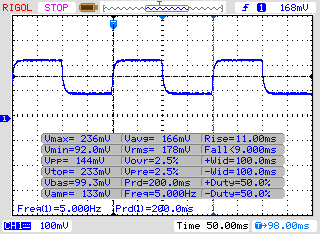 |
| ↘ 9 ms fall | ||
| The screen shows good response rates in our tests, but may be too slow for competitive gamers. In comparison, all tested devices range from 0.165 (minimum) to 636 (maximum) ms. » 33 % of all devices are better. This means that the measured response time is better than the average of all tested devices (31.1 ms). | ||
Screen Flickering / PWM (Pulse-Width Modulation)
| Screen flickering / PWM not detected | 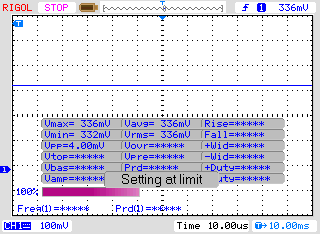 | ||
In comparison: 52 % of all tested devices do not use PWM to dim the display. If PWM was detected, an average of 7798 (minimum: 5 - maximum: 343500) Hz was measured. | |||
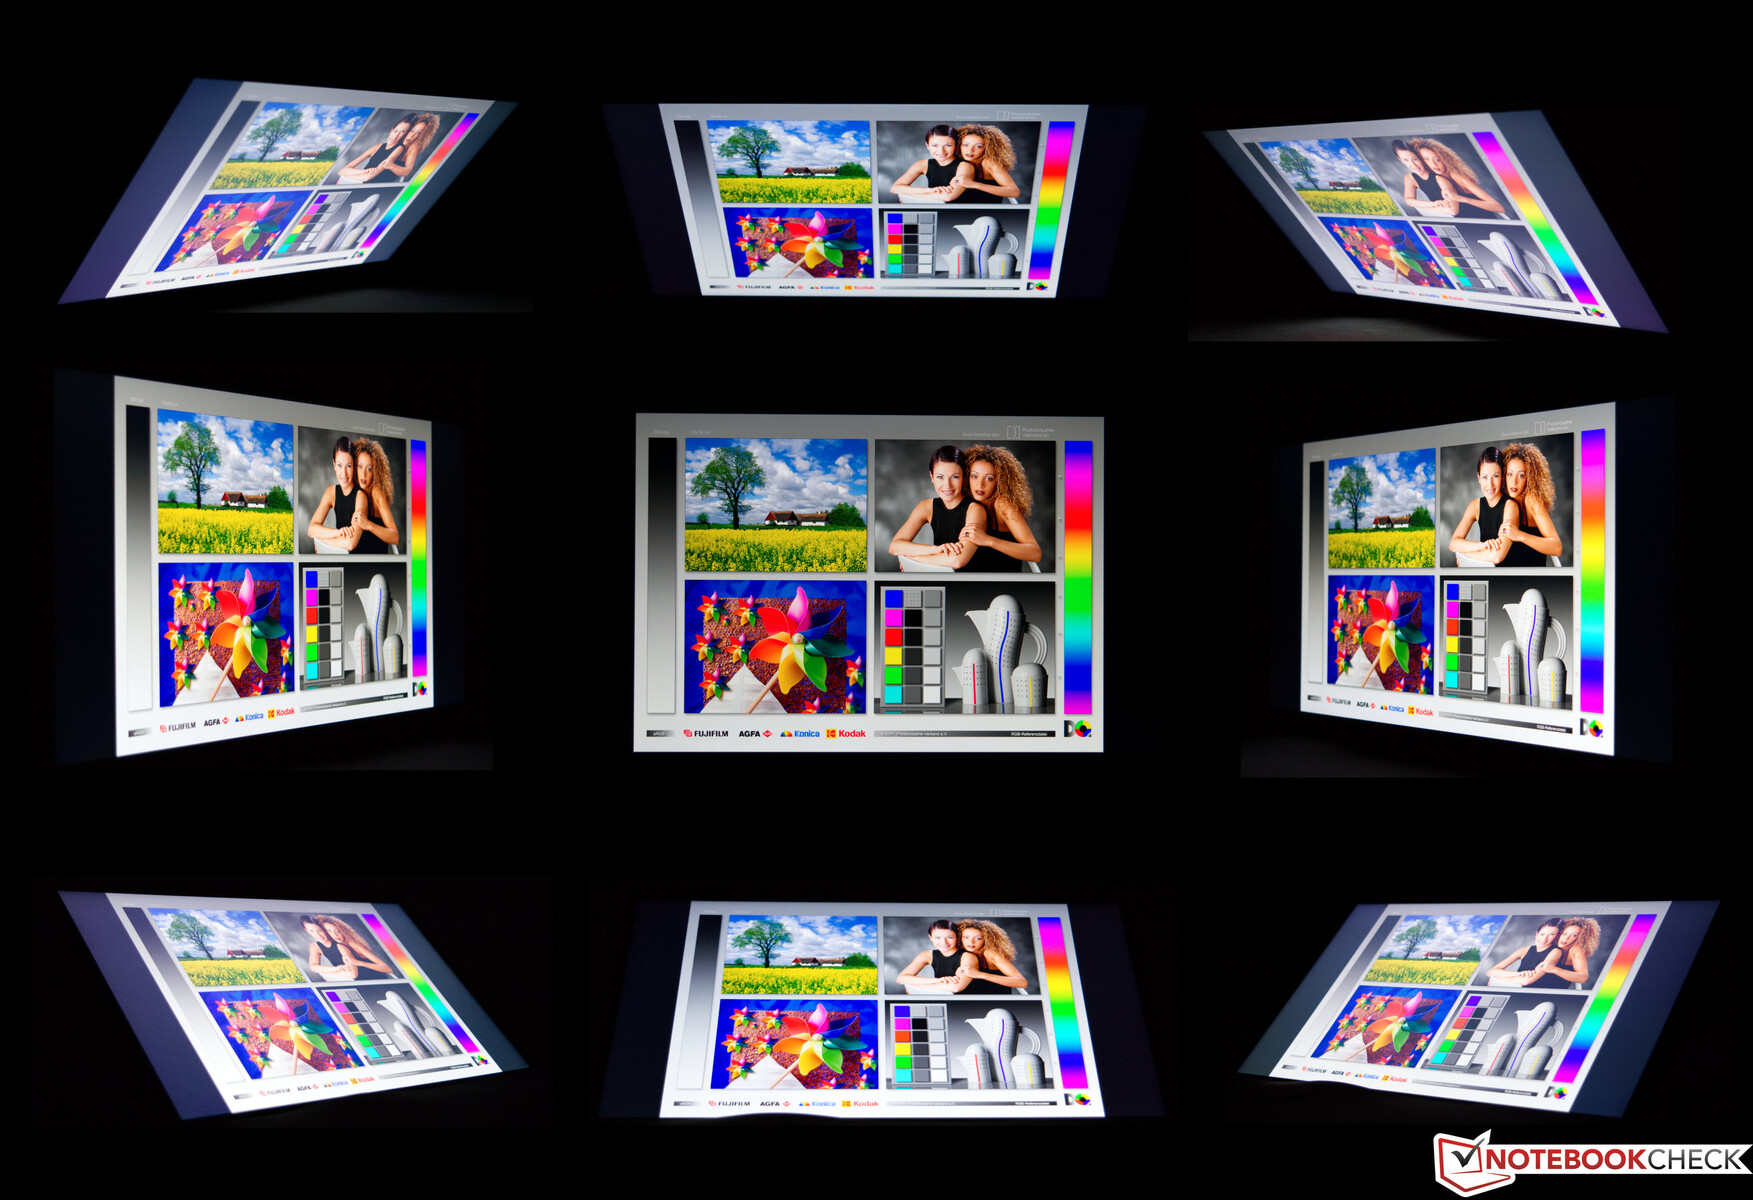
As expected, the Asus Zephyrus G14 GA401Q performs well in the viewing-angle test. This is a typical IPS panel with its strengths and weaknesses. The latter refer to the four corner images, which show slight fogging. Users who want to work with the Zephyrus G14 outdoors should preferably choose a place in the shade. In direct sunlight, the display reaches its limits due to insufficient brightness.
Performance - Ryzen 9 meets RTX 3050 Ti
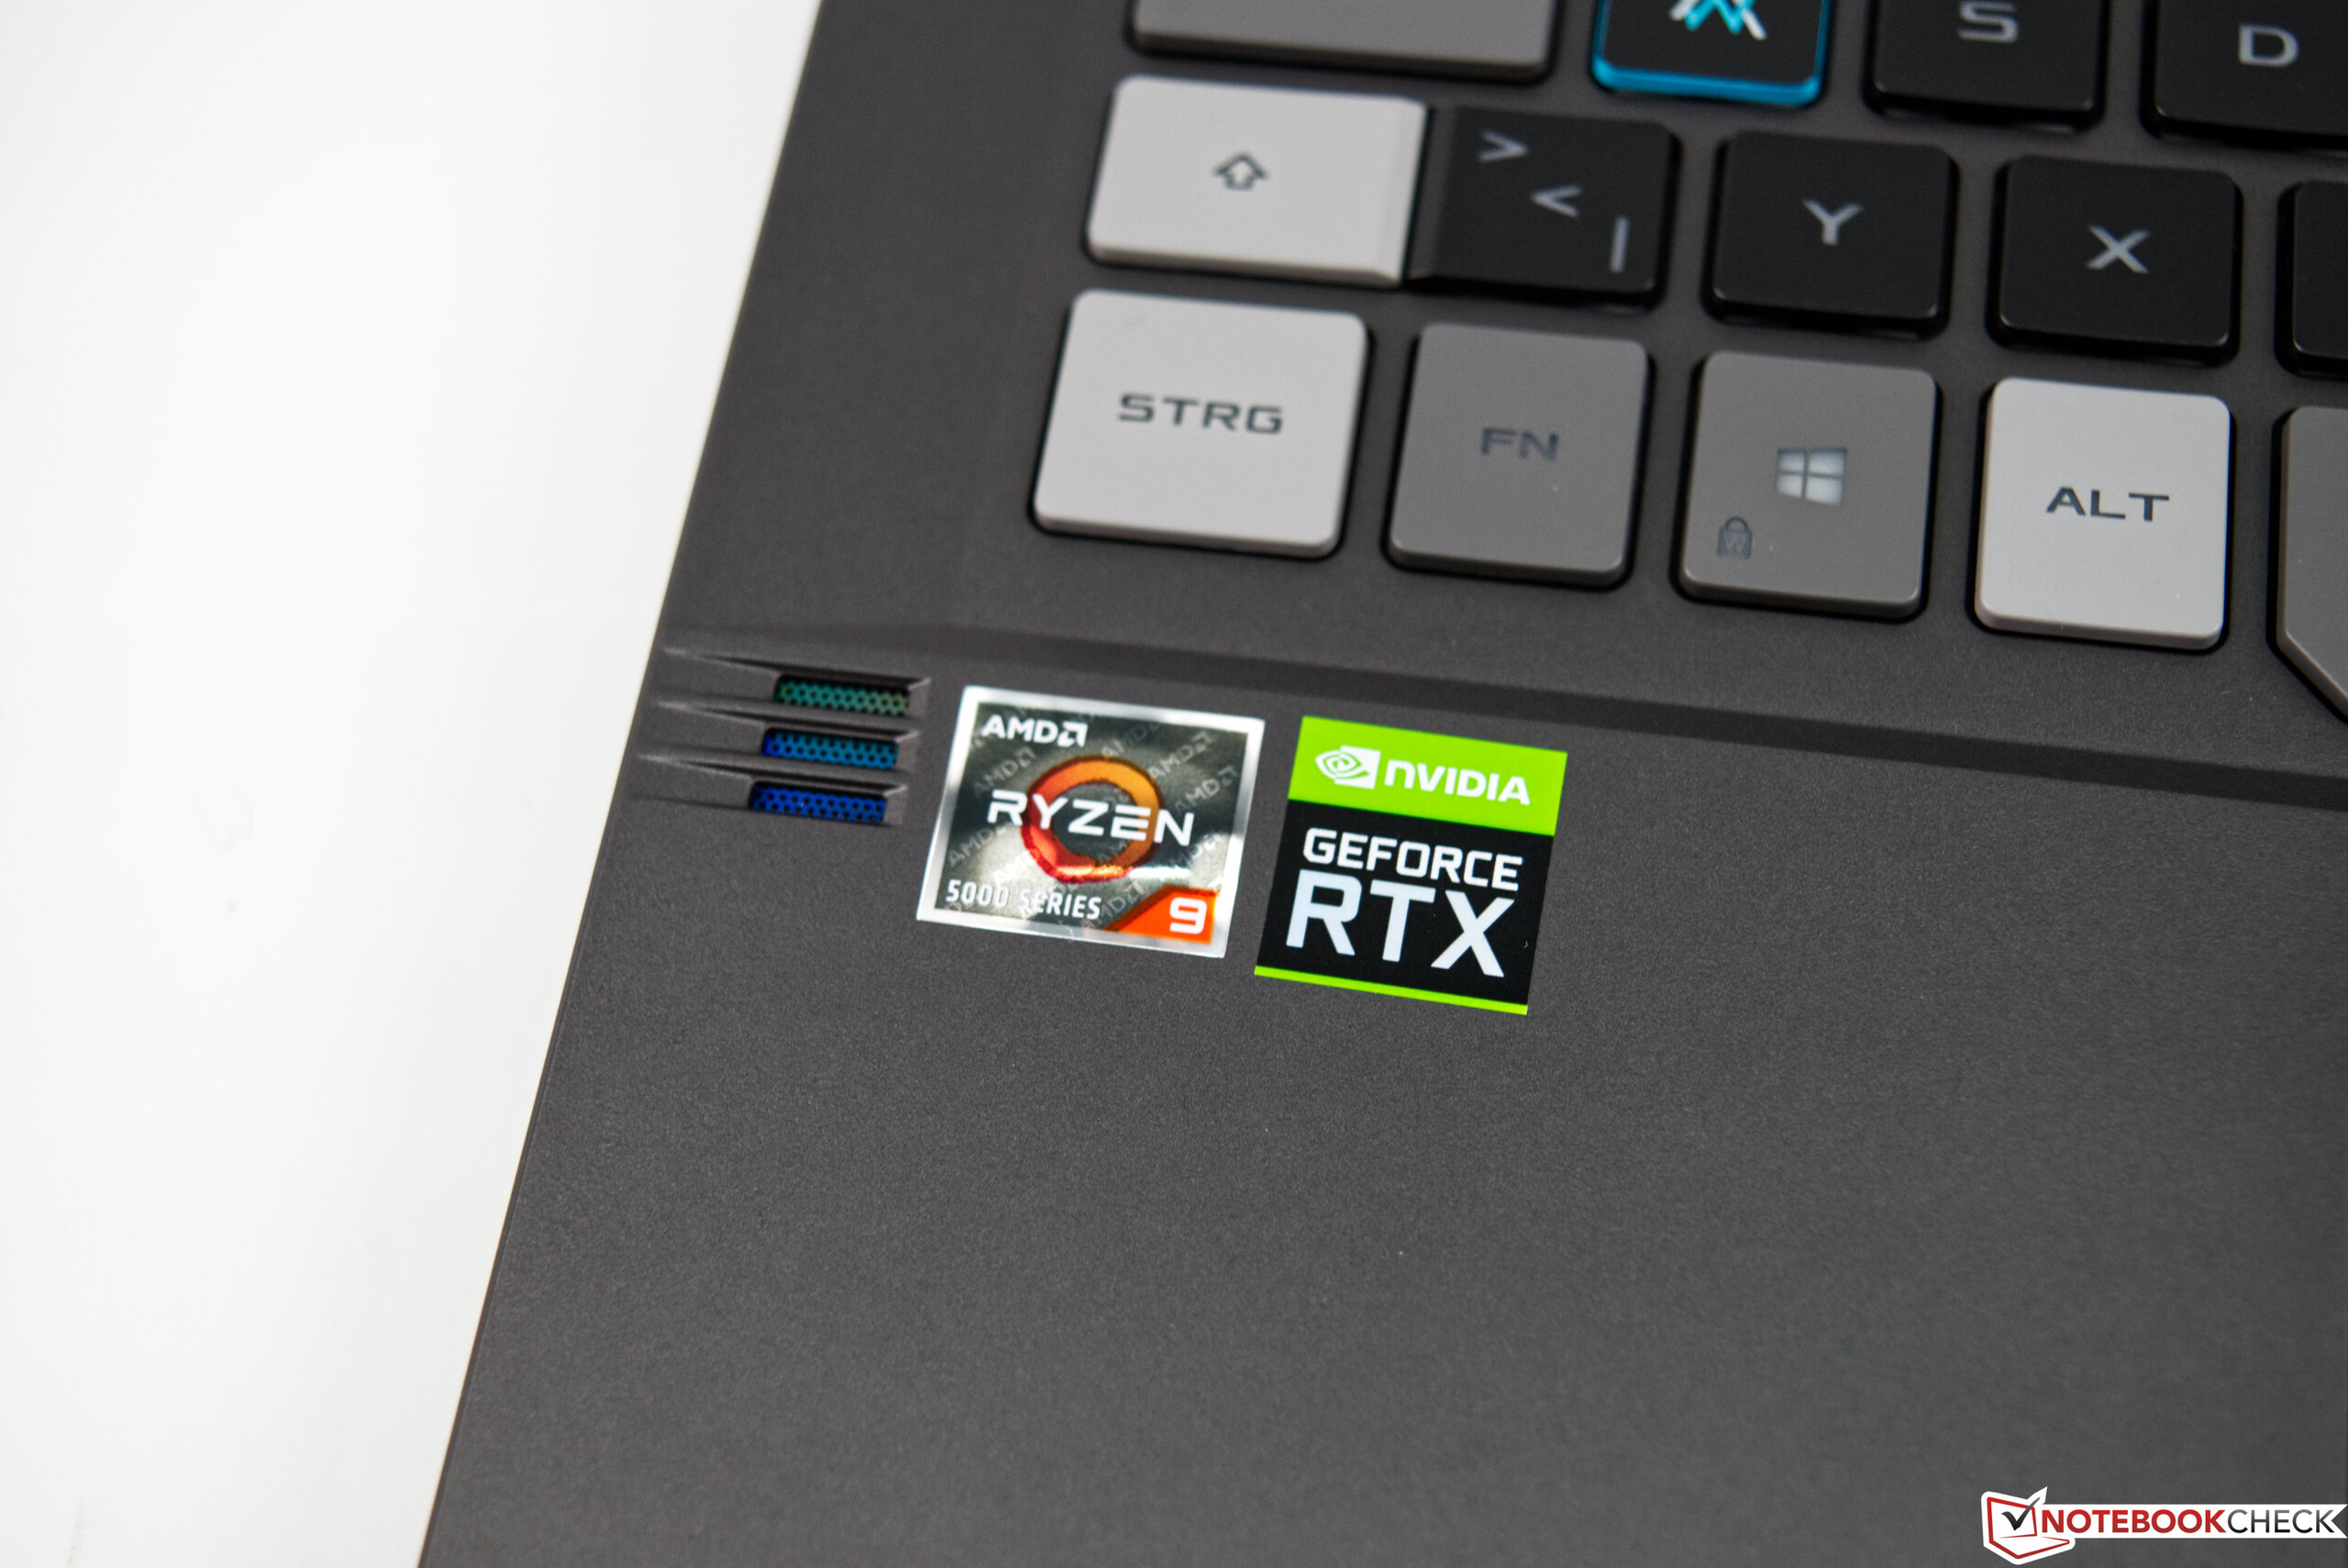
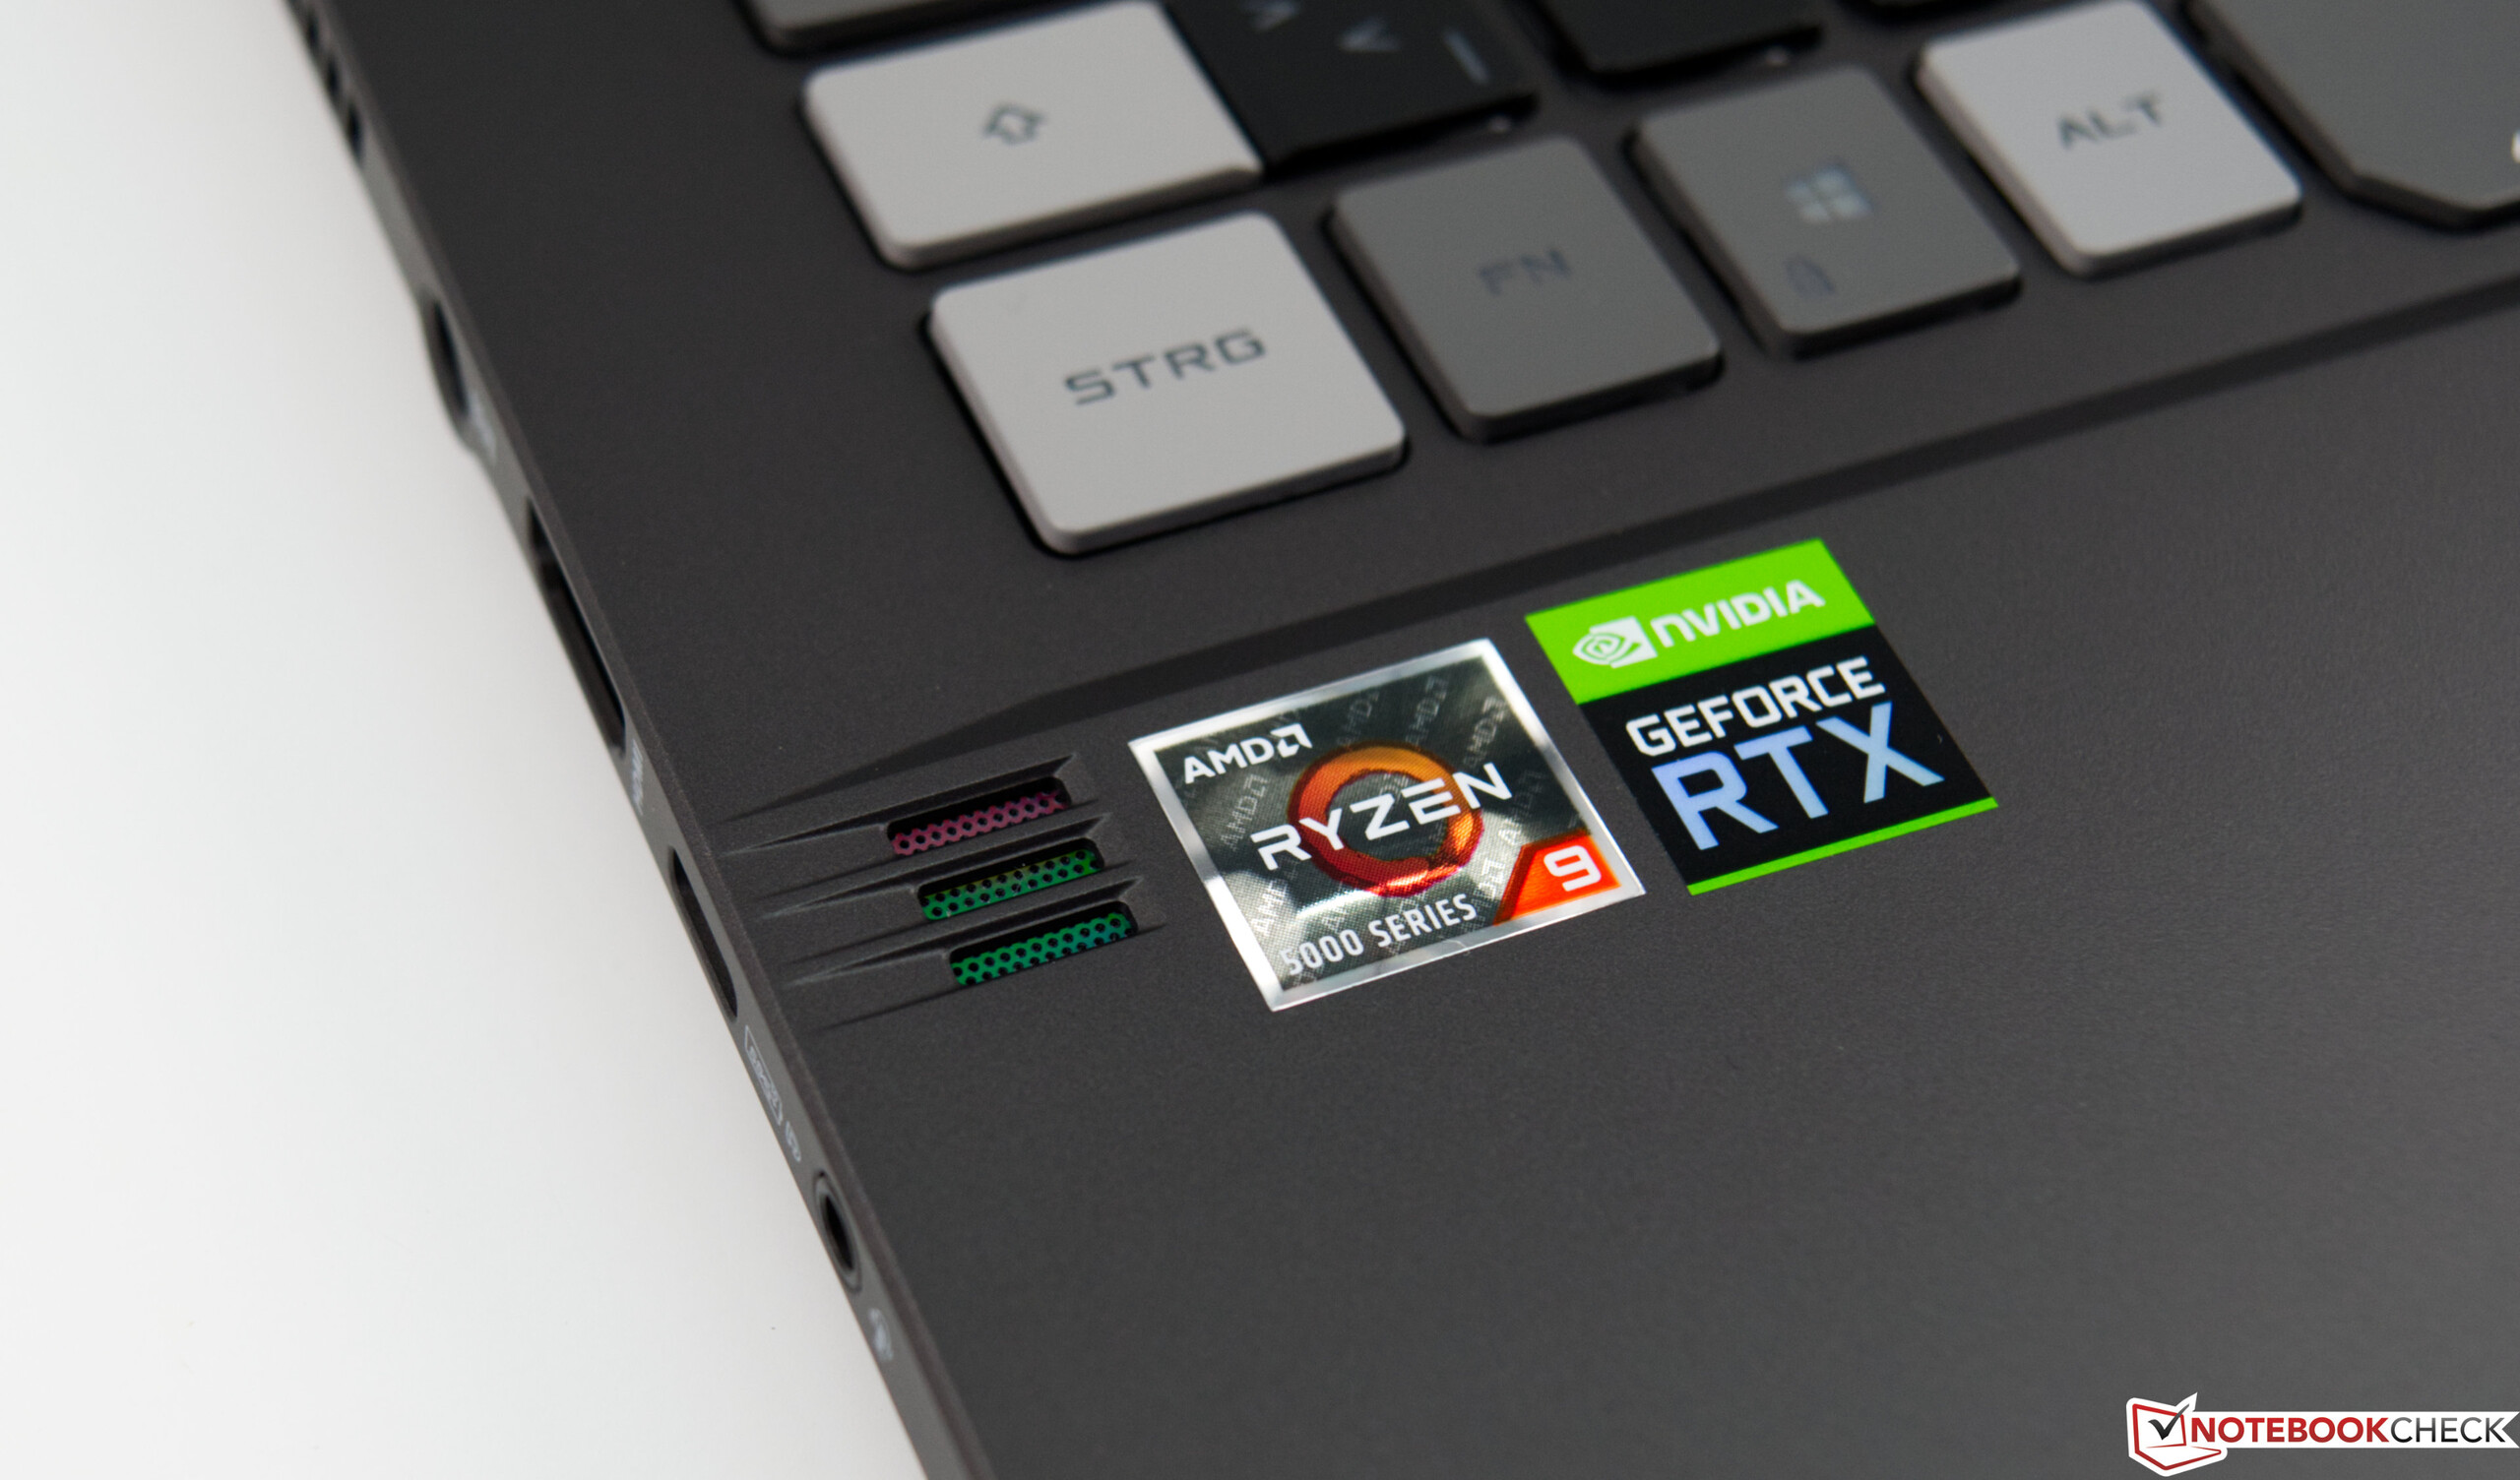
A gaming device needs a good deal of performance. Asus has opted for AMD's latest processors with the Ryzen 9 5900HS, which is the right way to go. The octa-core CPU delivers a solid multi-core performance, and the single-core performance has also been increased significantly with Zen 3. The Nvidia GeForce RTX 3050 Ti is used as the graphics card in our review sample. The overall package is rounded off well with 16 GB of RAM and a 1 TB SSD.
Processor
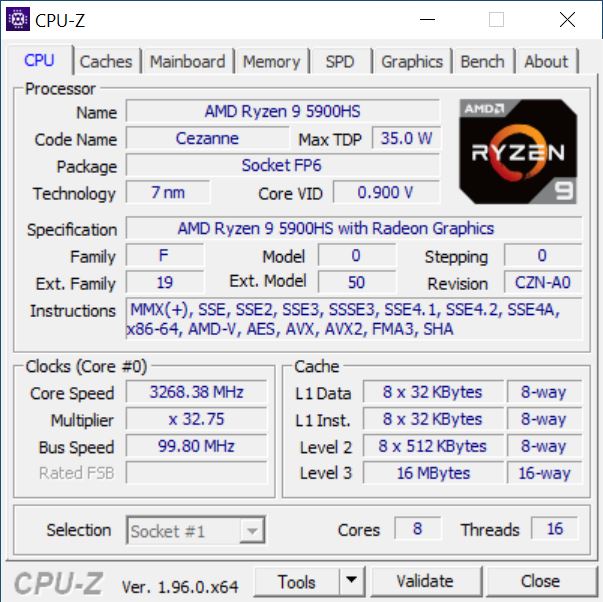
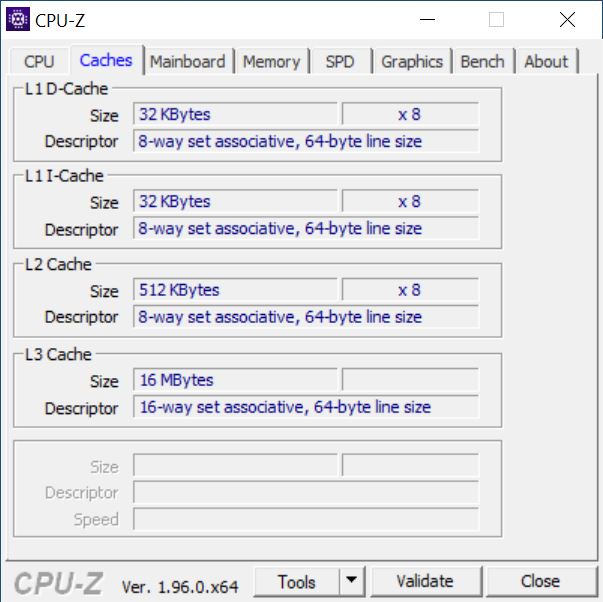
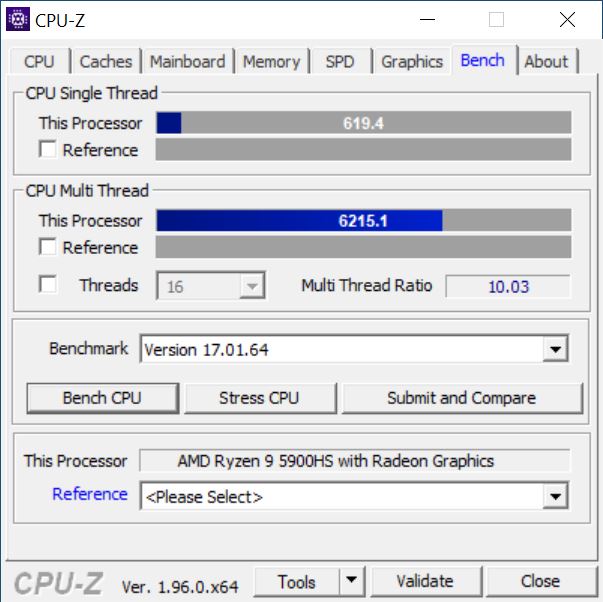
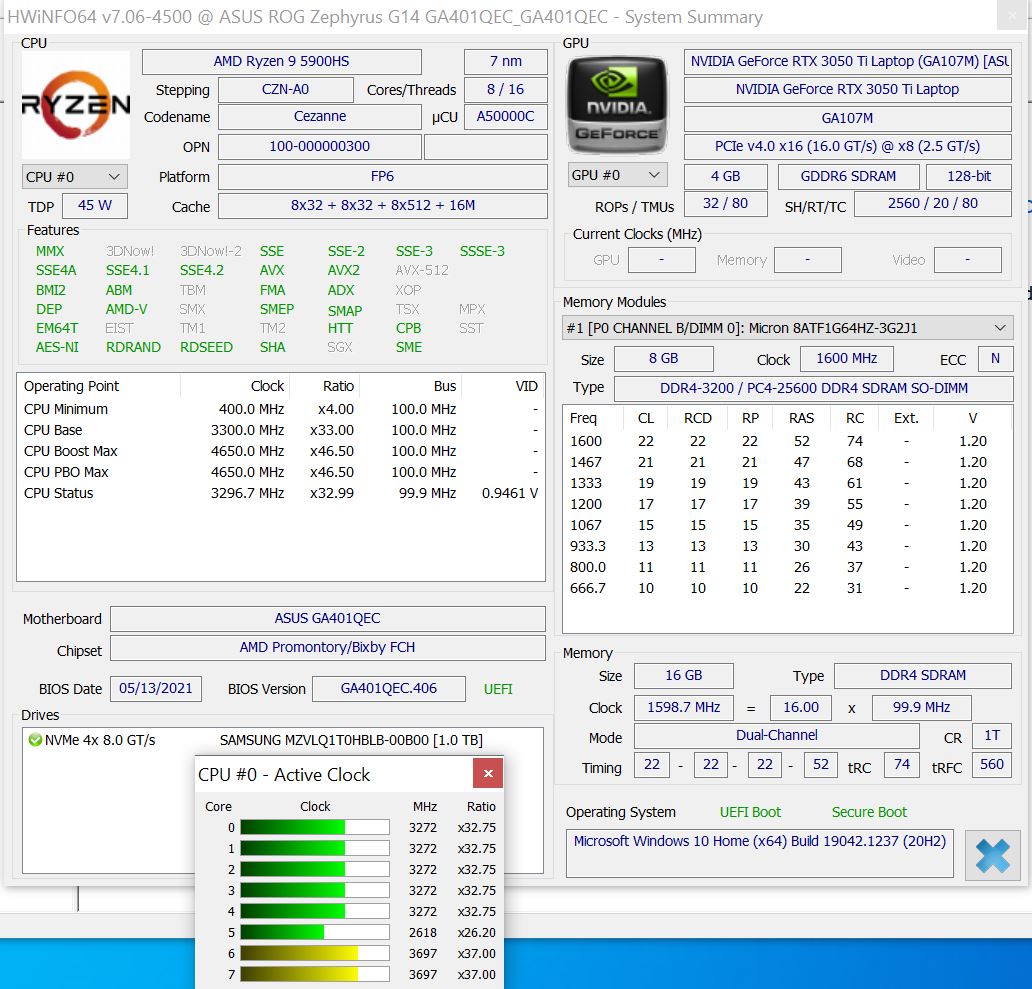
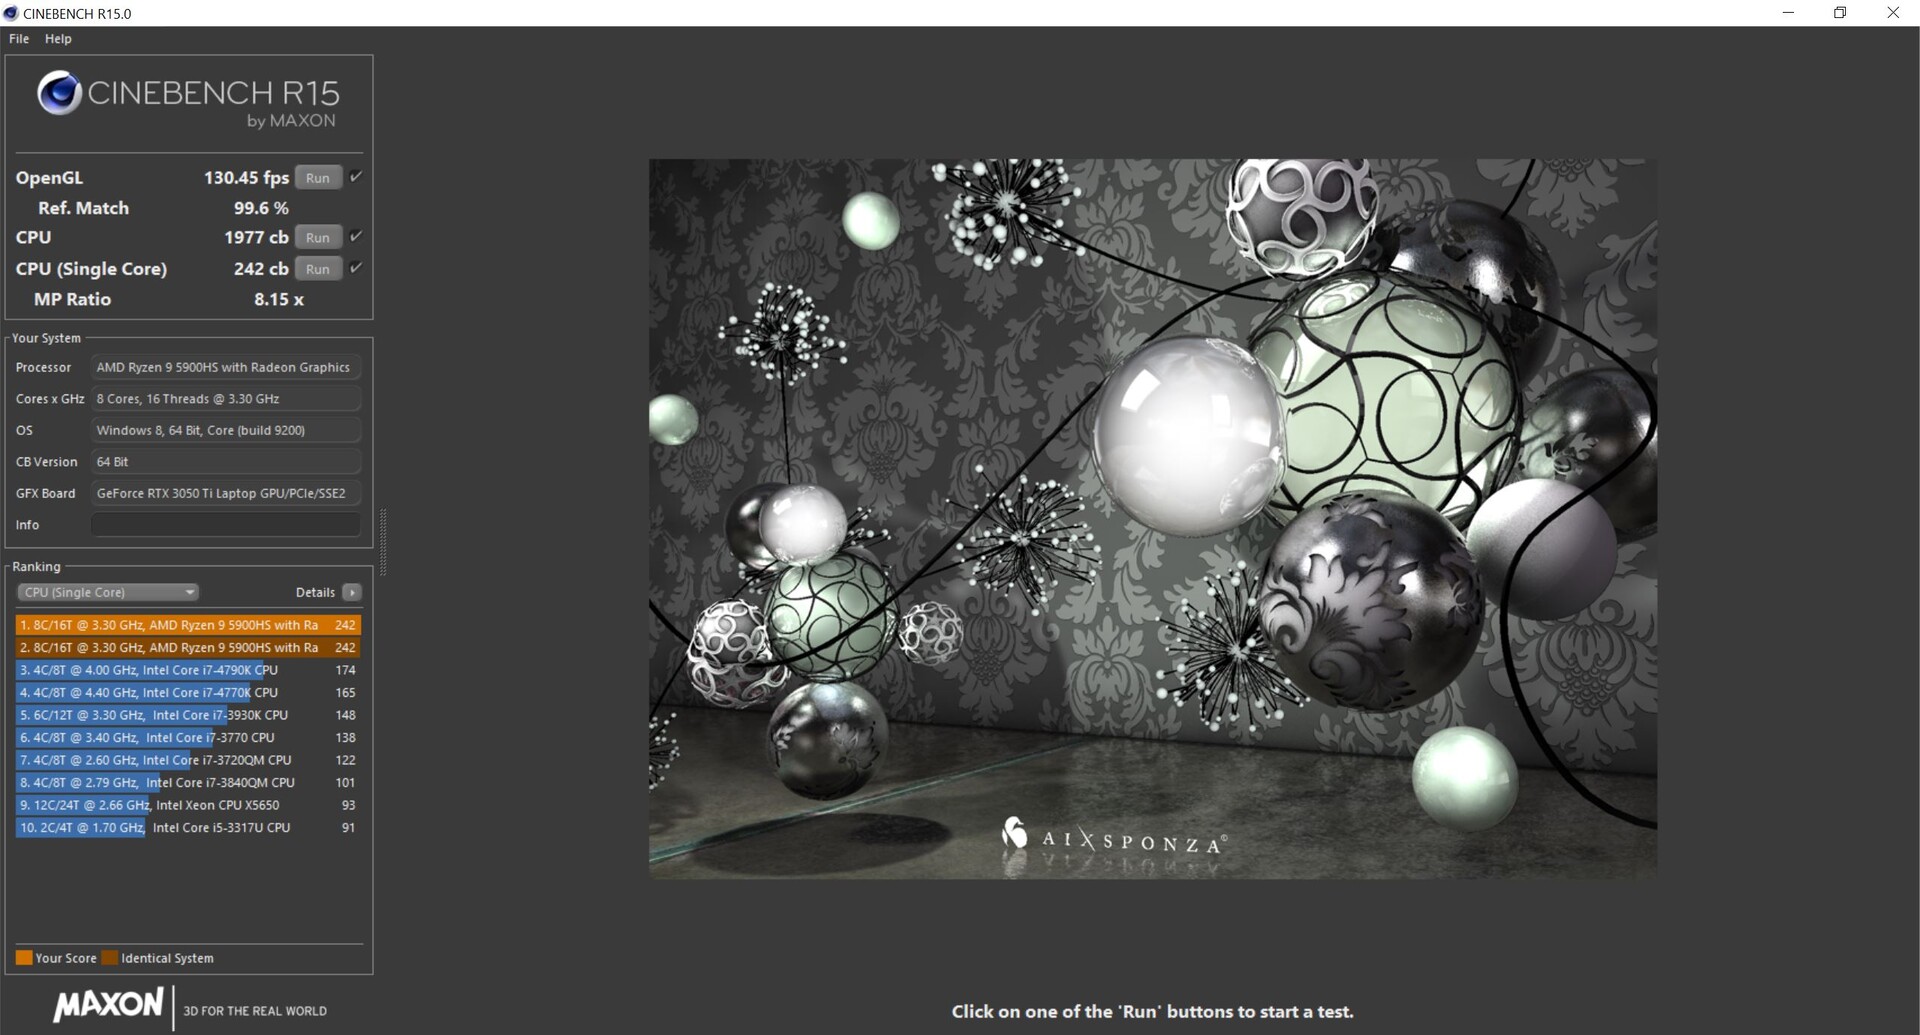
The Asus gaming laptop is powered by the AMD Ryzen 9 5900HS. With its eight cores and 16 threads, the device is also well-equipped for the future. The base clock speed is 3.3 GHz, and it can be increased up to 4.6 GHz depending on the workload. Therefore, the 35-watt SoC can consume up to 64 watts for a short time when the circumstances allow it. In comparison, the AMD Ryzen 9 5900HS in our review unit shows a very good performance in both the single-core tests as well as the multithread benchmarks.
The performance of the AMD Ryzen 9 5900HS is very stable in the Cinebench R15 Multi loop. The result settles at an average of 2,116 points.
For more comparisons and benchmarks, please refer to our CPU Benchmarks article.
Cinebench R15 Multi endurance test
Cinebench R20: CPU (Multi Core) | CPU (Single Core)
Cinebench R15: CPU Multi 64Bit | CPU Single 64Bit
Blender: v2.79 BMW27 CPU
7-Zip 18.03: 7z b 4 | 7z b 4 -mmt1
Geekbench 5.5: Multi-Core | Single-Core
HWBOT x265 Benchmark v2.2: 4k Preset
LibreOffice : 20 Documents To PDF
R Benchmark 2.5: Overall mean
| Cinebench R23 / Multi Core | |
| Average of class Gaming (10488 - 40970, n=113, last 2 years) | |
| Asus Zephyrus G14 GA401QEC | |
| Asus Zephyrus G14 GA401QM | |
| Razer Blade 14 Ryzen 9 RTX 3070 | |
| Average AMD Ryzen 9 5900HS (11426 - 13214, n=4) | |
| Acer Nitro 5 AN515-45-R1JH | |
| Schenker XMG Focus 15 | |
| MSI Katana GF66 11UG-220 | |
| Cinebench R23 / Single Core | |
| Average of class Gaming (1166 - 2356, n=113, last 2 years) | |
| MSI Katana GF66 11UG-220 | |
| Asus Zephyrus G14 GA401QEC | |
| Average AMD Ryzen 9 5900HS (1457 - 1488, n=4) | |
| Asus Zephyrus G14 GA401QM | |
| Acer Nitro 5 AN515-45-R1JH | |
| Schenker XMG Focus 15 | |
| Razer Blade 14 Ryzen 9 RTX 3070 | |
| Cinebench R20 / CPU (Multi Core) | |
| Average of class Gaming (4029 - 16108, n=112, last 2 years) | |
| Asus Zephyrus G14 GA401QEC | |
| Asus Zephyrus G14 GA401QM | |
| Razer Blade 14 Ryzen 9 RTX 3070 | |
| Average AMD Ryzen 9 5900HS (4414 - 5167, n=4) | |
| Acer Nitro 5 AN515-45-R1JH | |
| Schenker XMG Focus 15 | |
| Asus Zephyrus G14 GA401IV | |
| MSI Katana GF66 11UG-220 | |
| Cinebench R20 / CPU (Single Core) | |
| Average of class Gaming (442 - 895, n=112, last 2 years) | |
| Asus Zephyrus G14 GA401QEC | |
| MSI Katana GF66 11UG-220 | |
| Average AMD Ryzen 9 5900HS (560 - 584, n=4) | |
| Asus Zephyrus G14 GA401QM | |
| Acer Nitro 5 AN515-45-R1JH | |
| Schenker XMG Focus 15 | |
| Asus Zephyrus G14 GA401IV | |
| Razer Blade 14 Ryzen 9 RTX 3070 | |
| Cinebench R15 / CPU Multi 64Bit | |
| Average of class Gaming (1578 - 6271, n=113, last 2 years) | |
| Asus Zephyrus G14 GA401QEC | |
| MSI Katana GF66 11UG-220 | |
| MSI Katana GF66 11UG-220 | |
| Asus Zephyrus G14 GA401QM | |
| Razer Blade 14 Ryzen 9 RTX 3070 | |
| Average AMD Ryzen 9 5900HS (1927 - 2180, n=5) | |
| Acer Nitro 5 AN515-45-R1JH | |
| Asus Zephyrus G14 GA401IV | |
| Schenker XMG Focus 15 | |
| Cinebench R15 / CPU Single 64Bit | |
| Average of class Gaming (188.8 - 343, n=112, last 2 years) | |
| Asus Zephyrus G14 GA401QEC | |
| Asus Zephyrus G14 GA401QM | |
| Acer Nitro 5 AN515-45-R1JH | |
| Average AMD Ryzen 9 5900HS (211 - 240, n=4) | |
| MSI Katana GF66 11UG-220 | |
| MSI Katana GF66 11UG-220 | |
| Schenker XMG Focus 15 | |
| Razer Blade 14 Ryzen 9 RTX 3070 | |
| Asus Zephyrus G14 GA401IV | |
| Blender / v2.79 BMW27 CPU | |
| MSI Katana GF66 11UG-220 | |
| Asus Zephyrus G14 GA401IV | |
| Schenker XMG Focus 15 | |
| Acer Nitro 5 AN515-45-R1JH | |
| Average AMD Ryzen 9 5900HS (231 - 305, n=4) | |
| Razer Blade 14 Ryzen 9 RTX 3070 | |
| Asus Zephyrus G14 GA401QM | |
| Asus Zephyrus G14 GA401QEC | |
| Average of class Gaming (80 - 330, n=110, last 2 years) | |
| 7-Zip 18.03 / 7z b 4 | |
| Average of class Gaming (33491 - 148086, n=111, last 2 years) | |
| Asus Zephyrus G14 GA401QEC | |
| Asus Zephyrus G14 GA401QM | |
| Average AMD Ryzen 9 5900HS (47553 - 59680, n=4) | |
| Acer Nitro 5 AN515-45-R1JH | |
| Razer Blade 14 Ryzen 9 RTX 3070 | |
| Asus Zephyrus G14 GA401IV | |
| Schenker XMG Focus 15 | |
| MSI Katana GF66 11UG-220 | |
| 7-Zip 18.03 / 7z b 4 -mmt1 | |
| Average of class Gaming (4199 - 7436, n=111, last 2 years) | |
| Asus Zephyrus G14 GA401QEC | |
| Average AMD Ryzen 9 5900HS (5540 - 5804, n=4) | |
| Asus Zephyrus G14 GA401QM | |
| MSI Katana GF66 11UG-220 | |
| Acer Nitro 5 AN515-45-R1JH | |
| Schenker XMG Focus 15 | |
| Razer Blade 14 Ryzen 9 RTX 3070 | |
| Asus Zephyrus G14 GA401IV | |
| Geekbench 5.5 / Multi-Core | |
| Average of class Gaming (6460 - 27010, n=111, last 2 years) | |
| Schenker XMG Focus 15 | |
| Average AMD Ryzen 9 5900HS (7767 - 7910, n=3) | |
| Asus Zephyrus G14 GA401QEC | |
| Asus Zephyrus G14 GA401IV | |
| Acer Nitro 5 AN515-45-R1JH | |
| MSI Katana GF66 11UG-220 | |
| Geekbench 5.5 / Single-Core | |
| Average of class Gaming (986 - 2474, n=111, last 2 years) | |
| MSI Katana GF66 11UG-220 | |
| Asus Zephyrus G14 GA401QEC | |
| Average AMD Ryzen 9 5900HS (1410 - 1547, n=3) | |
| Schenker XMG Focus 15 | |
| Acer Nitro 5 AN515-45-R1JH | |
| Asus Zephyrus G14 GA401IV | |
| HWBOT x265 Benchmark v2.2 / 4k Preset | |
| Average of class Gaming (11.5 - 44.3, n=111, last 2 years) | |
| Asus Zephyrus G14 GA401QEC | |
| Asus Zephyrus G14 GA401QM | |
| Razer Blade 14 Ryzen 9 RTX 3070 | |
| Acer Nitro 5 AN515-45-R1JH | |
| Average AMD Ryzen 9 5900HS (12.7 - 15.4, n=4) | |
| Schenker XMG Focus 15 | |
| Asus Zephyrus G14 GA401IV | |
| MSI Katana GF66 11UG-220 | |
| LibreOffice / 20 Documents To PDF | |
| Acer Nitro 5 AN515-45-R1JH | |
| Razer Blade 14 Ryzen 9 RTX 3070 | |
| Asus Zephyrus G14 GA401QEC | |
| Average AMD Ryzen 9 5900HS (50.7 - 54.9, n=4) | |
| Asus Zephyrus G14 GA401QM | |
| MSI Katana GF66 11UG-220 | |
| Average of class Gaming (19 - 88.8, n=111, last 2 years) | |
| Schenker XMG Focus 15 | |
| R Benchmark 2.5 / Overall mean | |
| Schenker XMG Focus 15 | |
| Razer Blade 14 Ryzen 9 RTX 3070 | |
| MSI Katana GF66 11UG-220 | |
| Acer Nitro 5 AN515-45-R1JH | |
| Average AMD Ryzen 9 5900HS (0.51 - 0.538, n=4) | |
| Asus Zephyrus G14 GA401QEC | |
| Asus Zephyrus G14 GA401QM | |
| Average of class Gaming (0.3439 - 0.759, n=112, last 2 years) | |
* ... smaller is better
System performance
The PCMark 10 results place our Asus laptop in the midfield, although significantly better rankings were achieved in individual categories. The gap to the Razer Blade 14 is relatively small at only 5% and consequently not noticeable in everyday use.
| PCMark 10 / Score | |
| Average of class Gaming (5828 - 11574, n=96, last 2 years) | |
| Razer Blade 14 Ryzen 9 RTX 3070 | |
| Asus Zephyrus G14 GA401QM | |
| Acer Nitro 5 AN515-45-R1JH | |
| MSI Katana GF66 11UG-220 | |
| Asus Zephyrus G14 GA401QEC | |
| Average AMD Ryzen 9 5900HS, NVIDIA GeForce RTX 3050 Ti Laptop GPU (n=1) | |
| Schenker XMG Focus 15 | |
| Asus Zephyrus G14 GA401IV | |
| PCMark 10 / Essentials | |
| Average of class Gaming (8810 - 12600, n=100, last 2 years) | |
| Asus Zephyrus G14 GA401QM | |
| Razer Blade 14 Ryzen 9 RTX 3070 | |
| Schenker XMG Focus 15 | |
| Asus Zephyrus G14 GA401QEC | |
| Average AMD Ryzen 9 5900HS, NVIDIA GeForce RTX 3050 Ti Laptop GPU (n=1) | |
| Acer Nitro 5 AN515-45-R1JH | |
| Asus Zephyrus G14 GA401IV | |
| MSI Katana GF66 11UG-220 | |
| PCMark 10 / Productivity | |
| Average of class Gaming (6845 - 18766, n=98, last 2 years) | |
| Asus Zephyrus G14 GA401QEC | |
| Average AMD Ryzen 9 5900HS, NVIDIA GeForce RTX 3050 Ti Laptop GPU (n=1) | |
| Asus Zephyrus G14 GA401QM | |
| Razer Blade 14 Ryzen 9 RTX 3070 | |
| Acer Nitro 5 AN515-45-R1JH | |
| MSI Katana GF66 11UG-220 | |
| Schenker XMG Focus 15 | |
| Asus Zephyrus G14 GA401IV | |
| PCMark 10 / Digital Content Creation | |
| Average of class Gaming (7602 - 19657, n=98, last 2 years) | |
| MSI Katana GF66 11UG-220 | |
| Razer Blade 14 Ryzen 9 RTX 3070 | |
| Acer Nitro 5 AN515-45-R1JH | |
| Asus Zephyrus G14 GA401QM | |
| Schenker XMG Focus 15 | |
| Asus Zephyrus G14 GA401QEC | |
| Average AMD Ryzen 9 5900HS, NVIDIA GeForce RTX 3050 Ti Laptop GPU (n=1) | |
| Asus Zephyrus G14 GA401IV | |
| PCMark 10 Score | 6617 points | |
Help | ||
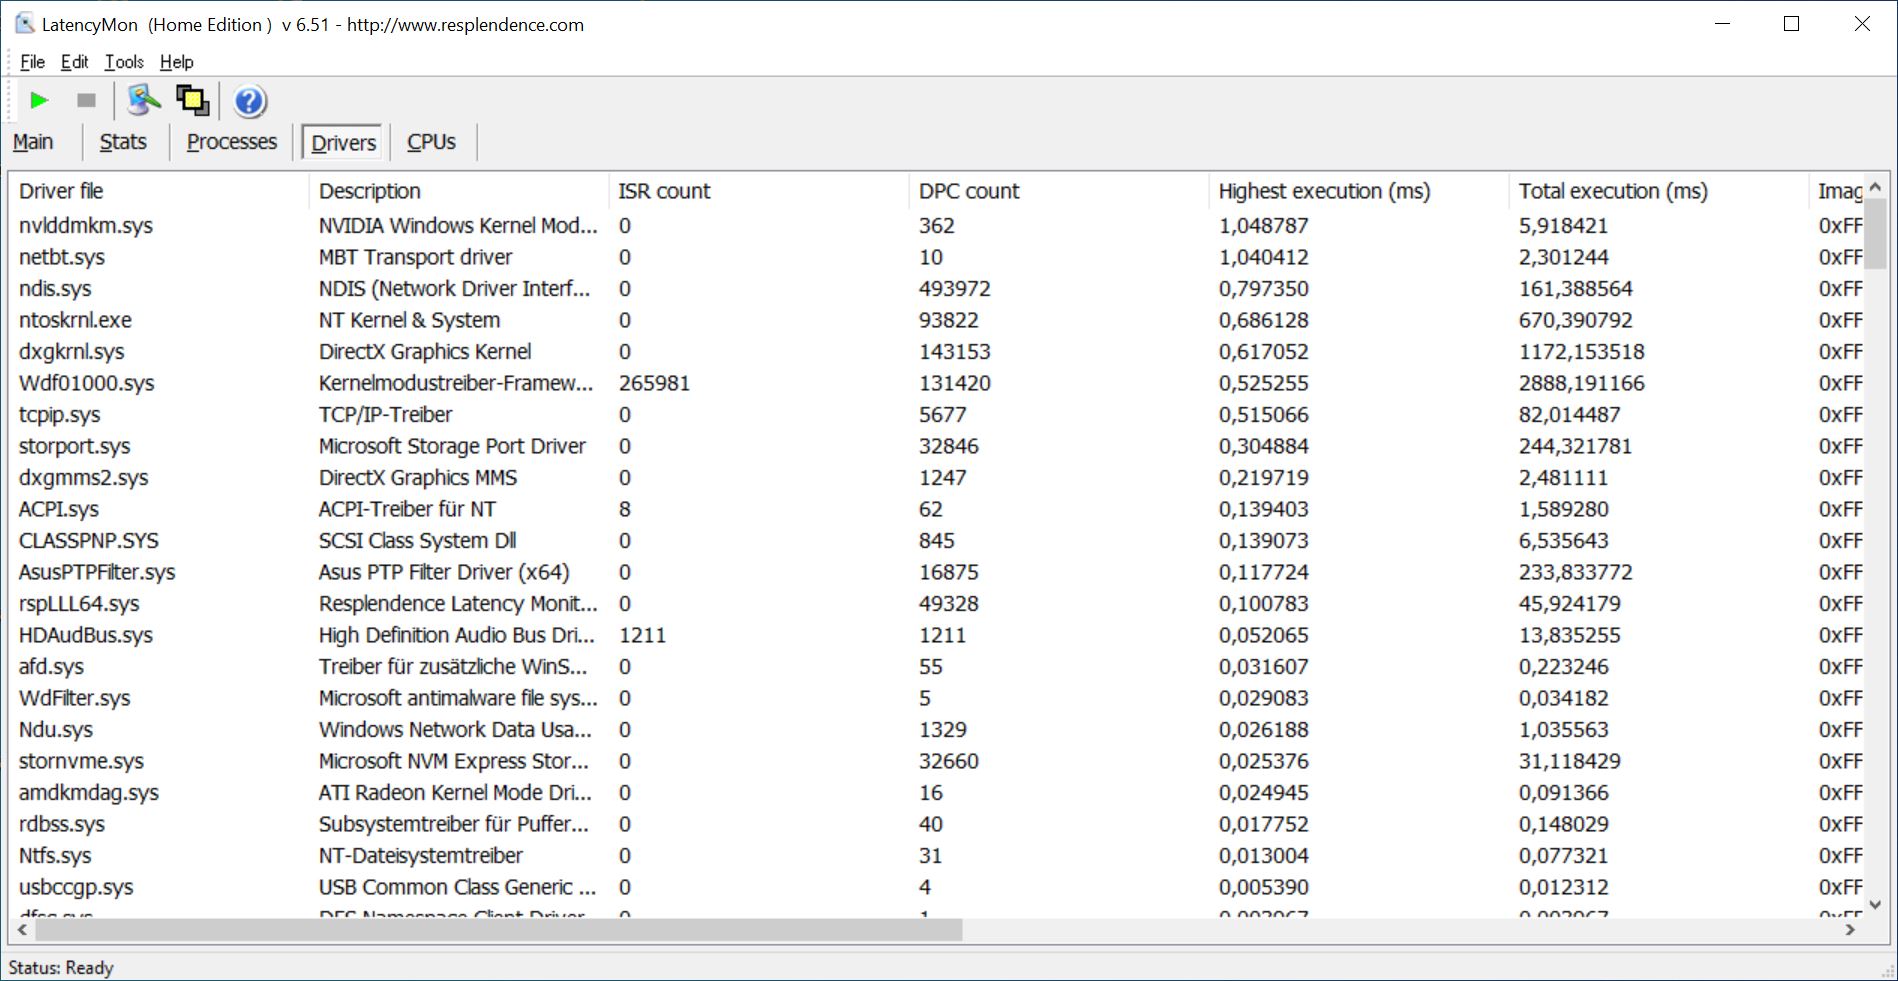
DPC latencies
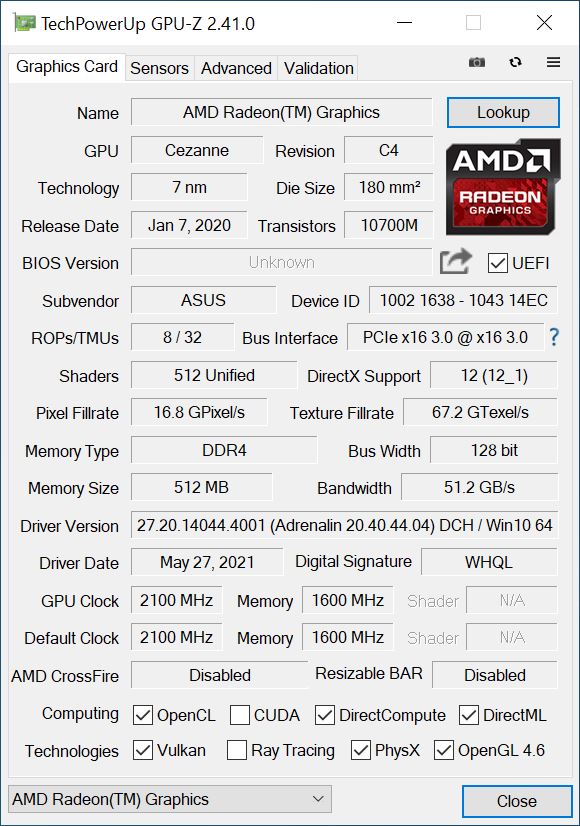
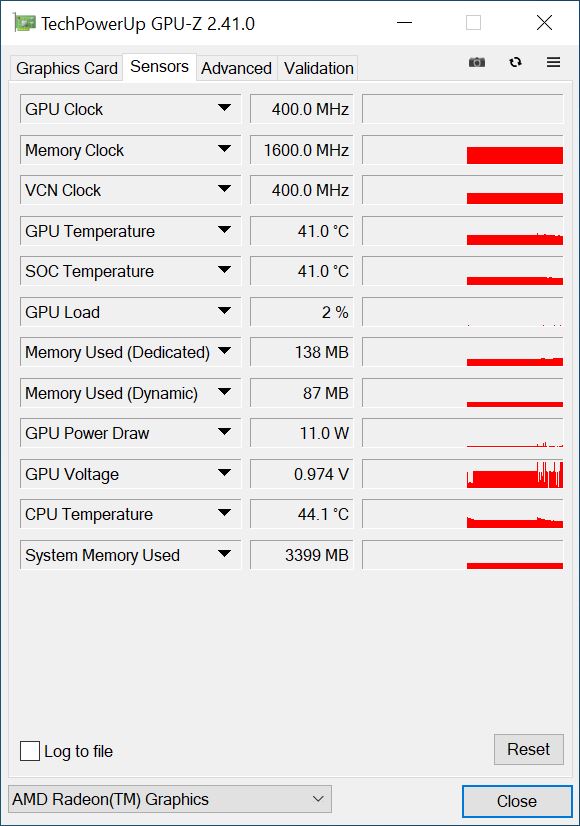
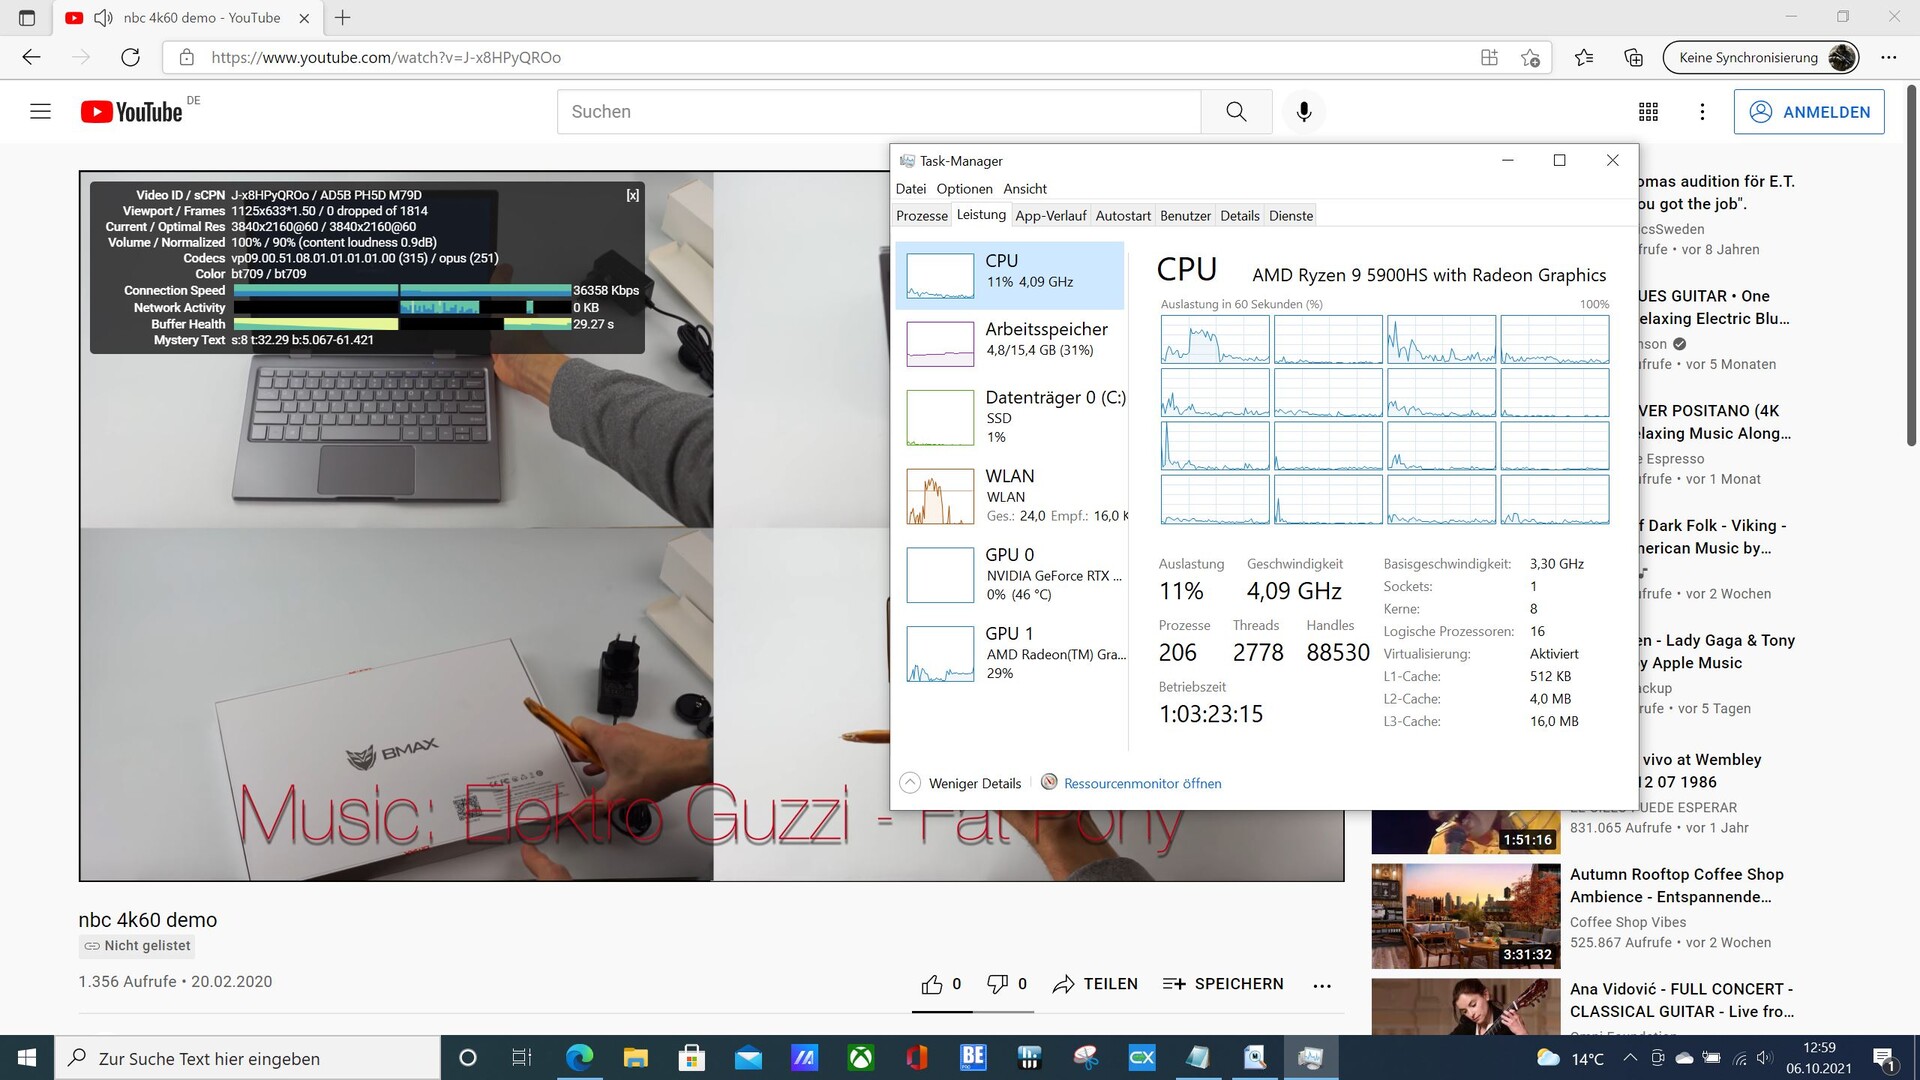
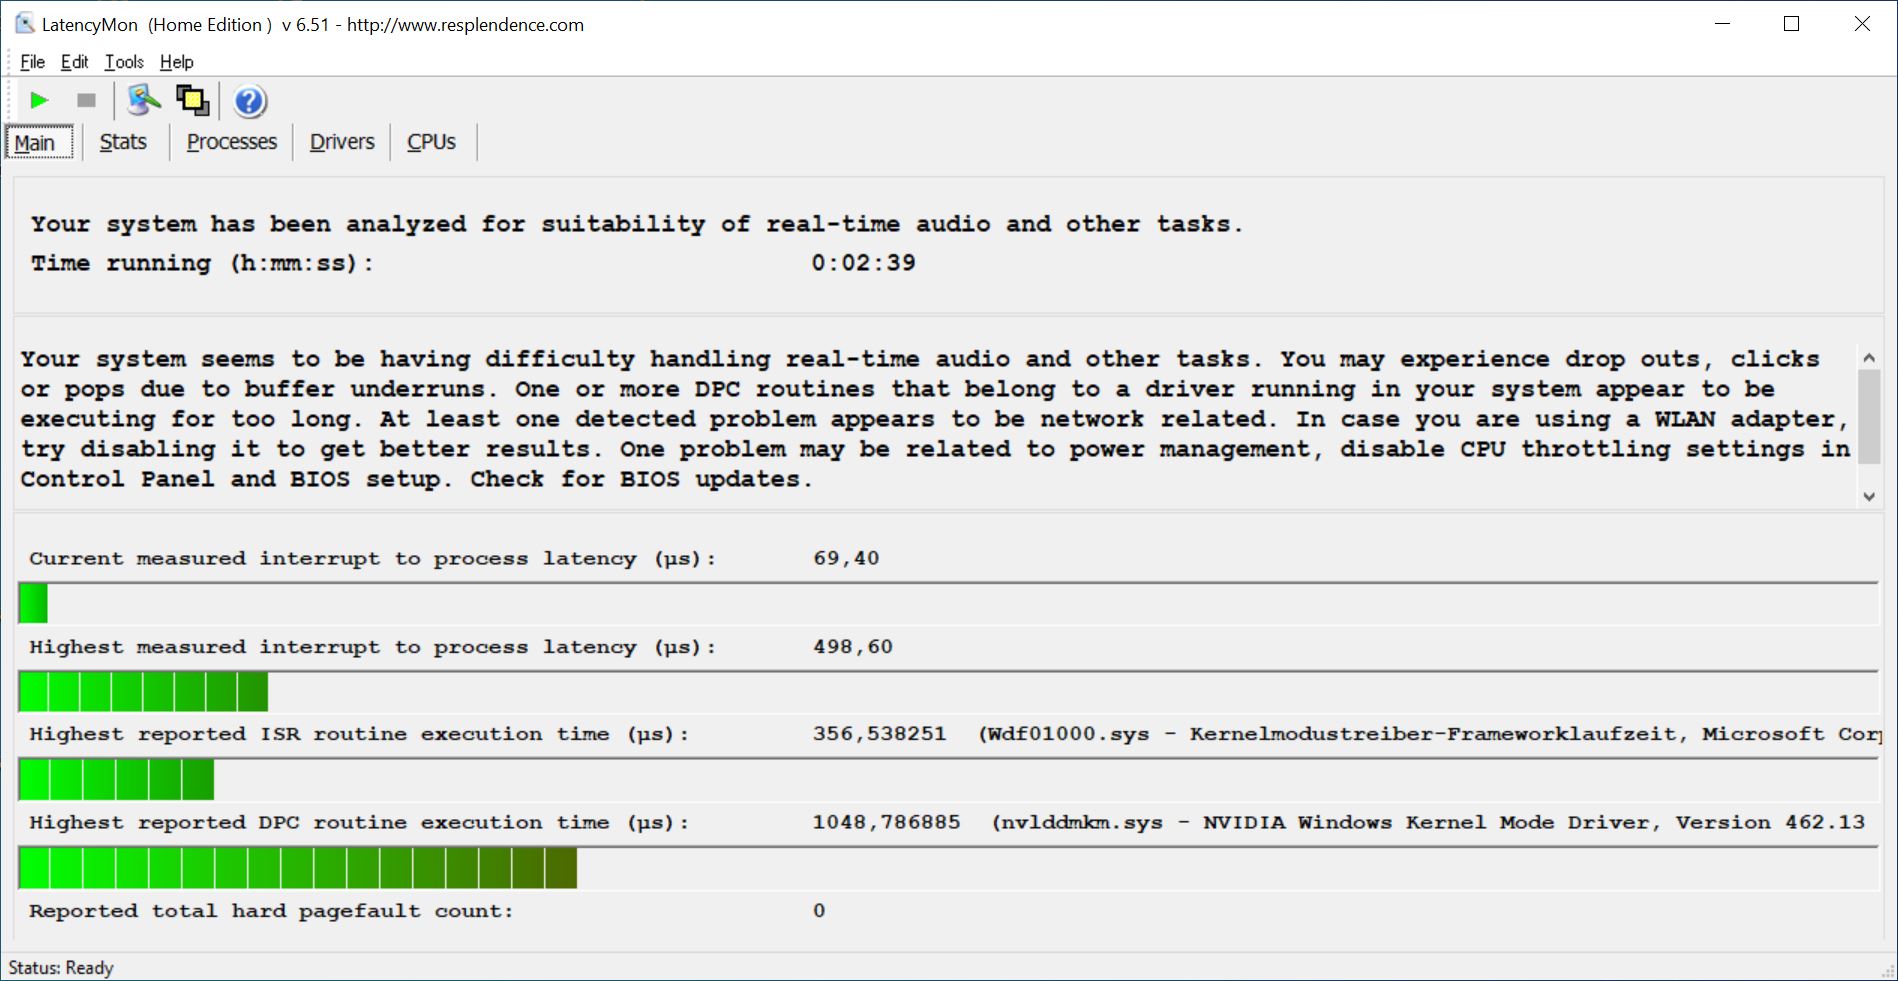
LatencyMon shows slightly elevated latencies when opening multiple browser tabs in Edge and playing our 4K YouTube video, but they didn't increase any further when Prime95 was started. Playing our 4K test video results in an average load of 20% for the iGPU. Nevertheless, load peaks of up to 30% are briefly possible.
| DPC Latencies / LatencyMon - interrupt to process latency (max), Web, Youtube, Prime95 | |
| Asus Zephyrus G14 GA401QM | |
| Asus Zephyrus G14 GA401IV | |
| Asus Zephyrus G14 GA401QEC | |
| MSI Katana GF66 11UG-220 | |
| Schenker XMG Focus 15 | |
| Acer Nitro 5 AN515-45-R1JH | |
| Razer Blade 14 Ryzen 9 RTX 3070 | |
* ... smaller is better
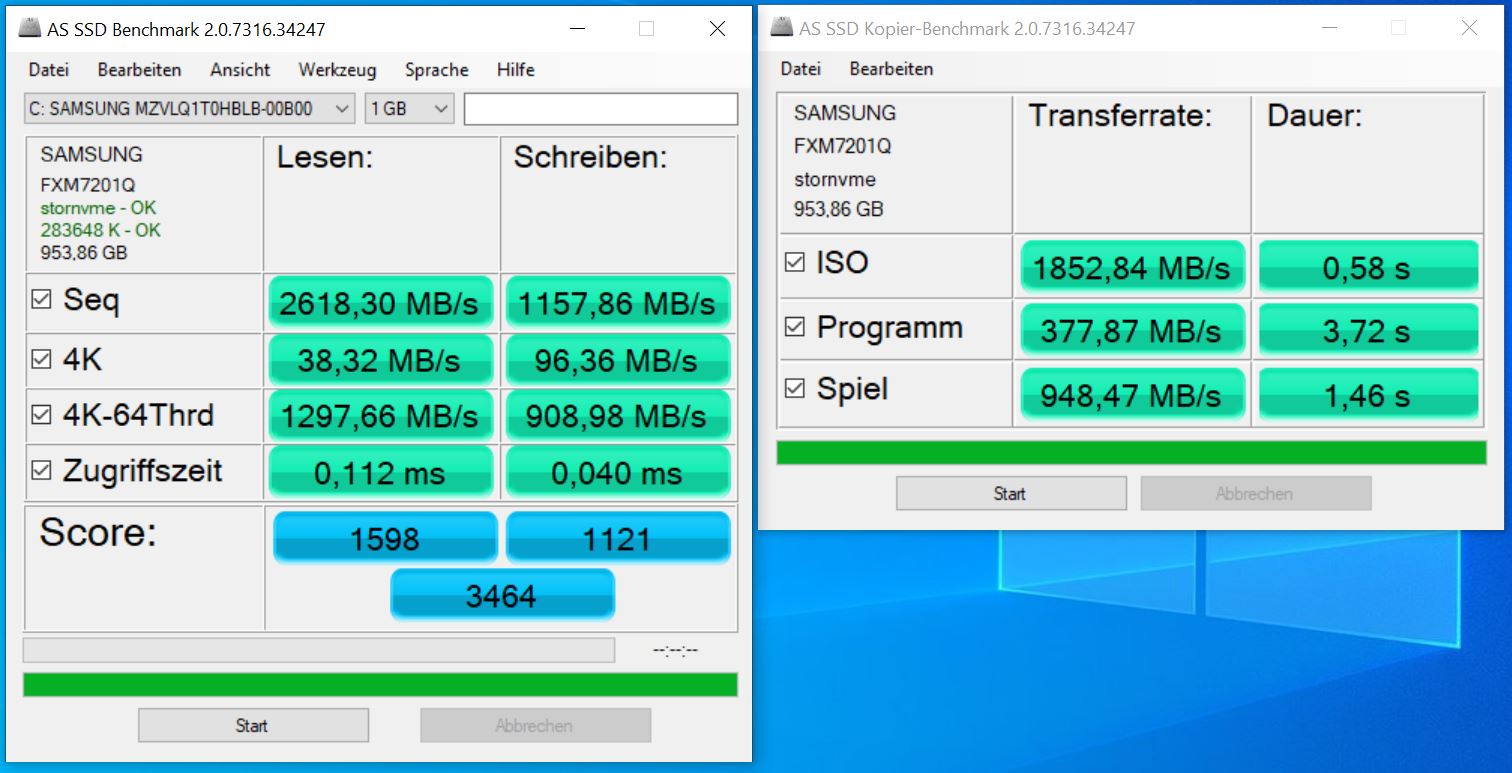
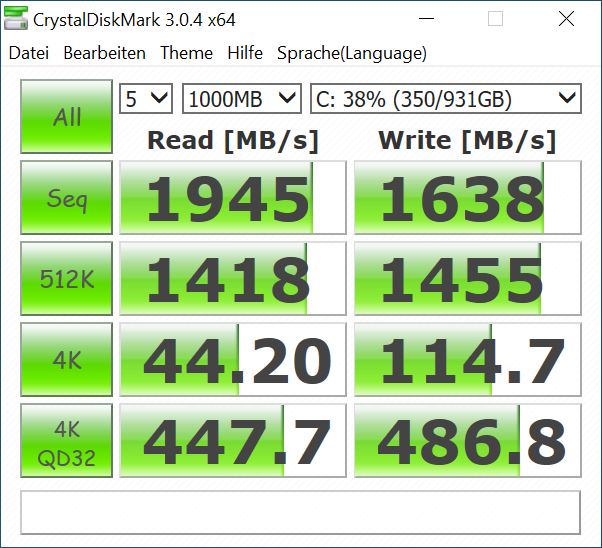
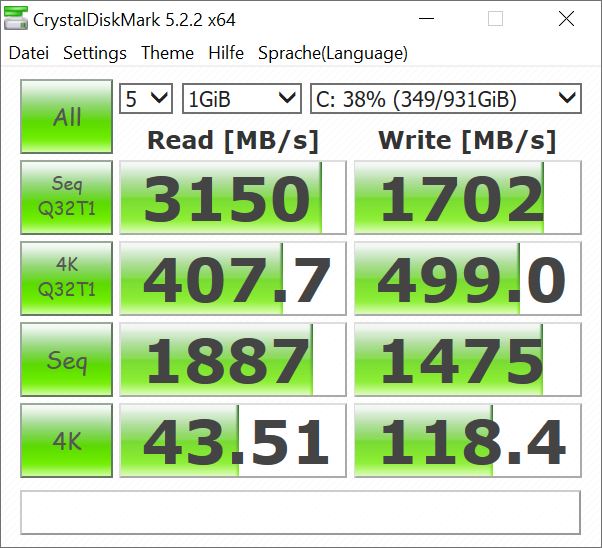
Storage
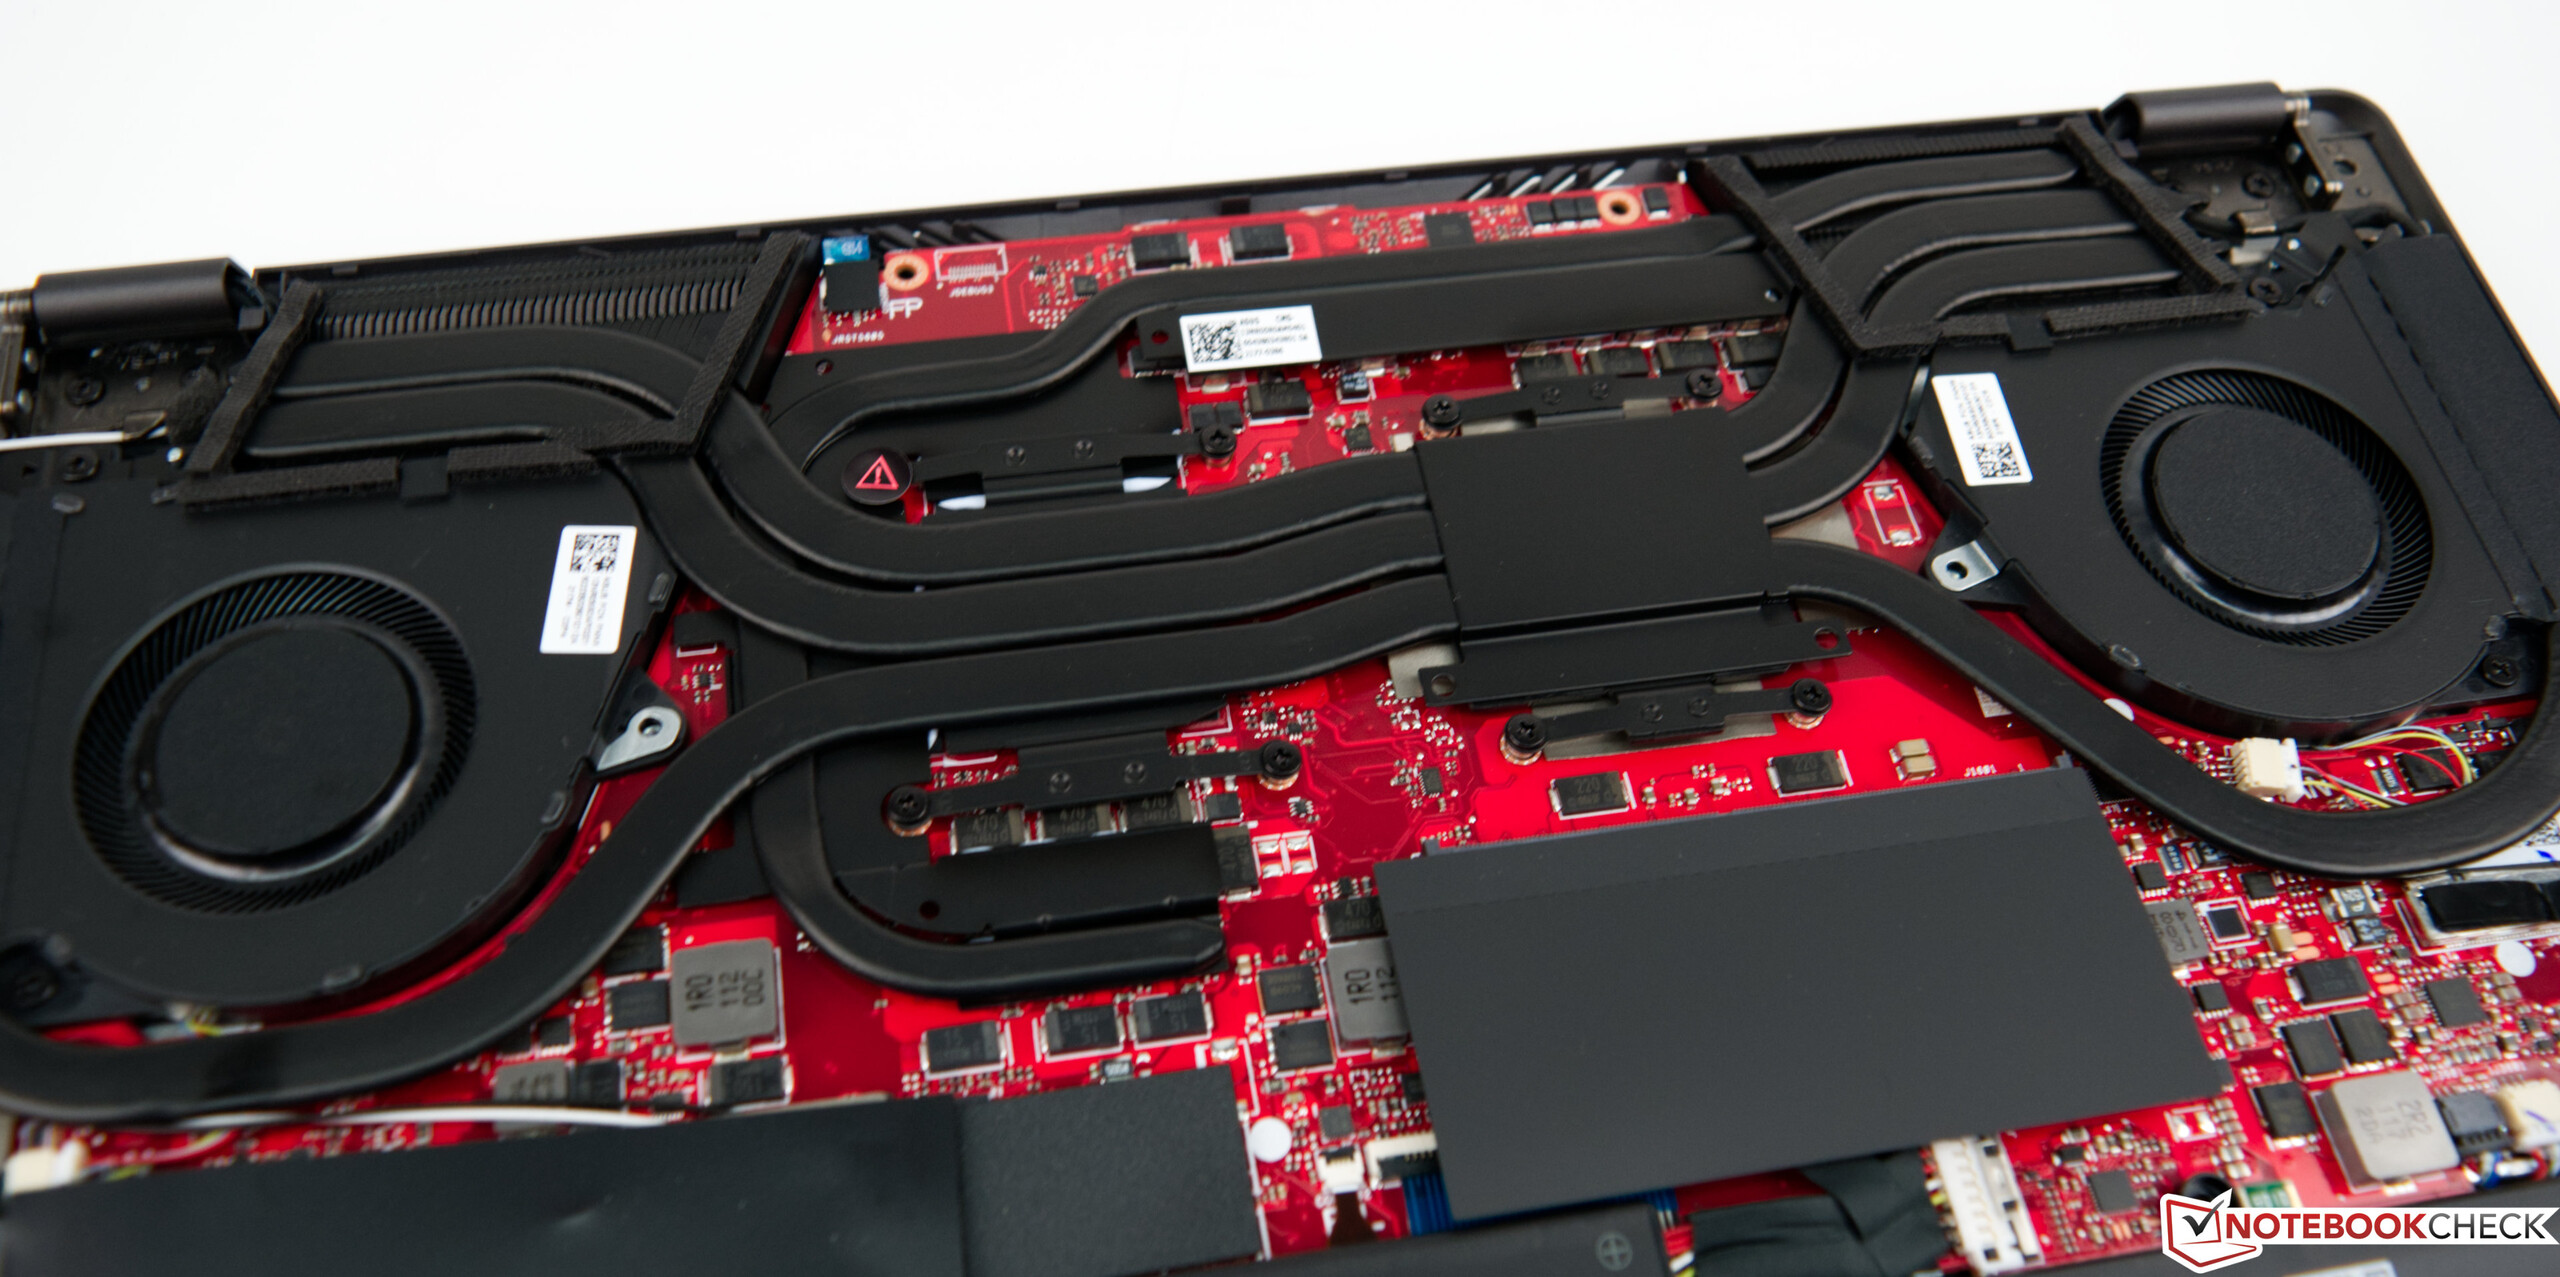
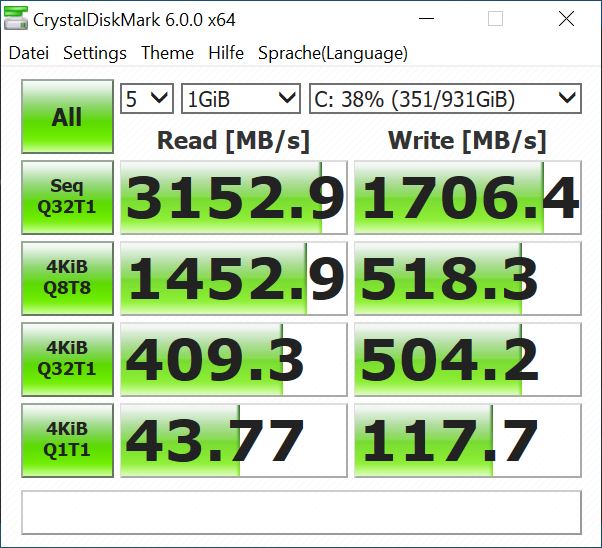
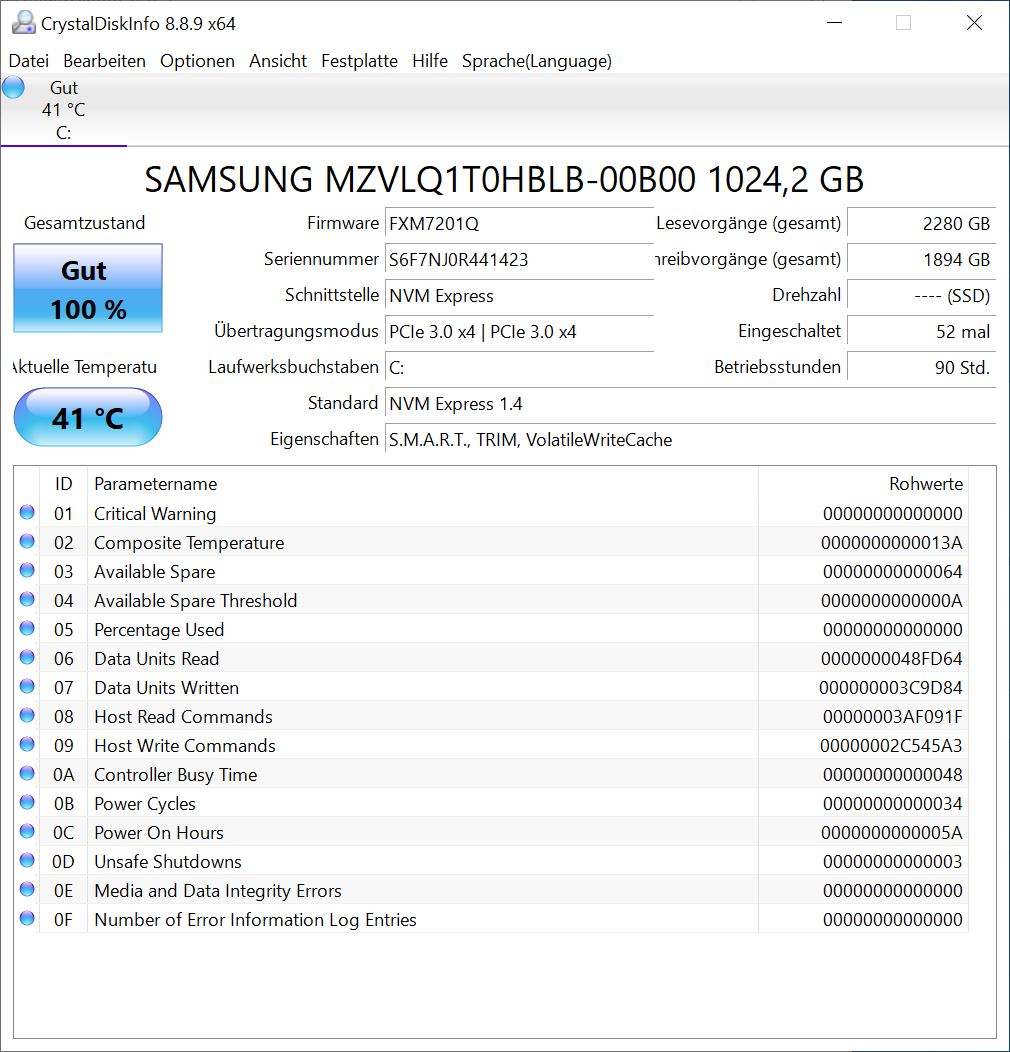
A fast NVMe SSD (M.2-2280) from Samsung serves as system drive. The SSD's 1 TB of storage space is a solid capacity, which is to be expected from a gaming laptop. Unfortunately, the Zephyrus G14 can't be equipped with a second mass storage device.
For more comparisons and benchmarks, take a look at our HDD/SDD Benchmarks article.
| Asus Zephyrus G14 GA401QEC Samsung PM991 MZVLQ1T0HALB | Asus Zephyrus G14 GA401QM SK Hynix HFM001TD3JX013N | Asus Zephyrus G14 GA401IV Intel SSD 660p 1TB SSDPEKNW010T8 | Razer Blade 14 Ryzen 9 RTX 3070 Samsung PM981a MZVLB1T0HBLR | Schenker XMG Focus 15 Samsung SSD 970 EVO Plus 1TB | MSI Katana GF66 11UG-220 Kingston OM8PDP3512B-AI1 | Acer Nitro 5 AN515-45-R1JH WDC PC SN530 SDBPNPZ-1T00 | Average Samsung PM991 MZVLQ1T0HALB | |
|---|---|---|---|---|---|---|---|---|
| CrystalDiskMark 5.2 / 6 | 27% | 13% | 36% | 60% | -32% | 12% | -1% | |
| Write 4K (MB/s) | 118.4 | 131.9 11% | 189.5 60% | 146.3 24% | 238.3 101% | 138.2 17% | 161.3 36% | 139.1 ? 17% |
| Read 4K (MB/s) | 43.51 | 54.4 25% | 62.7 44% | 48.16 11% | 55.6 28% | 31.31 -28% | 49.49 14% | 42.3 ? -3% |
| Write Seq (MB/s) | 1475 | 2412 64% | 1735 18% | 2975 102% | 3013 104% | 459.3 -69% | 1970 34% | 1397 ? -5% |
| Read Seq (MB/s) | 1887 | 2154 14% | 1608 -15% | 2456 30% | 2879 53% | 1283 -32% | 2007 6% | 1608 ? -15% |
| Write 4K Q32T1 (MB/s) | 504 | 520 3% | 475.5 -6% | 476 -6% | 569 13% | 321 -36% | 416.8 -17% | 420 ? -17% |
| Read 4K Q32T1 (MB/s) | 409.3 | 458.1 12% | 555 36% | 574 40% | 715 75% | 394.5 -4% | 554 35% | 479 ? 17% |
| Write Seq Q32T1 (MB/s) | 1706 | 2998 76% | 1802 6% | 3018 77% | 3287 93% | 436 -74% | 1965 15% | 1623 ? -5% |
| Read Seq Q32T1 (MB/s) | 3153 | 3601 14% | 1929 -39% | 3567 13% | 3561 13% | 2222 -30% | 2369 -25% | 2592 ? -18% |
| Write 4K Q8T8 (MB/s) | 518 | 724 ? 40% | ||||||
| Read 4K Q8T8 (MB/s) | 1453 | 1208 ? -17% | ||||||
| AS SSD | 42% | -8% | 55% | 62% | -105% | -22% | 0% | |
| Seq Read (MB/s) | 2618 | 2923 12% | 1278 -51% | 3066 17% | 2988 14% | 1978 -24% | 2217 -15% | 2181 ? -17% |
| Seq Write (MB/s) | 1157 | 1801 56% | 1624 40% | 2805 142% | 2541 120% | 308.3 -73% | 1929 67% | 1266 ? 9% |
| 4K Read (MB/s) | 38.32 | 50 30% | 57.8 51% | 49.8 30% | 42.82 12% | 24.04 -37% | 28.71 -25% | 43.8 ? 14% |
| 4K Write (MB/s) | 96.4 | 109 13% | 163 69% | 119.7 24% | 87 -10% | 113.7 18% | 146.3 52% | 138.4 ? 44% |
| 4K-64 Read (MB/s) | 1298 | 1400 8% | 582 -55% | 2093 61% | 2096 61% | 256.5 -80% | 215.9 -83% | 961 ? -26% |
| 4K-64 Write (MB/s) | 909 | 2216 144% | 849 -7% | 2009 121% | 2455 170% | 242.8 -73% | 1475 62% | 794 ? -13% |
| Access Time Read * (ms) | 0.112 | 0.04 64% | 0.036 68% | 0.046 59% | 0.068 39% | 0.15 -34% | 0.07567 ? 32% | |
| Access Time Write * (ms) | 0.04 | 0.102 -155% | 0.112 -180% | 0.086 -115% | 0.043 -8% | 0.353 -782% | 0.105 -163% | 0.048 ? -20% |
| Score Read (Points) | 1598 | 1742 9% | 768 -52% | 2449 53% | 2437 53% | 478 -70% | 466 -71% | 1223 ? -23% |
| Score Write (Points) | 1121 | 2505 123% | 1174 5% | 2410 115% | 2797 150% | 387 -65% | 814 -27% | 1059 ? -6% |
| Score Total (Points) | 3464 | 5088 47% | 2372 -32% | 6095 76% | 6452 86% | 1033 -70% | 2513 -27% | 2869 ? -17% |
| Copy ISO MB/s (MB/s) | 1853 | 2076 12% | 1660 -10% | 1799 -3% | 278.1 -85% | 1698 -8% | 1694 ? -9% | |
| Copy Program MB/s (MB/s) | 377.9 | 879 133% | 443.5 17% | 750 98% | 282.3 -25% | 284.7 -25% | 479 ? 27% | |
| Copy Game MB/s (MB/s) | 948 | 1855 96% | 1162 23% | 1830 93% | 284.2 -70% | 786 -17% | 1023 ? 8% | |
| Total Average (Program / Settings) | 35% /
37% | 3% /
-0% | 46% /
48% | 61% /
61% | -69% /
-78% | -5% /
-9% | -1% /
-0% |
* ... smaller is better

Continuous load read: DiskSpd Read Loop, Queue Depth 8
Graphics card
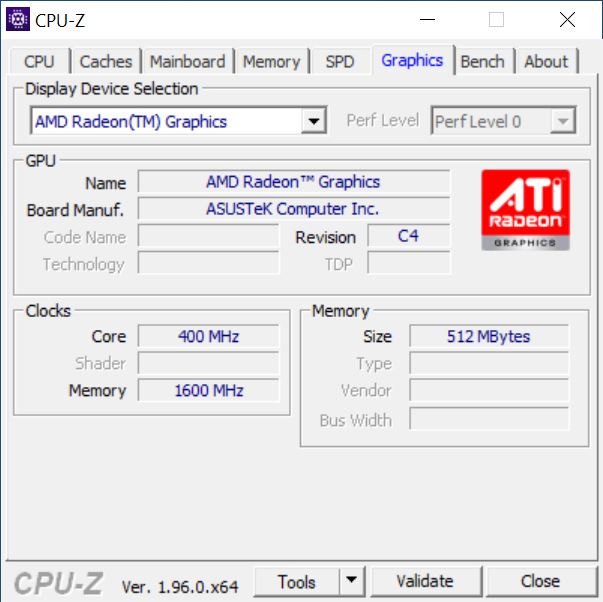
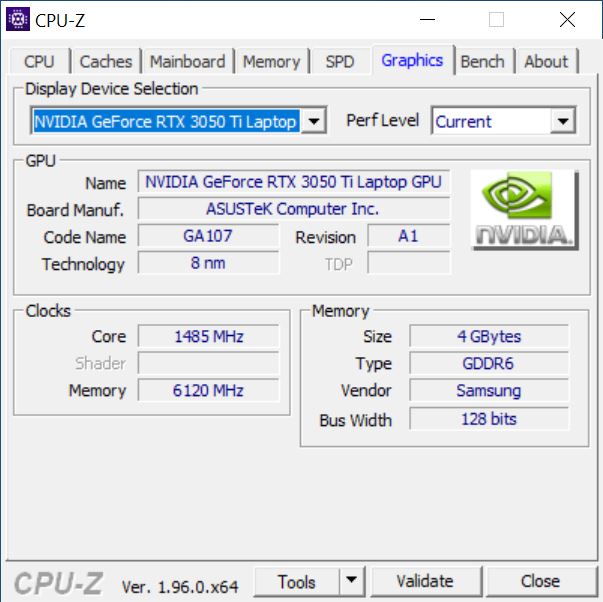
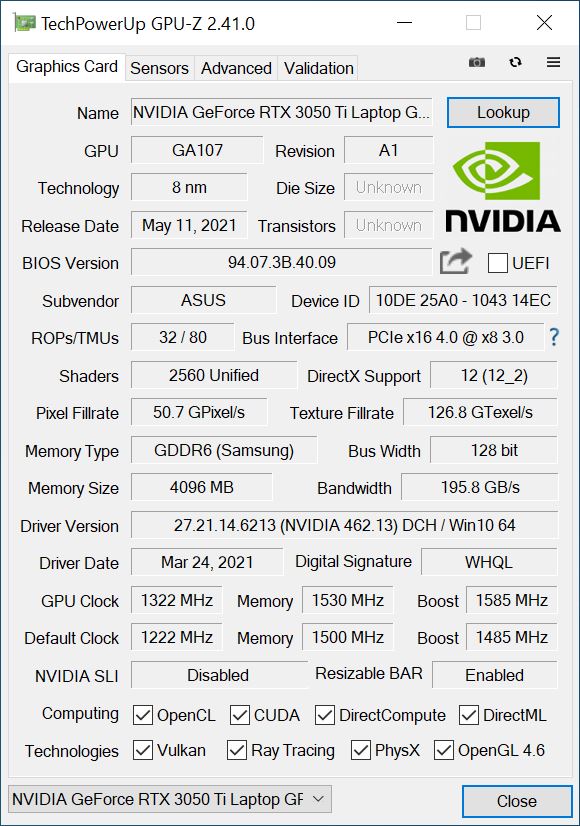
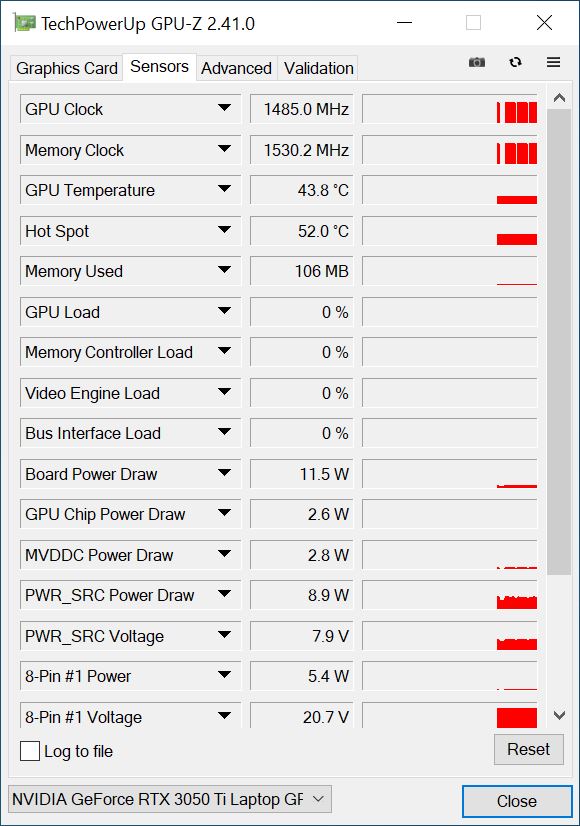
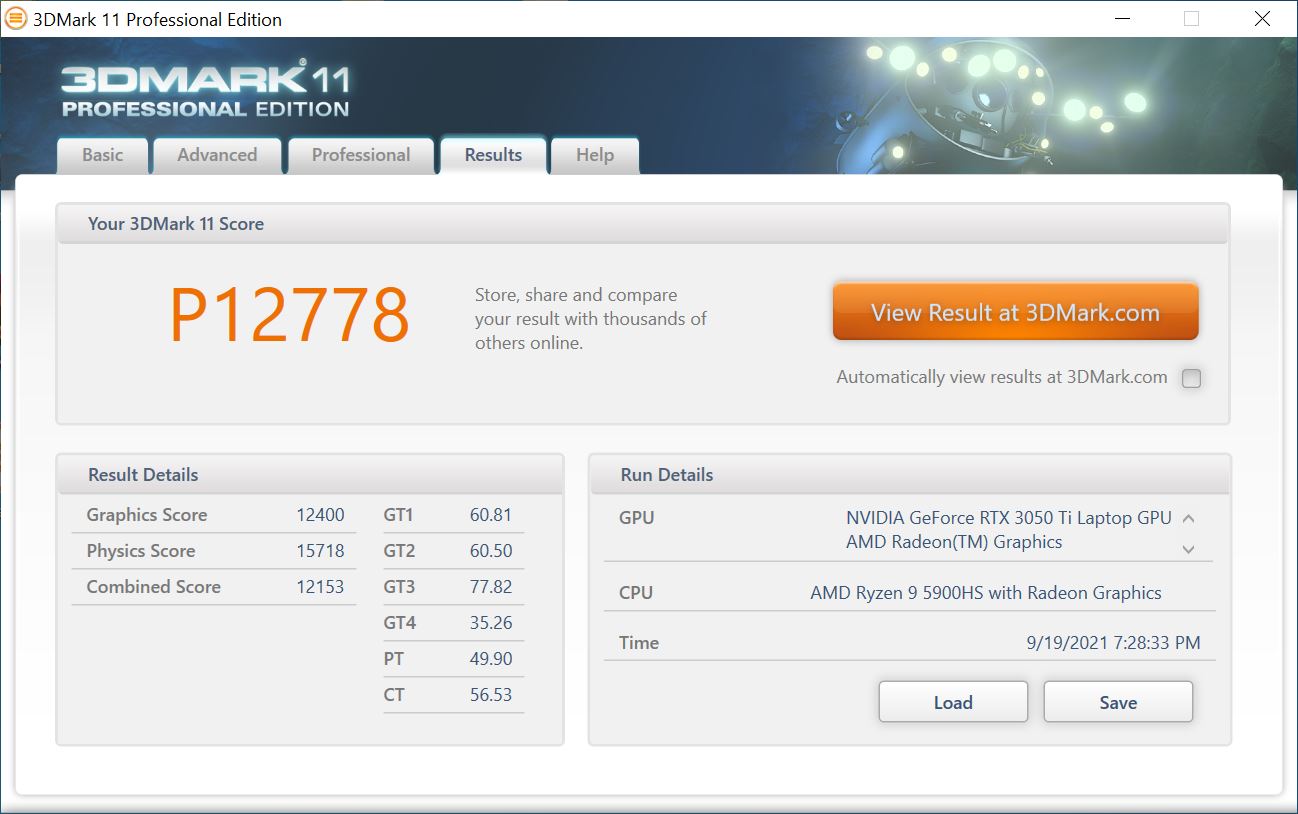
Besides the iGPU, the Asus Zephyrus G14 also offers an Nvidia GeForce RTX 3050 Ti laptop GPU. The latter has its own VRAM of 4 GB of GDDR6 memory, and it provides roughly the same performance as the older Asus Zephyrus G14 did with the GeForce RTX 2060 Max-Q graphics card. A head-to-head comparison of the two latest Zephyrus G14 laptops shows that the RTX 3050 Ti variant is about 20% slower than the model with the RTX 3060.
For more comparisons and benchmarks, please refer to our GPU Benchmarks article.
| 3DMark 11 Performance | 18119 points | |
| 3DMark Ice Storm Standard Score | 89363 points | |
| 3DMark Cloud Gate Standard Score | 40627 points | |
| 3DMark Fire Strike Score | 13132 points | |
| 3DMark Fire Strike Extreme Score | 6767 points | |
| 3DMark Time Spy Score | 6074 points | |
Help | ||
Gaming performance
The gaming performance of our Zephyrus G14 corresponds to the performance class of the built-in GPU. As expected, the comparison devices equipped with stronger GPUs like the RTX 3060 or RTX 3070 are faster. Nevertheless, our review sample doesn't need to shy away from the competition because most games can be played smoothly at maximum details. However, users will have to sacrifice the native WQHD resolution in newer games if they don't want to compromise on details.
The frame rates in The Witcher 3 show no irregularities and remain stable for the entire period. This means that longer gaming sessions are no problem for the Zephyrus G14.
The Witcher 3 FPS diagram
| low | med. | high | ultra | QHD | |
|---|---|---|---|---|---|
| GTA V (2015) | 176 | 169 | 124 | 71.6 | |
| The Witcher 3 (2015) | 255 | 101 | 53 | ||
| Dota 2 Reborn (2015) | 144.8 | 139.4 | 121.4 | 116 | |
| Final Fantasy XV Benchmark (2018) | 127 | 74.2 | 53.1 | 53.1 | |
| X-Plane 11.11 (2018) | 97.8 | 85.1 | 71.5 | ||
| Strange Brigade (2018) | 226 | 133 | 112 | 97.5 | |
| Doom Eternal (2020) | 201 | 121 | 115 | 112 | 80.9 |
| F1 2020 (2020) | 236 | 144 | 123 | 92 | 68.9 |
| F1 2021 (2021) | 230 | 145 | 122 | 62.3 | 43.1 |
| New World (2021) | 84.3 | 66.2 | 62.6 | 45.1 | 31.3 |
| FIFA 22 (2021) | 192 | 177 | 171 | 163 | 130 |
Emissions
Noise emissions
The registered noise emissions show that our Asus laptop is relatively quiet in idle usage and under low load with 33.3 dB(A). Silent operation is even possible when using the device on battery power. Under load, however, the two fans turn up considerably, and we measured the highest value in the stress test with 46.8 dB(A).
Noise level
| Idle |
| 33.3 / 33.3 / 33.3 dB(A) |
| Load |
| 36.1 / 48.6 dB(A) |
 | ||
30 dB silent 40 dB(A) audible 50 dB(A) loud |
||
min: | ||
Temperature
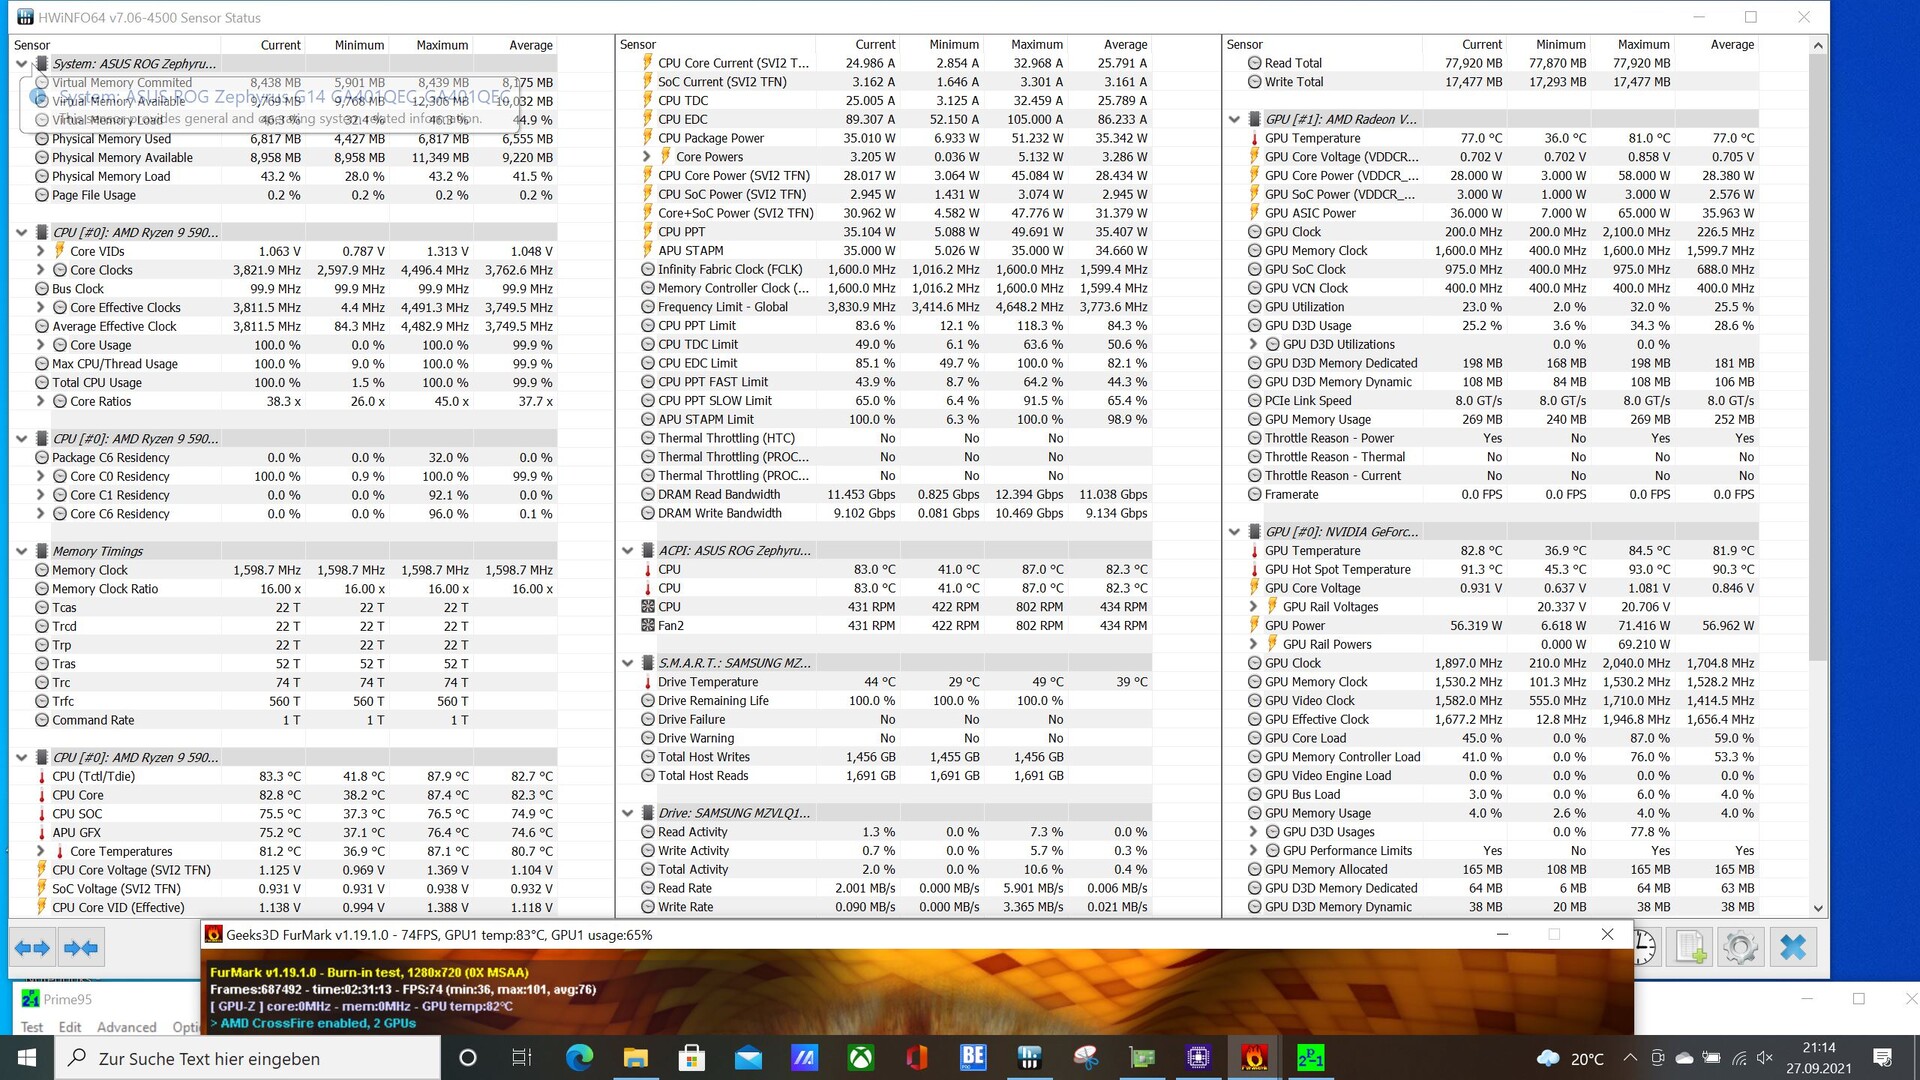
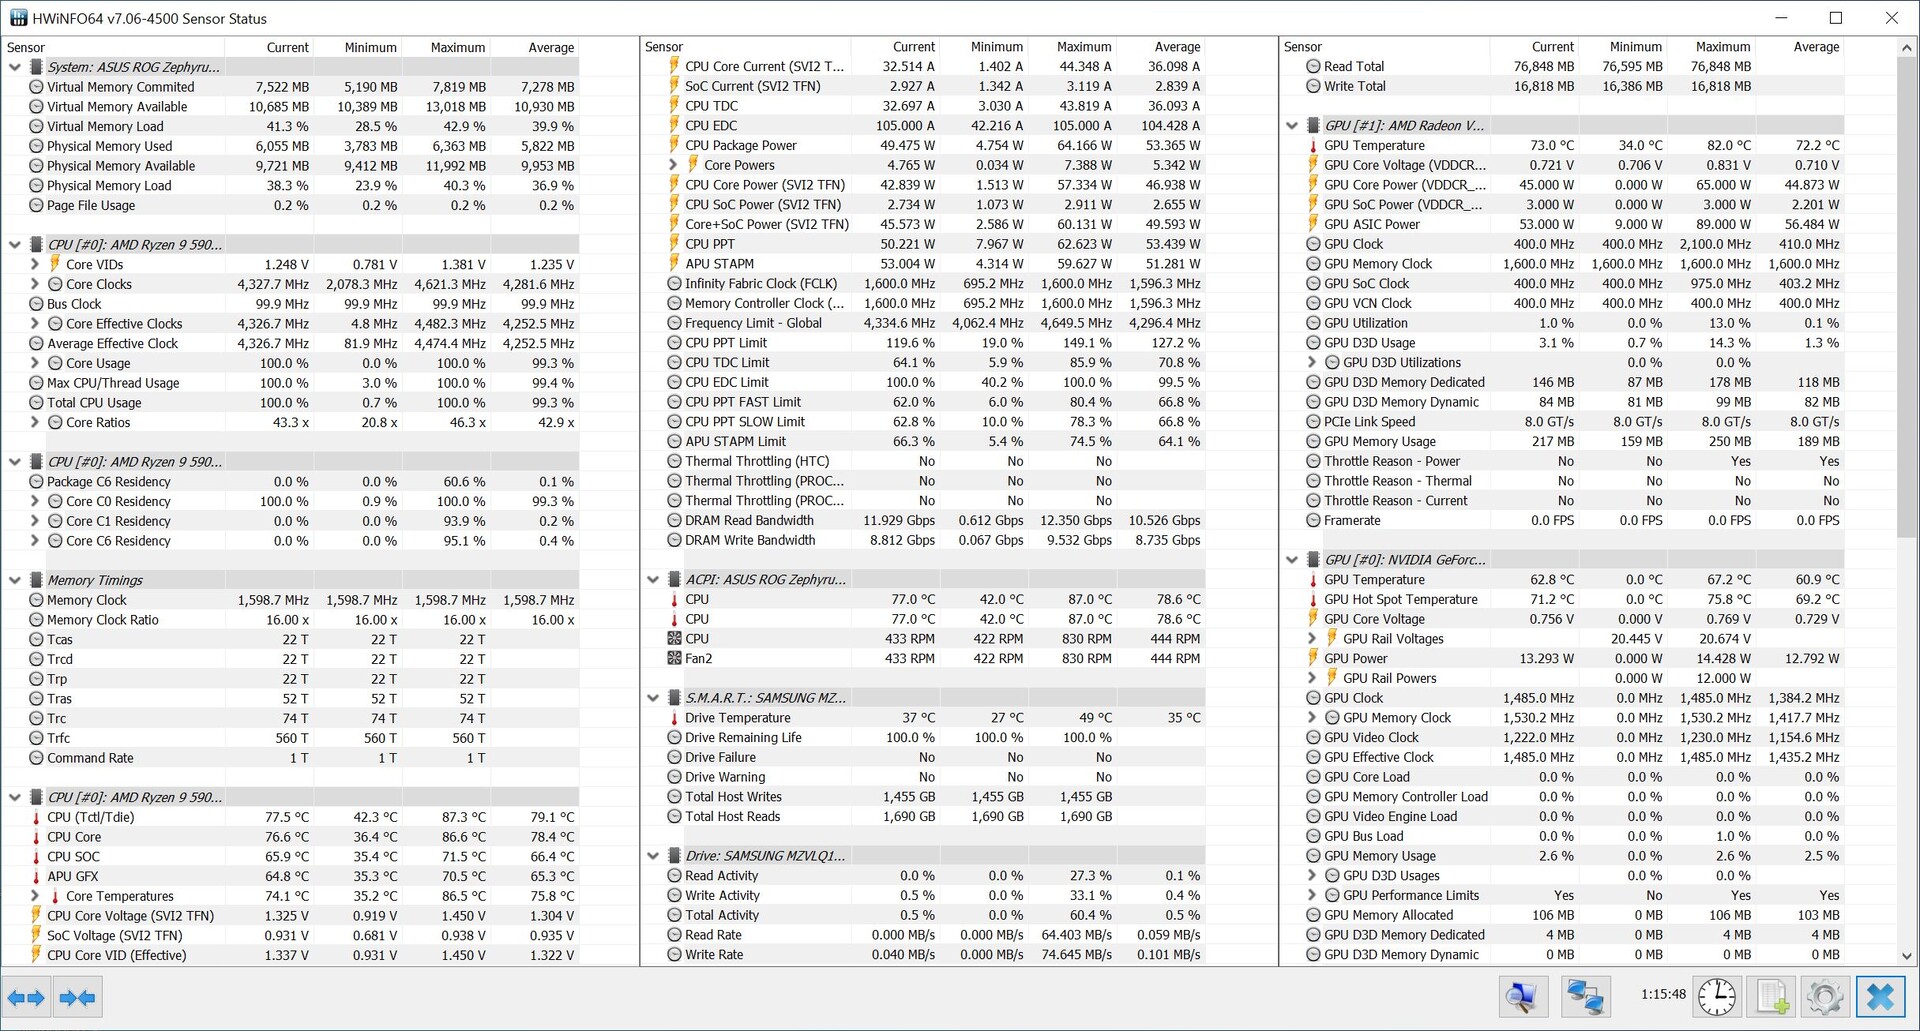
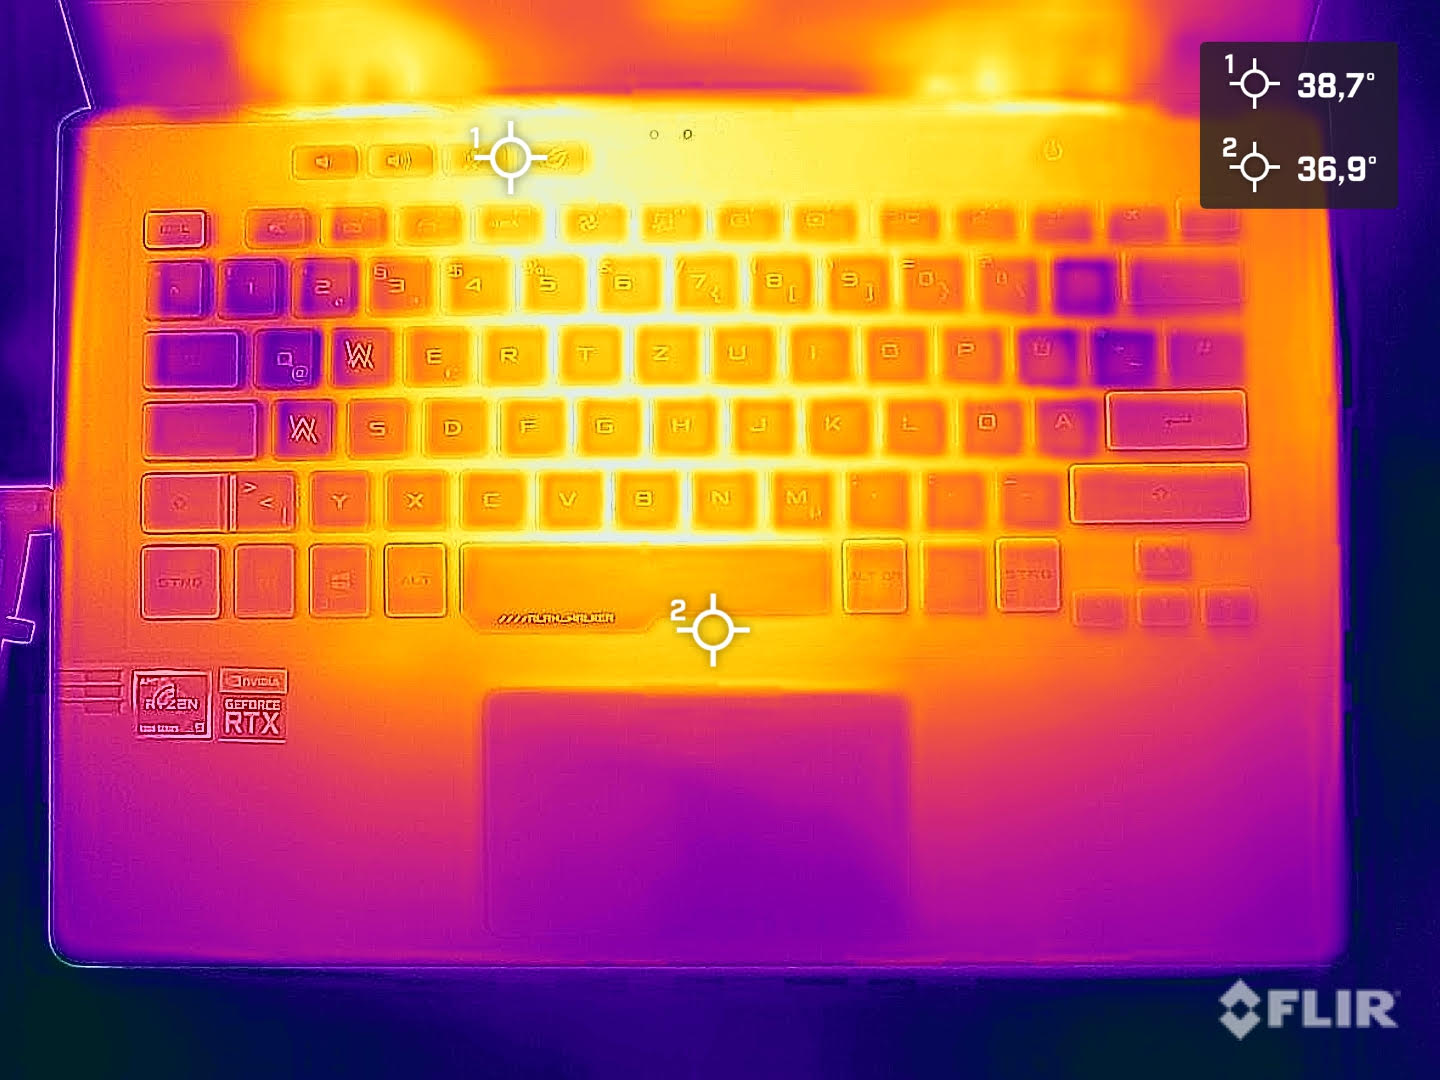
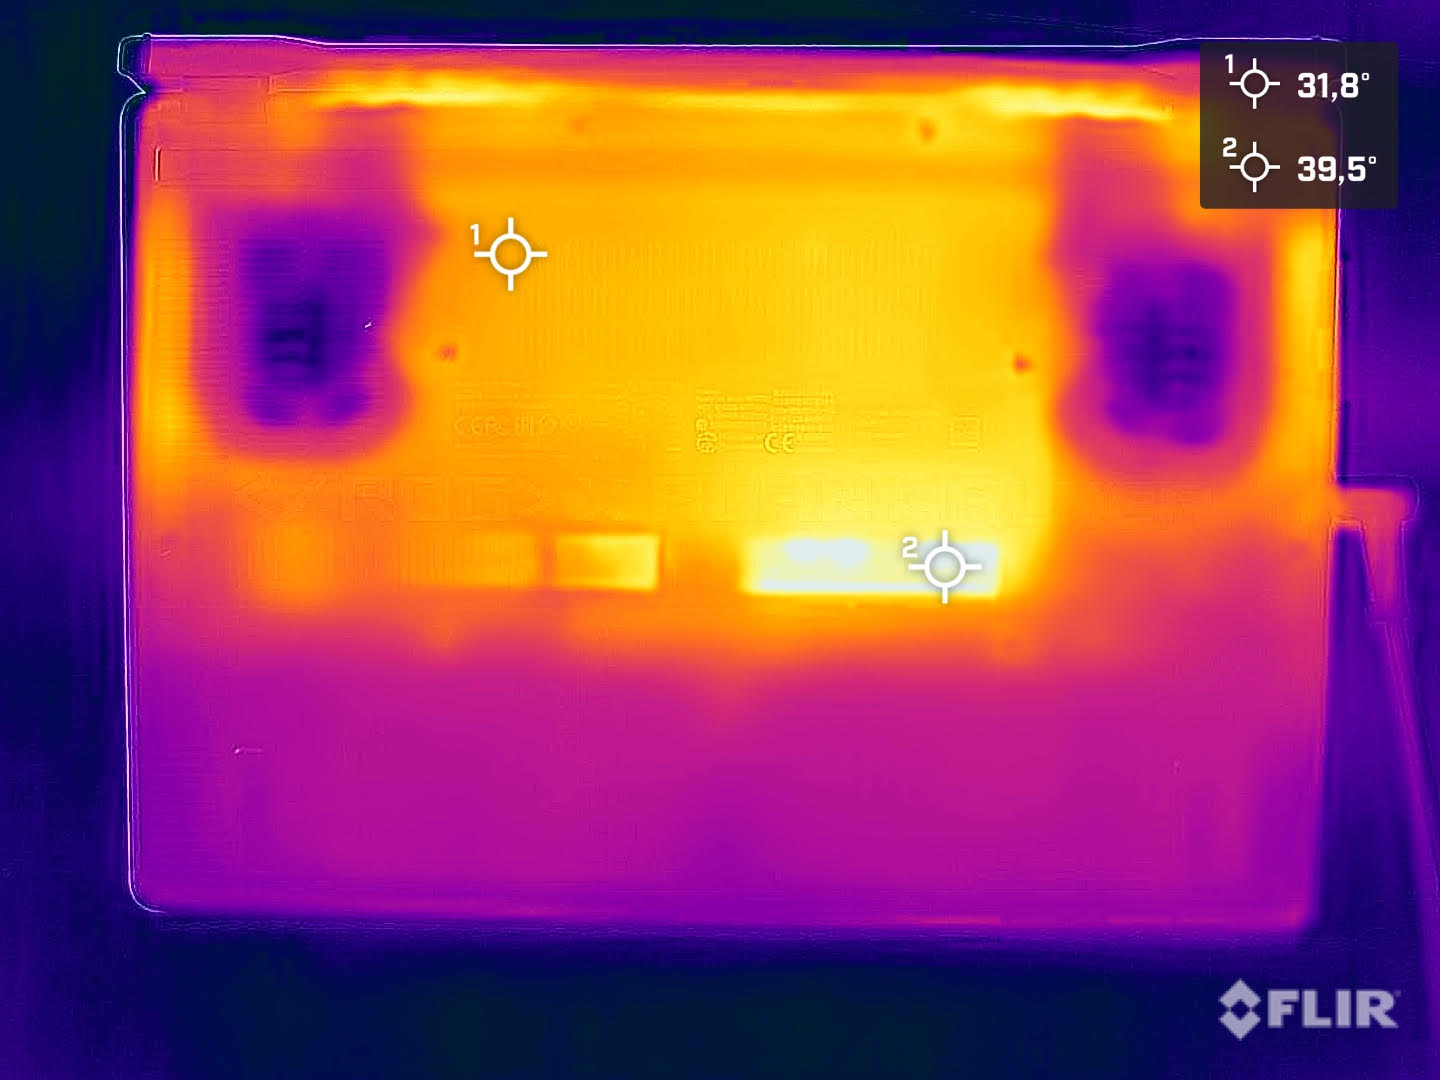
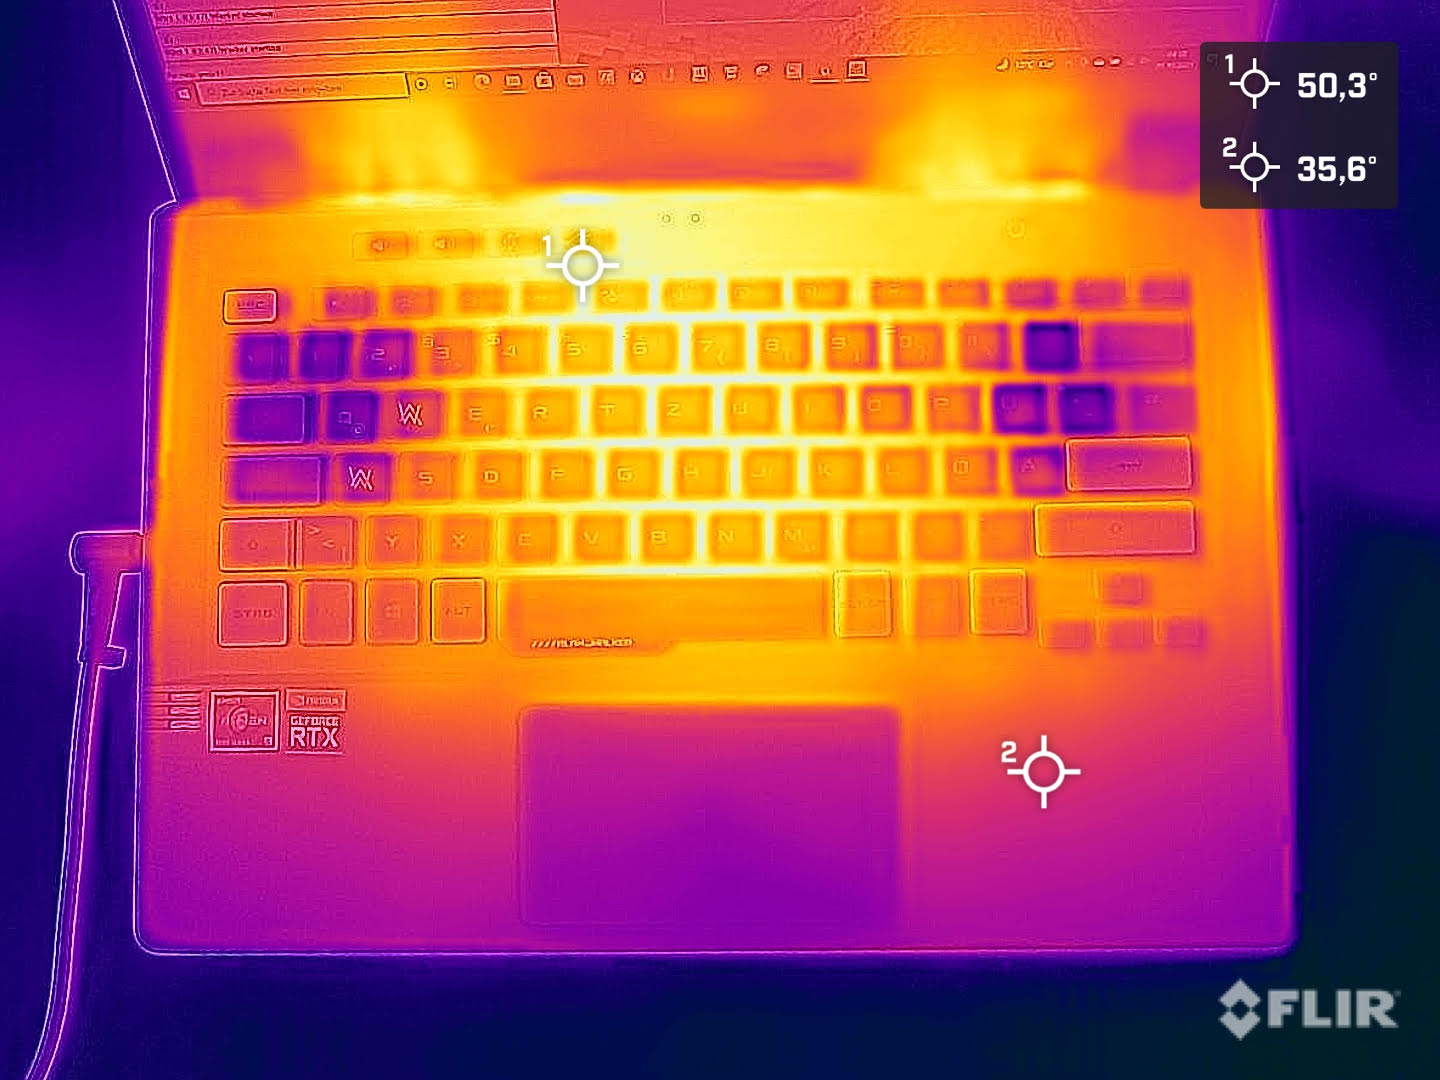
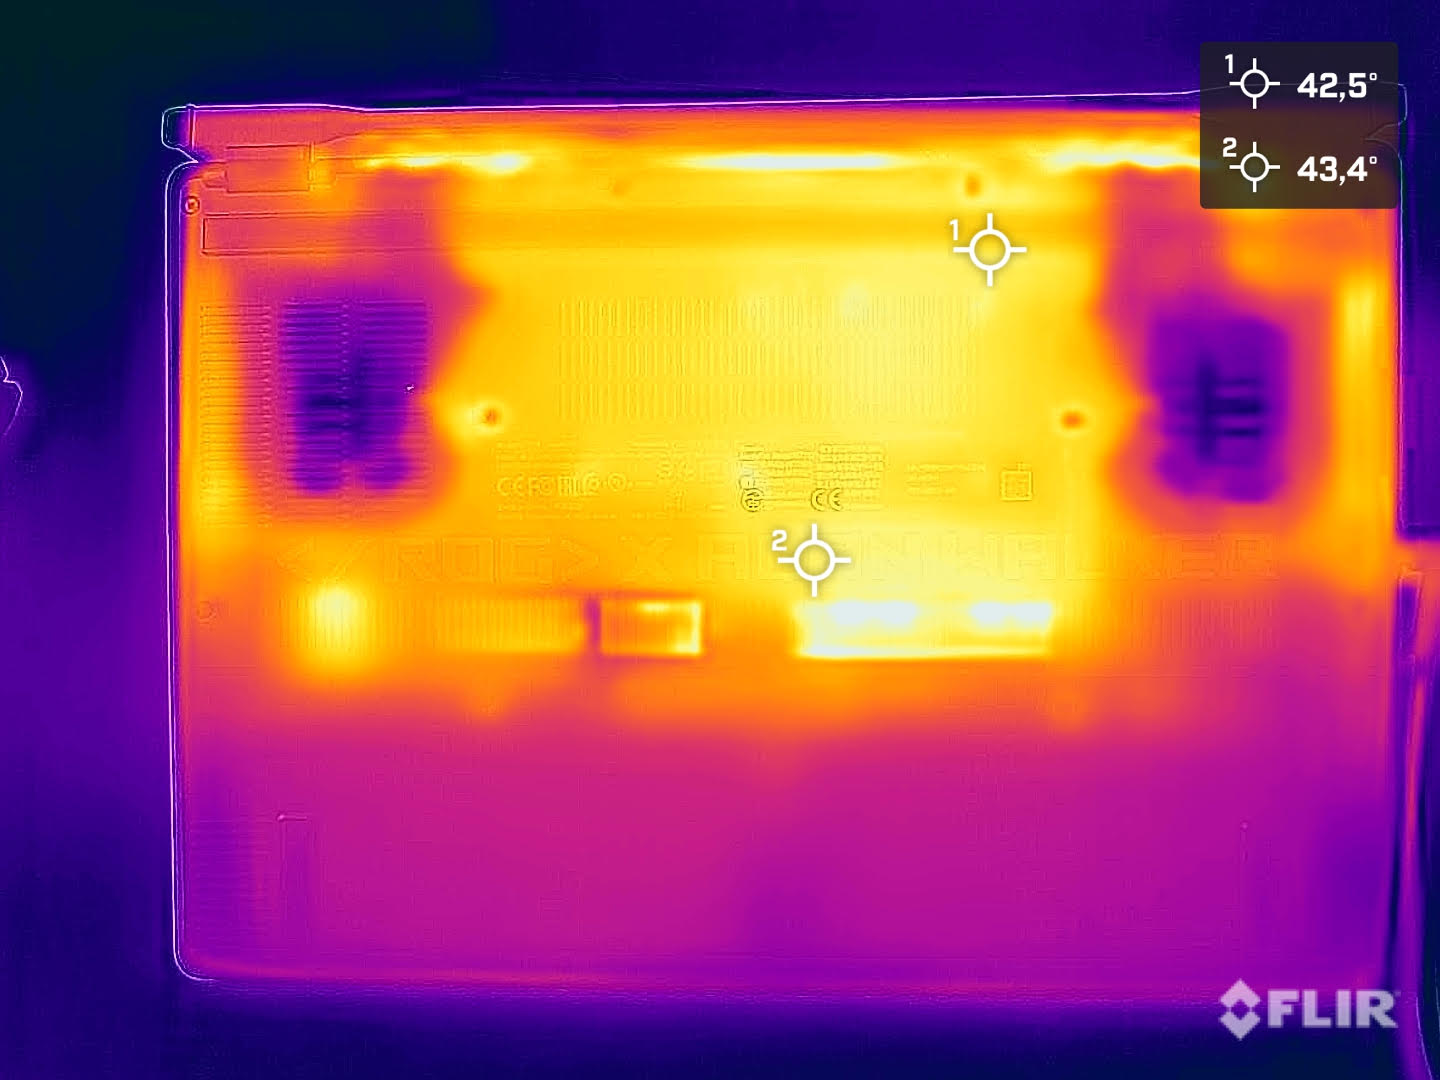
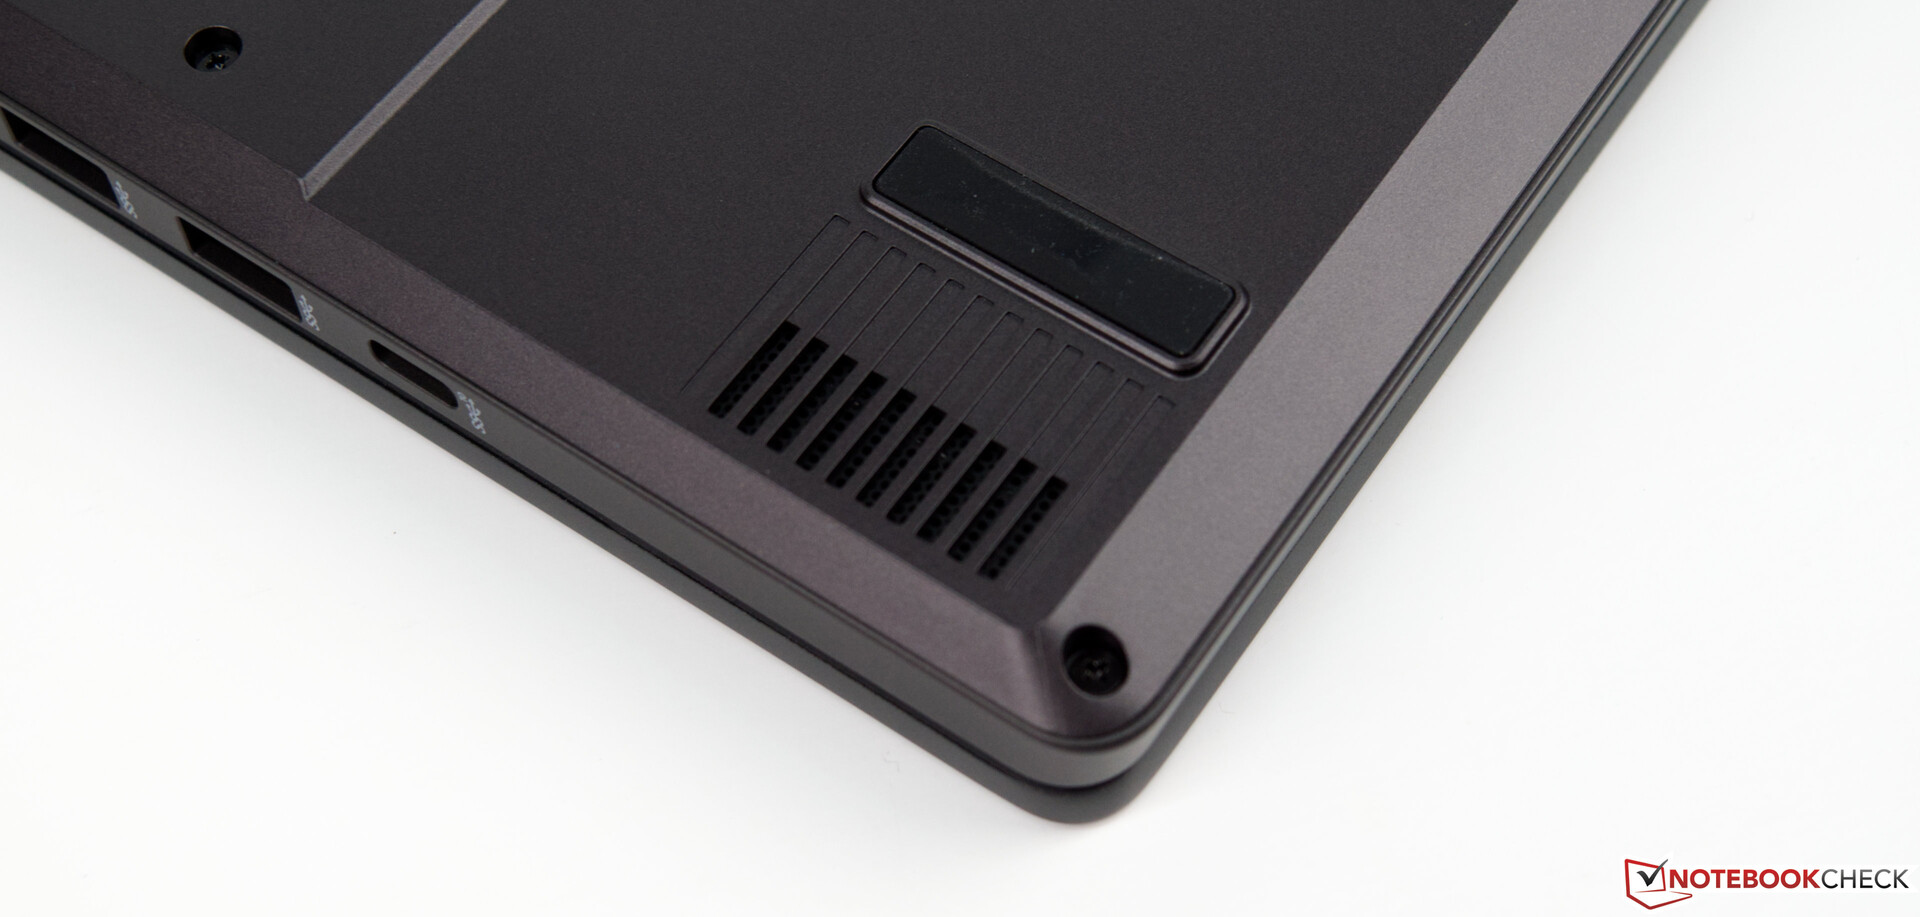
Overall, the compact design of the Zephyrus G14 results in high case temperatures under load. We measured over 50 °C (~122 °F) at two points during the stress test. Therefore, you shouldn't make intensive use of the device when it's placed on your lap; instead, you should choose a solid surface so that the laptop can draw in enough fresh air at the bottom. This is also facilitated by the base's construction, which slightly raises the device's rear side when the display is open. The surface temperatures are slightly better in idle usage, although they're still higher than average at over 40 °C (~104 °F) at several points.
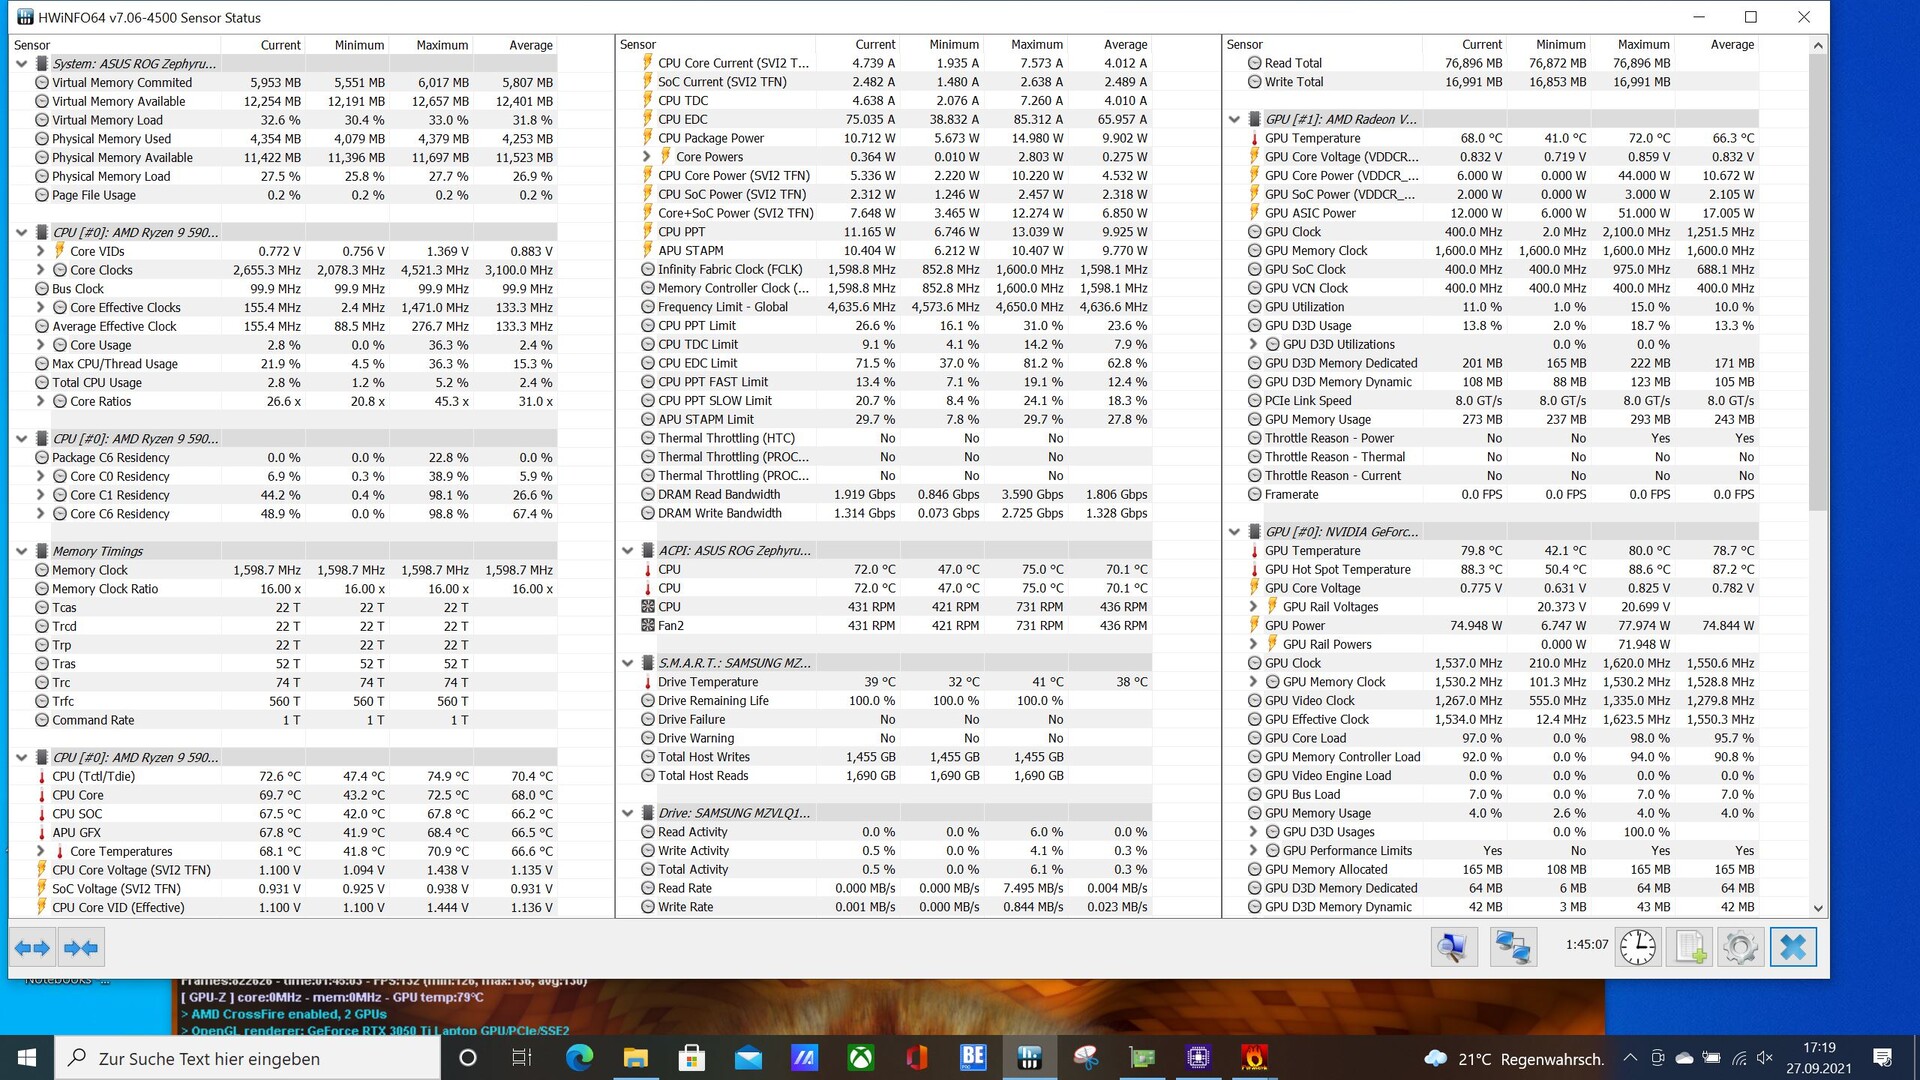
The SoC heated up to just under 88 °C (~190 °F) in the load test, which is still acceptable. In our test, we measured a maximum GPU hot spot temperature of 93 °C (~199 °F), which is also within reasonable limits. We weren't able to determine throttling caused by the temperatures in our review sample.
(-) The maximum temperature on the upper side is 53.6 °C / 128 F, compared to the average of 40.4 °C / 105 F, ranging from 21.2 to 68.8 °C for the class Gaming.
(-) The bottom heats up to a maximum of 49.9 °C / 122 F, compared to the average of 43.2 °C / 110 F
(±) In idle usage, the average temperature for the upper side is 37.9 °C / 100 F, compared to the device average of 33.9 °C / 93 F.
(+) The palmrests and touchpad are reaching skin temperature as a maximum (34.4 °C / 93.9 F) and are therefore not hot.
(-) The average temperature of the palmrest area of similar devices was 28.8 °C / 83.8 F (-5.6 °C / -10.1 F).
Speakers
The speakers of the Zephyrus G14 deliver a good result that is better than expected. The reason for this can be found quickly: besides the two 2.5-watt speakers, there are also two 0.7-watt tweeters. This makes high and low frequencies sound much better balanced. At the same time, the maximum volume is a minor point of criticism.
Asus Zephyrus G14 GA401QEC audio analysis
(±) | speaker loudness is average but good (73.3 dB)
Bass 100 - 315 Hz
(±) | reduced bass - on average 6.3% lower than median
(±) | linearity of bass is average (9% delta to prev. frequency)
Mids 400 - 2000 Hz
(+) | balanced mids - only 3.2% away from median
(+) | mids are linear (6% delta to prev. frequency)
Highs 2 - 16 kHz
(+) | balanced highs - only 2.1% away from median
(+) | highs are linear (5.2% delta to prev. frequency)
Overall 100 - 16.000 Hz
(+) | overall sound is linear (10.9% difference to median)
Compared to same class
» 7% of all tested devices in this class were better, 3% similar, 90% worse
» The best had a delta of 6%, average was 18%, worst was 132%
Compared to all devices tested
» 6% of all tested devices were better, 2% similar, 92% worse
» The best had a delta of 4%, average was 24%, worst was 134%
Razer Blade 14 Ryzen 9 RTX 3070 audio analysis
(±) | speaker loudness is average but good (78.1 dB)
Bass 100 - 315 Hz
(±) | reduced bass - on average 14.2% lower than median
(±) | linearity of bass is average (13.5% delta to prev. frequency)
Mids 400 - 2000 Hz
(±) | higher mids - on average 5.5% higher than median
(+) | mids are linear (6.6% delta to prev. frequency)
Highs 2 - 16 kHz
(+) | balanced highs - only 4.8% away from median
(±) | linearity of highs is average (8.9% delta to prev. frequency)
Overall 100 - 16.000 Hz
(±) | linearity of overall sound is average (18.6% difference to median)
Compared to same class
» 60% of all tested devices in this class were better, 9% similar, 31% worse
» The best had a delta of 6%, average was 18%, worst was 132%
Compared to all devices tested
» 42% of all tested devices were better, 8% similar, 50% worse
» The best had a delta of 4%, average was 24%, worst was 134%
Energy management
Energy consumption
In terms of power consumption, the Special Edition falls slightly behind in idle usage, which is due to the WQHD panel and the illumination on the display lid. However, the Zephyrus G14 is very frugal compared to its class with a consumption of 8 to 16 watts. The device is also quite modest under load with a maximum consumption of 136 watts. The power adapter can supply up to 180 watts.
| Off / Standby | |
| Idle | |
| Load |
|
Key:
min: | |
| Asus Zephyrus G14 GA401QEC R9 5900HS, GeForce RTX 3050 Ti Laptop GPU, Samsung PM991 MZVLQ1T0HALB, IPS, 2560x1440, 14" | Asus Zephyrus G14 GA401QM R9 5900HS, GeForce RTX 3060 Laptop GPU, SK Hynix HFM001TD3JX013N, IPS, 1920x1080, 14" | Asus Zephyrus G14 GA401IV R9 4900HS, GeForce RTX 2060 Max-Q, Intel SSD 660p 1TB SSDPEKNW010T8, IPS, 1920x1080, 14" | Razer Blade 14 Ryzen 9 RTX 3070 R9 5900HX, GeForce RTX 3070 Laptop GPU, Samsung PM981a MZVLB1T0HBLR, IPS, 2560x1440, 14" | Schenker XMG Focus 15 i7-11800H, GeForce RTX 3050 Ti Laptop GPU, Samsung SSD 970 EVO Plus 1TB, IPS, 1920x1080, 15.6" | MSI Katana GF66 11UG-220 i7-11800H, GeForce RTX 3070 Laptop GPU, Kingston OM8PDP3512B-AI1, IPS, 1920x1080, 15.6" | Acer Nitro 5 AN515-45-R1JH R7 5800H, GeForce RTX 3070 Laptop GPU, WDC PC SN530 SDBPNPZ-1T00, IPS, 2560x1440, 15.6" | Average NVIDIA GeForce RTX 3050 Ti Laptop GPU | Average of class Gaming | |
|---|---|---|---|---|---|---|---|---|---|
| Power Consumption | 11% | 11% | -21% | -75% | -9% | -10% | 0% | -51% | |
| Idle Minimum * (Watt) | 8.1 | 5.6 31% | 5.5 32% | 9.4 -16% | 23 -184% | 8 1% | 8.8 -9% | 8.2 ? -1% | 13.3 ? -64% |
| Idle Average * (Watt) | 12.9 | 10.4 19% | 9.3 28% | 15.8 -22% | 25 -94% | 12 7% | 13 -1% | 12.6 ? 2% | 19 ? -47% |
| Idle Maximum * (Watt) | 16.1 | 18 -12% | 15.8 2% | 24.1 -50% | 29 -80% | 22 -37% | 14.6 9% | 17.2 ? -7% | 24.5 ? -52% |
| Load Average * (Watt) | 102.4 | 68 34% | 92.2 10% | 76.8 25% | 106 -4% | 98 4% | 133 -30% | 92 ? 10% | 108.1 ? -6% |
| Load Maximum * (Watt) | 135.8 | 158.2 -16% | 156.6 -15% | 189.7 -40% | 156 -15% | 162 -19% | 164 -21% | 139.1 ? -2% | 254 ? -87% |
| Witcher 3 ultra * (Watt) | 113 | 112.4 | 154 | 128 | 152 | 134 |
* ... smaller is better
Energy consumption during The Witcher 3 / stress test
Battery life
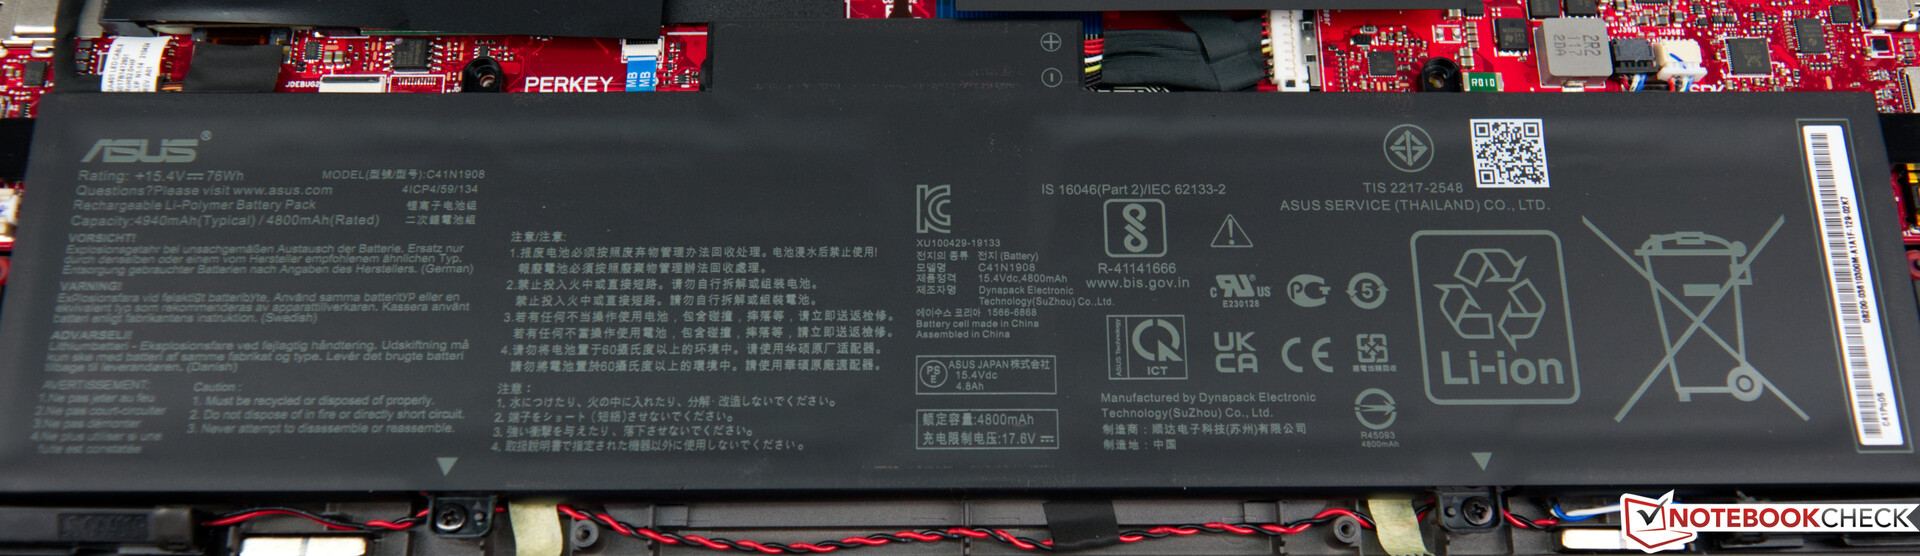
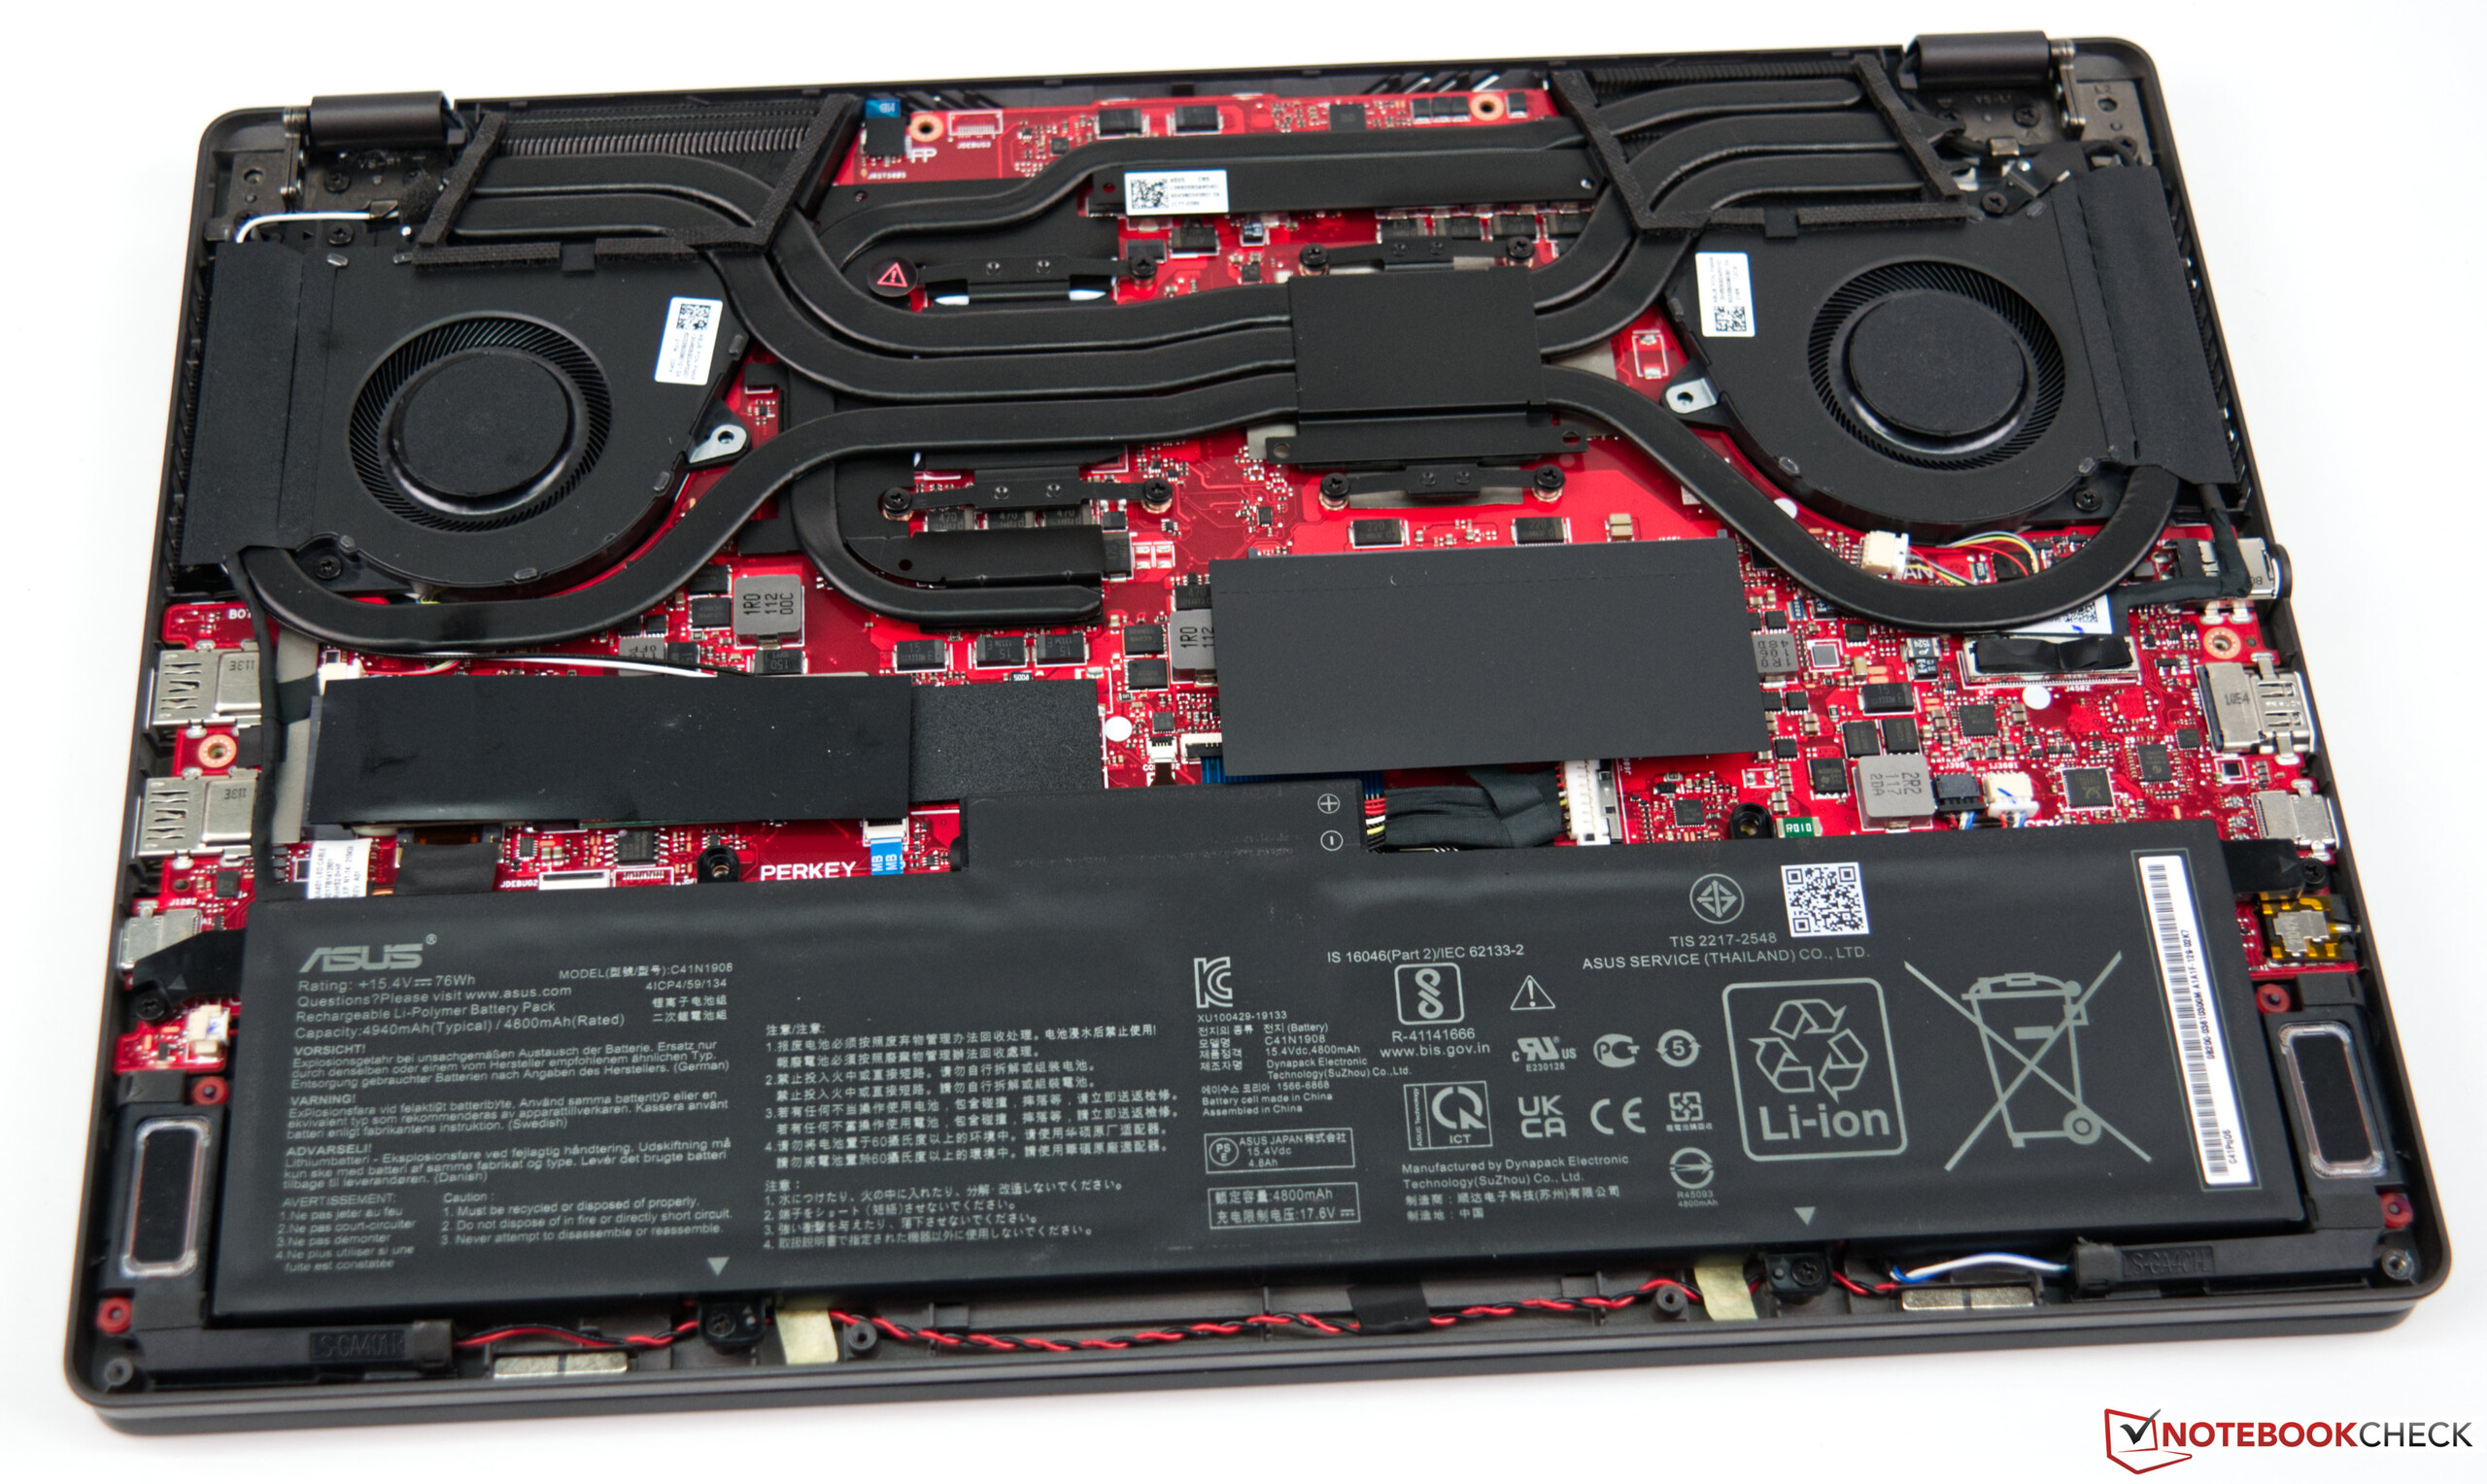
Battery life is usually a weakness in gaming laptops. The Zephyrus G14 is quite different: Our review sample can deliver very good results in all the tests related to battery runtimes. The 76 Wh battery supplies the device with energy for a good 11 hours in our real-world Wi-Fi test.
The brightness was reduced to 83% in order to achieve our standard value of 150 cd/m². Even an extended movie night is no problem for the Zephyrus G14.
Users who want to use the device for gaming on the move should keep in mind that both the CPU and GPU performance are somewhat throttled on battery power.
| Asus Zephyrus G14 GA401QEC R9 5900HS, GeForce RTX 3050 Ti Laptop GPU, 76 Wh | Asus Zephyrus G14 GA401QM R9 5900HS, GeForce RTX 3060 Laptop GPU, 76 Wh | Asus Zephyrus G14 GA401IV R9 4900HS, GeForce RTX 2060 Max-Q, 76 Wh | Razer Blade 14 Ryzen 9 RTX 3070 R9 5900HX, GeForce RTX 3070 Laptop GPU, 62 Wh | Schenker XMG Focus 15 i7-11800H, GeForce RTX 3050 Ti Laptop GPU, 49 Wh | MSI Katana GF66 11UG-220 i7-11800H, GeForce RTX 3070 Laptop GPU, 90 Wh | Acer Nitro 5 AN515-45-R1JH R7 5800H, GeForce RTX 3070 Laptop GPU, 57.5 Wh | Average of class Gaming | |
|---|---|---|---|---|---|---|---|---|
| Battery runtime | -11% | -16% | -38% | -66% | -54% | -49% | -39% | |
| Reader / Idle (h) | 19.1 | 21 10% | 19 -1% | 13.8 -28% | 6.5 -66% | 9.1 -52% | 9.2 -52% | 8.71 ? -54% |
| H.264 (h) | 10.3 | 6.9 -33% | 8.26 ? -20% | |||||
| WiFi v1.3 (h) | 11.2 | 11.8 5% | 9.6 -14% | 7.3 -35% | 3.9 -65% | 5.3 -53% | 5.7 -49% | 7.01 ? -37% |
| Load (h) | 2.7 | 1.4 -48% | 1.8 -33% | 1.3 -52% | 0.9 -67% | 1.2 -56% | 1 -63% | 1.47 ? -46% |


Pros
Cons
Verdict - Design highlights and good performance
The Asus Zephyrus G14 is a real eye-catcher in the Special Edition with the Alan Walker design, and it draws attention to itself even when it's turned off. When in use, the 1,215 AniMe matrix LEDs provide another highlight on the display lid. This is a great gimmick, but it's not visible to the user and can therefore be quickly forgotten.
The sturdy hood houses a solid combination of a fast AMD SoC and a dedicated Nvidia graphics card. The octa-core Ryzen processor was able to deliver a good performance in the test. The Ryzen 9 5900HS was no worse than the comparison devices with current Intel processors. The GeForce RTX 3050 Ti laptop GPU is the smallest mobile RTX graphics card. Nevertheless, modern games can be played smoothly with it.
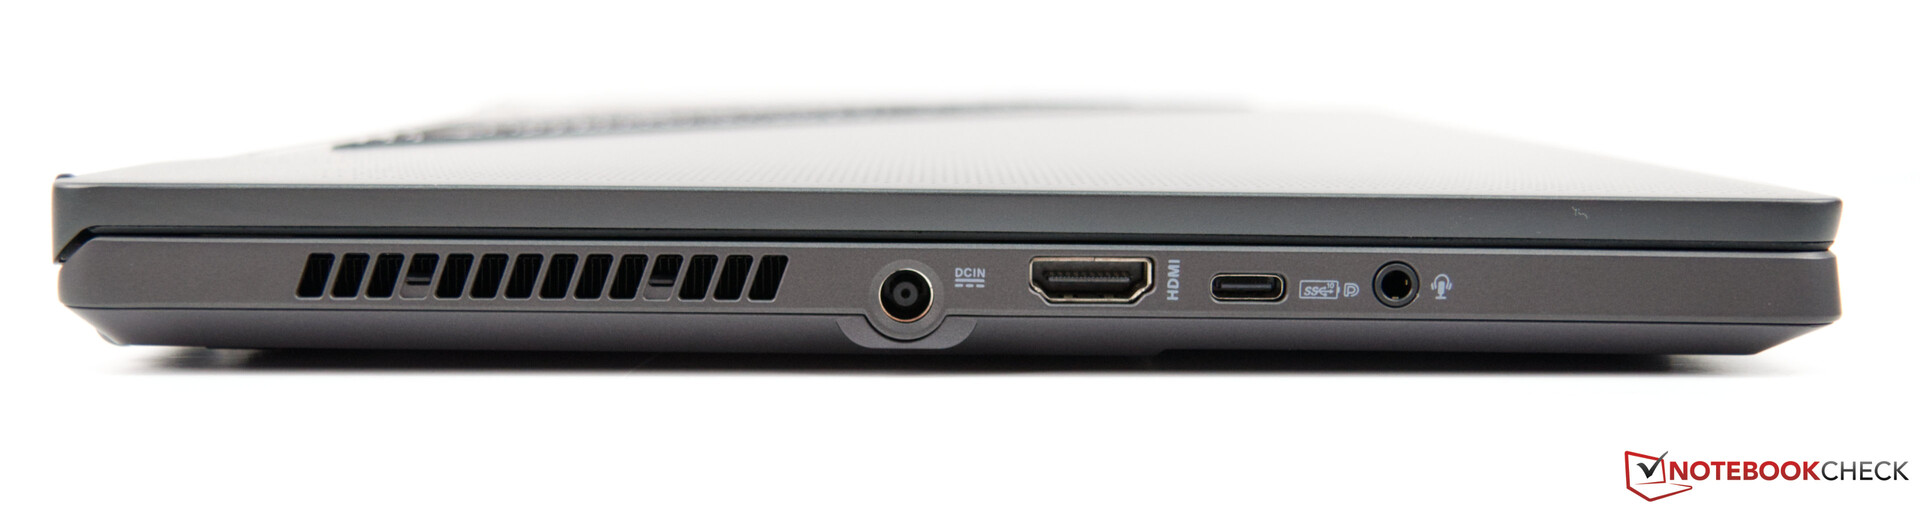
The built-in display is good, and it offers an equally good color-space coverage. Nevertheless, the brightness could've been a bit better. Overall, the WQHD display is a very good alternative to the Full HD panel of the Zephyrus G14, which we recently reviewed as well. There's nothing to complain about in terms of build quality. However, the available connectivity could definitely become a problem, because the two existing USB Type-A ports can be occupied quickly. There are still two Type-C ports, though, one of which also offers additional features like DisplayPort and Power Delivery. The lack of a card reader or webcam are aspects that users will have to put up with when buying the Zephyrus G14.
The Asus Zephyrus G14 Alan Walker Special Edition catches the eye thanks to its 1,215 AniMe matrix LEDs.
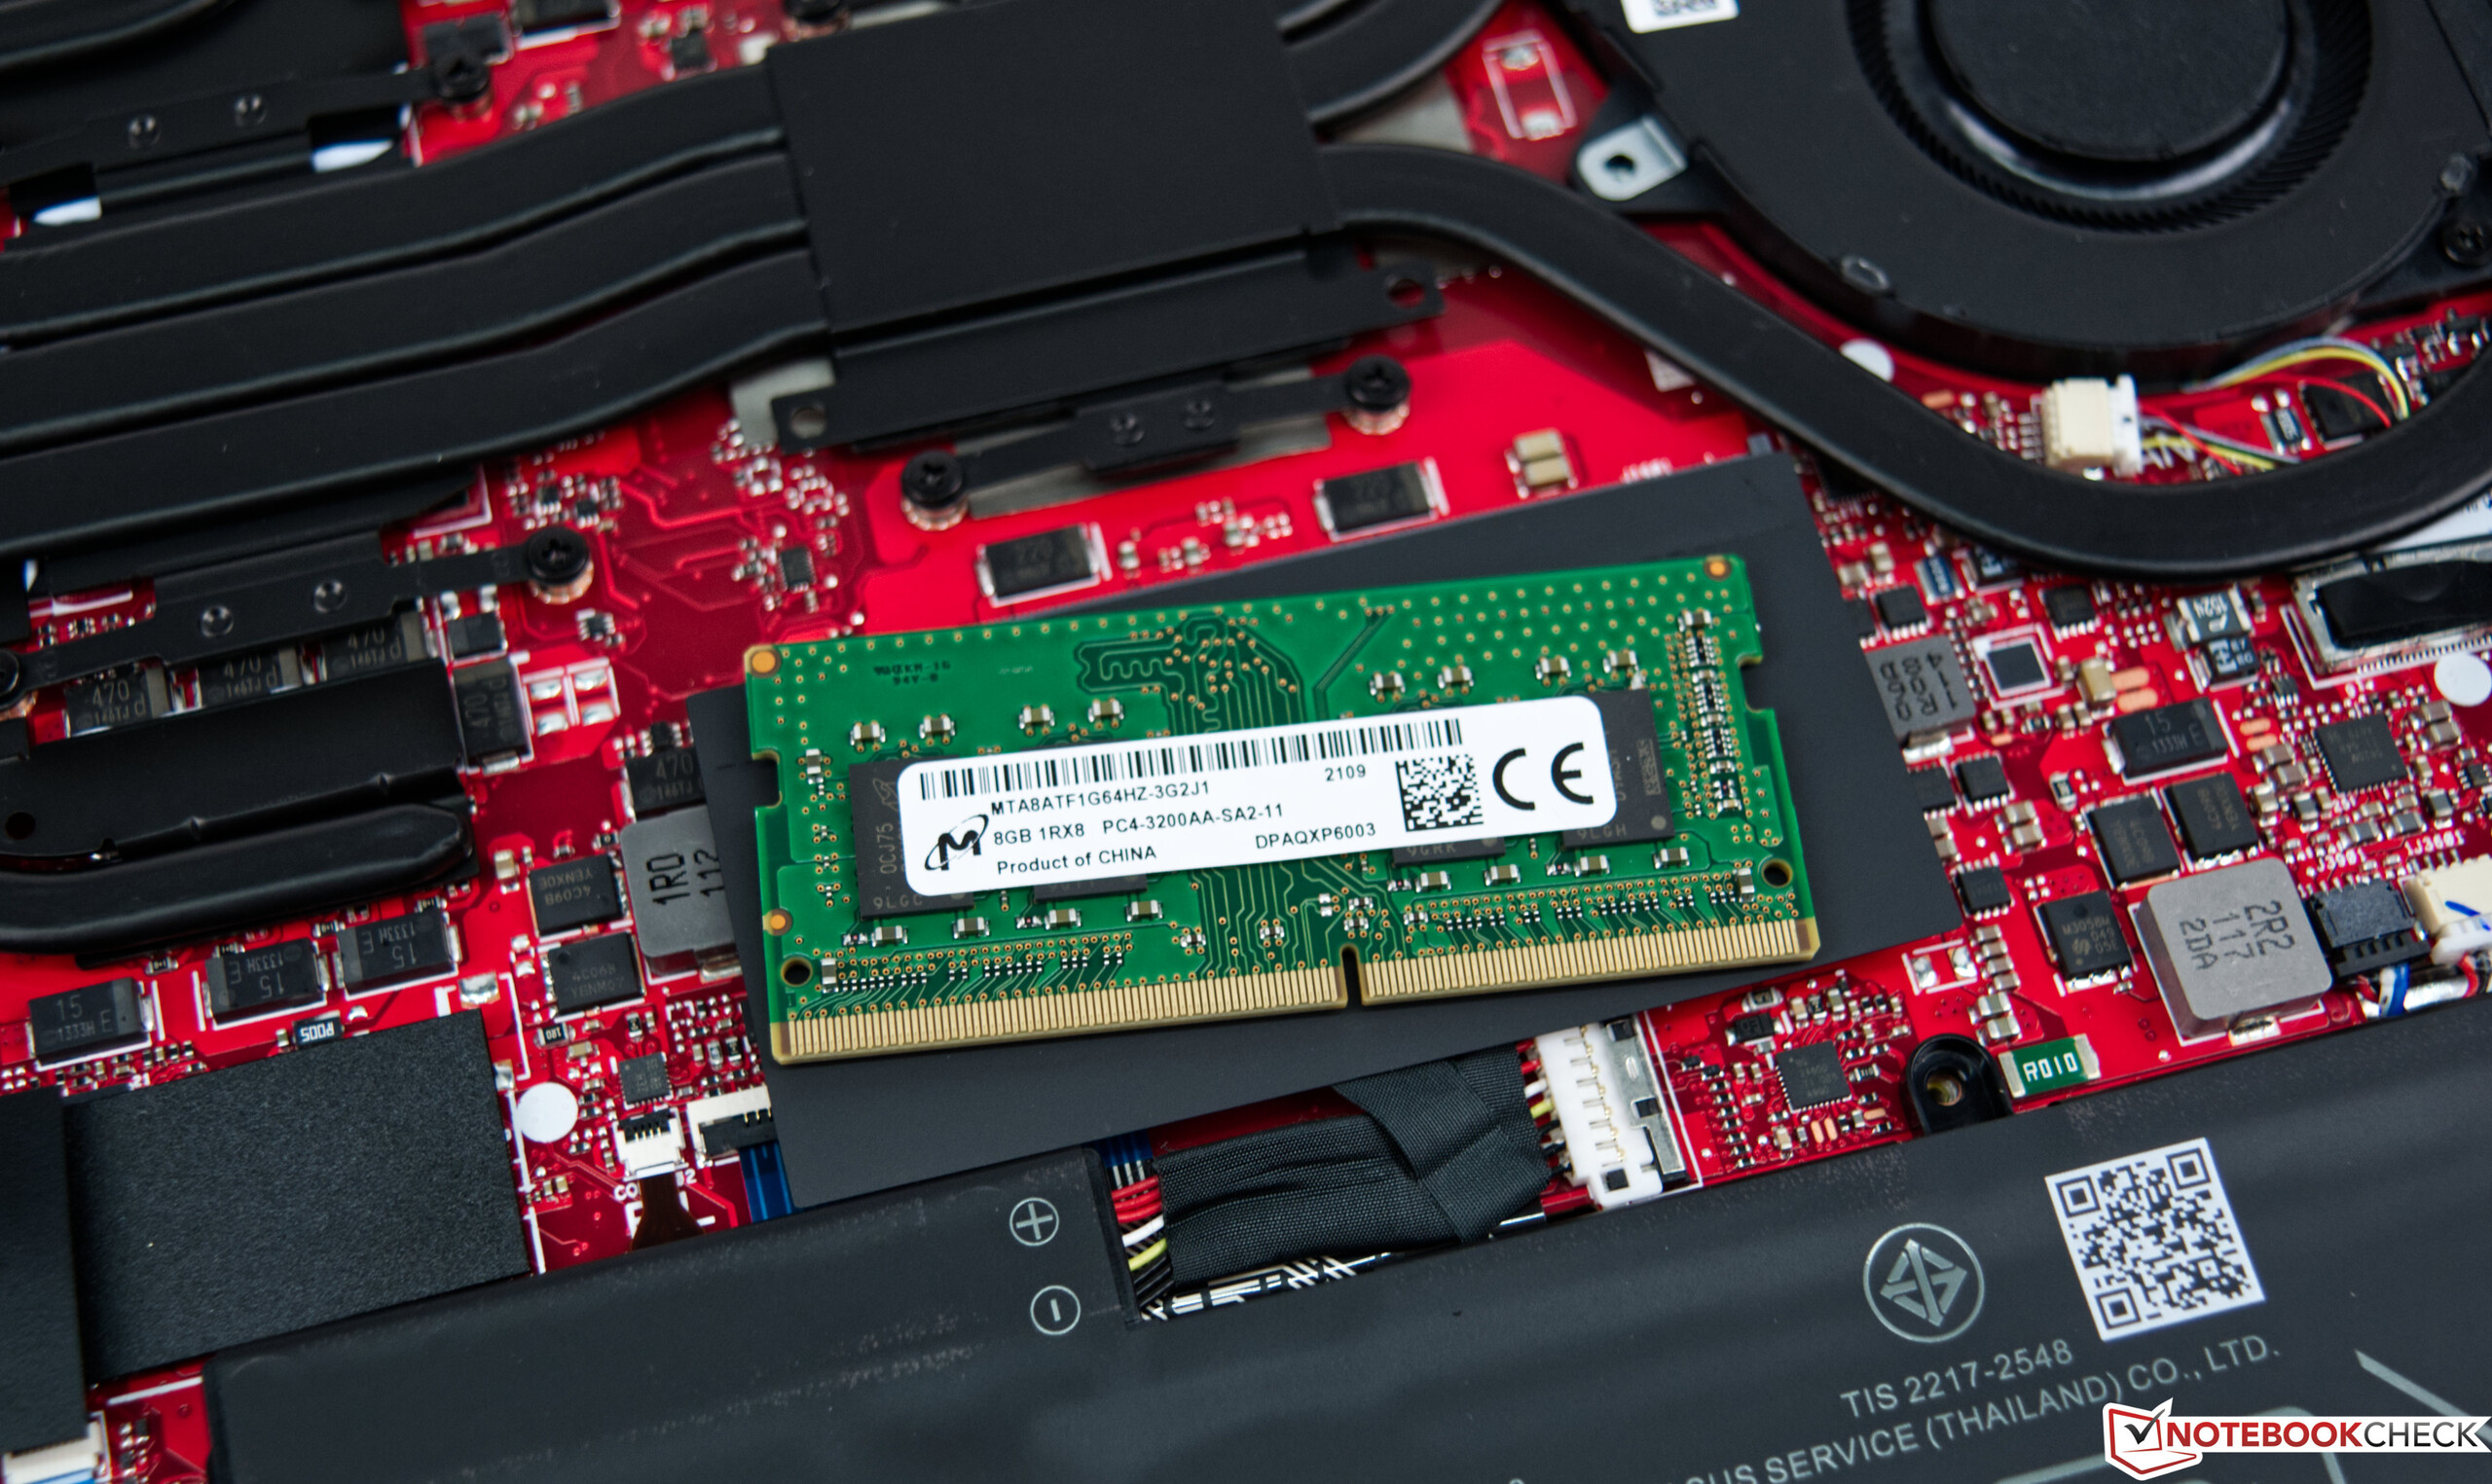
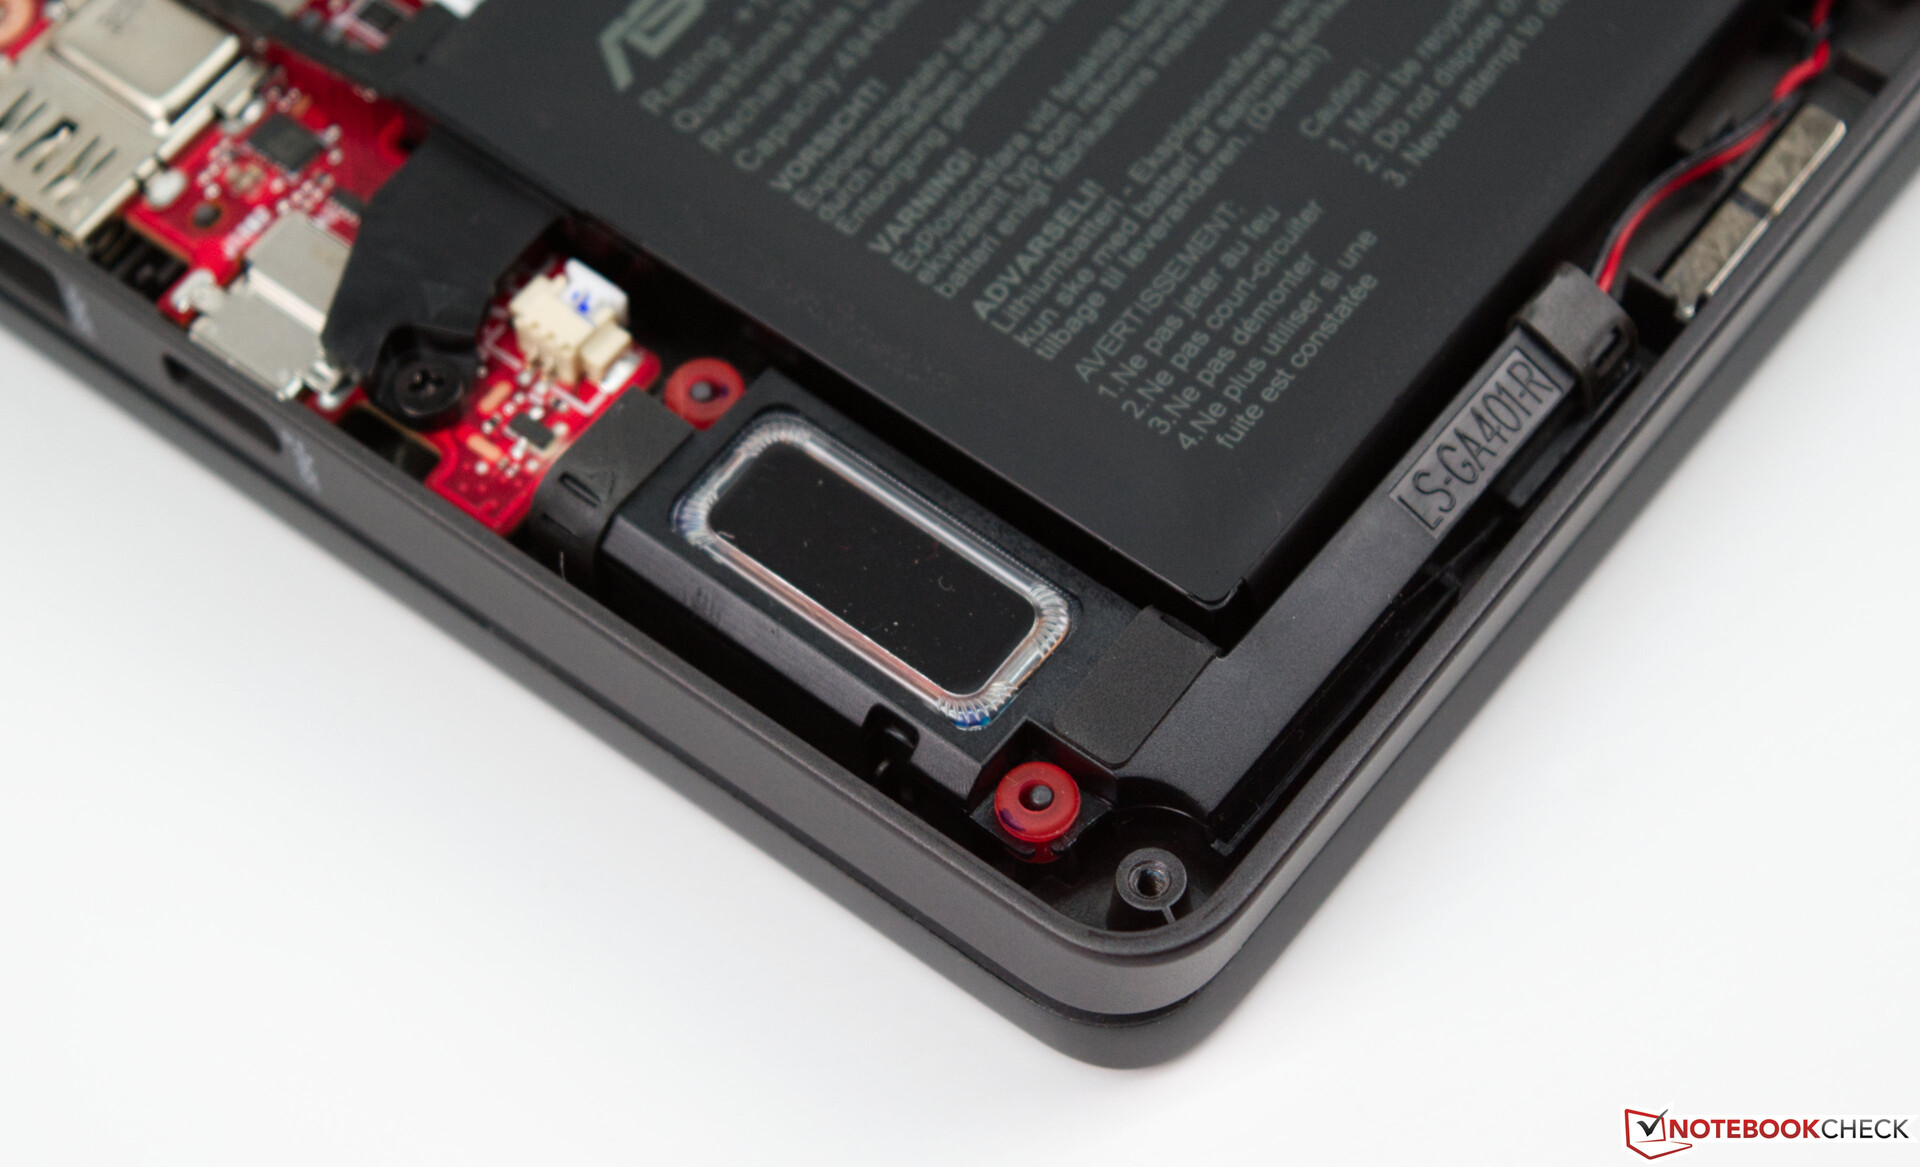
With the Zephyrus G14, Asus offers a very enduring device, which is rather rare in gaming laptops. RAM can be expanded, but we would have liked to see the option of adding another mass storage device.
If you're looking for alternatives in the 14-inch gaming laptop segment, you don't have many choices, unfortunately. The Asus Zephyrus G14 with the RTX 3060 laptop GPU should be mentioned here. It offers a better GPU performance, but you have to give up the special Alan Walker design. The Razer Blade 14 is also another modern 14-inch gaming laptop with a recent Ryzen CPU and an RTX 3070 laptop GPU under the hood.
Price and availability
At the time of writing, the Asus Zephyrus G14 Alan Walker Special Edition is available directly from the manufacturer. There's only one configuration option (the same as in our review), and it's priced at $1,999.99.
Asus Zephyrus G14 GA401QEC
- 10/08/2021 v7 (old)
Sebastian Bade
Price comparison

