

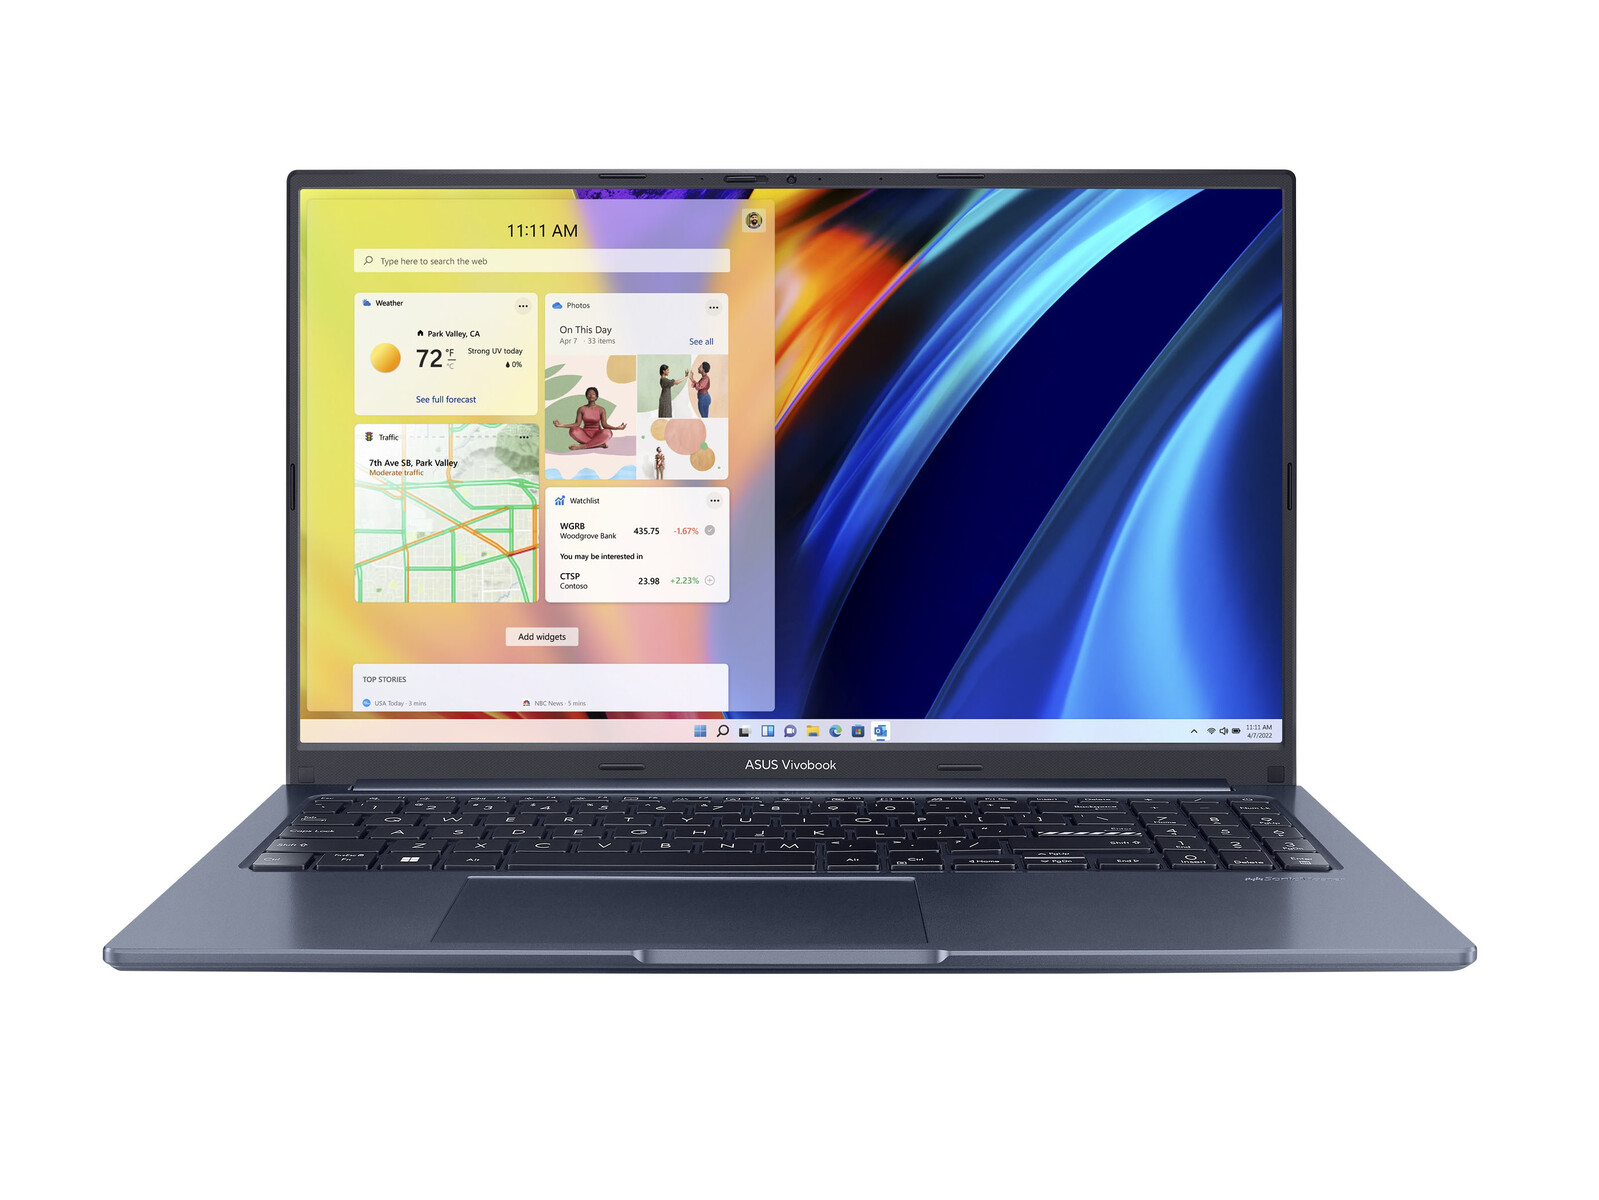
1080p OLED for the masses: Asus VivoBook 15X M1503QA laptop review
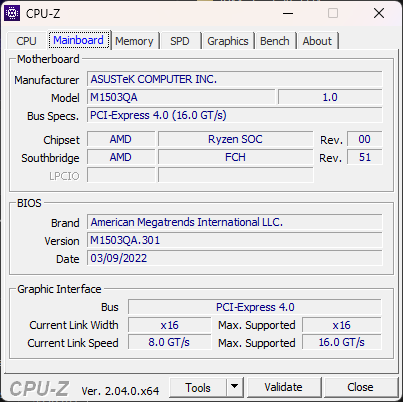
Not to be confused with the VivoBook 15, VivoBook 15 OLED, VivoBook 15 Pro, or VivoBook S15, the VivoBook 15 X OLED is yet another 15.6-inch entry to the confusingly expansive VivoBook family. It sports a different chassis alongside a different set of ports than the aforementioned models while still sharing many similar features. VivoBook models tend to be more affordable than the all-metal and more luxurious ZenBook series.
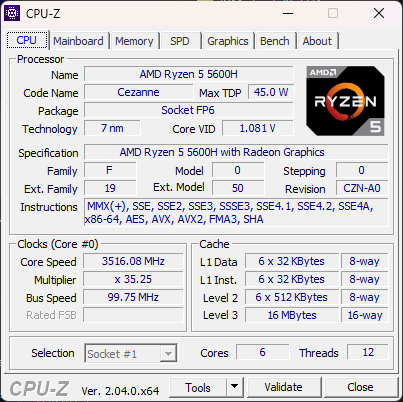
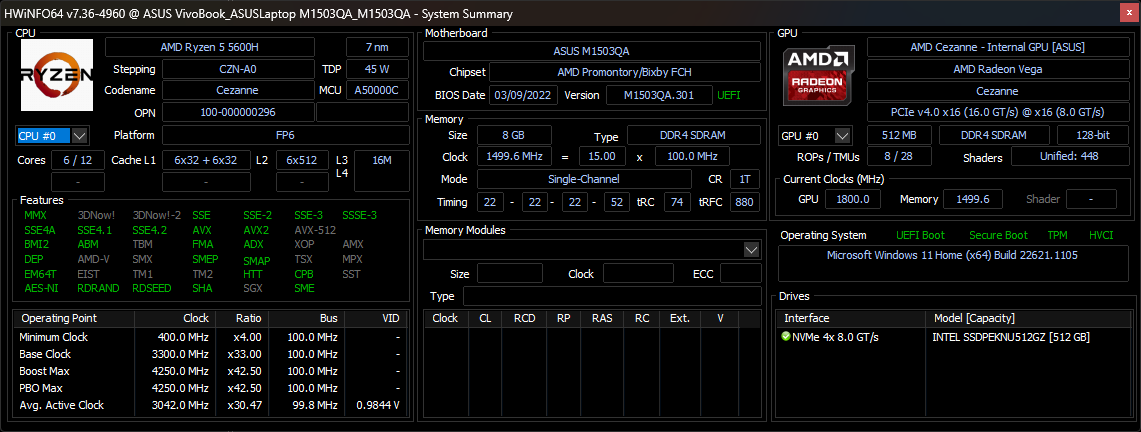
Our unit in review is a lower-end configuration with the Ryzen 5 5600H CPU, 8 GB of RAM, 512 GB SSD, and 15.6-inch 1080p OLED display for a retail price of approximately $700 USD or less when on sale. Higher-end SKUs are available with the faster Ryzen 7 5800H and denser 2.8K (1620p) OLED display for $900. The standard VivoBook 15 model sports slower U-series CPUs in comparison.
Competitors to the VivoBook 15 X OLED include other budget-to-midrange multimedia clamshells like the Dell Inspiron 15 3501, Lenovo IdeaPad 3 15, MSI Modern 15, or the HP Pavilion 15.
More Asus reviews:
Potential Competitors in Comparison
Rating | Date | Model | Weight | Height | Size | Resolution | Price |
|---|---|---|---|---|---|---|---|
| 83.1 % v7 (old) | 02 / 2023 | Asus VivoBook 15 X M1503QA R5 5600H, Vega 7 | 1.7 kg | 19.9 mm | 15.60" | 1920x1080 | |
| 80.6 % v7 (old) | 11 / 2021 | Asus Vivobook 15 K513EQ i7-1165G7, GeForce MX350 | 1.6 kg | 17.9 mm | 15.60" | 1920x1080 | |
| 82.1 % v7 (old) | 07 / 2021 | Asus VivoBook S15 D533UA R7 5700U, Vega 8 | 1.8 kg | 16.1 mm | 15.60" | 1920x1080 | |
| 87 % v7 (old) | 12 / 2020 | Asus ZenBook UX535-M01440 i7-10750H, GeForce GTX 1650 Ti Max-Q | 2 kg | 20 mm | 15.60" | 3840x2160 | |
| 85.1 % v7 (old) | 11 / 2022 | Lenovo ThinkBook 15 G3 ACL 21A400B2GE R5 5500U, Vega 7 | 1.7 kg | 18.9 mm | 15.60" | 1920x1080 | |
| 80.5 % v7 (old) | 10 / 2021 | Dell Inspiron 15 3501 i7-1165G7, Iris Xe G7 96EUs | 2 kg | 19.9 mm | 15.60" | 1920x1080 |
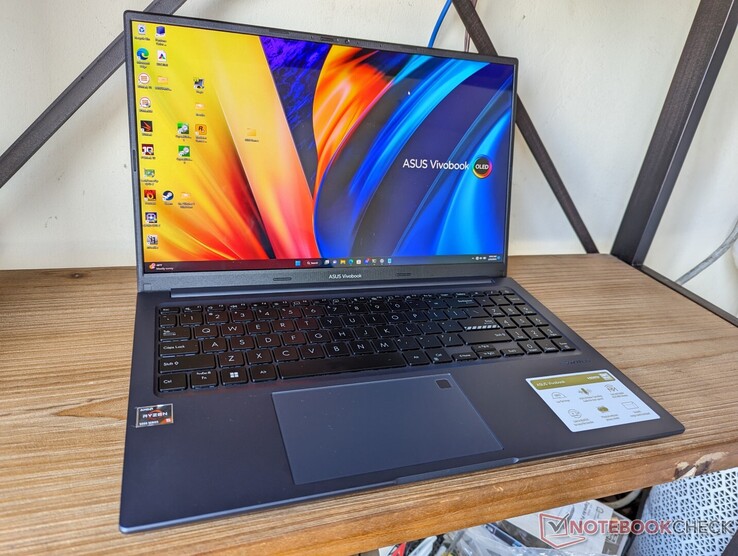
Case — Several Exterior Changes
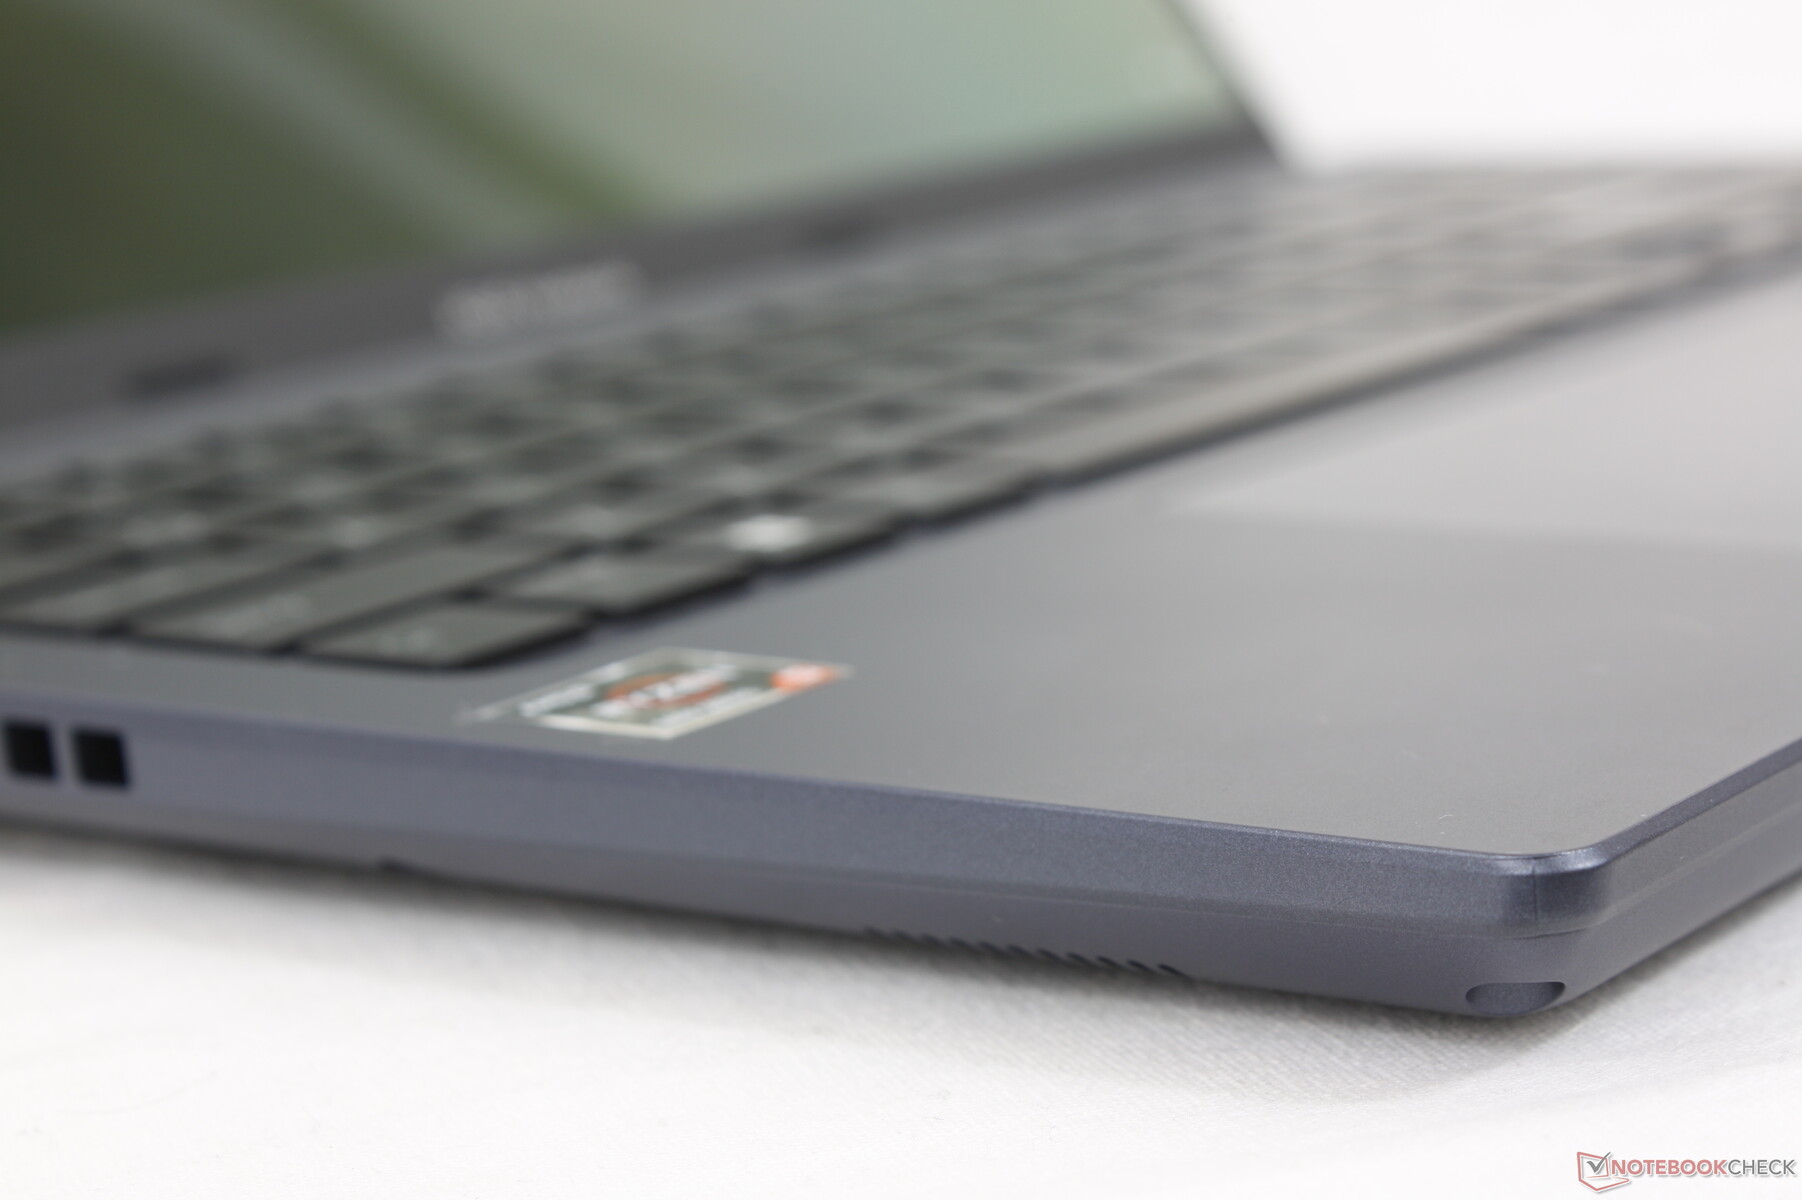
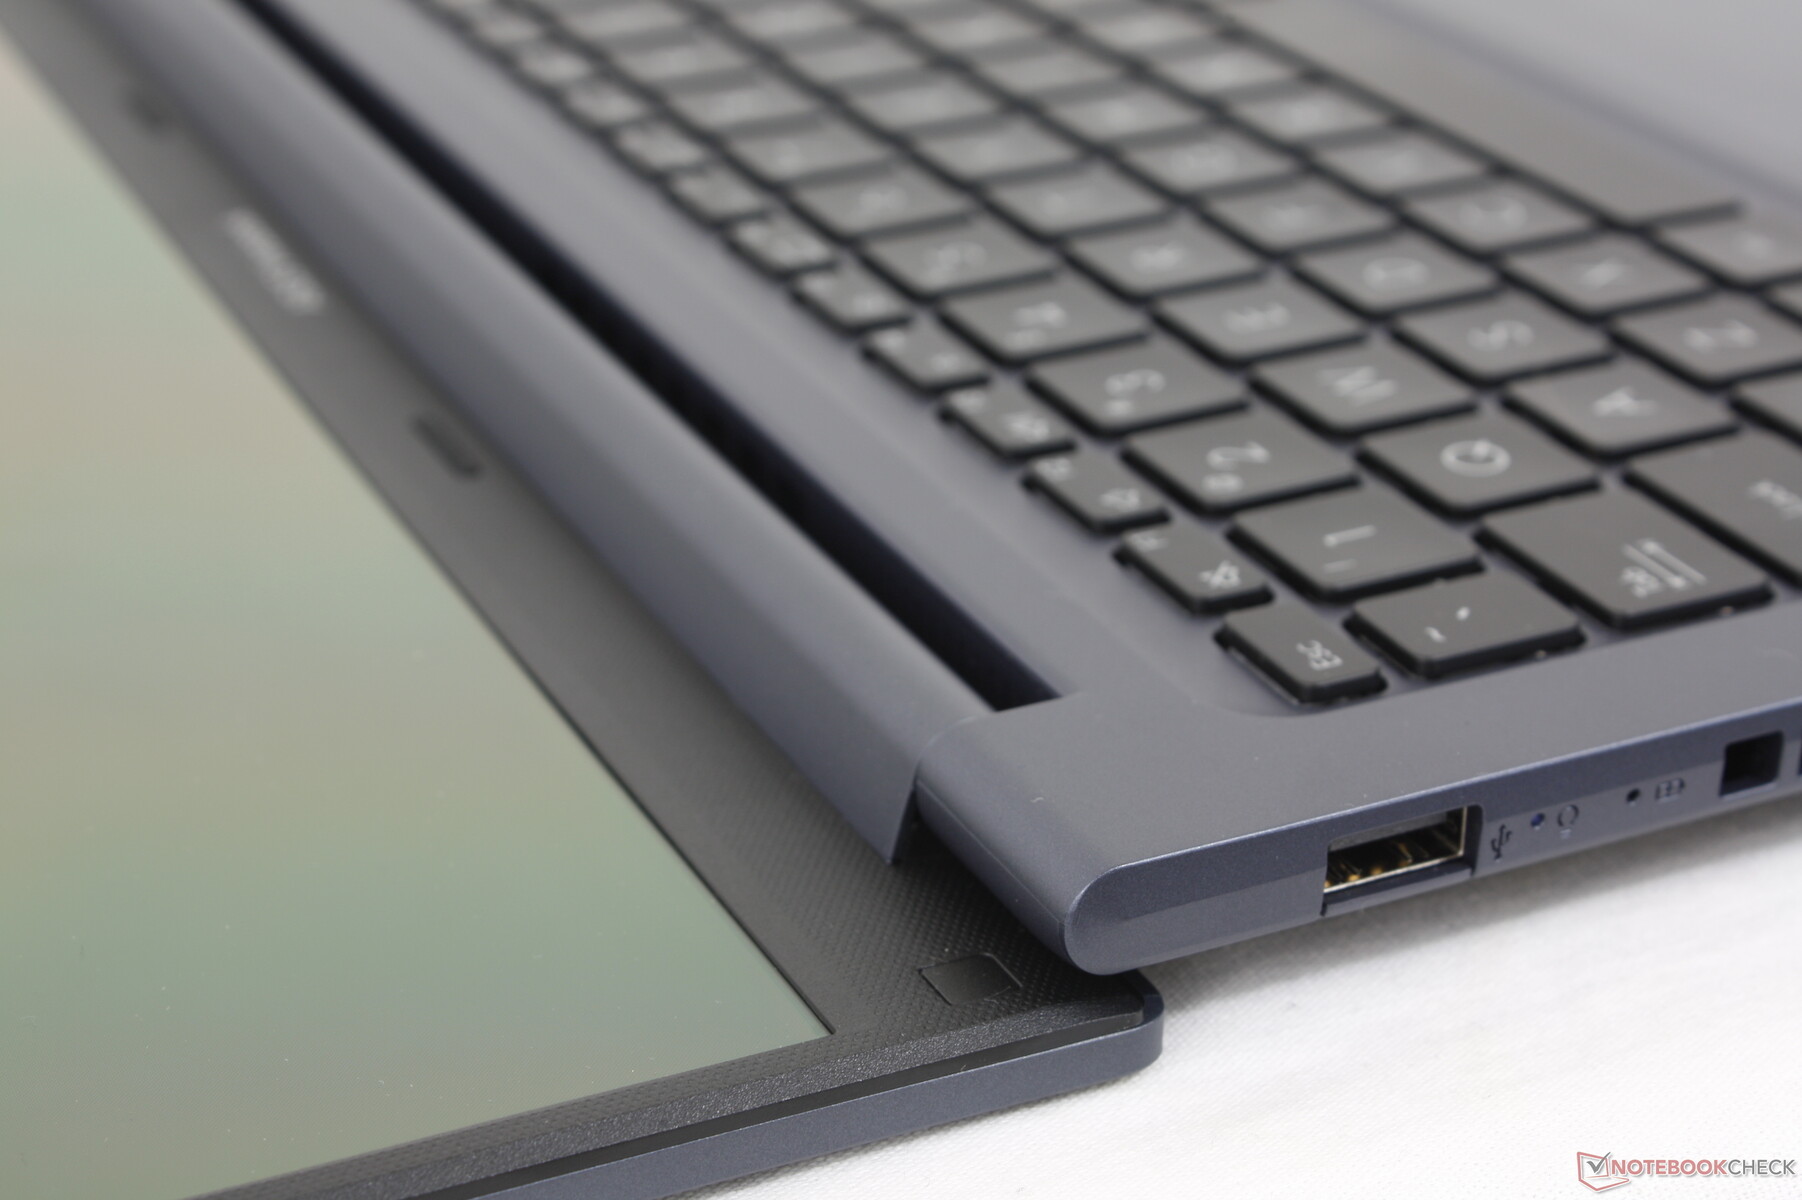
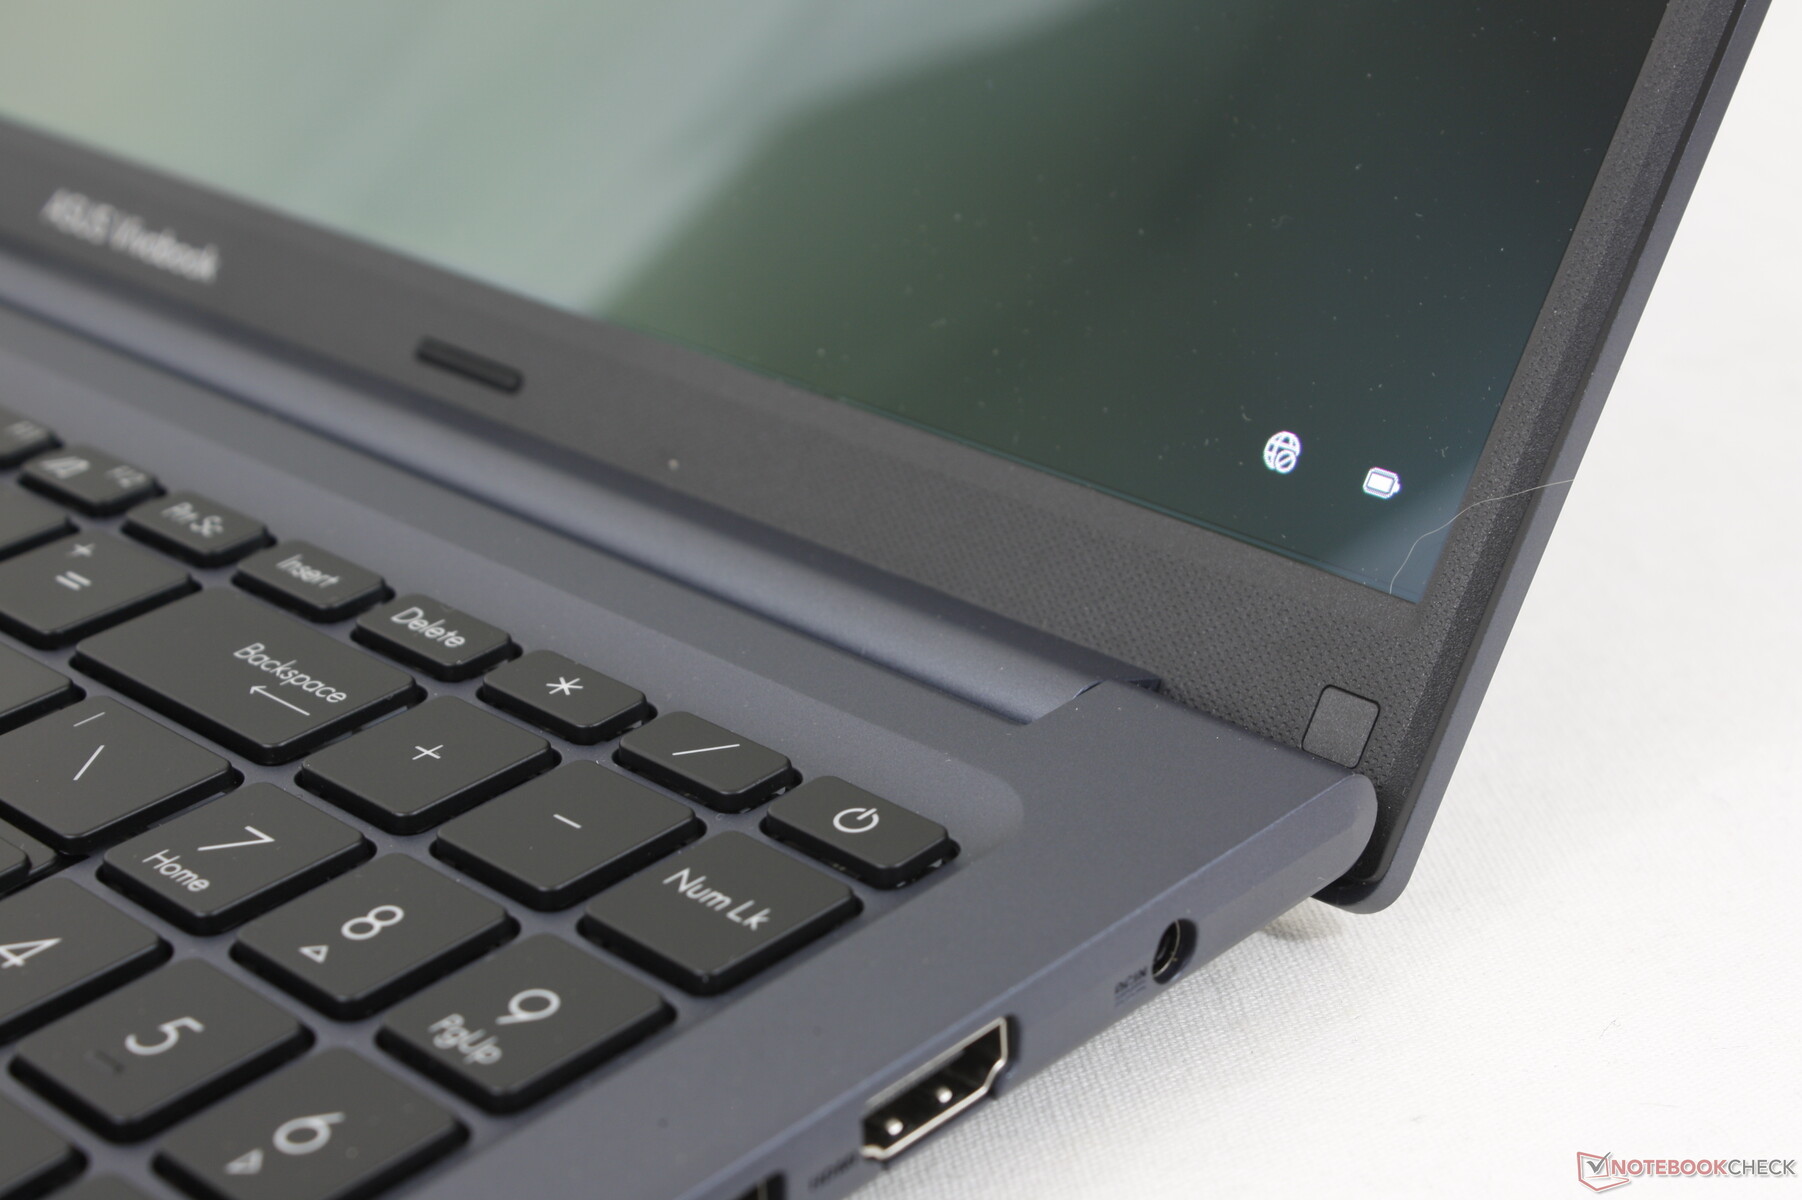
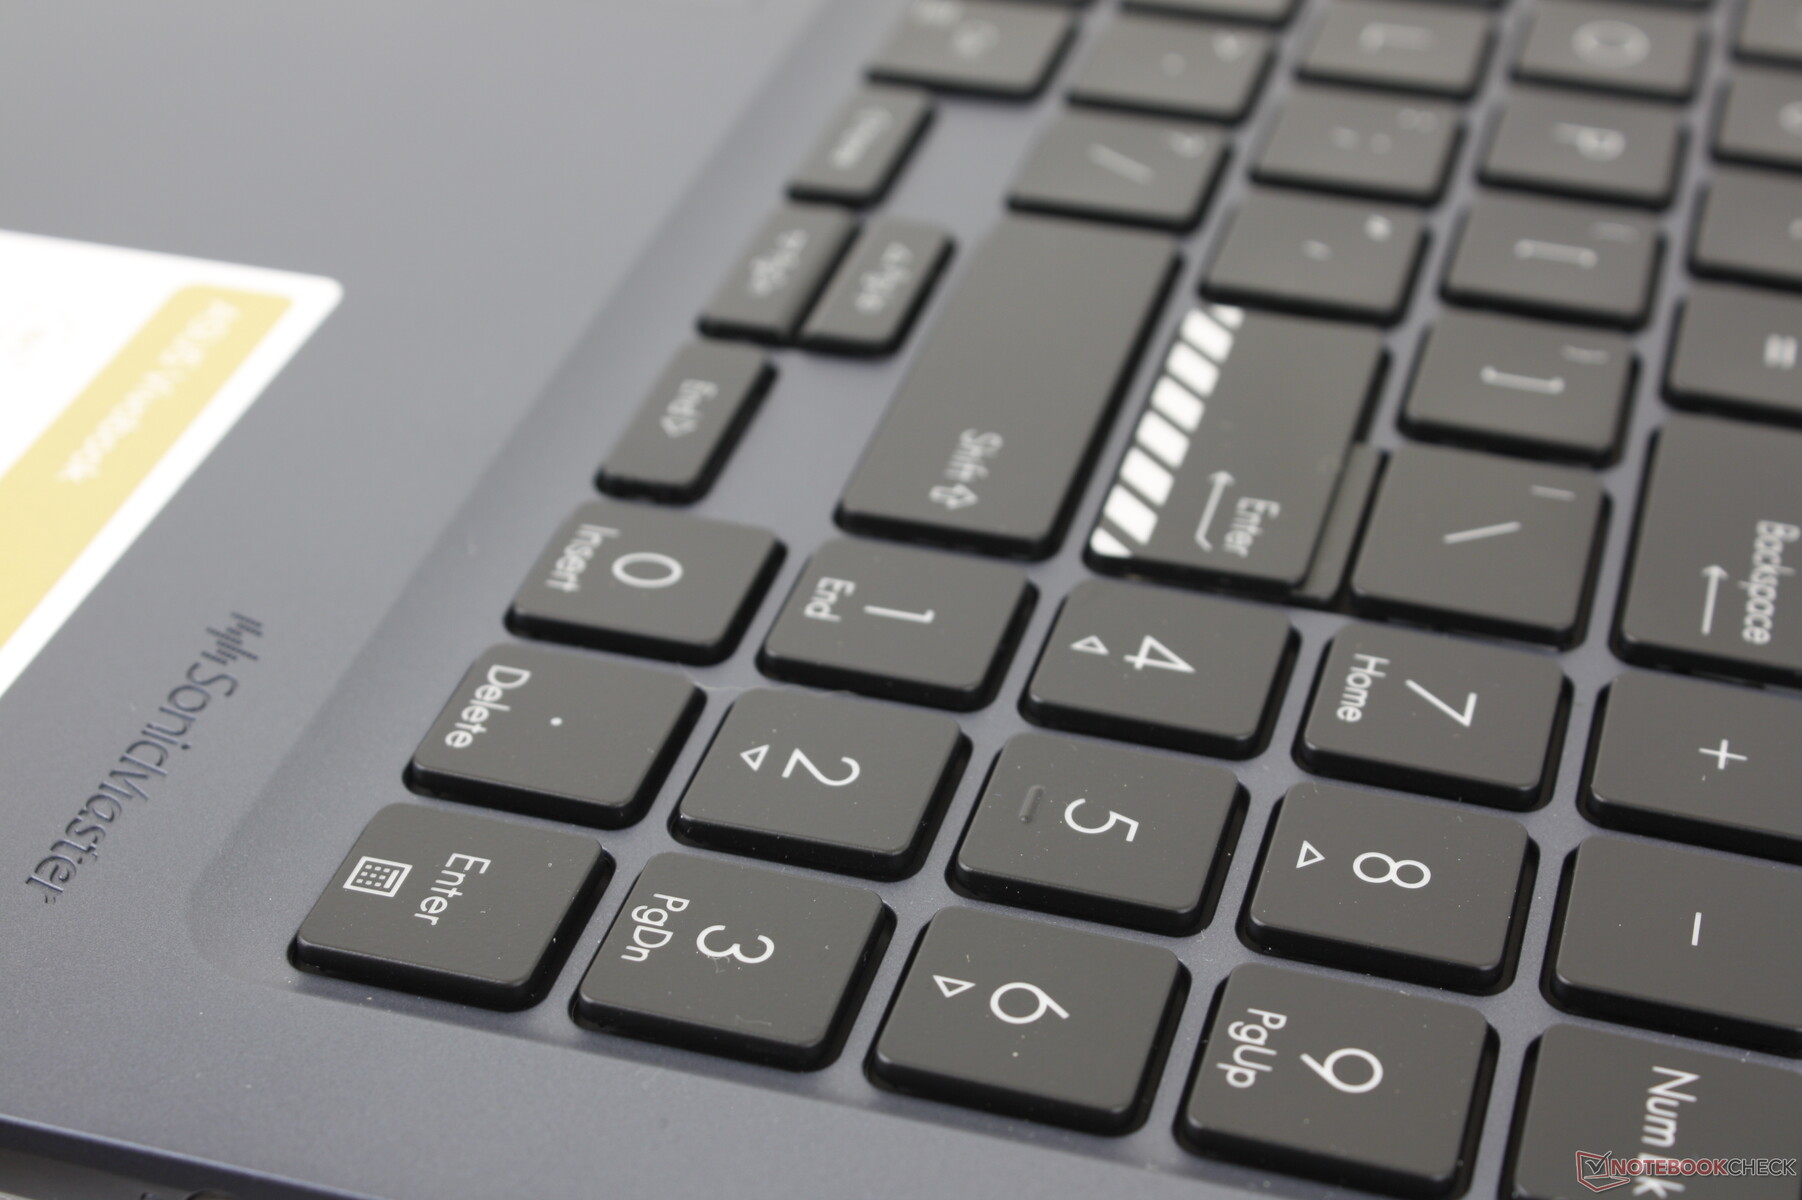
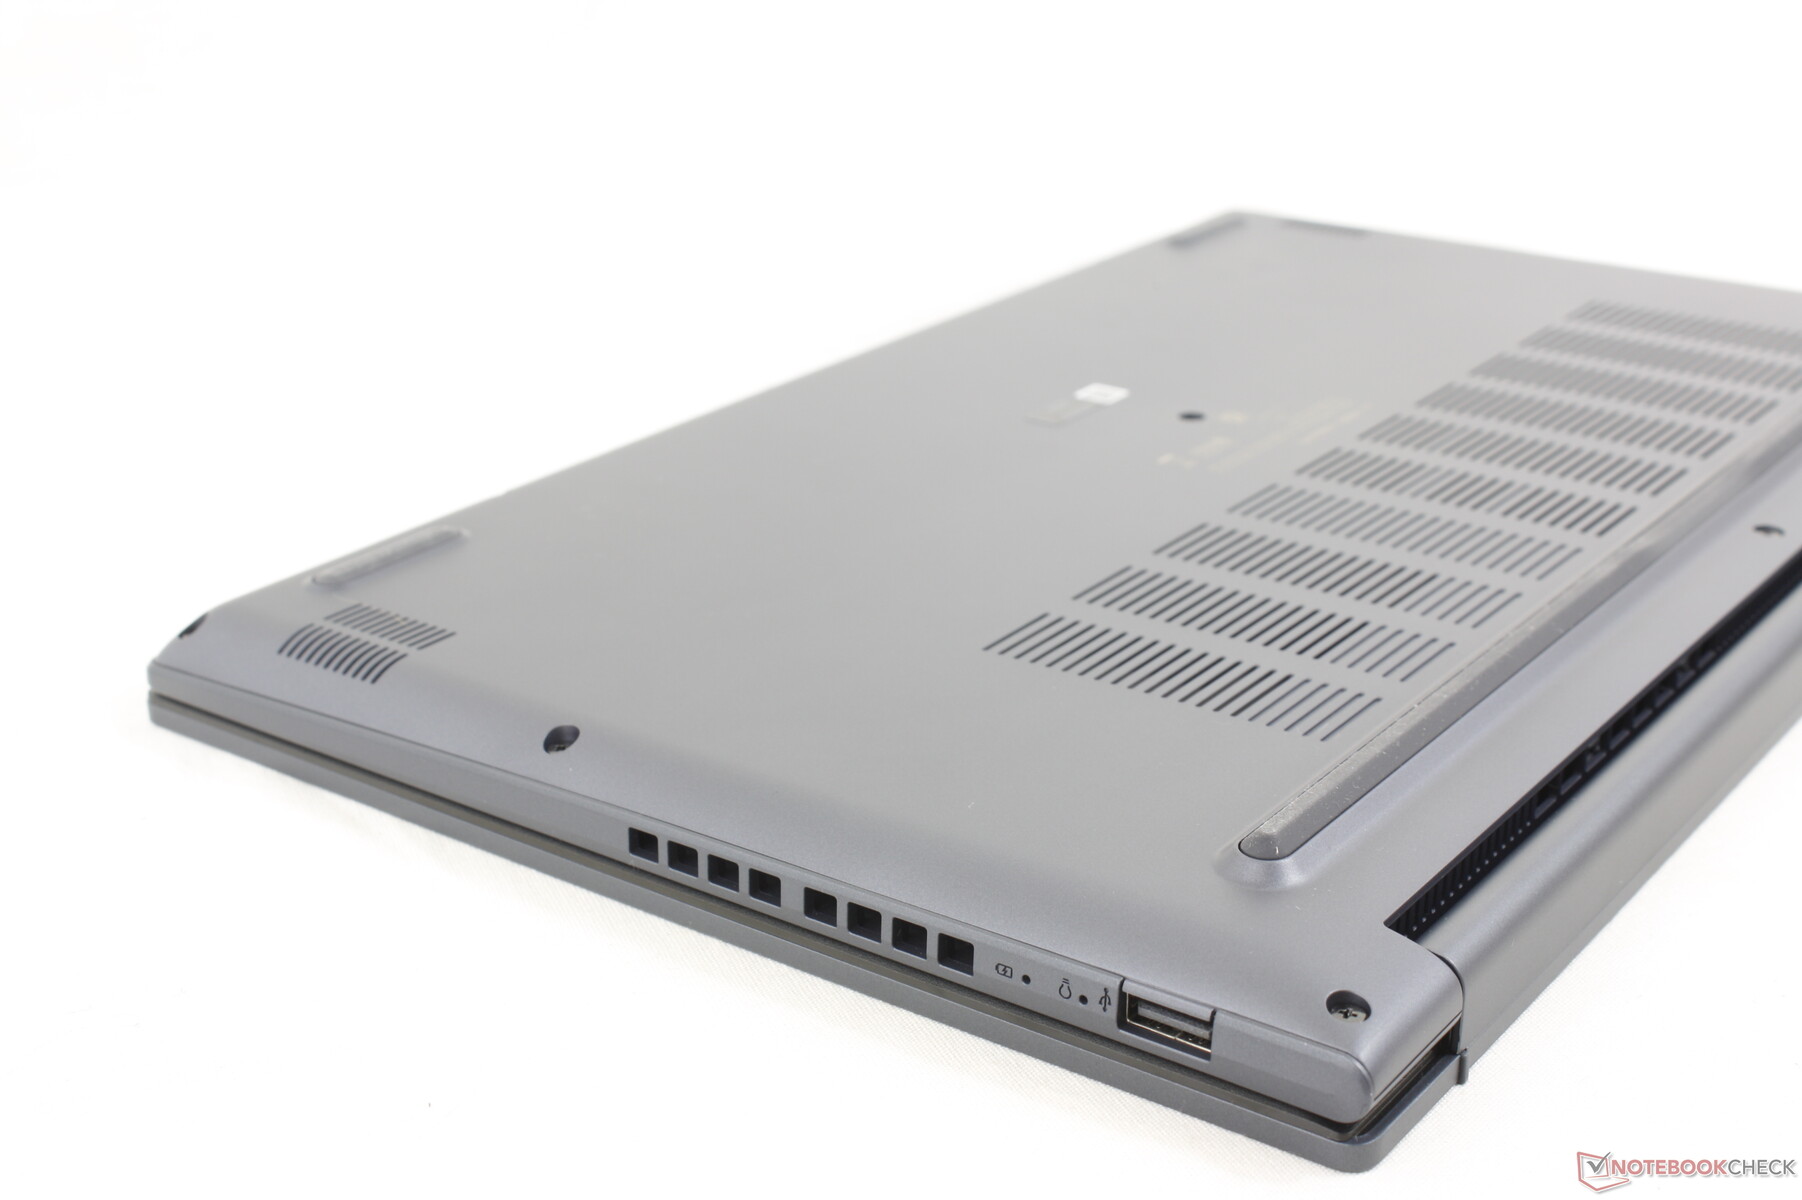
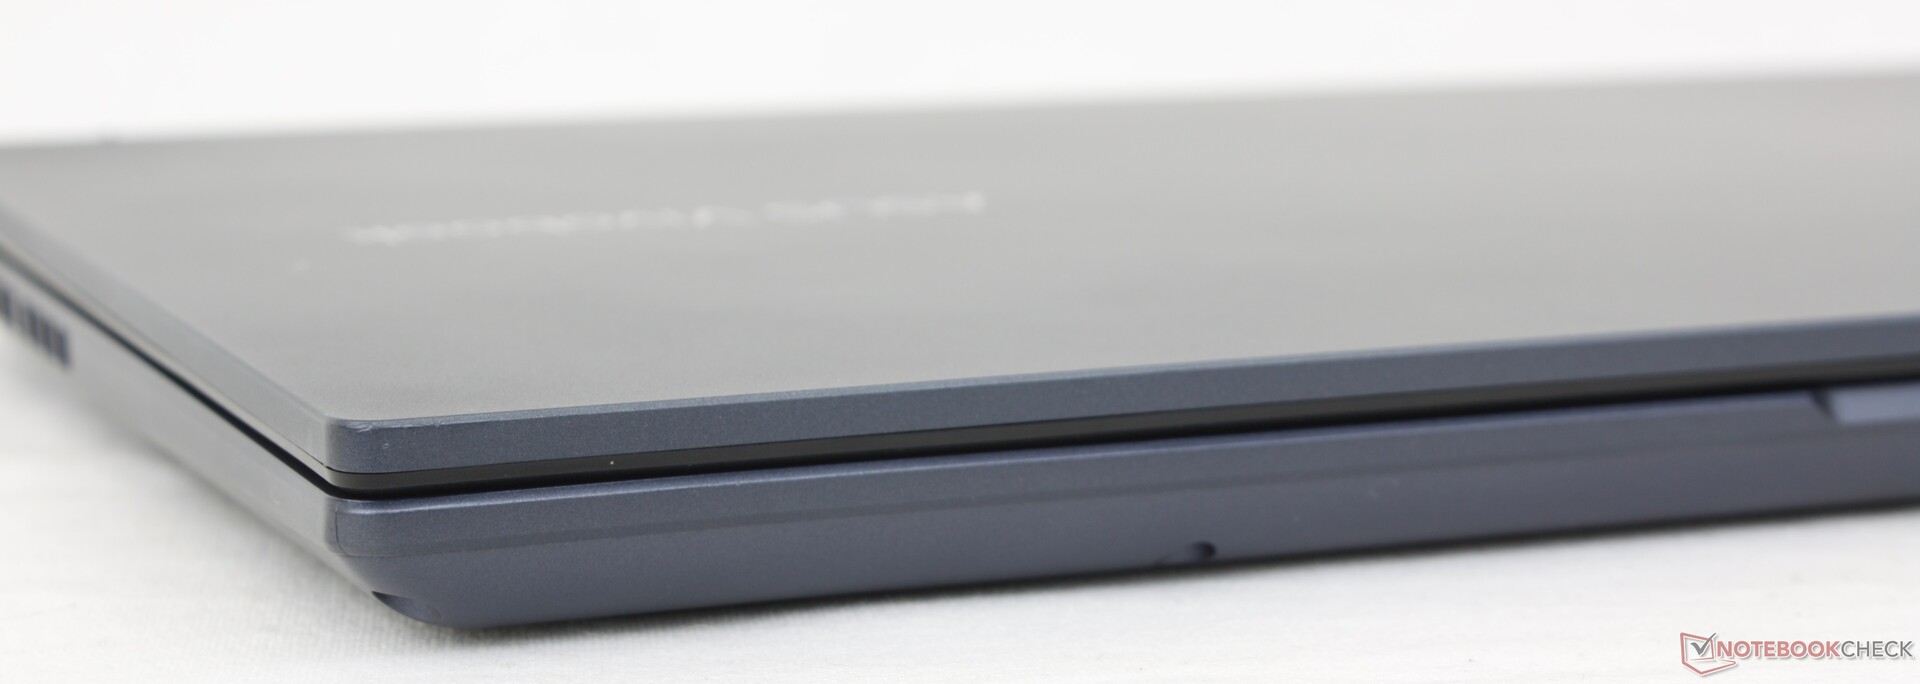
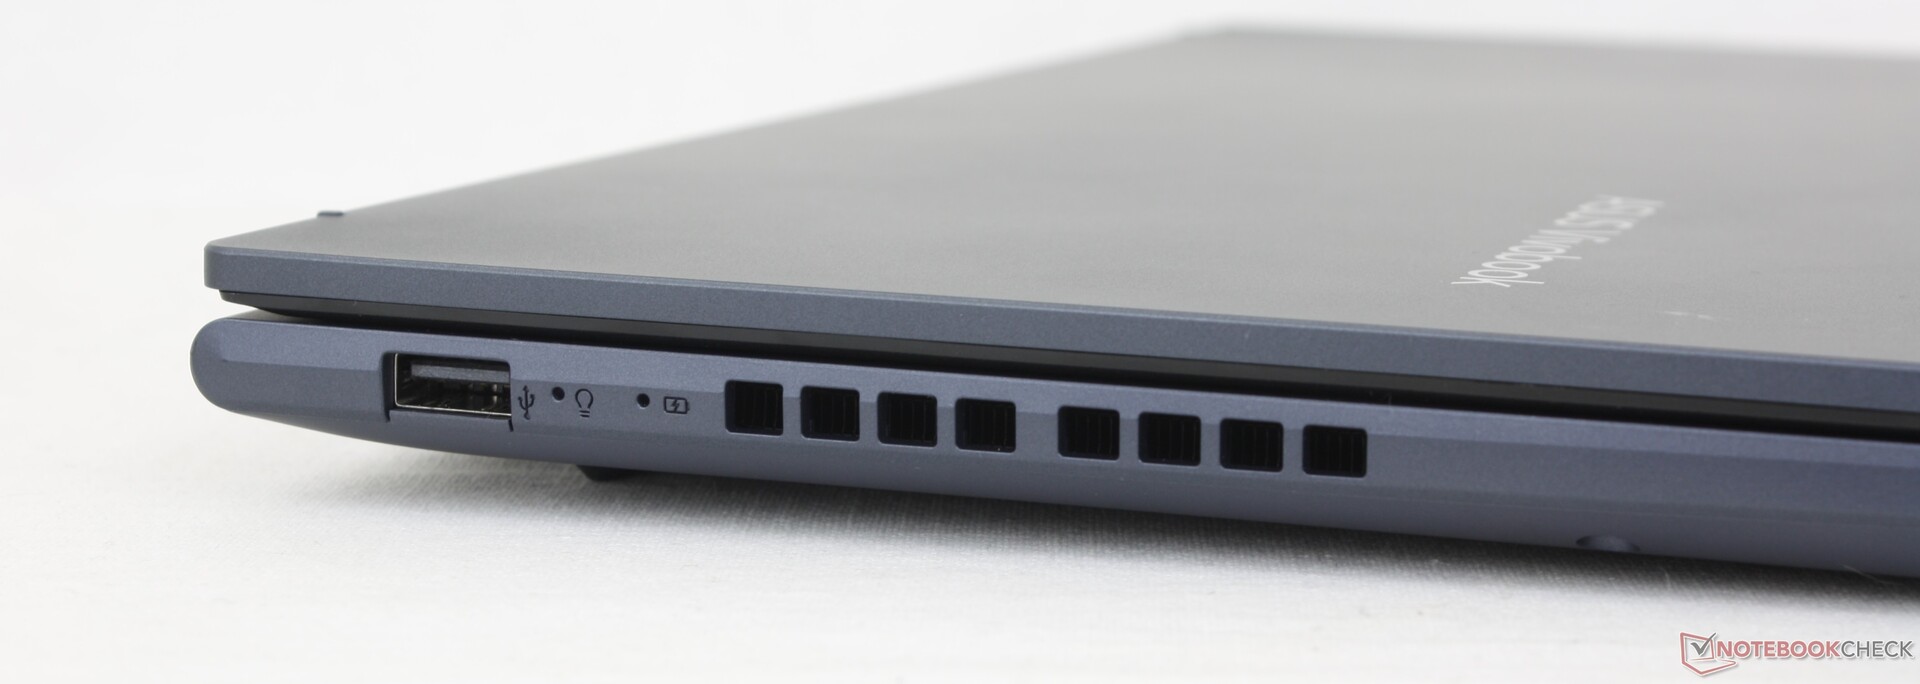
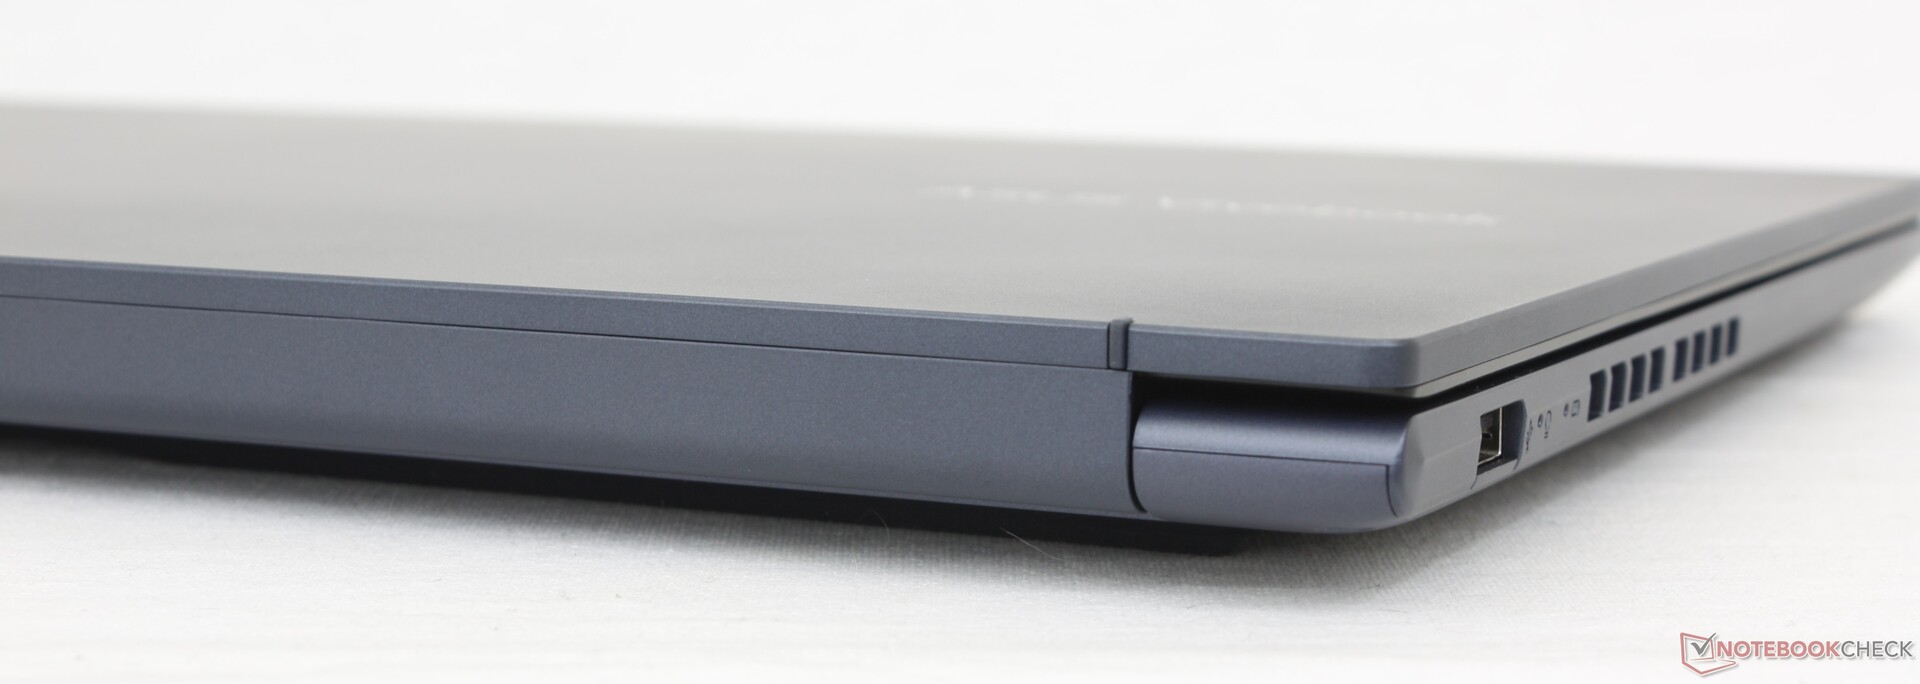
The VivoBook 15X OLED utilizes the same metal outer lid and plastic base materials as on the regular VivoBook 15 but with several design updates. Firstly, the Harman/Kardon logo on the right palm rest has been replaced with SonicMaster. Secondly, the clickpad and keyboard deck are larger and more defined, respectively. Thirdly, the bezels on all four sides have been reduced for a slightly smaller footprint despite the faster Ryzen H-series CPU in our model. And lastly, the left edge includes new ventilation grilles alongside rearranged ports. The two models may look similar at first glance, but the changes are not insignificant once you look closer.
Chassis rigidity remains otherwise the same as on the standard VivoBook 15. The base is more susceptible to twisting and flexing than on the pricier ZenBook or Dell XPS series. The OLED screen and lid are especially prone to flexing since there is no Gorilla Glass reinforcement. This is a budget Asus laptop, after all.
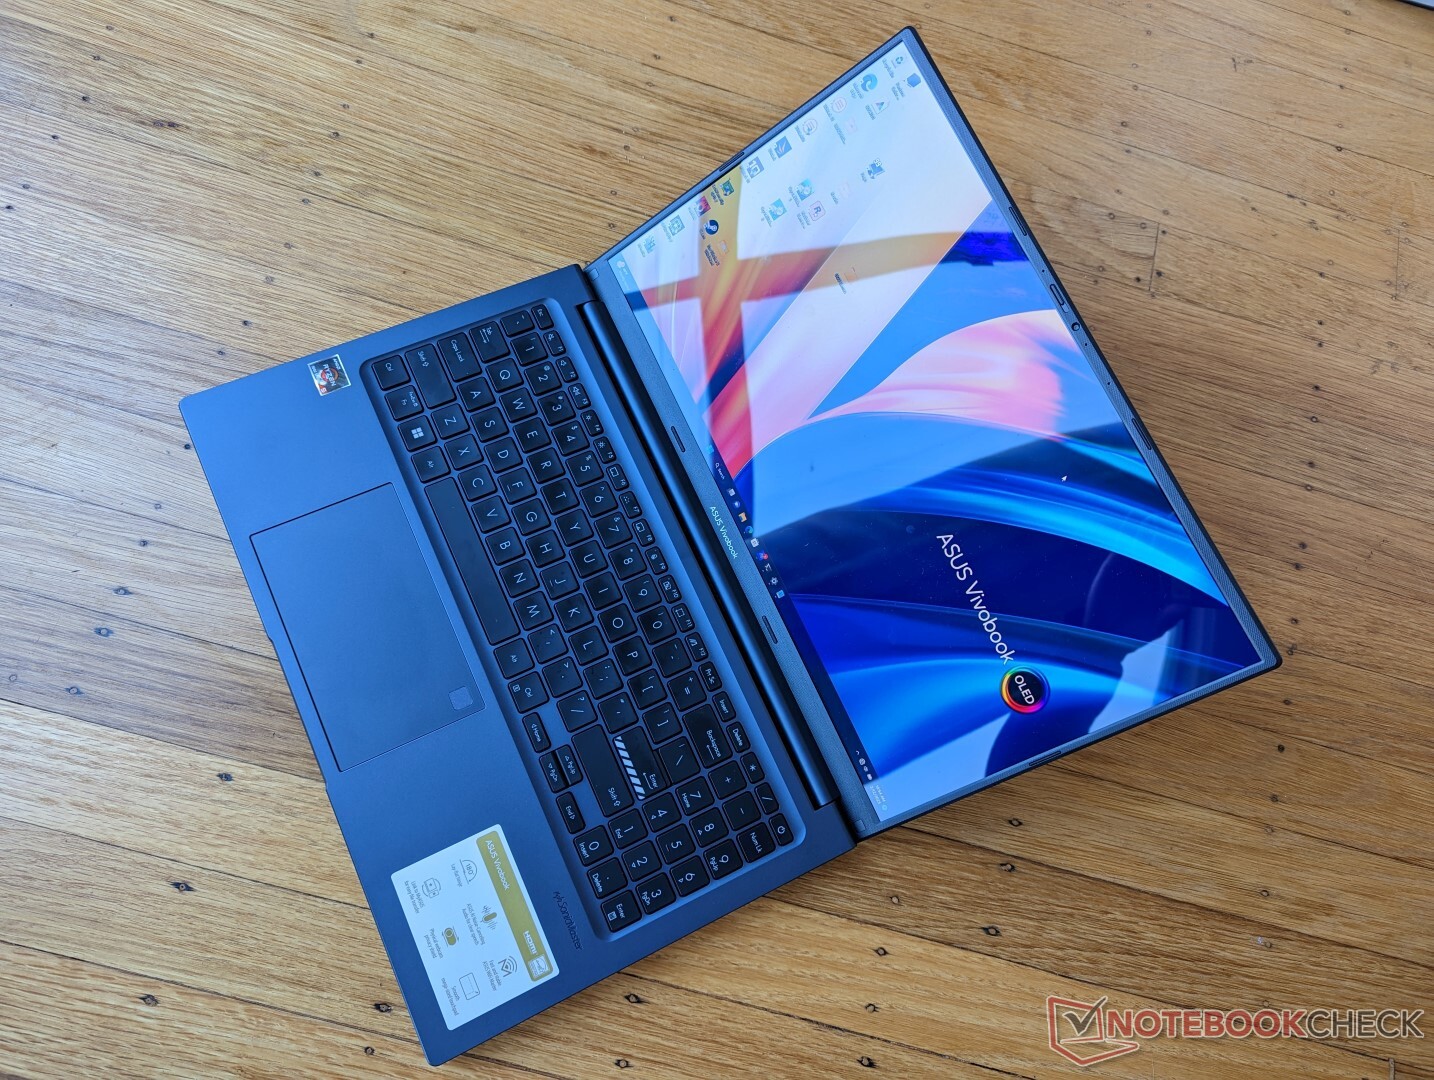
Overall size and weight are nothing exciting as they are about average for a 15-inch Ultrabook. Some models may be larger and heavier like the Dell Inspiron 15 3501 while others like the LG Gram 15 are smaller and lighter. When considering its affordable price, however, the VivoBook 15X is lighter and more portable than expected.
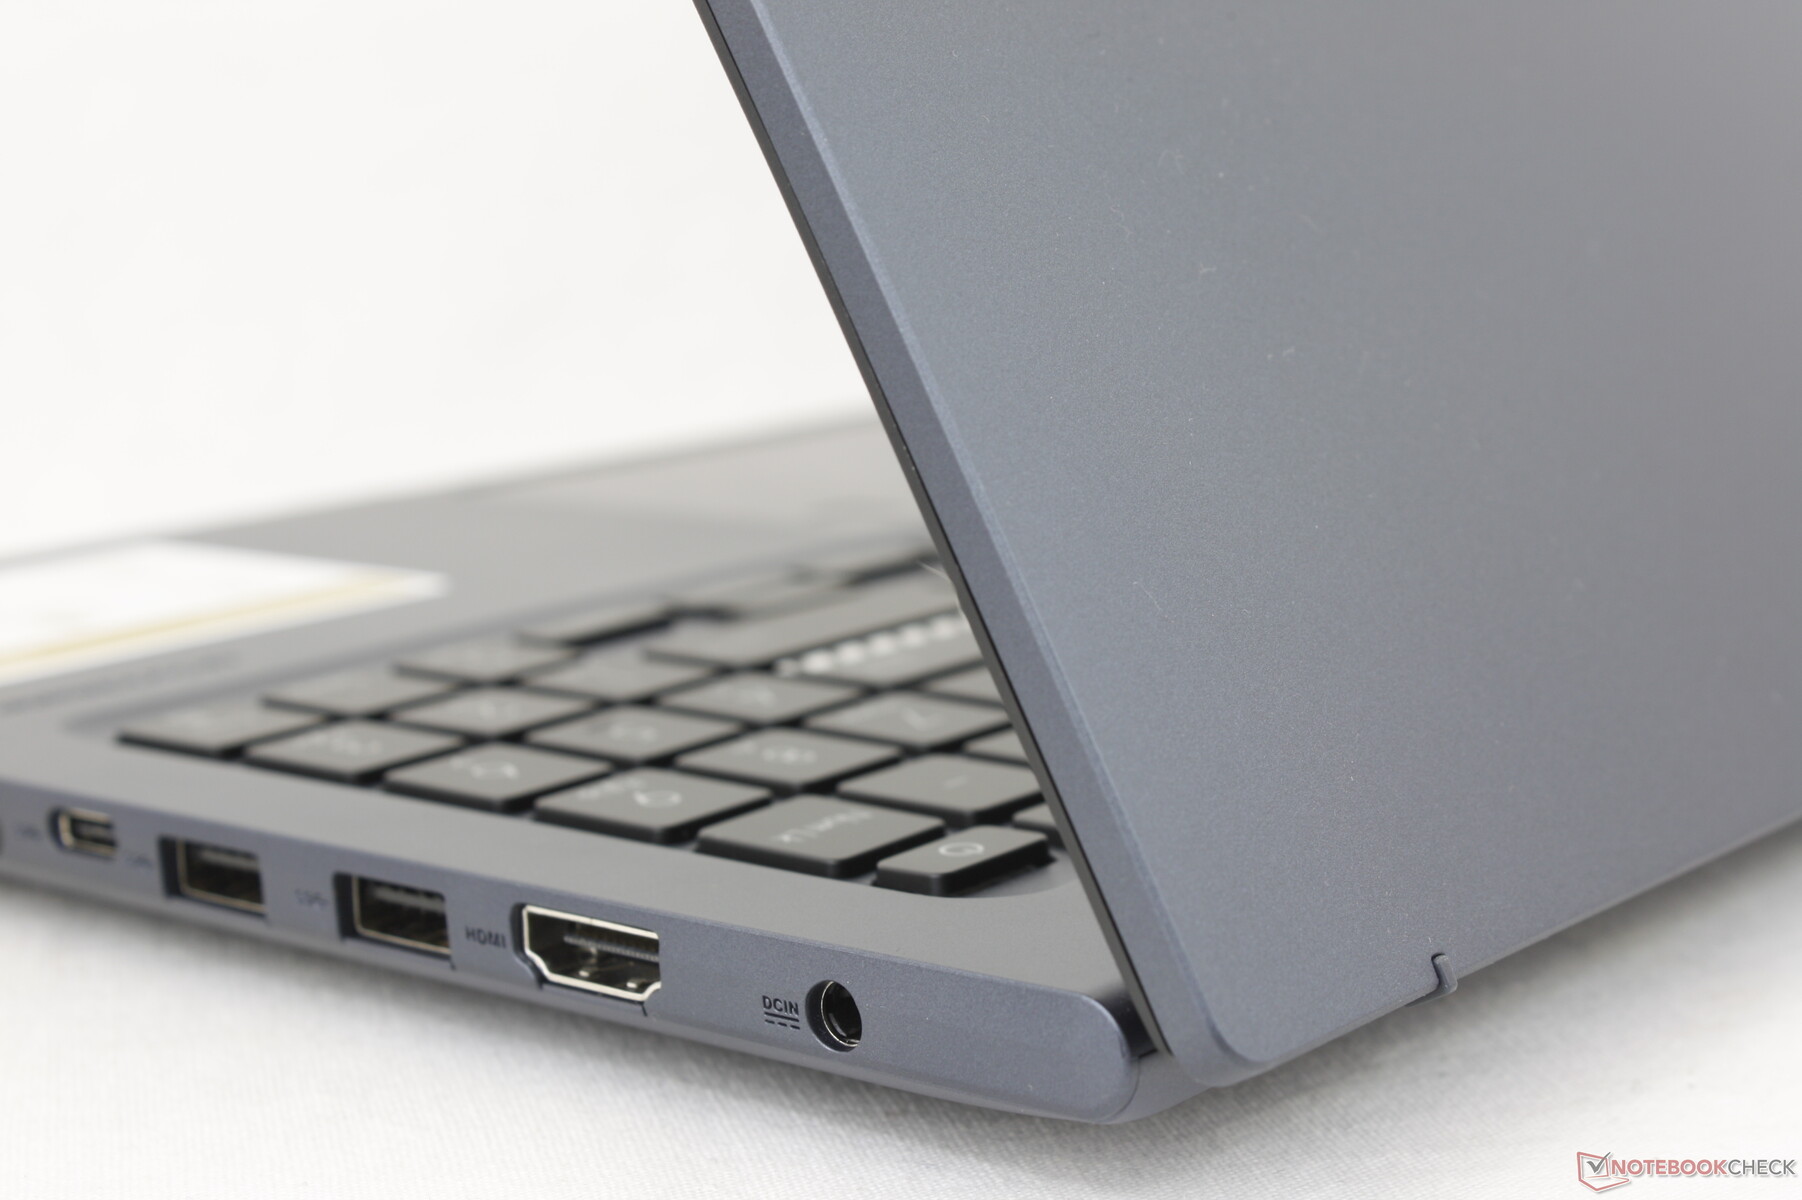
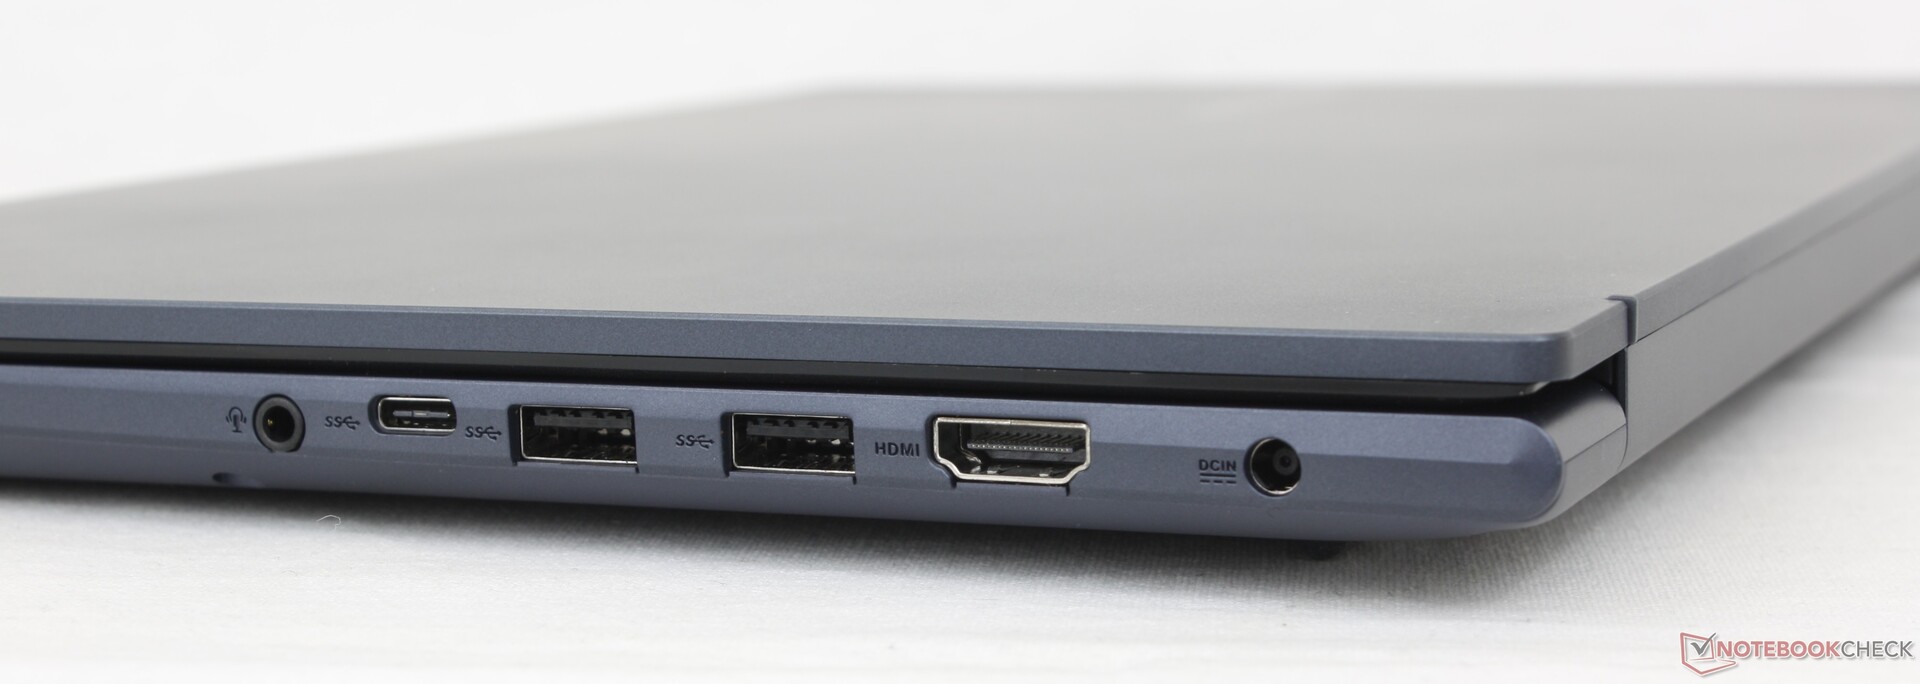
Connectivity — Limited USB-C Features
Port options are slightly different between all the numerous VivoBook models. In this case, the ports on our VivoBook 15X M1503QA are most similar to the 14-inch VivoBook S 14X S5402Z except with an additional USB-A port and one fewer USB-C port. Keep in mind that the USB-C port here does not support Thunderbolt, Power Delivery, or even DisplayPort whereas most other Ultrabooks with USB-C tend to support at least one of the three.
External monitors are supported at up to 4K at 30 Hz only.
Communication
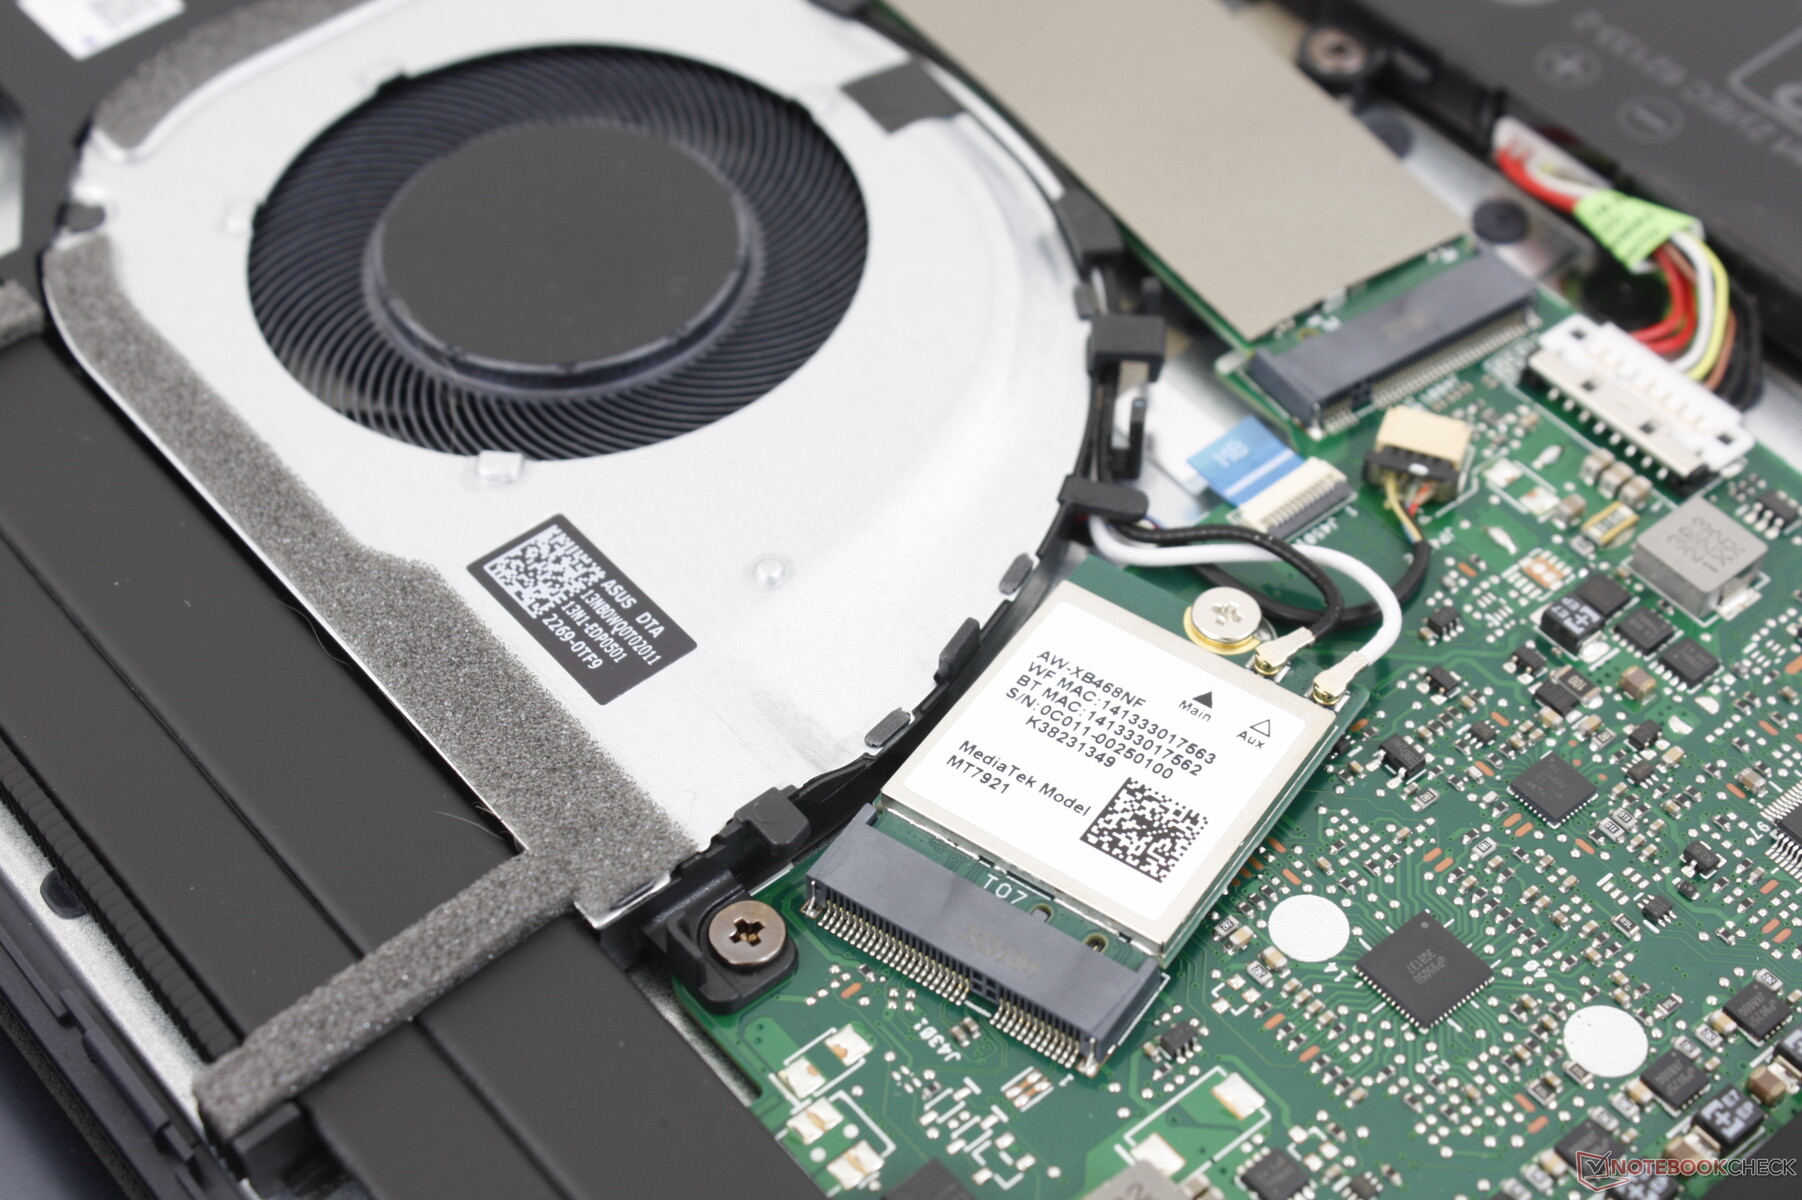
Wi-Fi 6 and Bluetooth 5 are provided by a MediaTek MT7921. Though transmit rates are where we expect them to be, receive rates tend to fluctuate as shown by our graph below. The issue isn't noticeable during day-to-day use or streaming, but it's a step down from laptops powered by the Intel AX series where performance is steadier.
Wi-Fi 6E is not included at configuration likely to save on costs.
| Networking | |
| iperf3 transmit AX12 | |
| Asus ZenBook UX535-M01440 | |
| Asus VivoBook S15 D533UA | |
| Asus Vivobook 15 K513EQ | |
| Dell Inspiron 15 3501 | |
| iperf3 receive AX12 | |
| Asus Vivobook 15 K513EQ | |
| Asus VivoBook S15 D533UA | |
| Asus ZenBook UX535-M01440 | |
| Dell Inspiron 15 3501 | |
| iperf3 receive AXE11000 | |
| Lenovo ThinkBook 15 G3 ACL 21A400B2GE | |
| Asus VivoBook 15 X M1503QA | |
| iperf3 transmit AXE11000 | |
| Lenovo ThinkBook 15 G3 ACL 21A400B2GE | |
| Asus VivoBook 15 X M1503QA | |
Webcam
A 720p or 1 MP webcam comes standard which is probably the most bottom-of-the-barrel you can get in terms of resolution. At least there is a built-in physical shutter for privacy purposes whereas the standard VivoBook 15 had no shutter.
There is no IR sensor or Hello support.


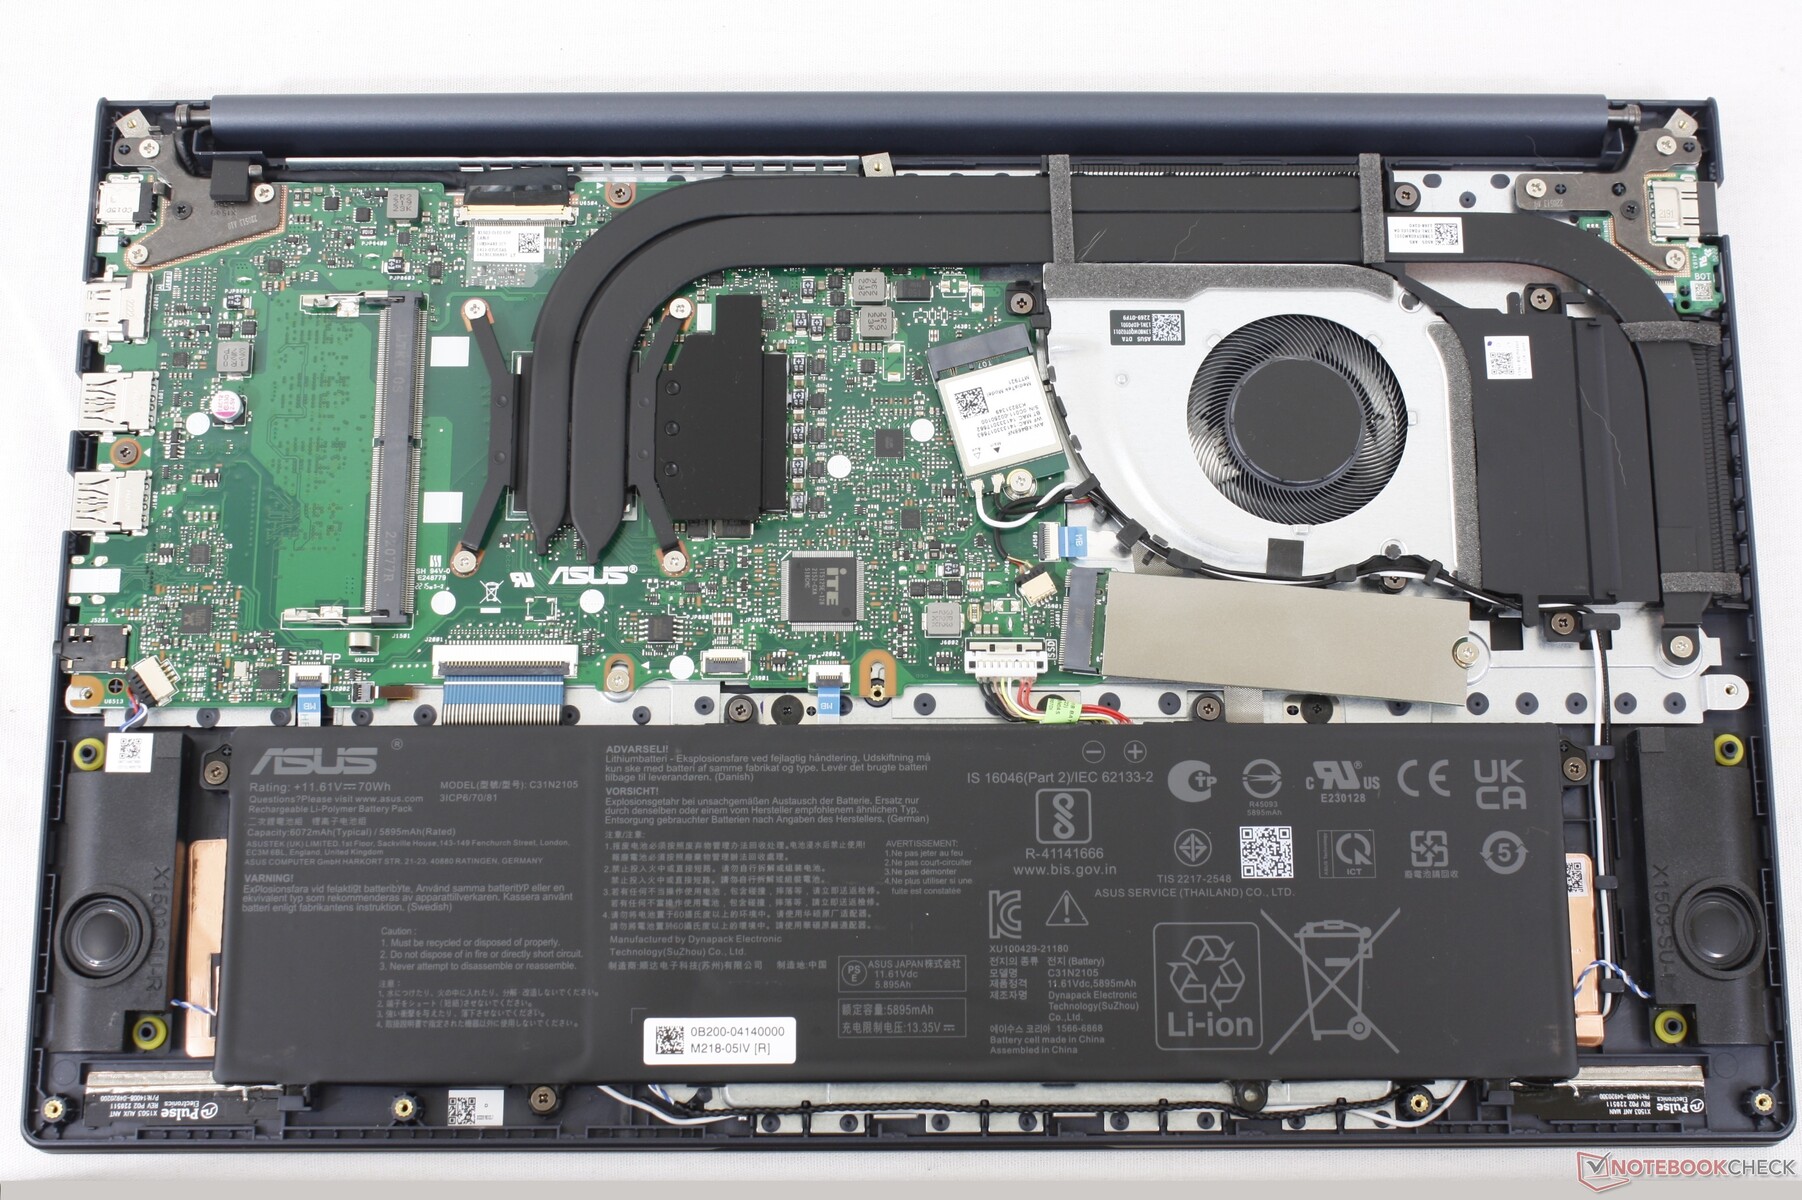
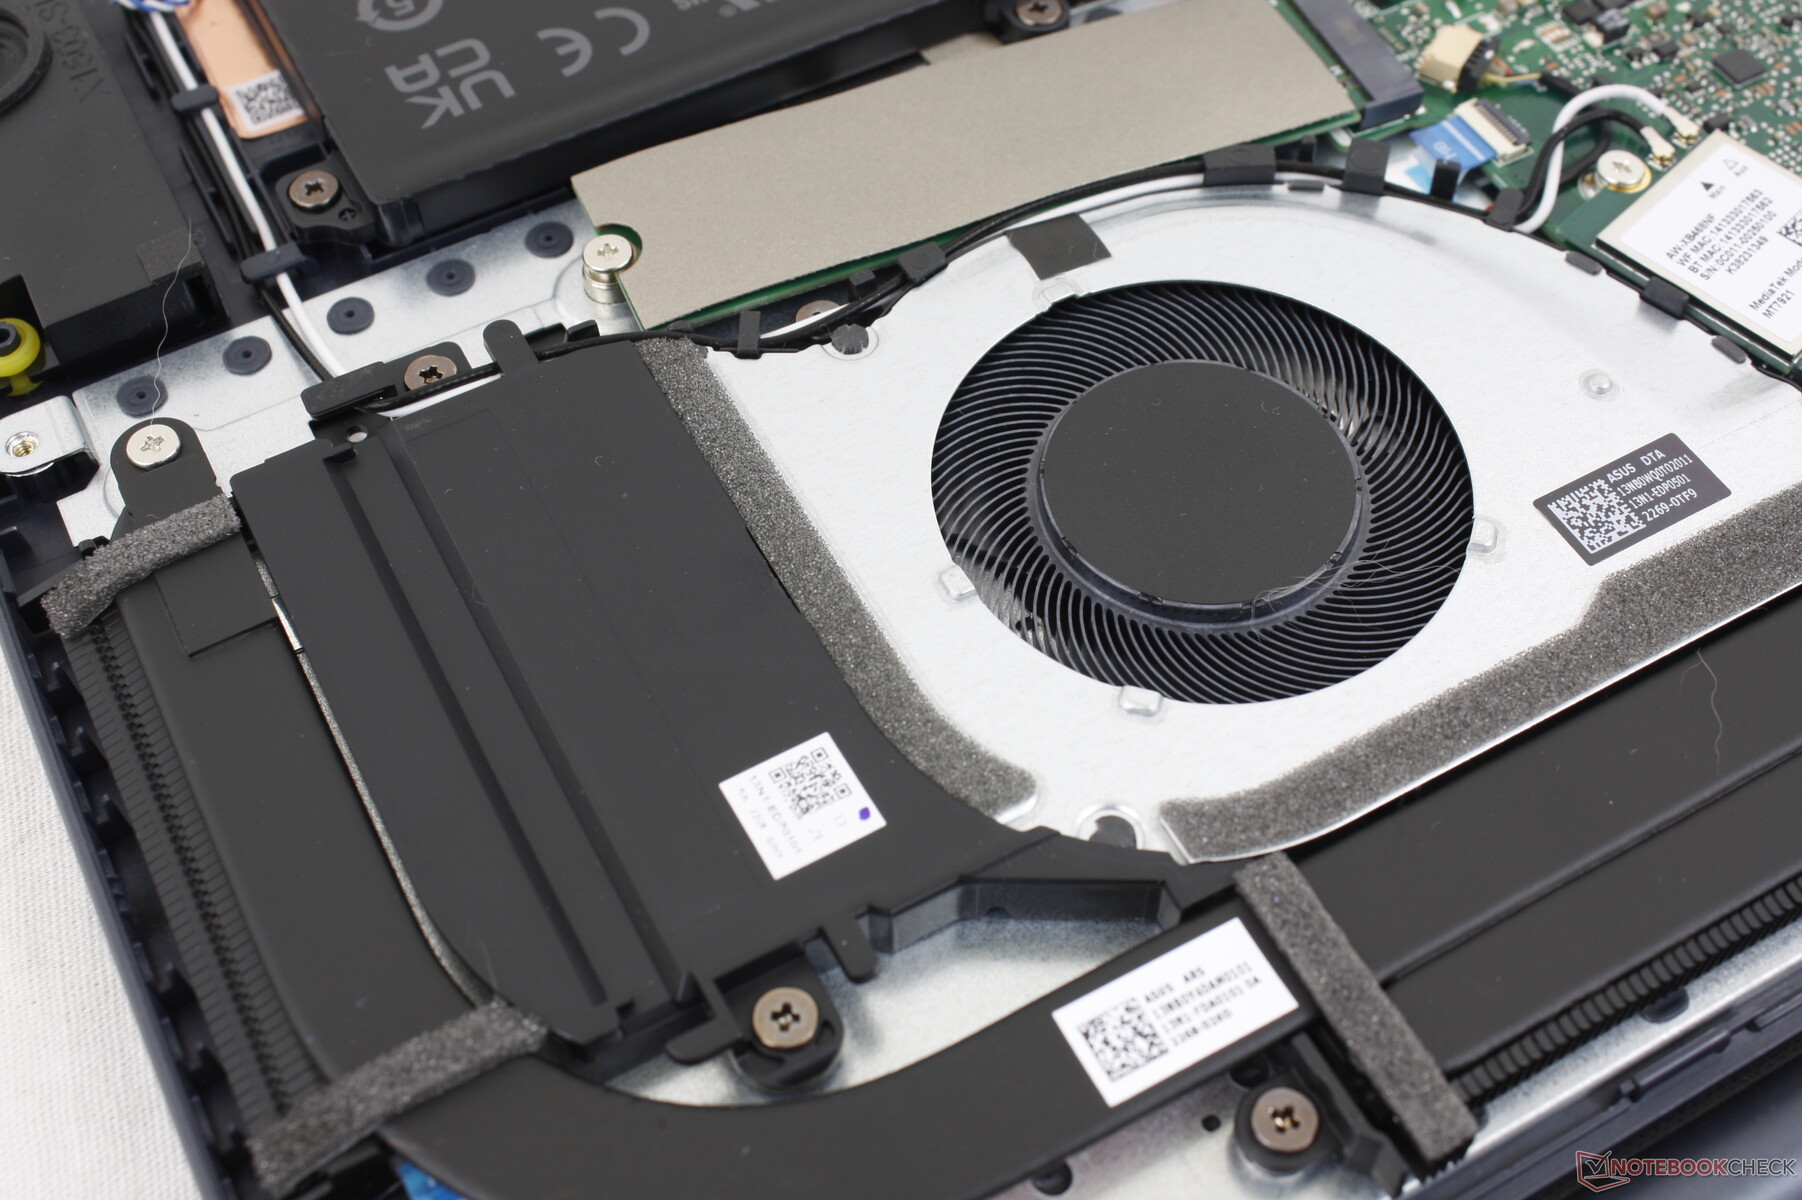
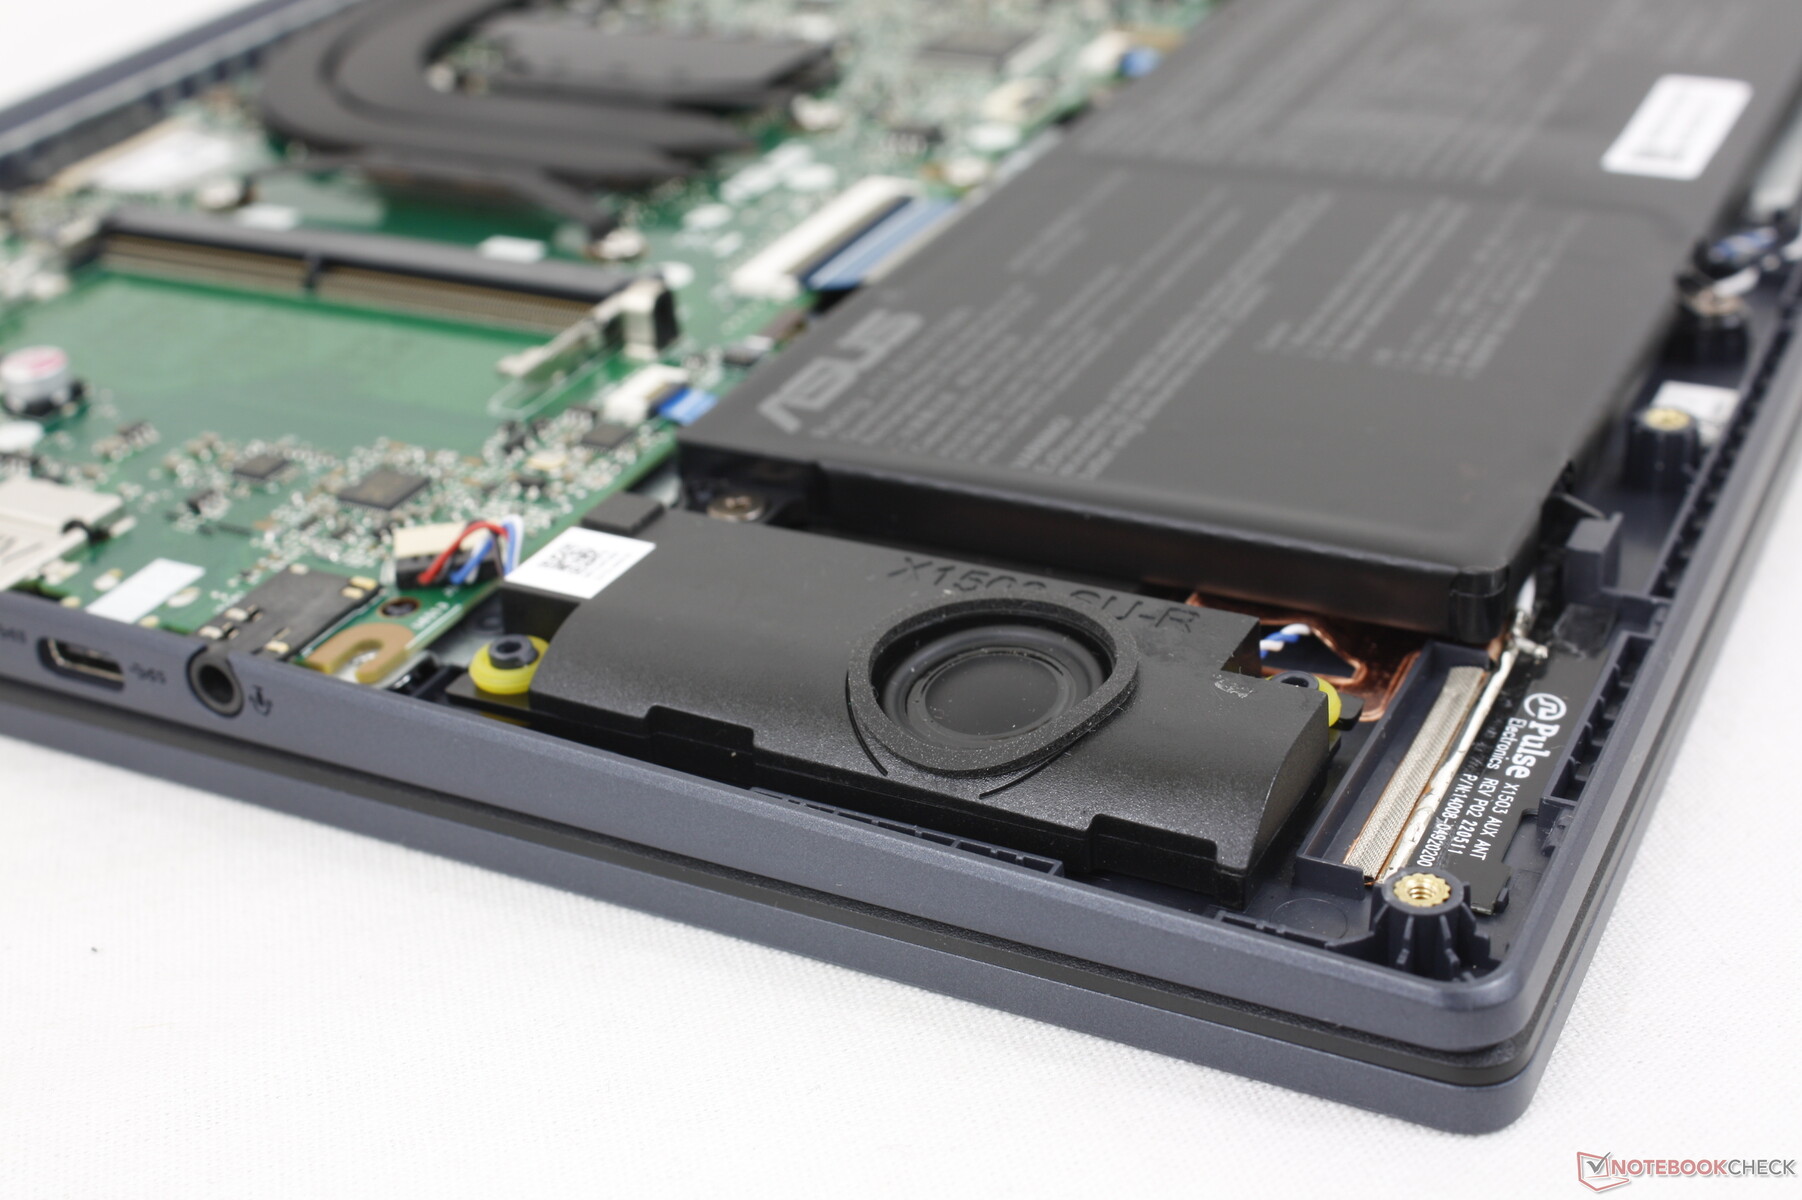
Maintenance
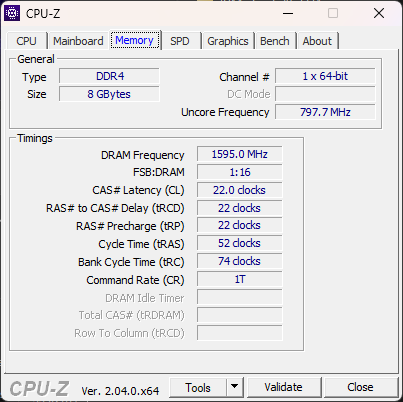
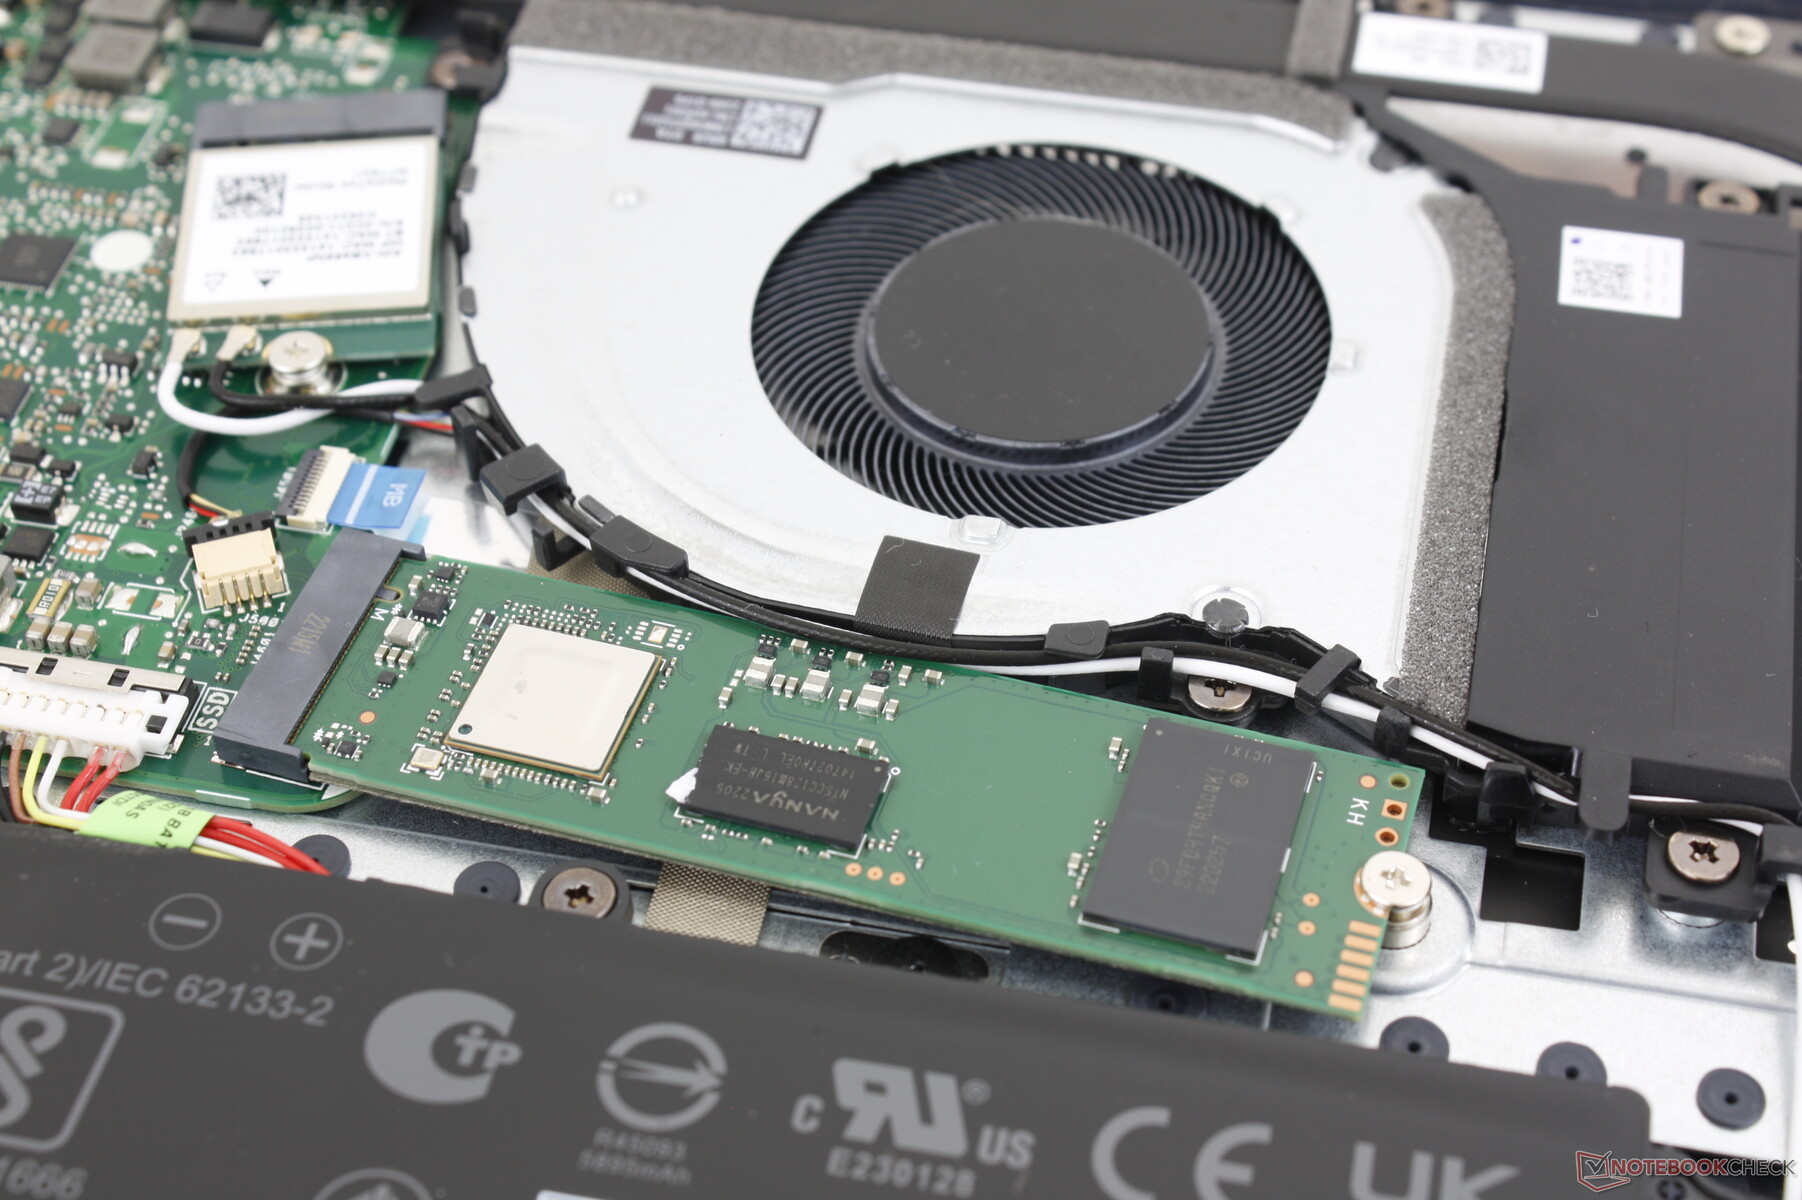
The bottom panel is secured 10 Philips screws with none hidden underneath any rubber footing for easy servicing. Users have direct access to the single M.2 2280 PCIe3 x4 slot, single DDR4 SODIMM slot, WLAN module, and battery. 8 GB of soldered single-channel RAM comes fixed no matter what for a combined capacity of 16 GB if the SODIMM slot is occupied.
Accessories and Warranty
There are no extras in the box other than the AC adapter or paperwork. The standard one-year limited manufacturer warranty applies if purchased in the US.
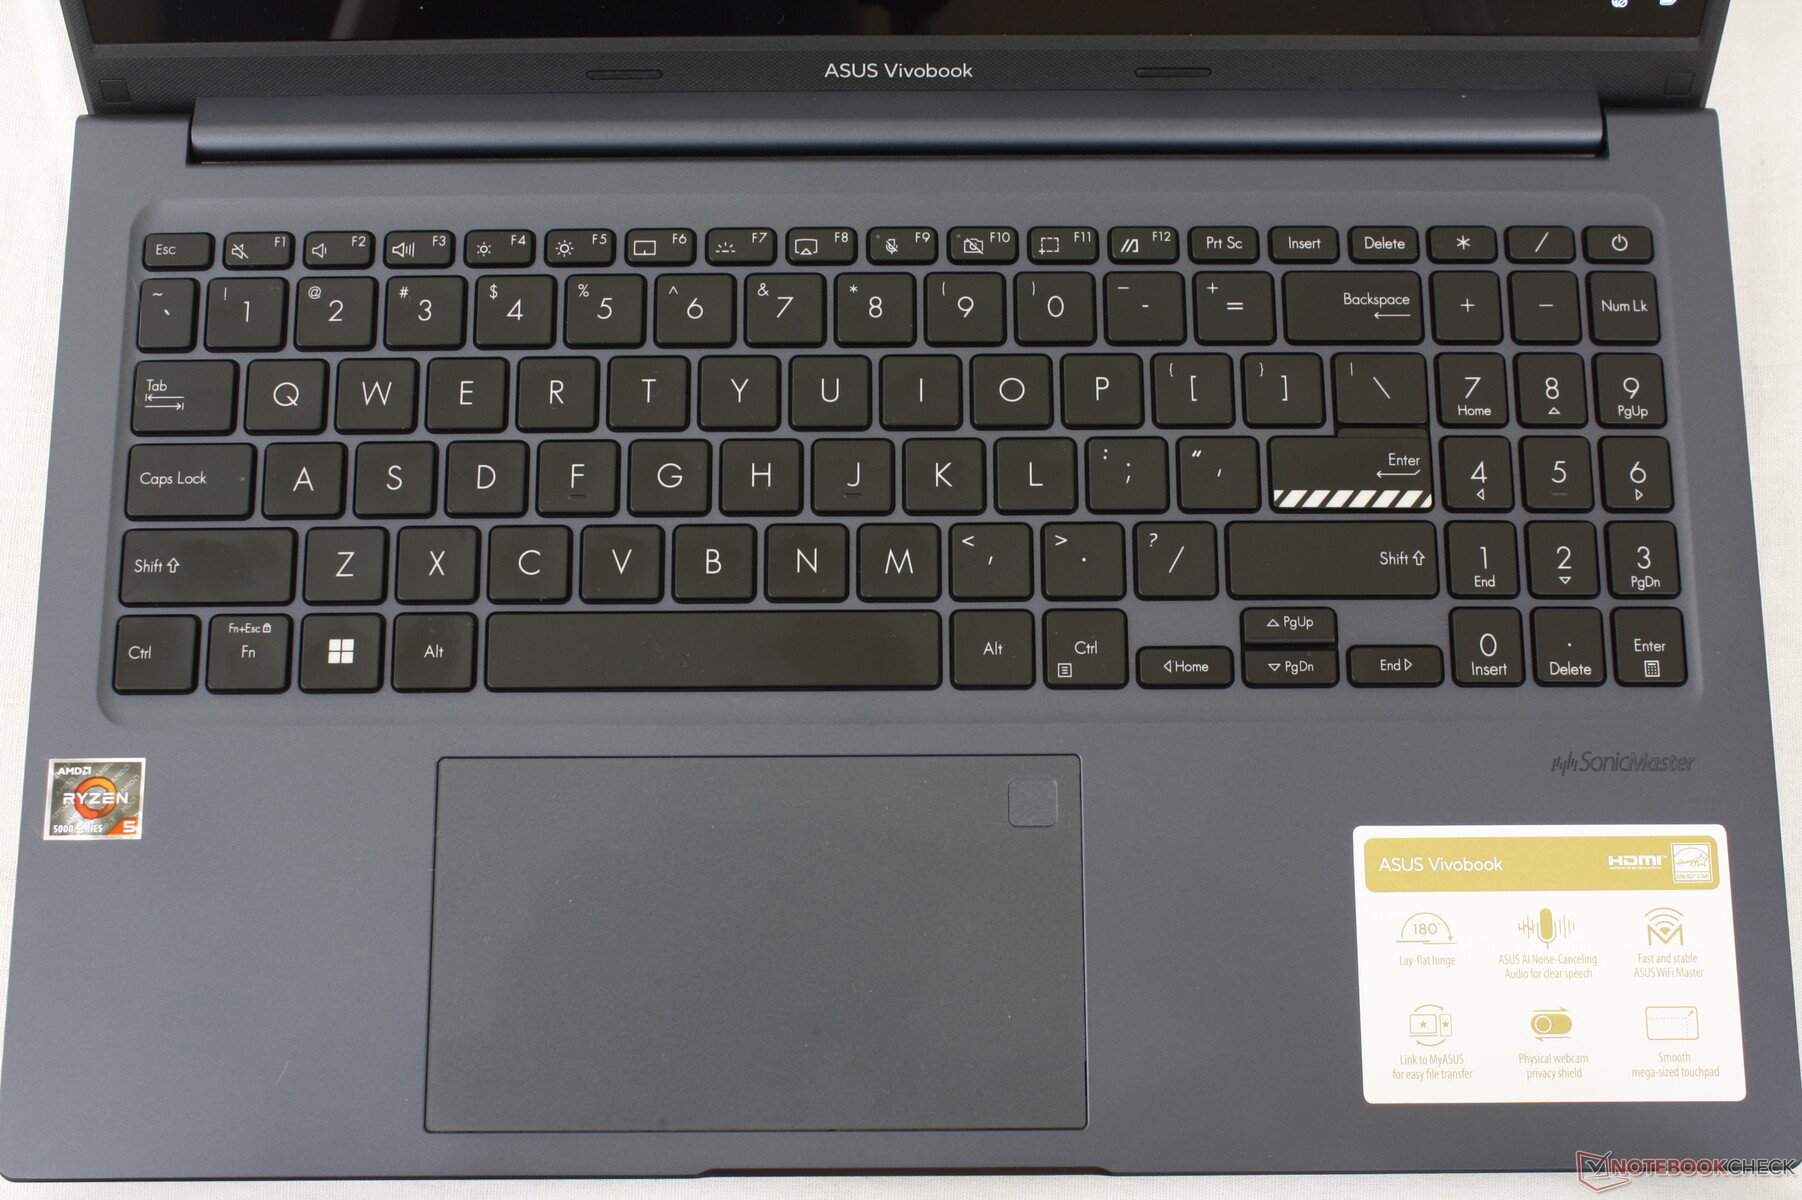
Input Devices — Clicky And Mostly Comfortable
Keyboard
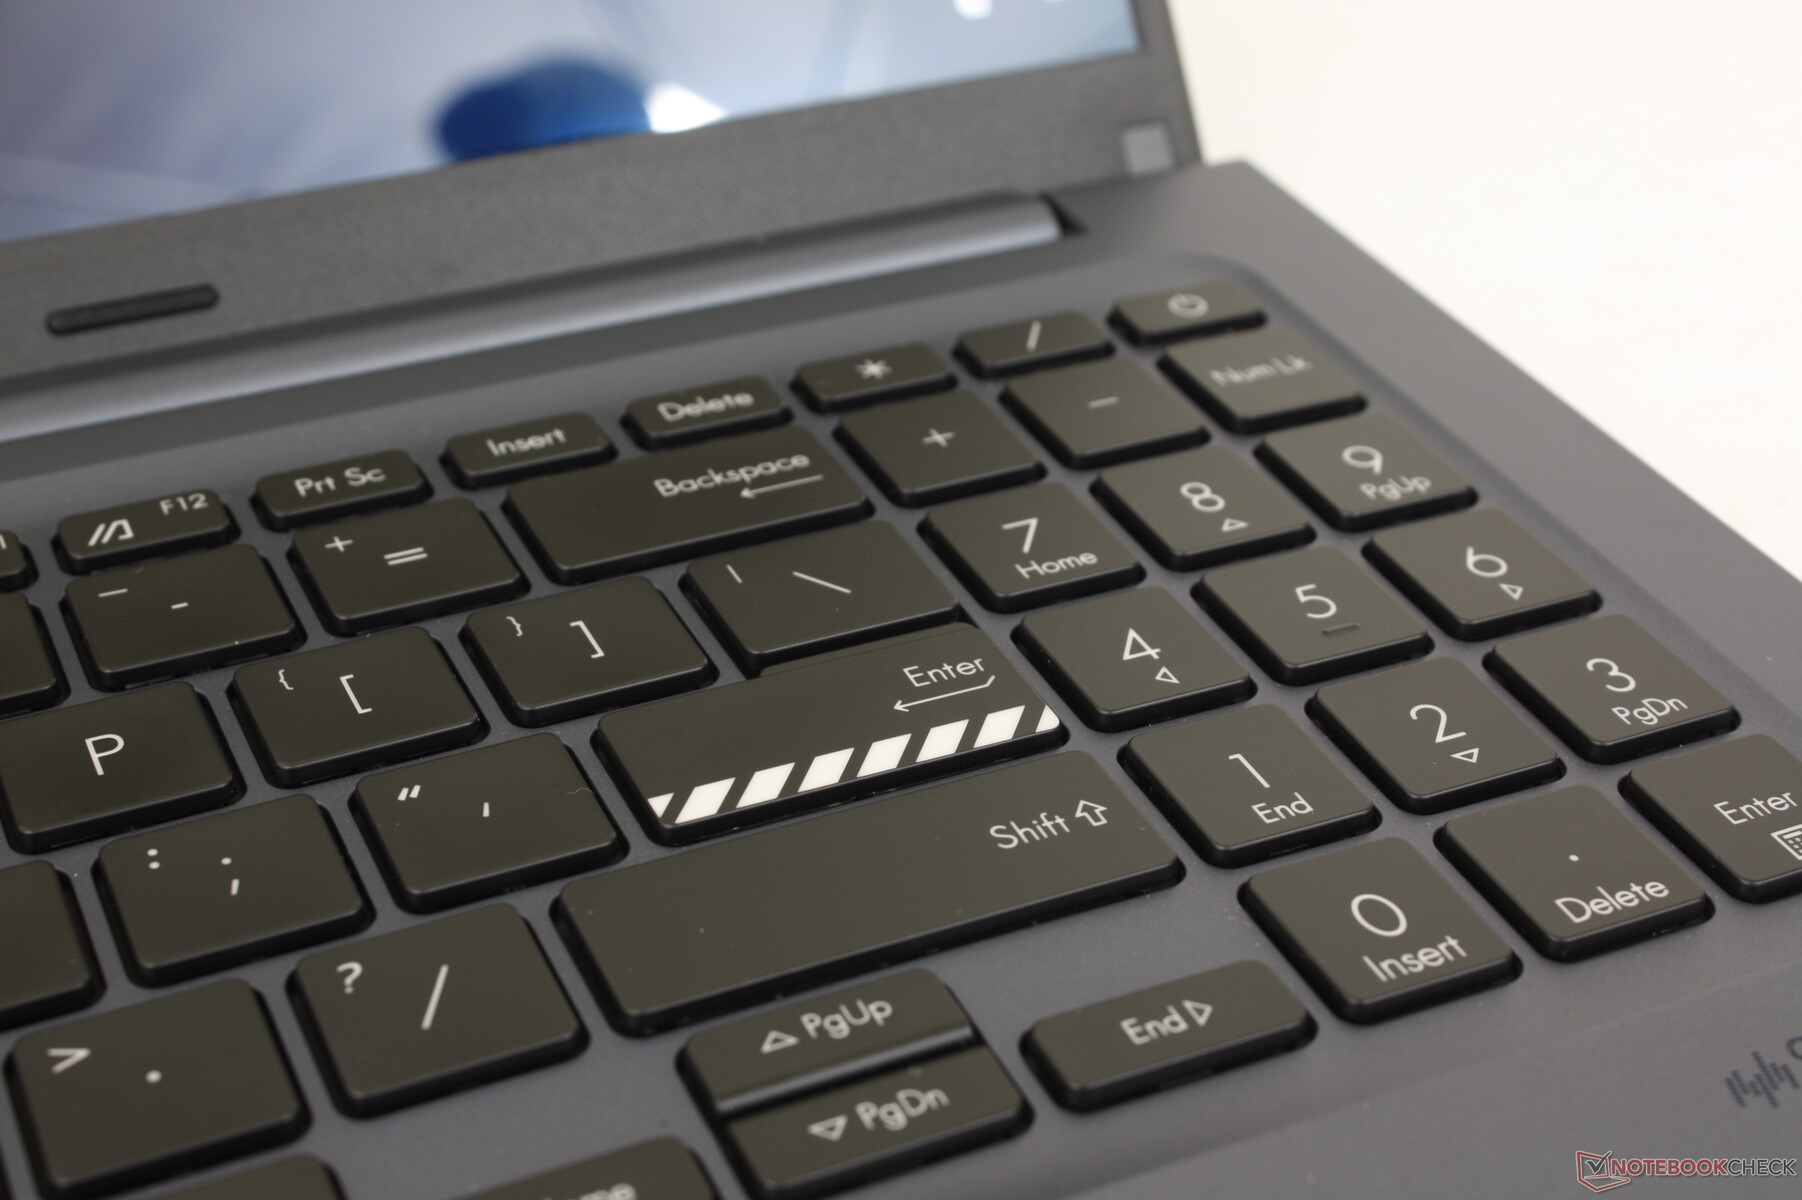
Keyboard feedback is firm and sharper than expected considering the affordable price range. The Space and Enter keys, for example, are not as spongy as on a Lenovo IdeaPad 3 series. Unfortunately, the same cannot be said for the arrow or numpad keys which are smaller and softer than the main QWERTY keys.
Key clatter is slightly louder and higher-pitched than on most other Ultrabooks likely due to the sharp feedback. It's not loud enough to be bothersome by any means, but it's still worth a mention.
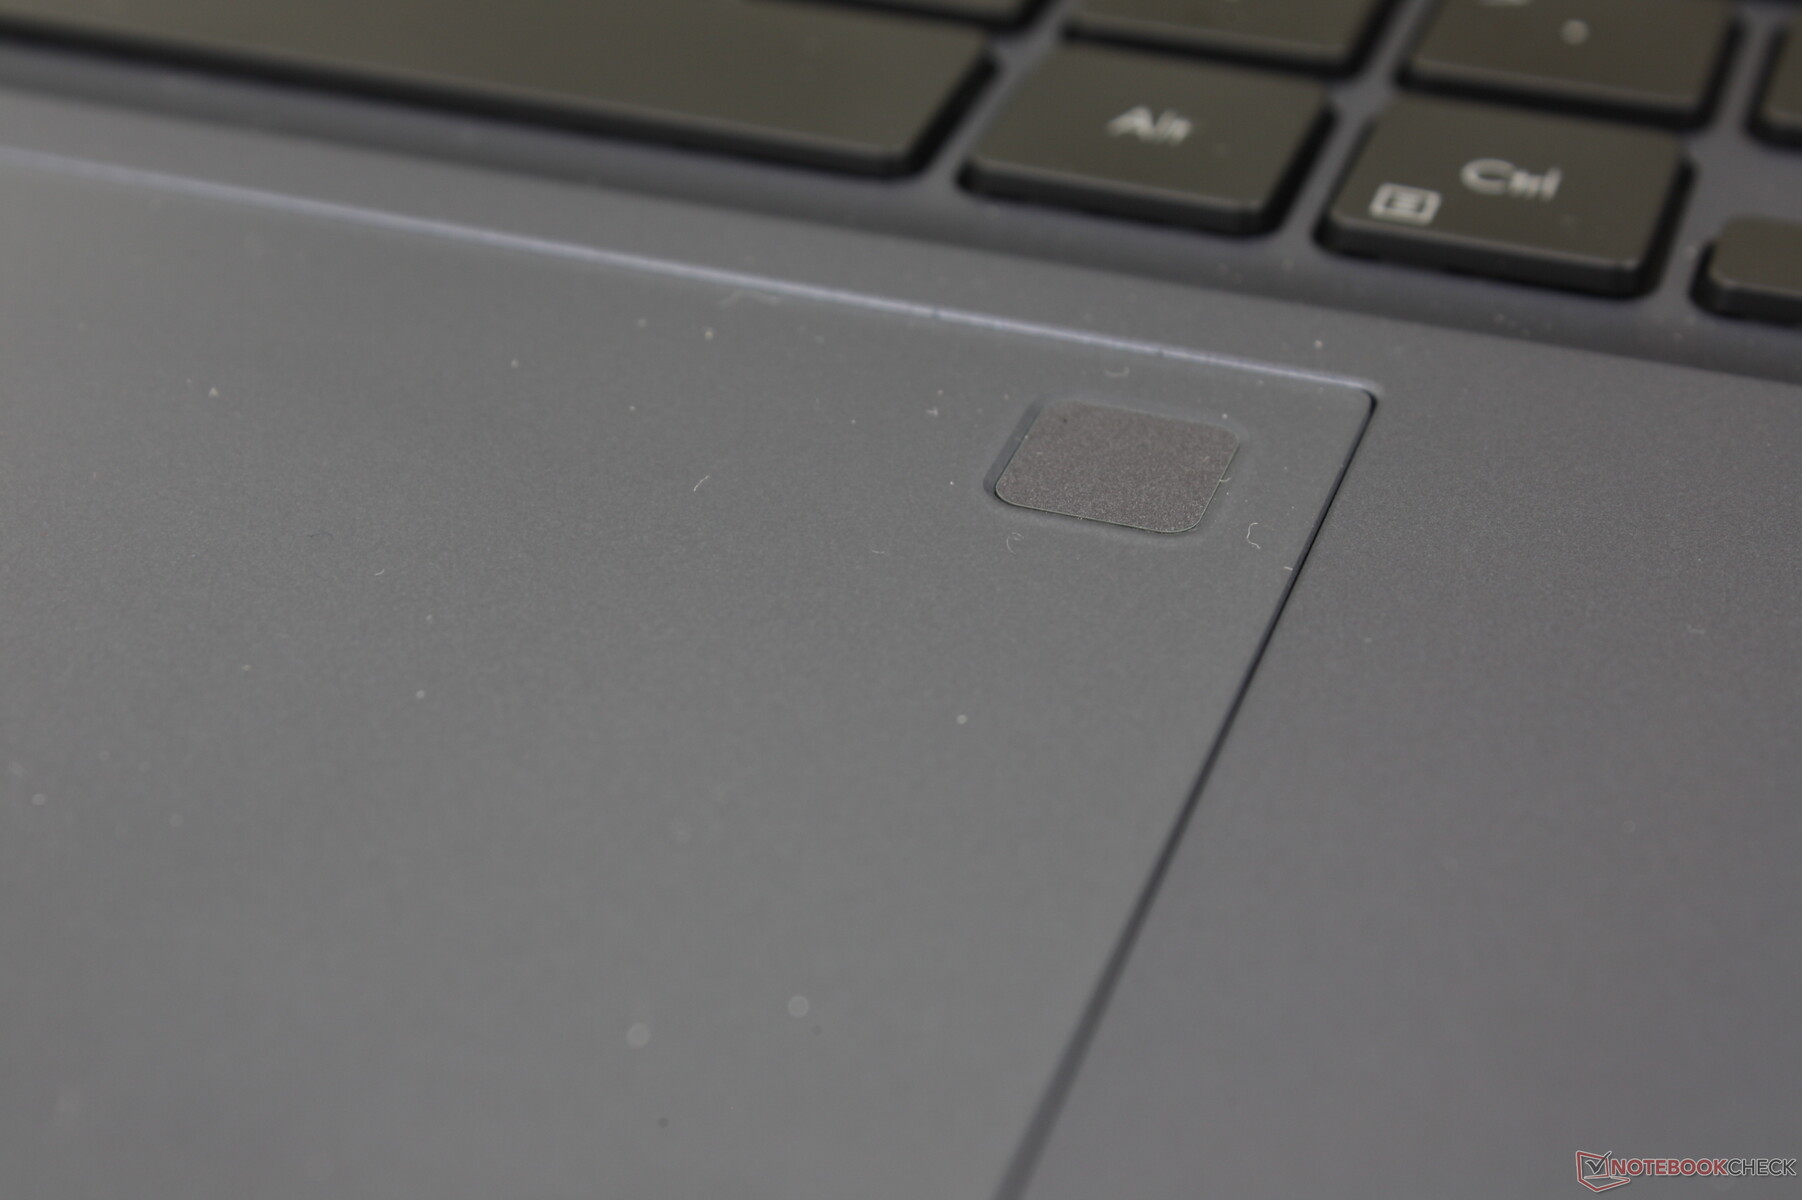
Touchpad
The clickpad is larger than the clickpad on the 2021 VivoBook 15 (13 x 7.5 cm vs. 10.5 x 7.3 cm) for easier cursor control and multi-touch inputs. Gliding is smooth and with a bit of sticking at slower speeds for more accurate drag-and-dropping. Feedback when clicking is unfortunately shallower and spongier than we would like and so you'll definitely want a mouse for longer sessions.

Display — OLED Only

Asus offers two resolution options both of which are glossy OLED and Pantone validated:
- 1920 x 1080, 100% DCI-P3, HDR600, 60 Hz
- 2880 x 1620, 100% DCI-P3, HDR600, 120 Hz
Our test unit comes equipped with the bolded option above. In fact, Asus utilizes the same Samsung ATNA56YX03-0 OLED panel for both the VivoBook 15X and standard VivoBook 15 meaning that the two models offer similar viewing experiences.
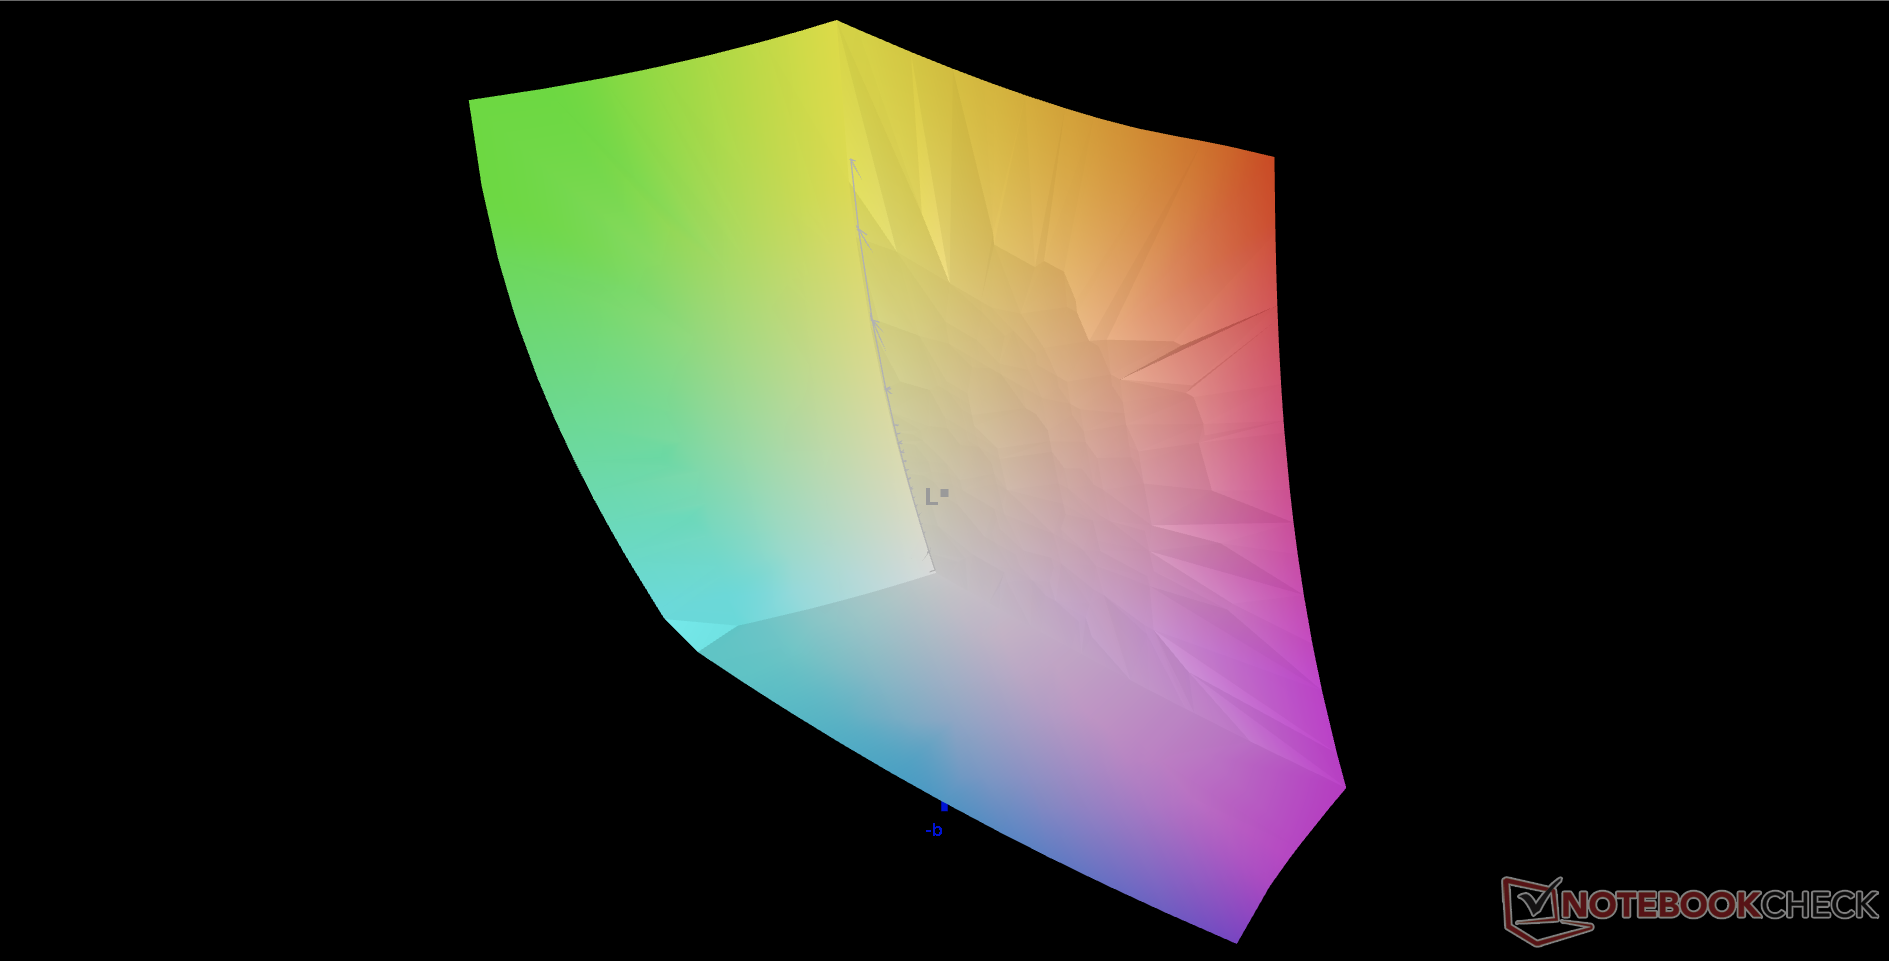
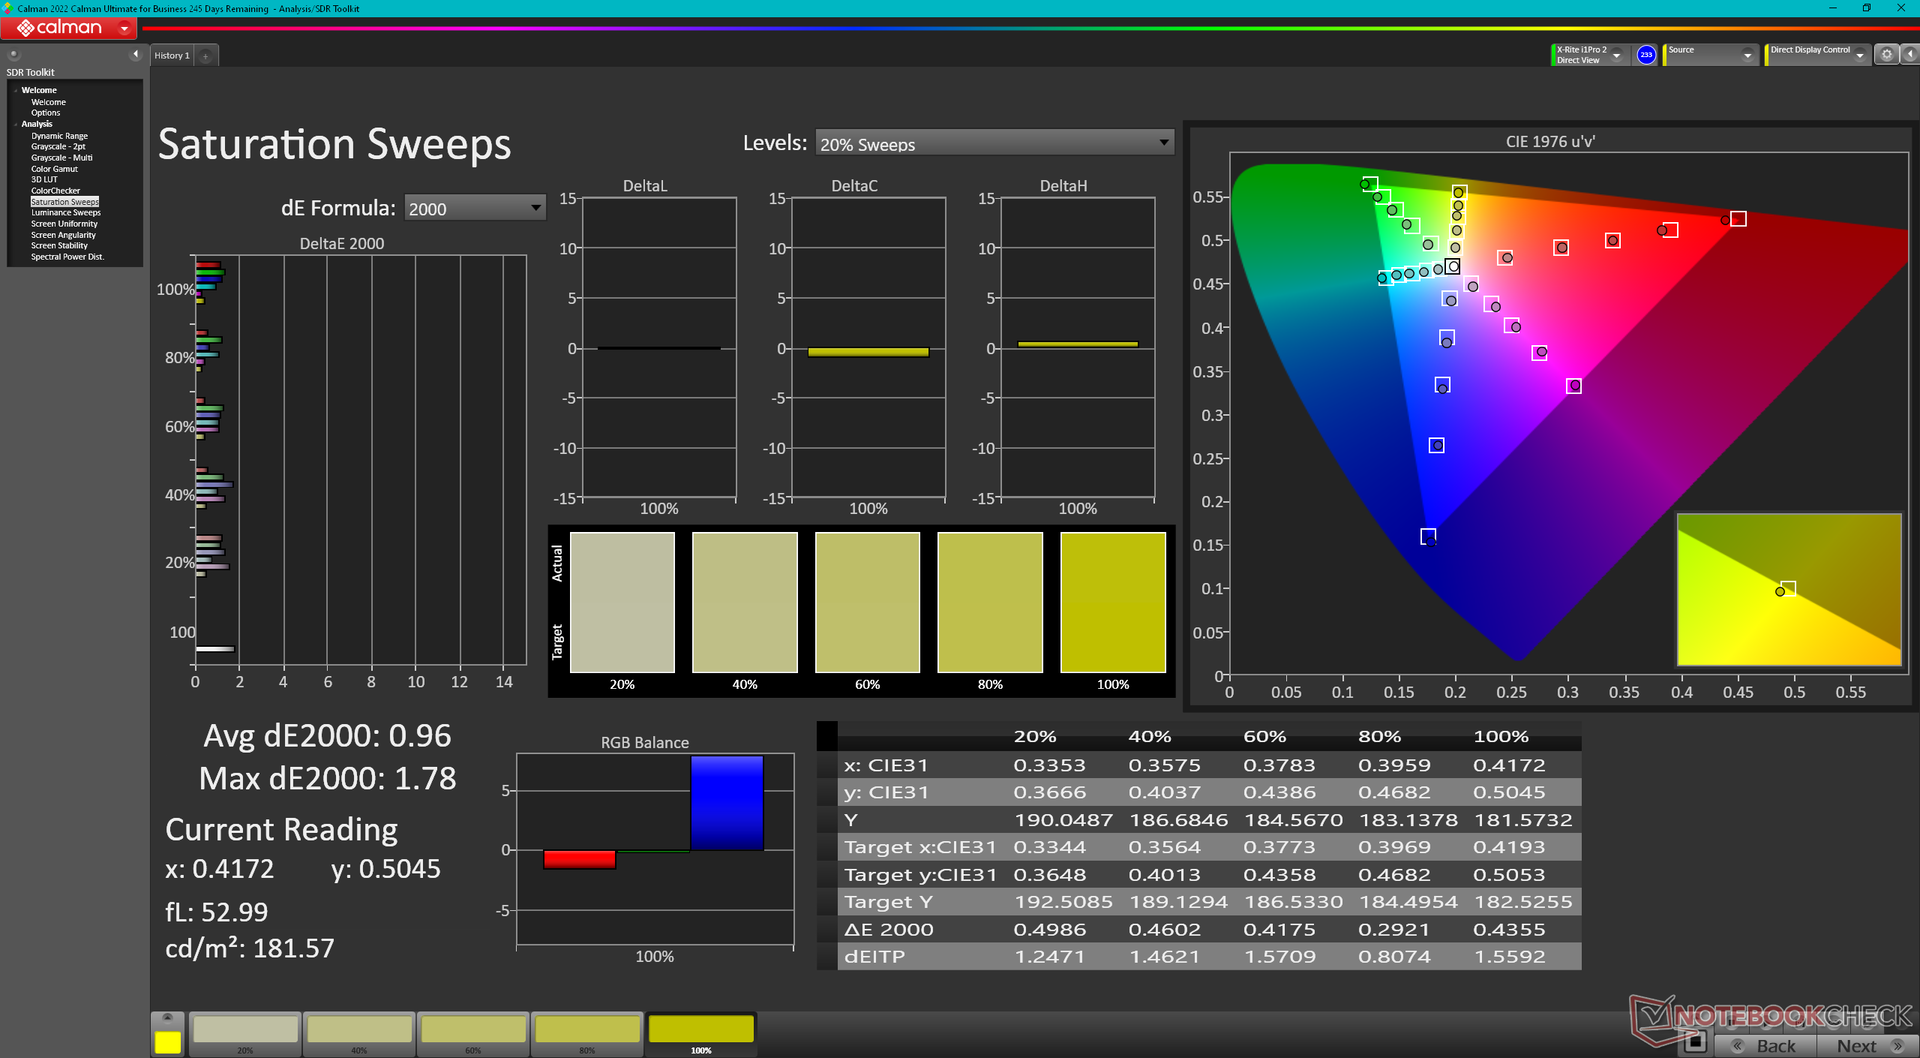
We're able to confirm the full DCI-P3 coverage while the 600-nit maximum is only achievable when playing back HDR content such as this HDR test video. Otherwise, the maximum brightness of the display peaks at just 380 nits for all other content.

| |||||||||||||||||||||||||
Brightness Distribution: 98 %
Center on Battery: 379 cd/m²
Contrast: ∞:1 (Black: 0 cd/m²)
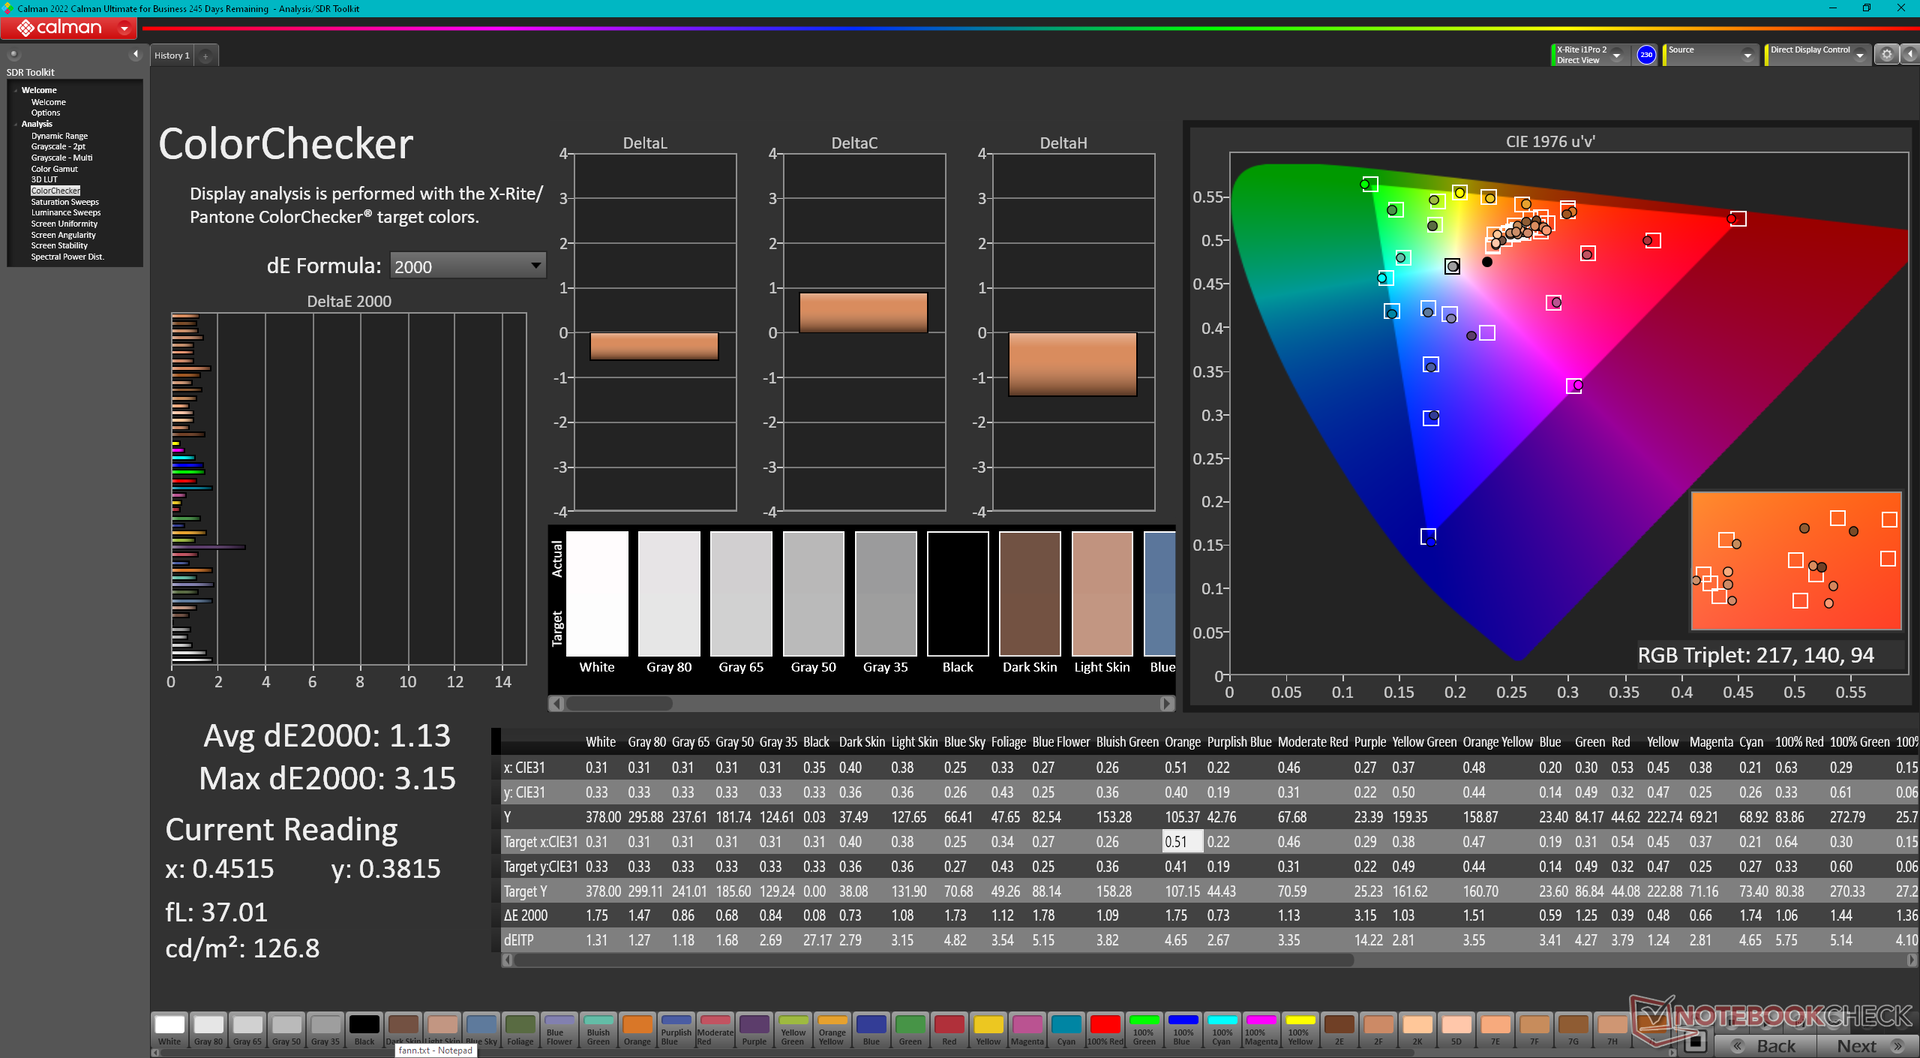
ΔE ColorChecker Calman: 1.13 | ∀{0.5-29.43 Ø4.79}
ΔE Greyscale Calman: 1.6 | ∀{0.09-98 Ø5}
89.7% AdobeRGB 1998 (Argyll 3D)
99.9% sRGB (Argyll 3D)
99.6% Display P3 (Argyll 3D)
Gamma: 2.23
CCT: 6583 K
| Asus VivoBook 15 X M1503QA Samsung ATNA56YX03-0, OLED, 1920x1080, 15.6" | Asus Vivobook 15 K513EQ Samsung ATNA56YX03-0, OLED, 1920x1080, 15.6" | Asus VivoBook S15 D533UA Chi Mei N156HCA-EAB, IPS, 1920x1080, 15.6" | Asus ZenBook UX535-M01440 BOE0866, IPS, 3840x2160, 15.6" | Lenovo ThinkBook 15 G3 ACL 21A400B2GE Chi Mei N156HCA-EAC, IPS, 1920x1080, 15.6" | Dell Inspiron 15 3501 BOE NV15N3D (Dell P/N: N39X1), IPS, 1920x1080, 15.6" | |
|---|---|---|---|---|---|---|
| Display | 4% | -47% | -18% | -46% | -52% | |
| Display P3 Coverage (%) | 99.6 | 99.9 0% | 43.6 -56% | 68.8 -31% | 43.8 -56% | 39.4 -60% |
| sRGB Coverage (%) | 99.9 | 100 0% | 65.2 -35% | 99.5 0% | 65.5 -34% | 58.7 -41% |
| AdobeRGB 1998 Coverage (%) | 89.7 | 99.9 11% | 45 -50% | 70.1 -22% | 45.4 -49% | 40.7 -55% |
| Response Times | -27% | -832% | -1390% | -1211% | -1822% | |
| Response Time Grey 50% / Grey 80% * (ms) | 1.8 ? | 2.2 ? -22% | 18 ? -900% | 34 ? -1789% | 30 ? -1567% | 43 ? -2289% |
| Response Time Black / White * (ms) | 2.2 ? | 2.9 ? -32% | 19 ? -764% | 24 ? -991% | 21 ? -855% | 32 ? -1355% |
| PWM Frequency (Hz) | 59.52 | 59.5 ? | 1000 ? | |||
| Screen | -36% | -91% | -34% | -95% | -104% | |
| Brightness middle (cd/m²) | 379 | 384.5 1% | 289 -24% | 402 6% | 291 -23% | 271 -28% |
| Brightness (cd/m²) | 379 | 388 2% | 267 -30% | 375 -1% | 271 -28% | 263 -31% |
| Brightness Distribution (%) | 98 | 98 0% | 85 -13% | 84 -14% | 86 -12% | 92 -6% |
| Black Level * (cd/m²) | 0.56 | 0.35 | 0.375 | 0.15 | ||
| Colorchecker dE 2000 * | 1.13 | 2.53 -124% | 3.96 -250% | 2.47 -119% | 4.17 -269% | 4.83 -327% |
| Colorchecker dE 2000 max. * | 3.15 | 6.16 -96% | 6.76 -115% | 4.32 -37% | 7.18 -128% | 7 -122% |
| Greyscale dE 2000 * | 1.6 | 1.6 -0% | 3.43 -114% | 2.26 -41% | 3.31 -107% | 3.36 -110% |
| Gamma | 2.23 99% | 2.24 98% | 2.28 96% | 2.49 88% | 2.23 99% | 2.56 86% |
| CCT | 6583 99% | 6464 101% | 7191 90% | 6285 103% | 6457 101% | 6764 96% |
| Contrast (:1) | 516 | 1149 | 776 | 1807 | ||
| Color Space (Percent of AdobeRGB 1998) (%) | 42 | 99 | ||||
| Color Space (Percent of sRGB) (%) | 65 | |||||
| Colorchecker dE 2000 calibrated * | 2.36 | |||||
| Total Average (Program / Settings) | -20% /
-24% | -323% /
-214% | -481% /
-276% | -451% /
-284% | -659% /
-402% |
* ... smaller is better

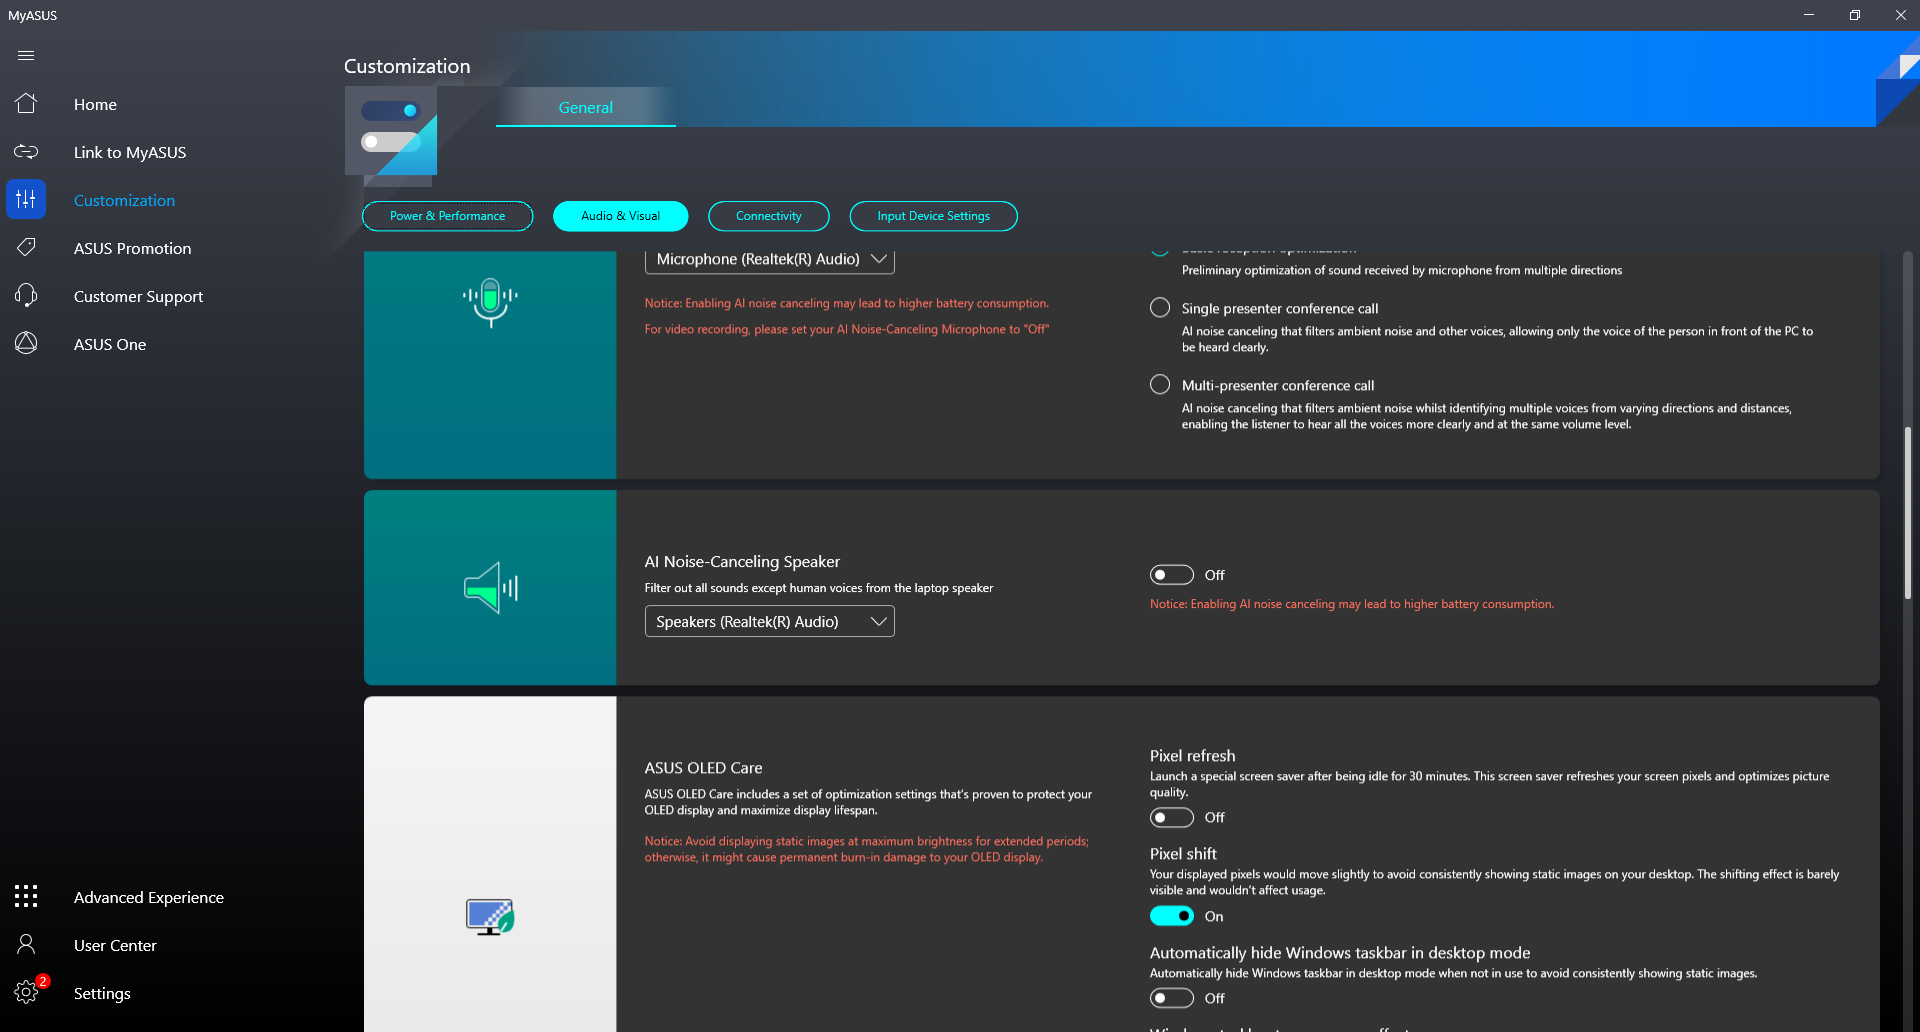
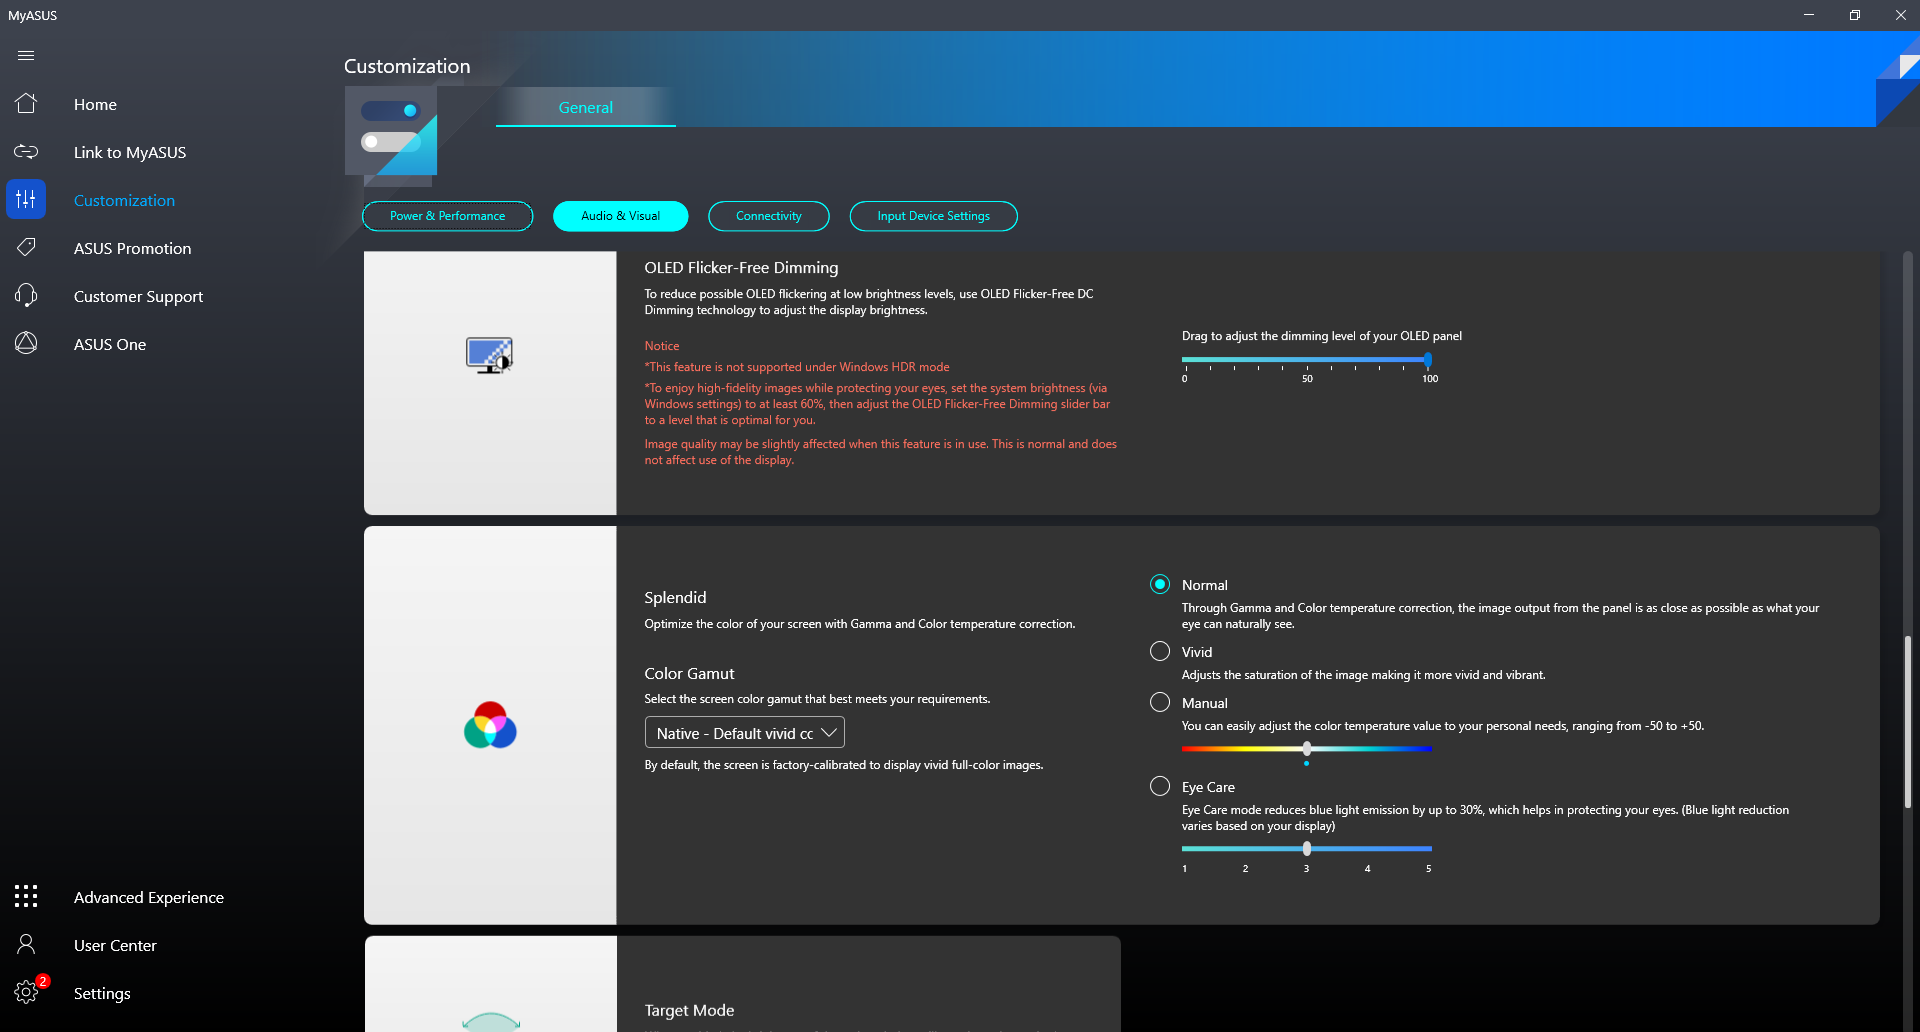
We can confirm with our X-Rite colorimeter that colors are already calibrated out of the box as advertised by the manufacturer. Average grayscale and color deltaE values would be just 1.6 and 1.13, respectively, meaning any end-user calibration would do little to improve the display. Switching between the color profiles with the pre-installed MyAsus software can be a little buggy, however, as any changes do not correlate with the built-in Windows color profile.

Display Response Times
| ↔ Response Time Black to White | ||
|---|---|---|
| 2.2 ms ... rise ↗ and fall ↘ combined | ↗ 0.96 ms rise | 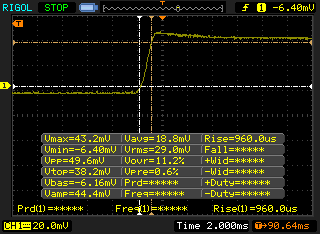 |
| ↘ 1.2 ms fall | ||
| The screen shows very fast response rates in our tests and should be very well suited for fast-paced gaming. In comparison, all tested devices range from 0.1 (minimum) to 240 (maximum) ms. » 11 % of all devices are better. This means that the measured response time is better than the average of all tested devices (20.3 ms). | ||
| ↔ Response Time 50% Grey to 80% Grey | ||
| 1.8 ms ... rise ↗ and fall ↘ combined | ↗ 0.92 ms rise | 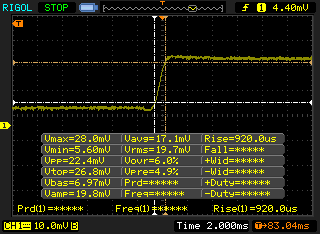 |
| ↘ 0.88 ms fall | ||
| The screen shows very fast response rates in our tests and should be very well suited for fast-paced gaming. In comparison, all tested devices range from 0.165 (minimum) to 636 (maximum) ms. » 8 % of all devices are better. This means that the measured response time is better than the average of all tested devices (31.7 ms). | ||
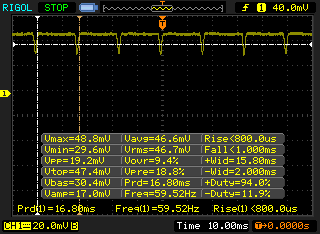
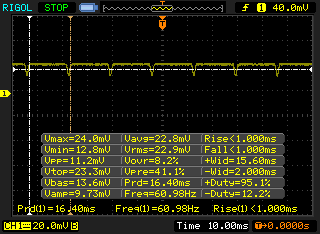
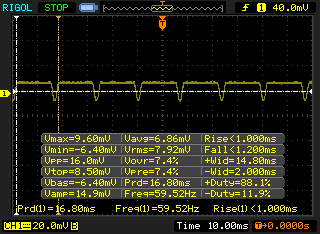
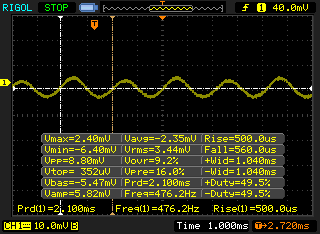
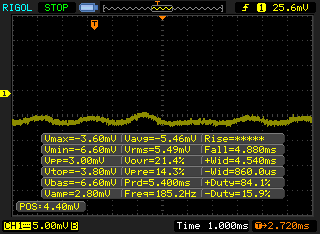
Screen Flickering / PWM (Pulse-Width Modulation)
| Screen flickering / PWM detected | 59.52 Hz |  | |
The display backlight flickers at 59.52 Hz (worst case, e.g., utilizing PWM) . The frequency of 59.52 Hz is very low, so the flickering may cause eyestrain and headaches after extended use. In comparison: 53 % of all tested devices do not use PWM to dim the display. If PWM was detected, an average of 8163 (minimum: 5 - maximum: 343500) Hz was measured. | |||
Pulse-width modulation is present on all brightness levels much like on most other OLED panels for laptops. We're able to record a frequency of 50 Hz from 51 to 100 percent brightness and 476 Hz from 0 to 49 percent brightness.
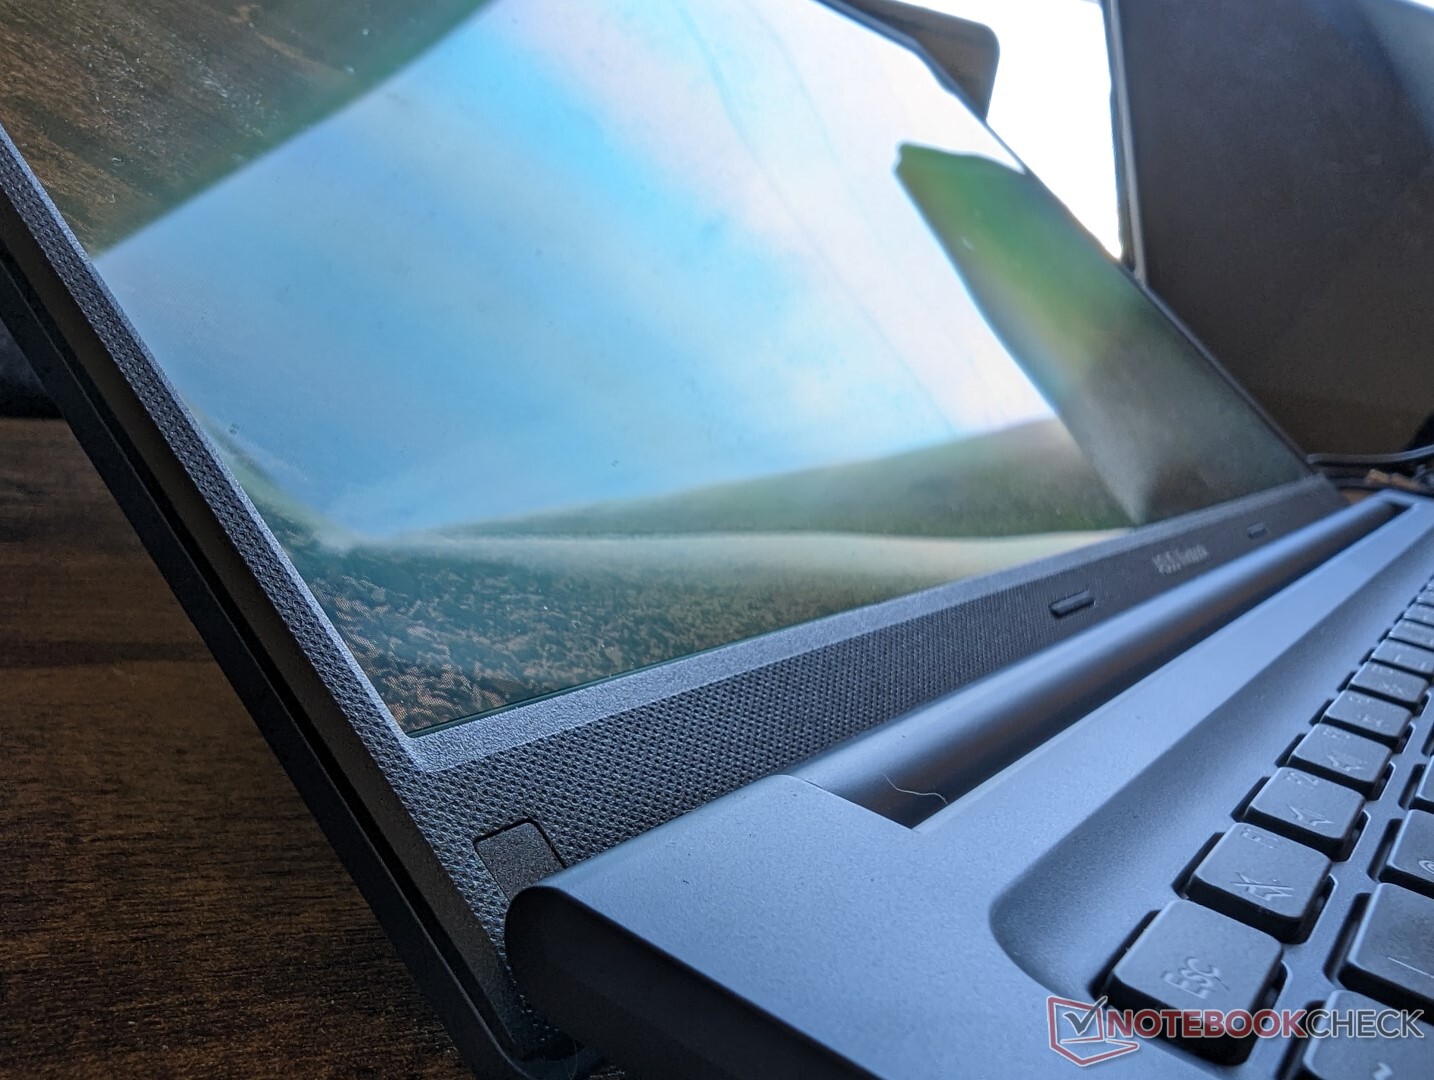
Outdoor visibility is a mixed bag. Though OLED tends to perform better than IPS in outdoor conditions, the panel on the Vivobook is simply not bright enough to overcome glare on the glossy overlay. Furthermore, the glare washes the screen in a blue hue which impacts visibility as well as colors as shown by the images below.
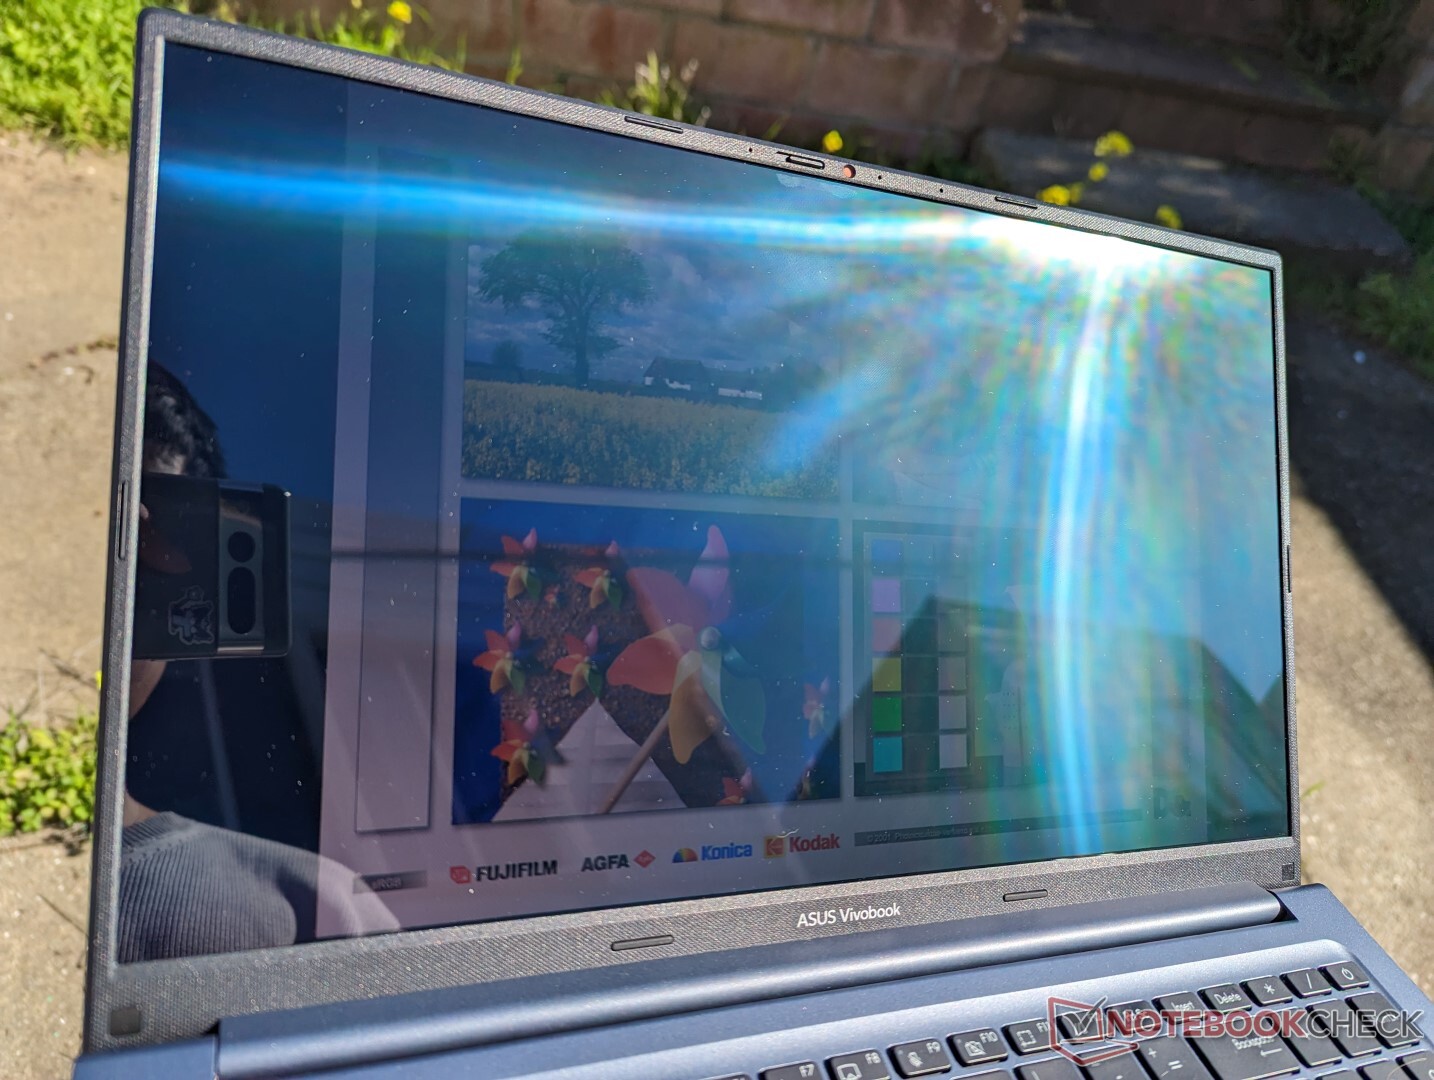

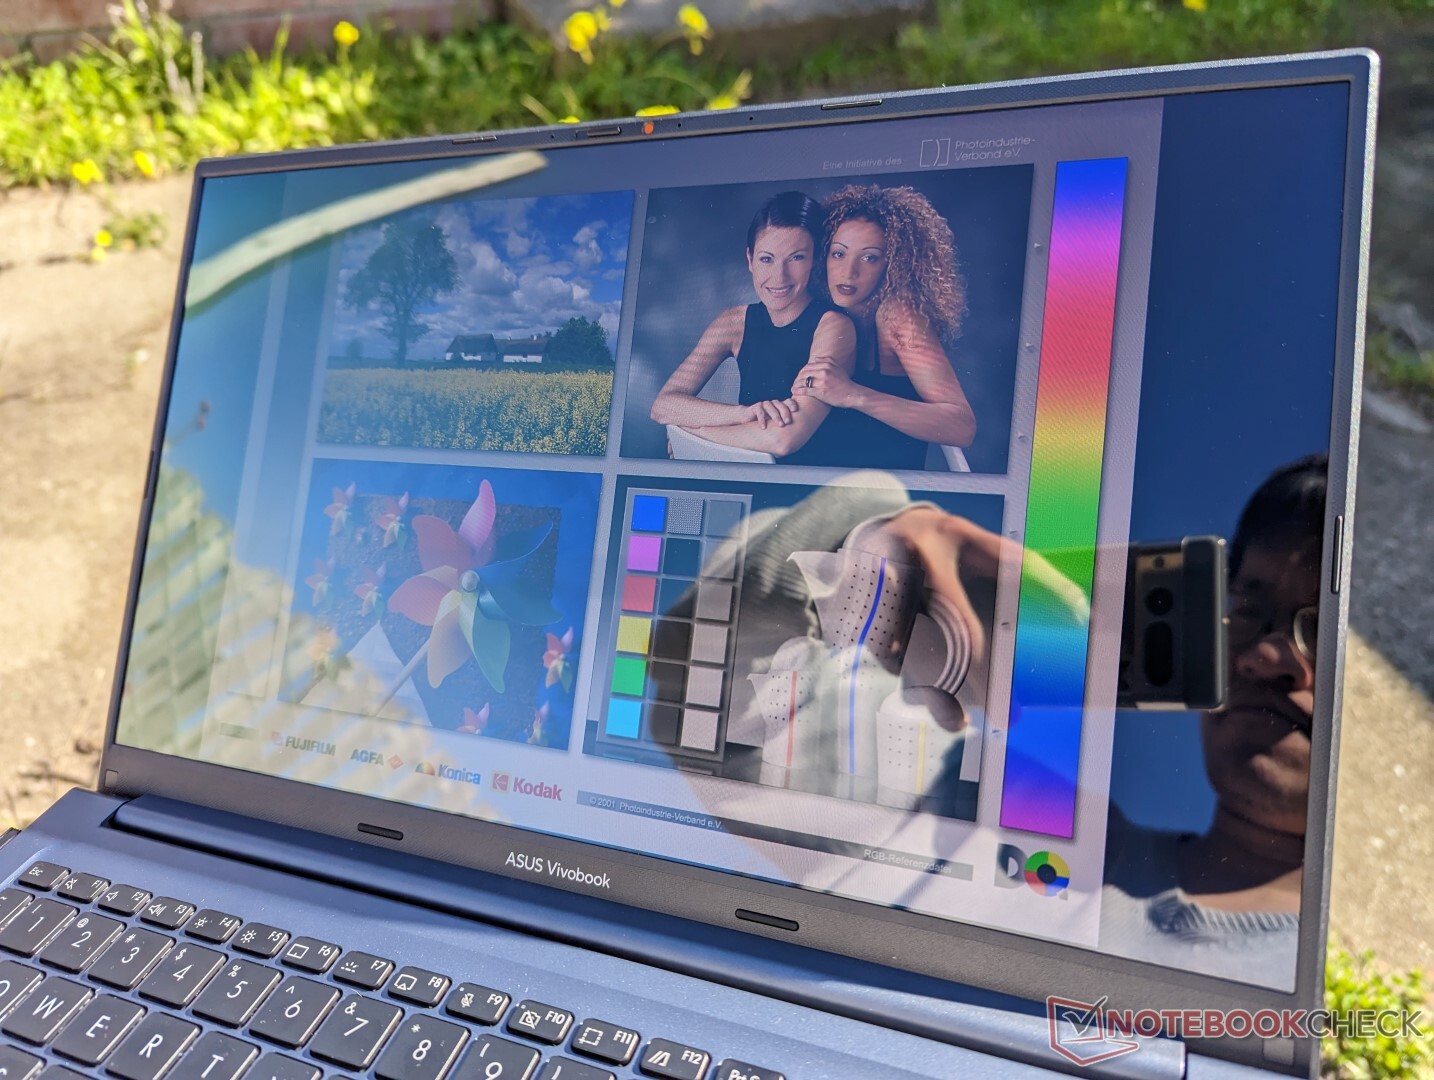
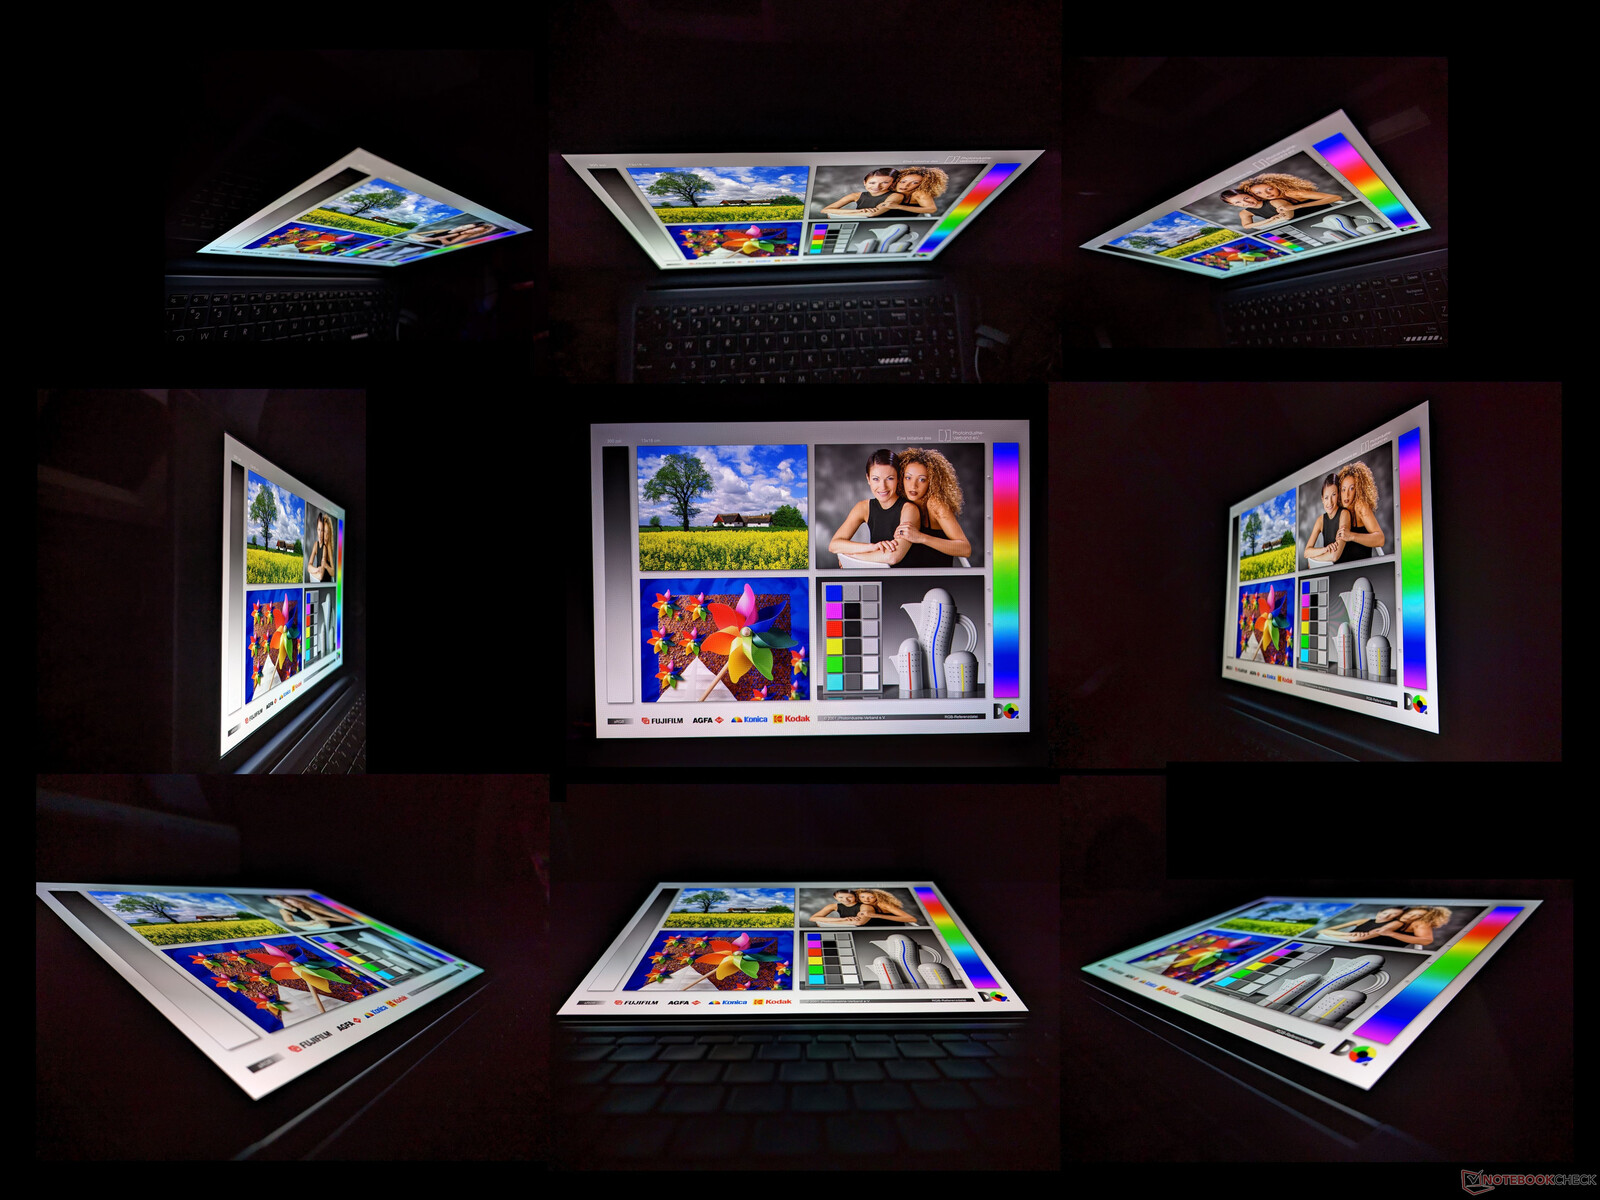
Viewing angles are excellent as with any OLED panel. Unlike on IPS, OLED panels exhibit a bluish rainbow effect from wide angles whereas the colors on an IPS panel would become grayer.
Performance — Ryzen H-series Processor
Testing Conditions
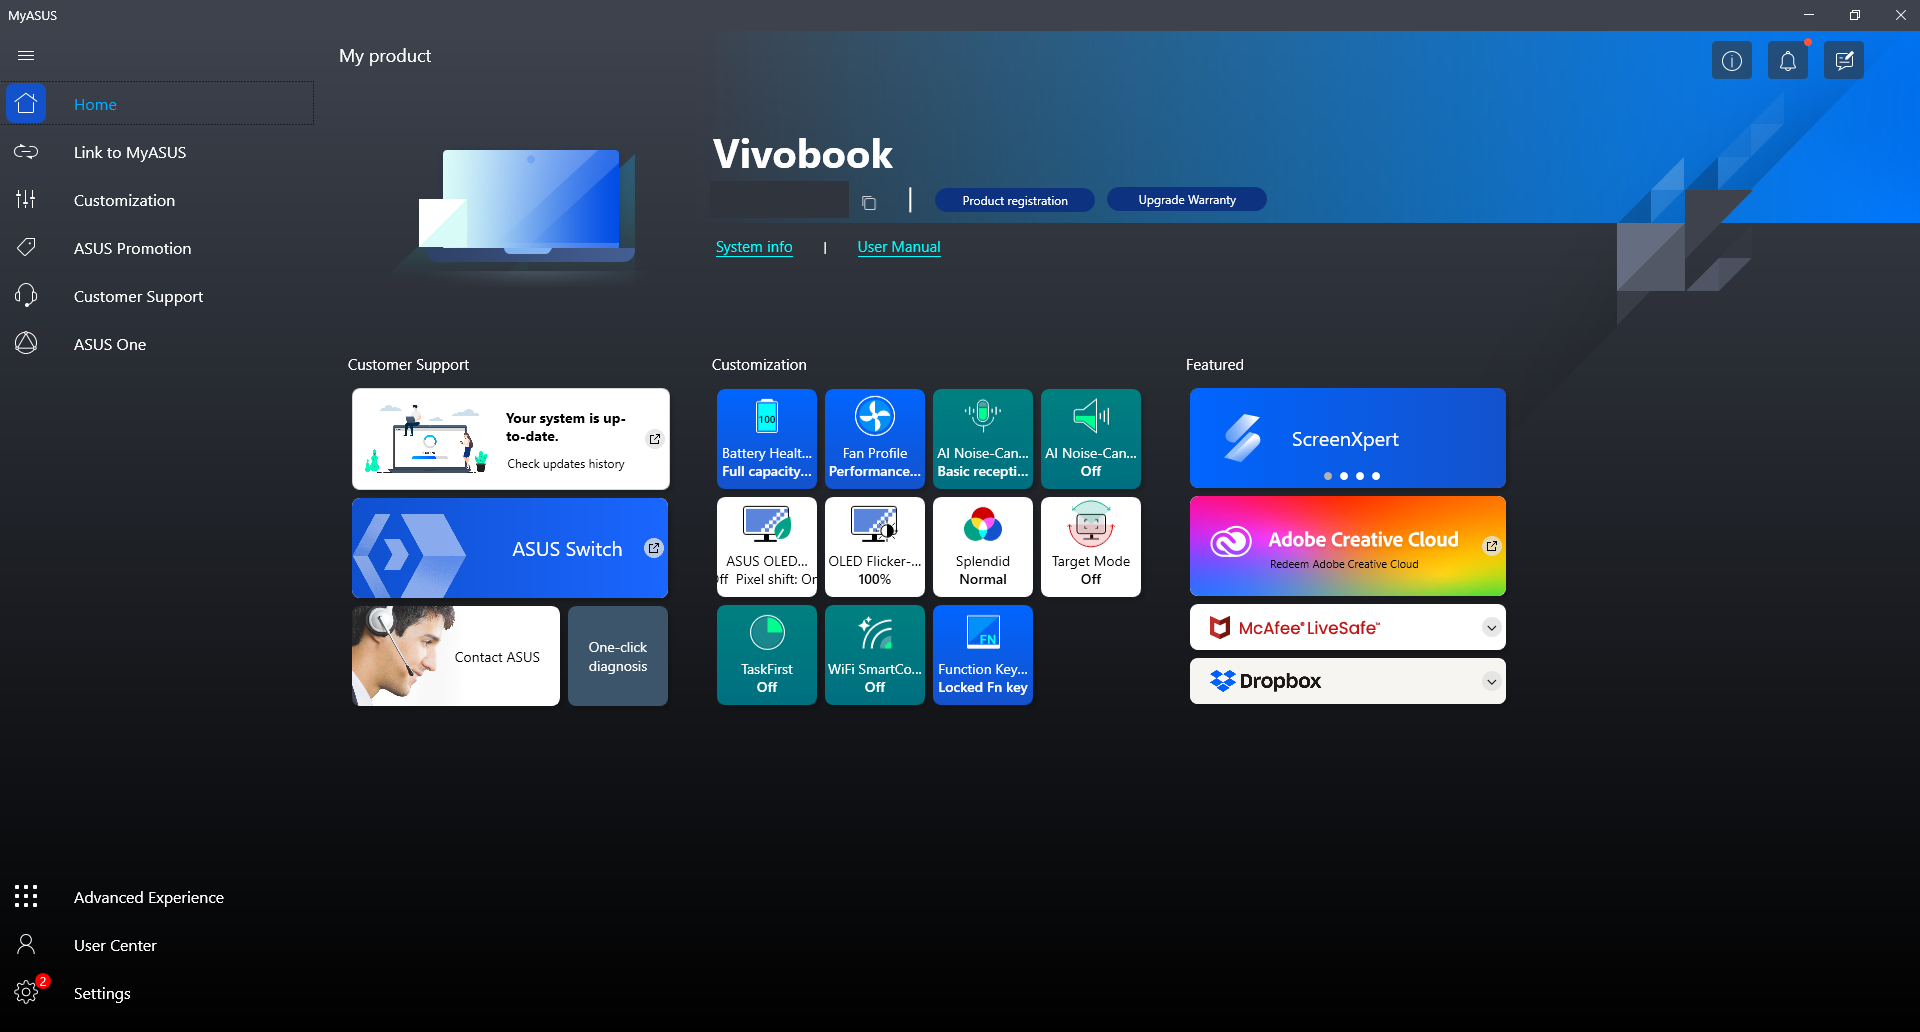
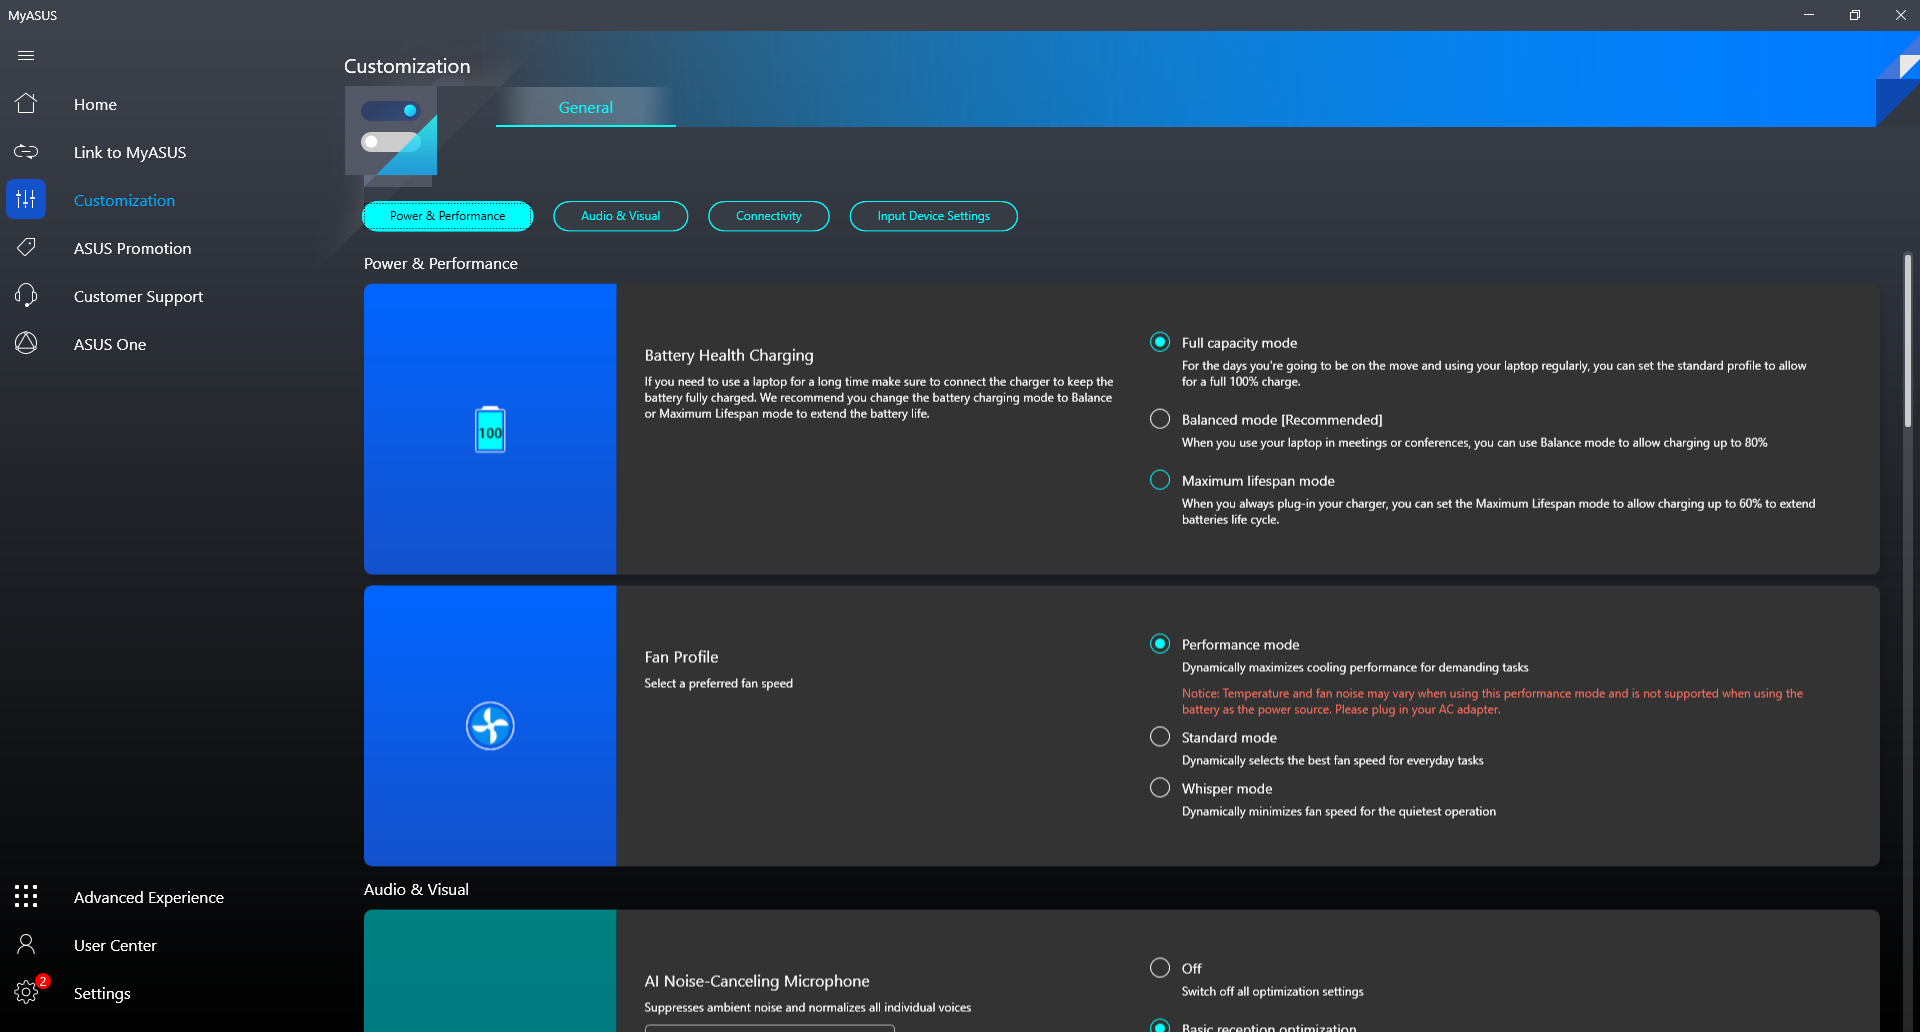
We set our unit to Performance mode via the MyAsus software and Performance mode via Windows prior to running any benchmarks below. Annoyingly, changing the power profile through Asus will not automatically change the power profile on Windows and vice versa. It's recommended that users become familiar with the MyAsus software as it is the hub for any critical updates, changing color profiles, and other Asus-specific features as shown by the screenshots below.
Processor
CPU performance is excellent with results that are within just a few percentage points of the average laptop in our database equipped with the same Ryzen 5 5600H CPU. It performs almost identically to the lower-power Ryzen 7 5700U and just 5 to 10 percent behind the newer Zen 3+ Ryzen 5 6600H. Performance sustainability in particular is excellent as exemplified by the steady CineBench R15 xT loop results below.
The Ryzen 5 5600H competes directly with the 11th gen Intel Core i5-11300H which it significantly outperforms by almost 2x in multi-threaded workloads. However, Intel fired back a year later with a much-improved 12th gen Core i5-12500H which outperforms our Ryzen CPU by about 30 percent.
Upgrading to the Ryzen 7 5800H configuration is expected to increase performance by up to 30 percent over our Ryzen 5 5600H configuration.
Cinebench R15 Multi Loop
Cinebench R20: CPU (Multi Core) | CPU (Single Core)
Cinebench R23: Multi Core | Single Core
Cinebench R15: CPU Multi 64Bit | CPU Single 64Bit
Blender: v2.79 BMW27 CPU
7-Zip 18.03: 7z b 4 | 7z b 4 -mmt1
Geekbench 5.5: Multi-Core | Single-Core
HWBOT x265 Benchmark v2.2: 4k Preset
LibreOffice : 20 Documents To PDF
R Benchmark 2.5: Overall mean
* ... smaller is better
* ... smaller is better
AIDA64: FP32 Ray-Trace | FPU Julia | CPU SHA3 | CPU Queen | FPU SinJulia | FPU Mandel | CPU AES | CPU ZLib | FP64 Ray-Trace | CPU PhotoWorxx
| Performance rating | |
| Asus VivoBook S15 D533UA | |
| Average AMD Ryzen 5 5600H | |
| Asus VivoBook 15 X M1503QA | |
| Lenovo ThinkBook 15 G3 ACL 21A400B2GE | |
| Asus Vivobook 15 K513EQ | |
| Dell Inspiron 15 3501 | |
| AIDA64 / FP32 Ray-Trace | |
| Average AMD Ryzen 5 5600H (9181 - 12636, n=14) | |
| Asus VivoBook S15 D533UA | |
| Asus VivoBook 15 X M1503QA | |
| Lenovo ThinkBook 15 G3 ACL 21A400B2GE | |
| Asus Vivobook 15 K513EQ | |
| Dell Inspiron 15 3501 | |
| AIDA64 / FPU Julia | |
| Average AMD Ryzen 5 5600H (51994 - 78250, n=14) | |
| Asus VivoBook 15 X M1503QA | |
| Asus VivoBook S15 D533UA | |
| Lenovo ThinkBook 15 G3 ACL 21A400B2GE | |
| Asus Vivobook 15 K513EQ | |
| Dell Inspiron 15 3501 | |
| AIDA64 / CPU SHA3 | |
| Average AMD Ryzen 5 5600H (1587 - 2675, n=14) | |
| Asus VivoBook 15 X M1503QA | |
| Asus Vivobook 15 K513EQ | |
| Asus VivoBook S15 D533UA | |
| Dell Inspiron 15 3501 | |
| Lenovo ThinkBook 15 G3 ACL 21A400B2GE | |
| AIDA64 / CPU Queen | |
| Asus VivoBook S15 D533UA | |
| Average AMD Ryzen 5 5600H (66699 - 77213, n=14) | |
| Asus VivoBook 15 X M1503QA | |
| Lenovo ThinkBook 15 G3 ACL 21A400B2GE | |
| Asus Vivobook 15 K513EQ | |
| Dell Inspiron 15 3501 | |
| AIDA64 / FPU SinJulia | |
| Asus VivoBook S15 D533UA | |
| Lenovo ThinkBook 15 G3 ACL 21A400B2GE | |
| Average AMD Ryzen 5 5600H (8340 - 9159, n=14) | |
| Asus VivoBook 15 X M1503QA | |
| Asus Vivobook 15 K513EQ | |
| Dell Inspiron 15 3501 | |
| AIDA64 / FPU Mandel | |
| Asus VivoBook 15 X M1503QA | |
| Average AMD Ryzen 5 5600H (28268 - 43274, n=14) | |
| Asus VivoBook S15 D533UA | |
| Lenovo ThinkBook 15 G3 ACL 21A400B2GE | |
| Asus Vivobook 15 K513EQ | |
| Dell Inspiron 15 3501 | |
| AIDA64 / CPU AES | |
| Average AMD Ryzen 5 5600H (39852 - 98939, n=14) | |
| Asus Vivobook 15 K513EQ | |
| Dell Inspiron 15 3501 | |
| Asus VivoBook S15 D533UA | |
| Lenovo ThinkBook 15 G3 ACL 21A400B2GE | |
| Asus VivoBook 15 X M1503QA | |
| AIDA64 / CPU ZLib | |
| Asus VivoBook S15 D533UA | |
| Average AMD Ryzen 5 5600H (507 - 649, n=14) | |
| Asus VivoBook 15 X M1503QA | |
| Lenovo ThinkBook 15 G3 ACL 21A400B2GE | |
| Asus Vivobook 15 K513EQ | |
| Dell Inspiron 15 3501 | |
| AIDA64 / FP64 Ray-Trace | |
| Asus VivoBook S15 D533UA | |
| Average AMD Ryzen 5 5600H (4811 - 6652, n=14) | |
| Asus VivoBook 15 X M1503QA | |
| Lenovo ThinkBook 15 G3 ACL 21A400B2GE | |
| Asus Vivobook 15 K513EQ | |
| Dell Inspiron 15 3501 | |
| AIDA64 / CPU PhotoWorxx | |
| Asus Vivobook 15 K513EQ | |
| Average AMD Ryzen 5 5600H (7419 - 24746, n=14) | |
| Dell Inspiron 15 3501 | |
| Asus VivoBook S15 D533UA | |
| Lenovo ThinkBook 15 G3 ACL 21A400B2GE | |
| Asus VivoBook 15 X M1503QA | |
System Performance
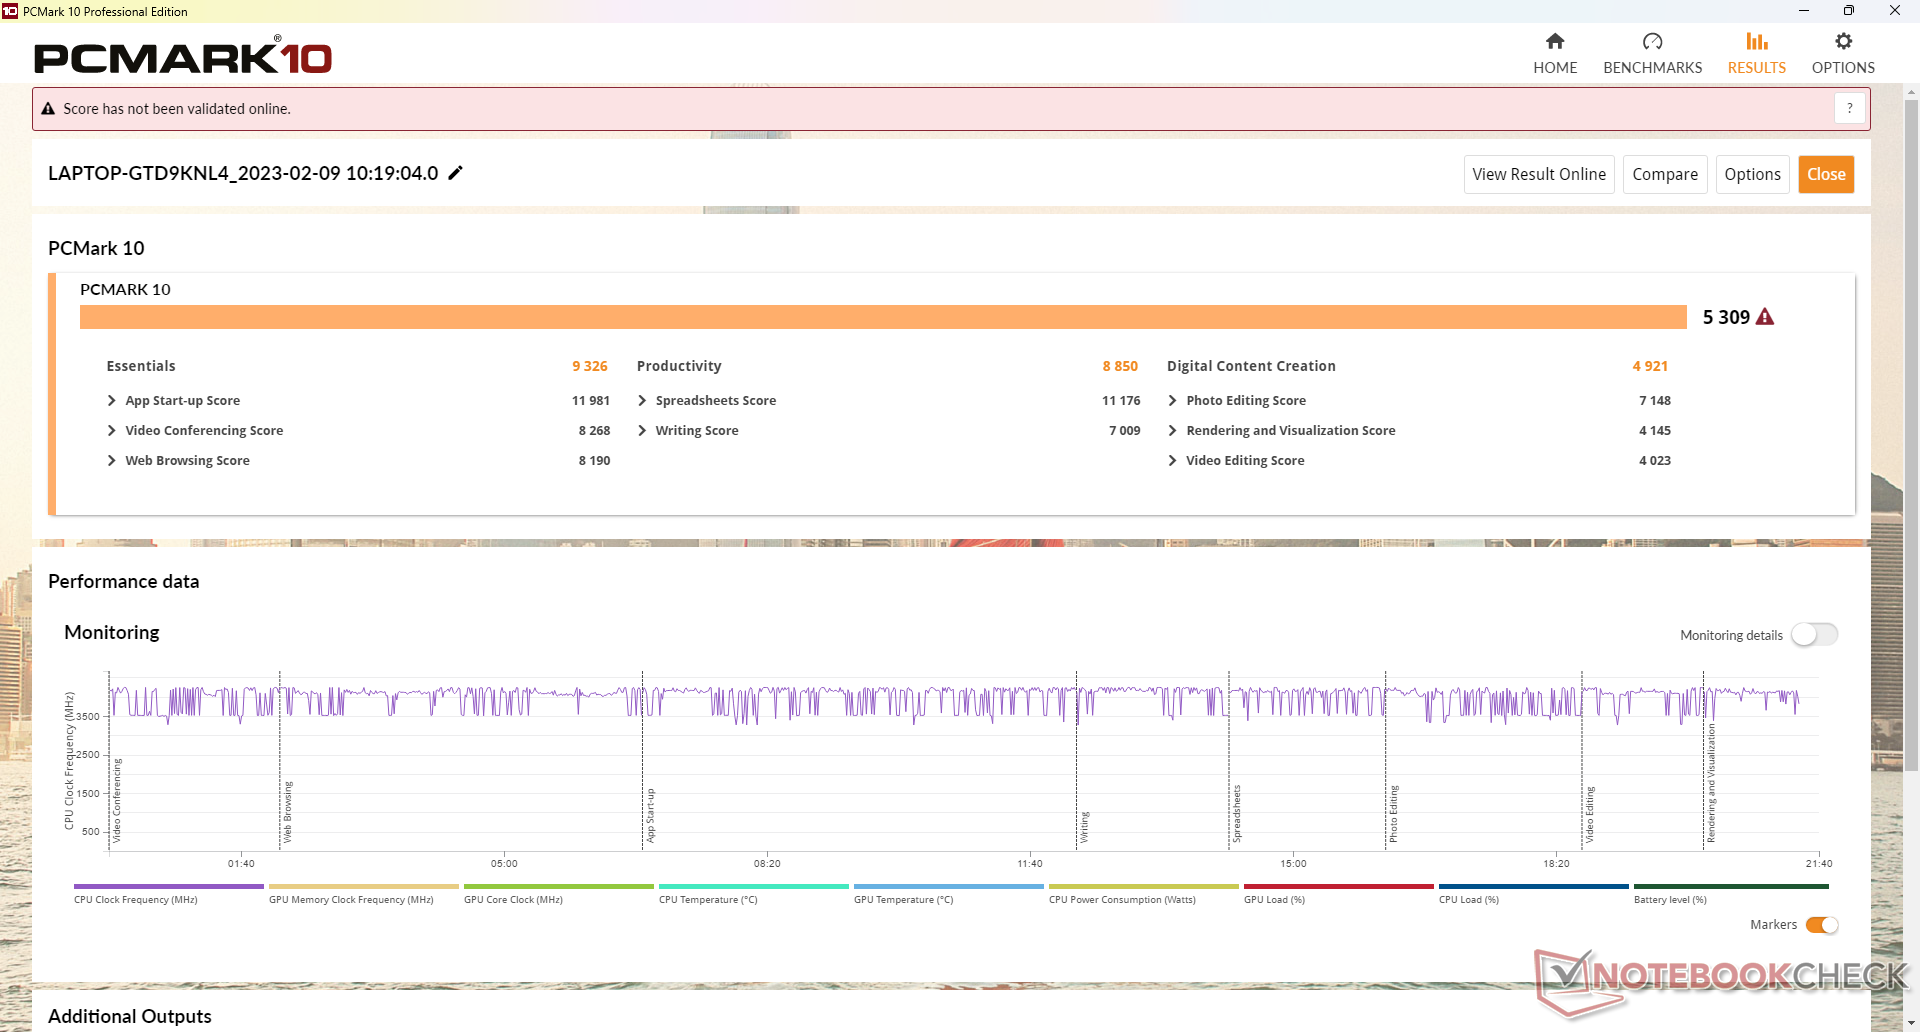
PCMark 10 scores are comparable to other U-series-powered Ultrabooks if not slightly higher due to our H-series CPU. Thus, the system still feels snappy for day-to-day loads despite the disappointing single-RAM configuration.
CrossMark: Overall | Productivity | Creativity | Responsiveness
| PCMark 10 / Score | |
| Average AMD Ryzen 5 5600H, AMD Radeon RX Vega 7 (5309 - 6189, n=4) | |
| Acer Swift 3 SF314-71-56U3 | |
| Asus VivoBook S15 D533UA | |
| Asus VivoBook 15 X M1503QA | |
| Asus Vivobook 15 K513EQ | |
| Dell Inspiron 15 5518-2X3JR | |
| Dell Inspiron 15 3501 | |
| Asus ZenBook UX535-M01440 | |
| Lenovo ThinkBook 15 G3 ACL 21A400B2GE | |
| PCMark 10 / Essentials | |
| Acer Swift 3 SF314-71-56U3 | |
| Average AMD Ryzen 5 5600H, AMD Radeon RX Vega 7 (9326 - 10503, n=4) | |
| Dell Inspiron 15 3501 | |
| Asus Vivobook 15 K513EQ | |
| Asus VivoBook 15 X M1503QA | |
| Asus VivoBook S15 D533UA | |
| Asus ZenBook UX535-M01440 | |
| Lenovo ThinkBook 15 G3 ACL 21A400B2GE | |
| Dell Inspiron 15 5518-2X3JR | |
| PCMark 10 / Productivity | |
| Average AMD Ryzen 5 5600H, AMD Radeon RX Vega 7 (8850 - 9642, n=4) | |
| Asus VivoBook 15 X M1503QA | |
| Asus Vivobook 15 K513EQ | |
| Dell Inspiron 15 5518-2X3JR | |
| Asus VivoBook S15 D533UA | |
| Lenovo ThinkBook 15 G3 ACL 21A400B2GE | |
| Acer Swift 3 SF314-71-56U3 | |
| Asus ZenBook UX535-M01440 | |
| Dell Inspiron 15 3501 | |
| PCMark 10 / Digital Content Creation | |
| Acer Swift 3 SF314-71-56U3 | |
| Average AMD Ryzen 5 5600H, AMD Radeon RX Vega 7 (4921 - 6352, n=4) | |
| Asus VivoBook S15 D533UA | |
| Asus ZenBook UX535-M01440 | |
| Asus VivoBook 15 X M1503QA | |
| Dell Inspiron 15 3501 | |
| Dell Inspiron 15 5518-2X3JR | |
| Lenovo ThinkBook 15 G3 ACL 21A400B2GE | |
| Asus Vivobook 15 K513EQ | |
| CrossMark / Overall | |
| Acer Swift 3 SF314-71-56U3 | |
| Average AMD Ryzen 5 5600H, AMD Radeon RX Vega 7 (1157 - 1353, n=4) | |
| Asus VivoBook 15 X M1503QA | |
| Lenovo ThinkBook 15 G3 ACL 21A400B2GE | |
| CrossMark / Productivity | |
| Acer Swift 3 SF314-71-56U3 | |
| Average AMD Ryzen 5 5600H, AMD Radeon RX Vega 7 (1217 - 1384, n=4) | |
| Asus VivoBook 15 X M1503QA | |
| Lenovo ThinkBook 15 G3 ACL 21A400B2GE | |
| CrossMark / Creativity | |
| Acer Swift 3 SF314-71-56U3 | |
| Average AMD Ryzen 5 5600H, AMD Radeon RX Vega 7 (1184 - 1377, n=4) | |
| Asus VivoBook 15 X M1503QA | |
| Lenovo ThinkBook 15 G3 ACL 21A400B2GE | |
| CrossMark / Responsiveness | |
| Acer Swift 3 SF314-71-56U3 | |
| Average AMD Ryzen 5 5600H, AMD Radeon RX Vega 7 (926 - 1225, n=4) | |
| Asus VivoBook 15 X M1503QA | |
| Lenovo ThinkBook 15 G3 ACL 21A400B2GE | |
| PCMark 10 Score | 5309 points | |
Help | ||
| AIDA64 / Memory Copy | |
| Average AMD Ryzen 5 5600H (20549 - 42141, n=14) | |
| Asus Vivobook 15 K513EQ | |
| Asus VivoBook S15 D533UA | |
| Dell Inspiron 15 3501 | |
| Asus VivoBook 15 X M1503QA | |
| Lenovo ThinkBook 15 G3 ACL 21A400B2GE | |
| AIDA64 / Memory Read | |
| Asus Vivobook 15 K513EQ | |
| Asus VivoBook S15 D533UA | |
| Average AMD Ryzen 5 5600H (22917 - 47595, n=14) | |
| Dell Inspiron 15 3501 | |
| Lenovo ThinkBook 15 G3 ACL 21A400B2GE | |
| Asus VivoBook 15 X M1503QA | |
| AIDA64 / Memory Write | |
| Asus Vivobook 15 K513EQ | |
| Asus VivoBook S15 D533UA | |
| Average AMD Ryzen 5 5600H (20226 - 44872, n=14) | |
| Dell Inspiron 15 3501 | |
| Lenovo ThinkBook 15 G3 ACL 21A400B2GE | |
| Asus VivoBook 15 X M1503QA | |
| AIDA64 / Memory Latency | |
| Asus VivoBook S15 D533UA | |
| Dell Inspiron 15 3501 | |
| Lenovo ThinkBook 15 G3 ACL 21A400B2GE | |
| Asus Vivobook 15 K513EQ | |
| Average AMD Ryzen 5 5600H (75 - 89.1, n=14) | |
| Asus VivoBook 15 X M1503QA | |
* ... smaller is better
DPC Latency
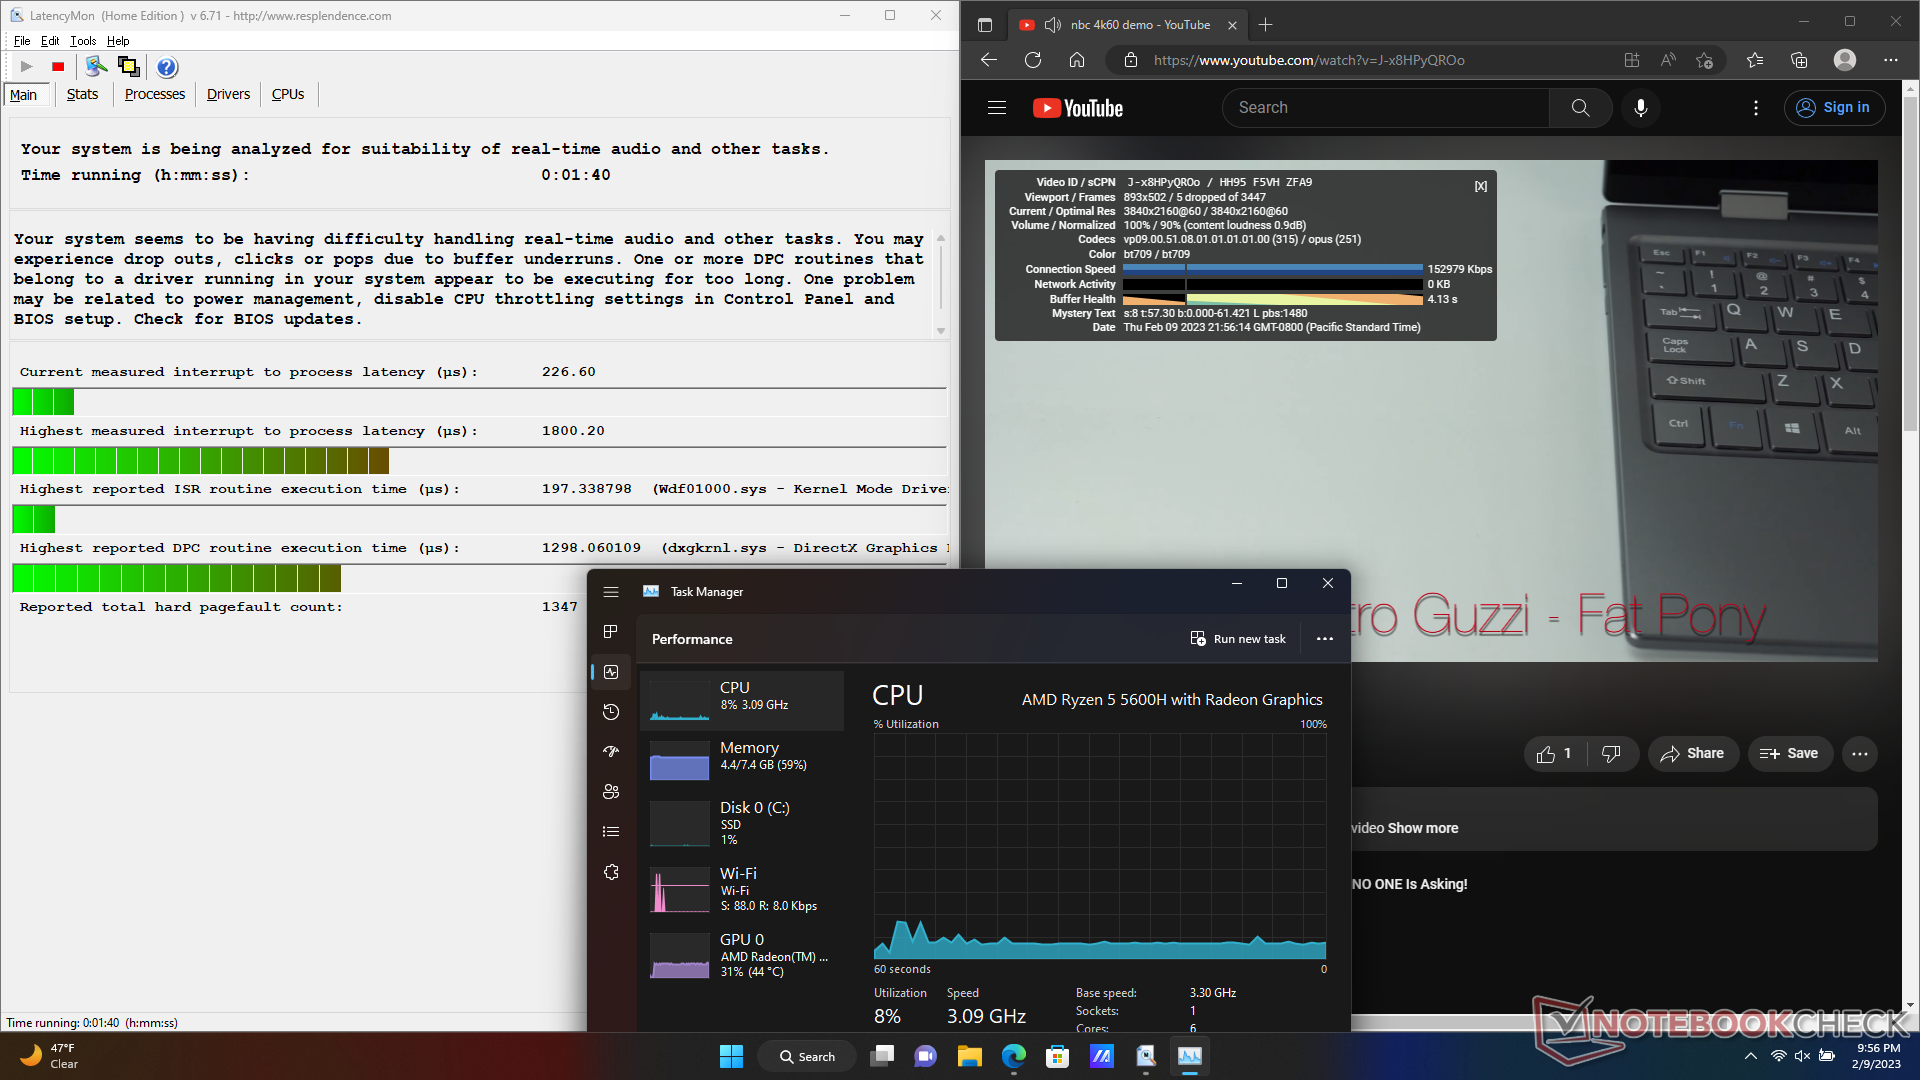
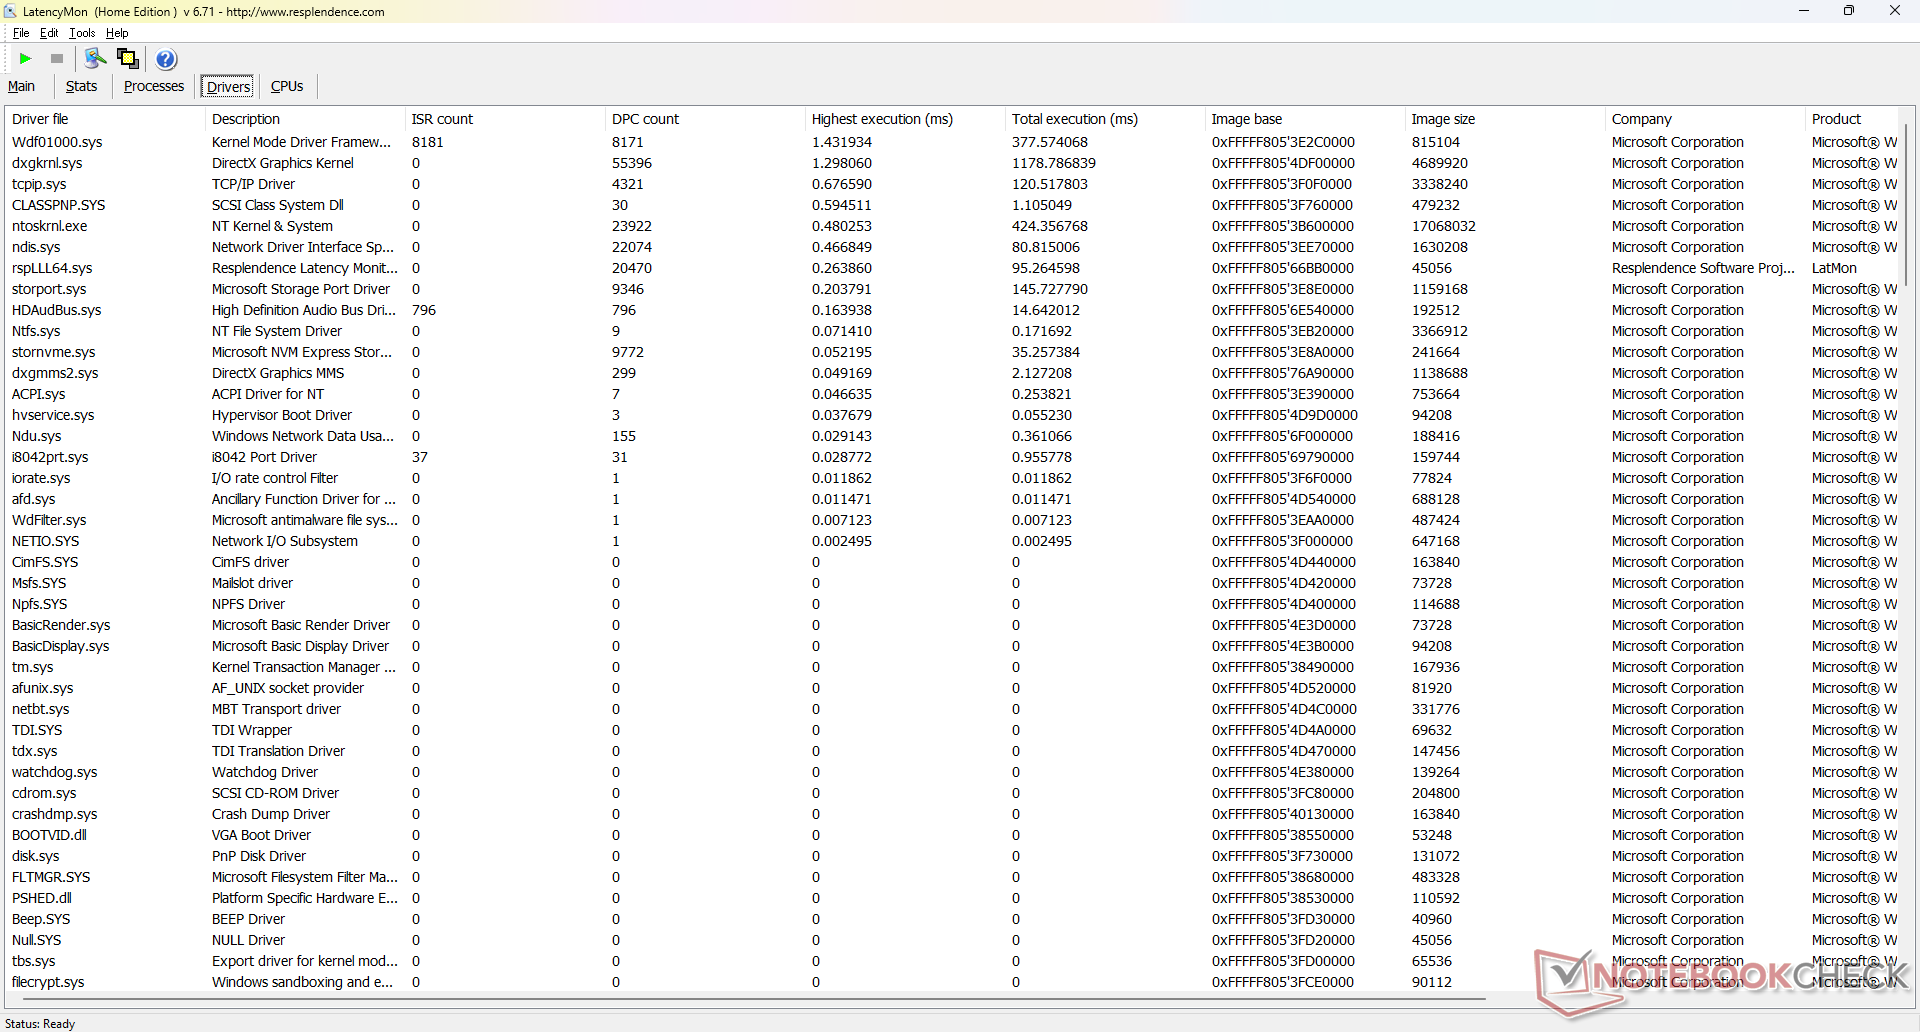
LatencyMon reveals DPC issues when opening multiple browser tabs of our homepage. 4K video playback at 60 FPS is imperfect as well with 5 dropped frames during our minute-long test video. This shouldn't be a huge issue, however, since the laptop is incapable of outputting to a 4K monitor at 60 Hz, anyway.
| DPC Latencies / LatencyMon - interrupt to process latency (max), Web, Youtube, Prime95 | |
| Asus Vivobook 15 K513EQ | |
| Asus VivoBook 15 X M1503QA | |
| Lenovo ThinkBook 15 G3 ACL 21A400B2GE | |
| Dell Inspiron 15 3501 | |
| Asus ZenBook UX535-M01440 | |
| Asus VivoBook S15 D533UA | |
* ... smaller is better
Storage Devices — Supports One SSD Only
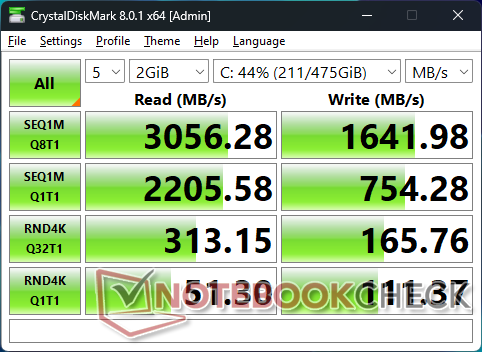
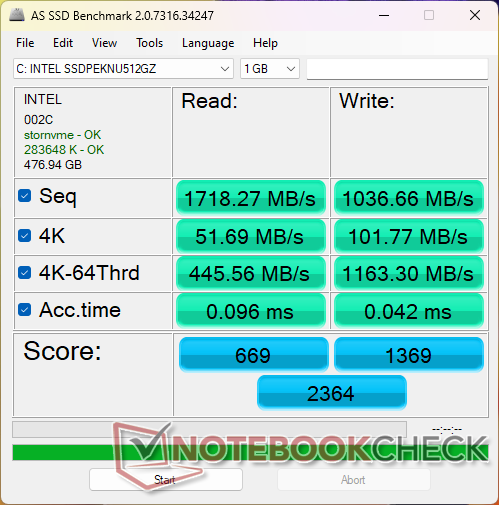
The system supports PCIe3 drives instead of PCIe4 likely to save on costs. The 512 GB Intel 670p in our test unit is a midrange PCIe3 x4 NVMe drive with sequential read and write rates of about 3000 MB/s and 1600 MB/s, respectively. Performance appears to fluctuate slightly when under stress meaning that it can have issues maintaining high transfer rates for long periods. When considering the price range and performance level of the laptop, however, this won't matter much for most workloads.

| Drive Performance rating - Percent | |
| Asus VivoBook S15 D533UA | |
| Dell Inspiron 15 3501 | |
| Asus ZenBook UX535-M01440 | |
| Lenovo ThinkBook 15 G3 ACL 21A400B2GE | |
| Asus VivoBook 15 X M1503QA | |
| Asus Vivobook 15 K513EQ | |
* ... smaller is better
Disk Throttling: DiskSpd Read Loop, Queue Depth 8
GPU Performance — Upgrade To Dual-Channel RAM Whenever Possible
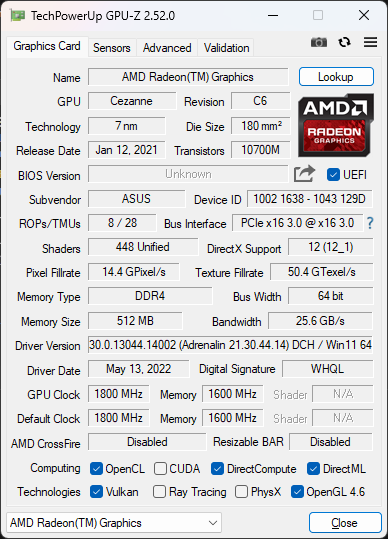
Graphics performance is disappointing at around 35 to 40 percent slower than the average AMD laptop in our database with the same integrated Radeon RX Vega 7 GPU. The deficit is so bad that the Vega 8 or competing Iris Xe 96 EUs can each offer between 1.5x to 2x the graphics performance over our Asus. Nonetheless, upgrading from an older UHD Graphics 620 would still improve graphics performance by roughly 50 percent.
Our underperforming GPU can be attributed to the single-channel RAM configuration of our test unit. Adding another stick of RAM for double-channel configuration should improve graphics performance significantly to be more in line with other RX Vega 7 laptops.
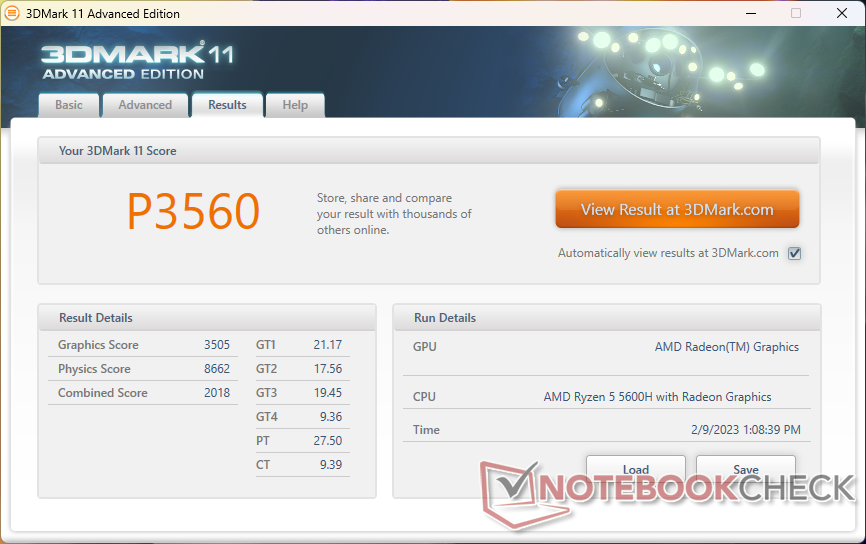
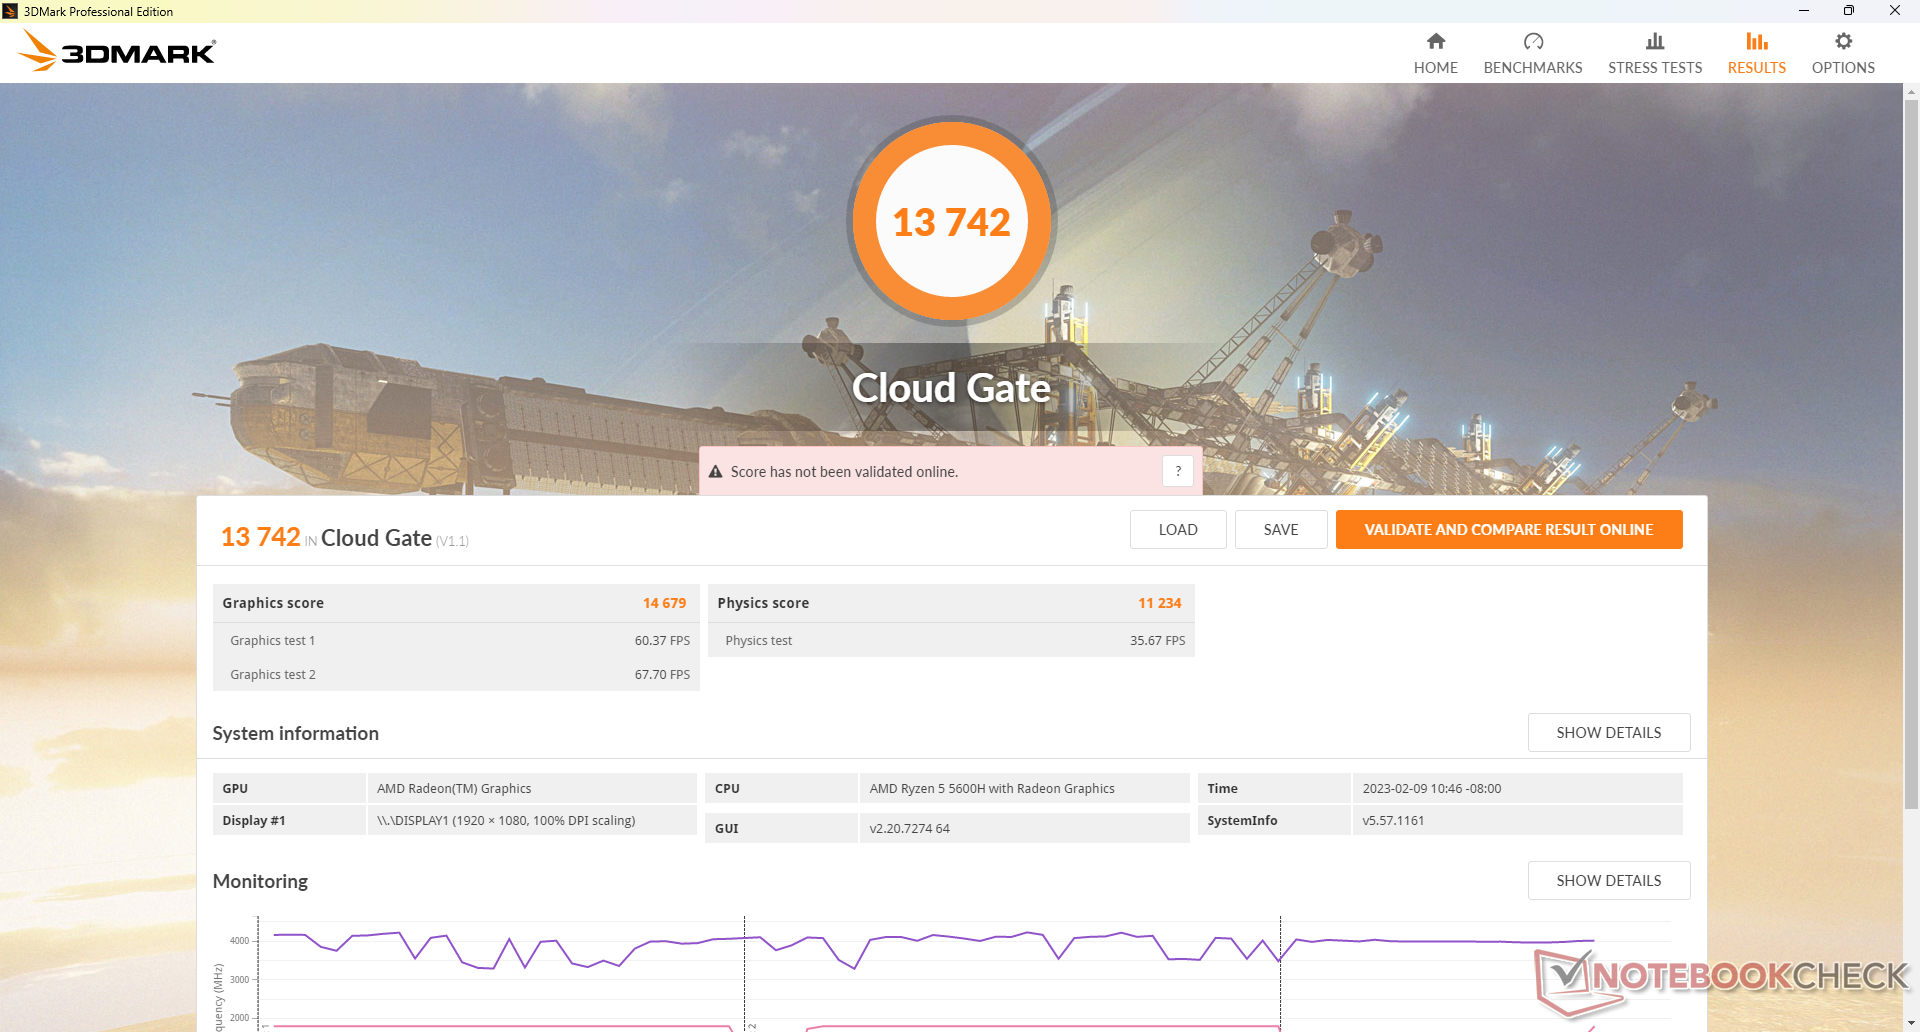
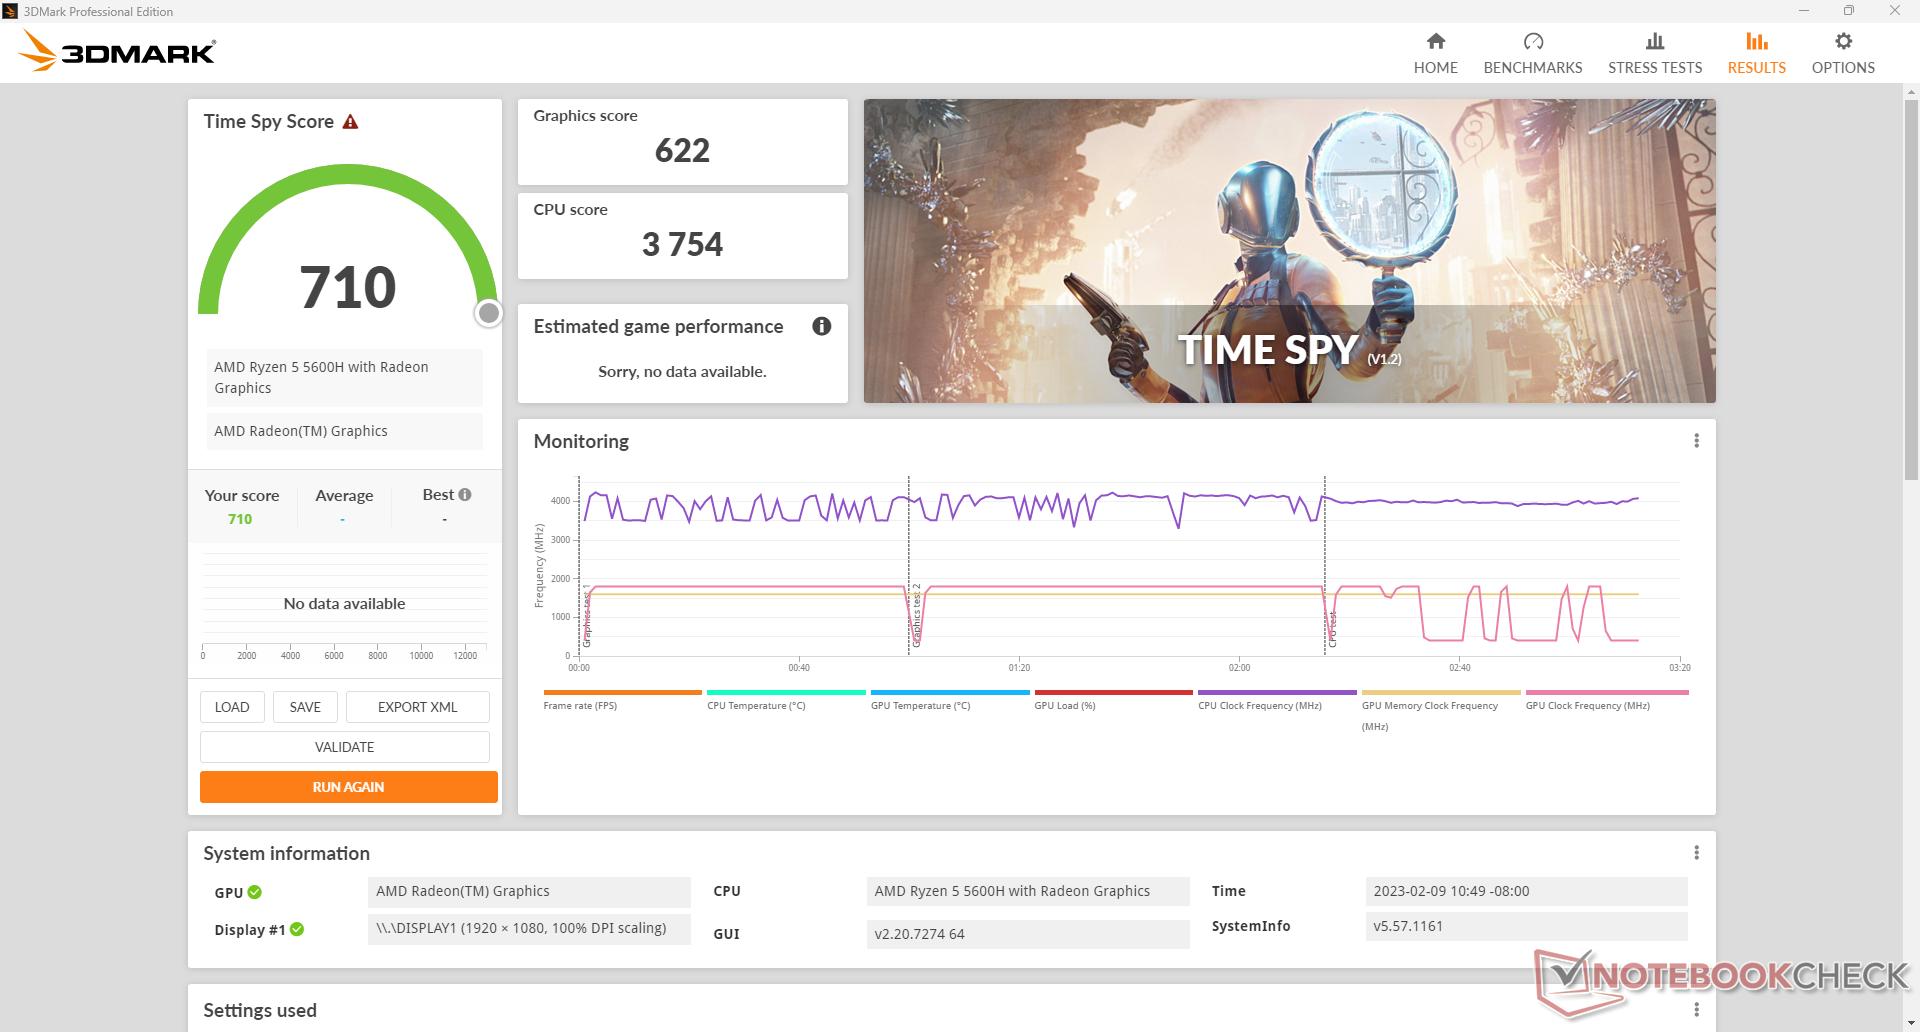
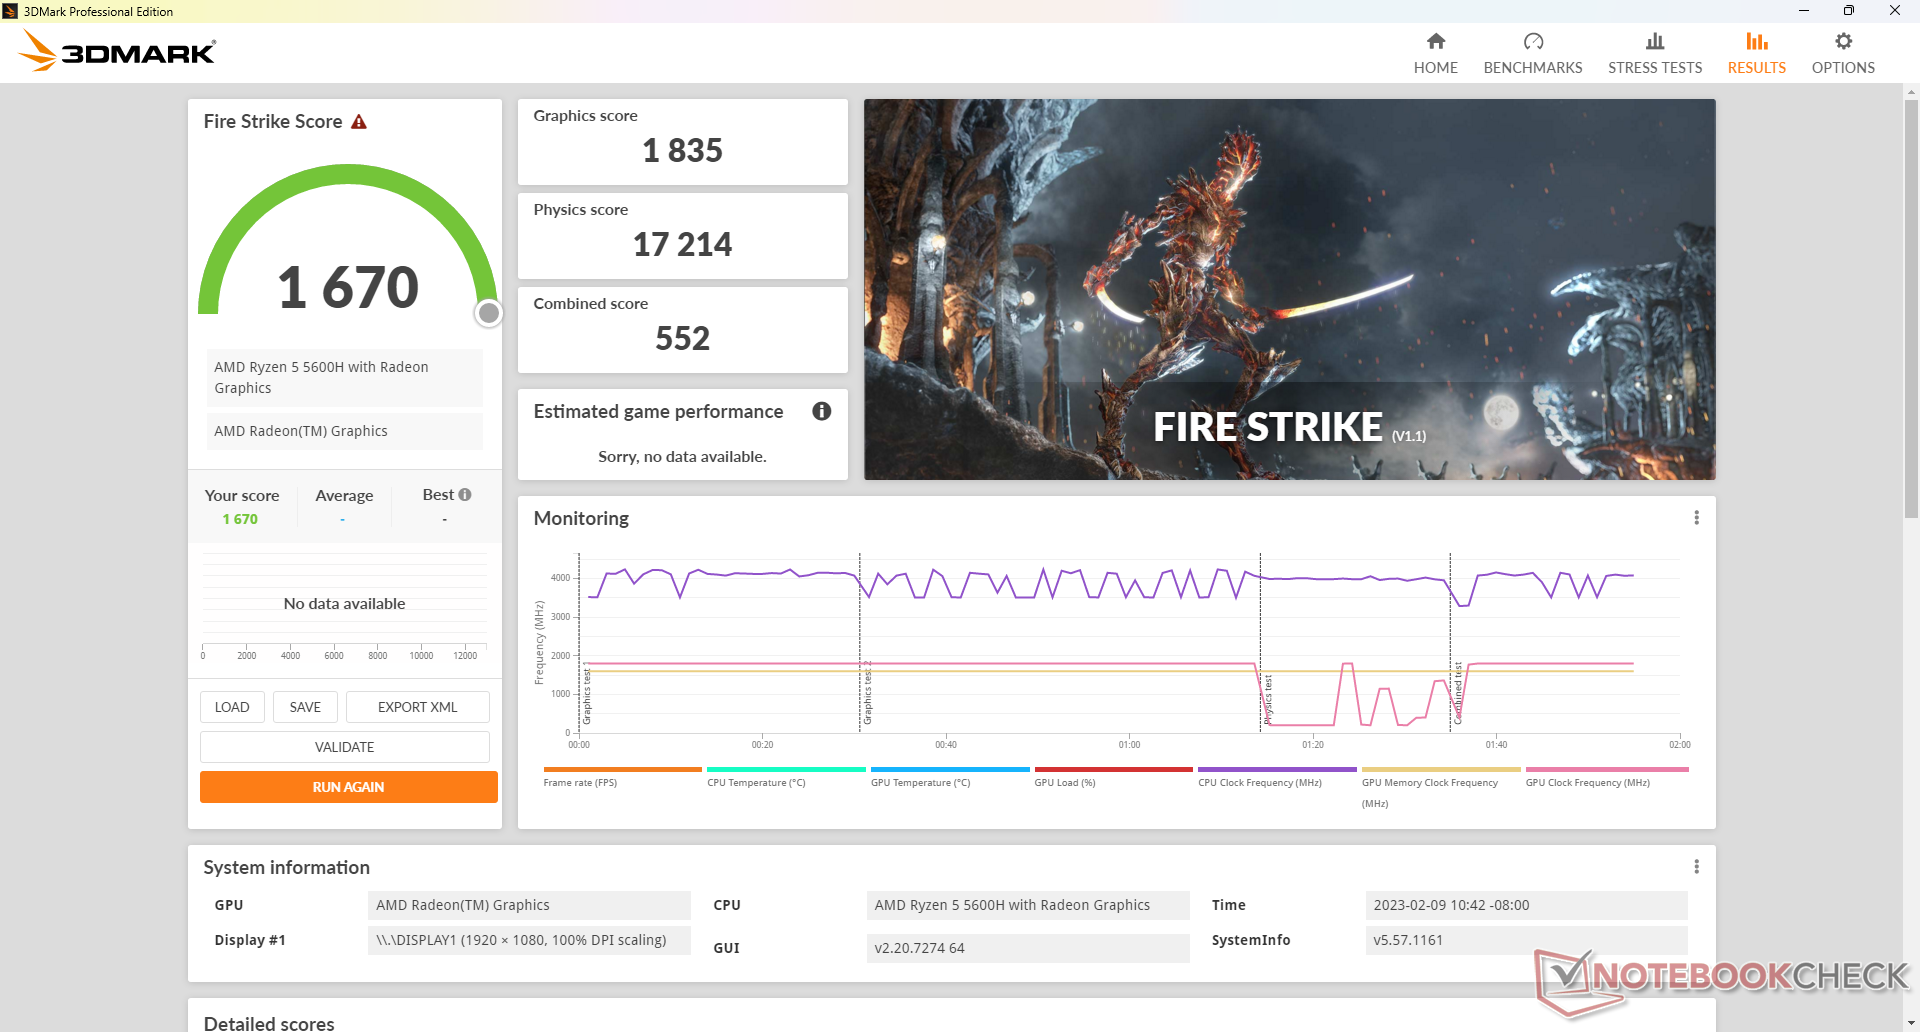
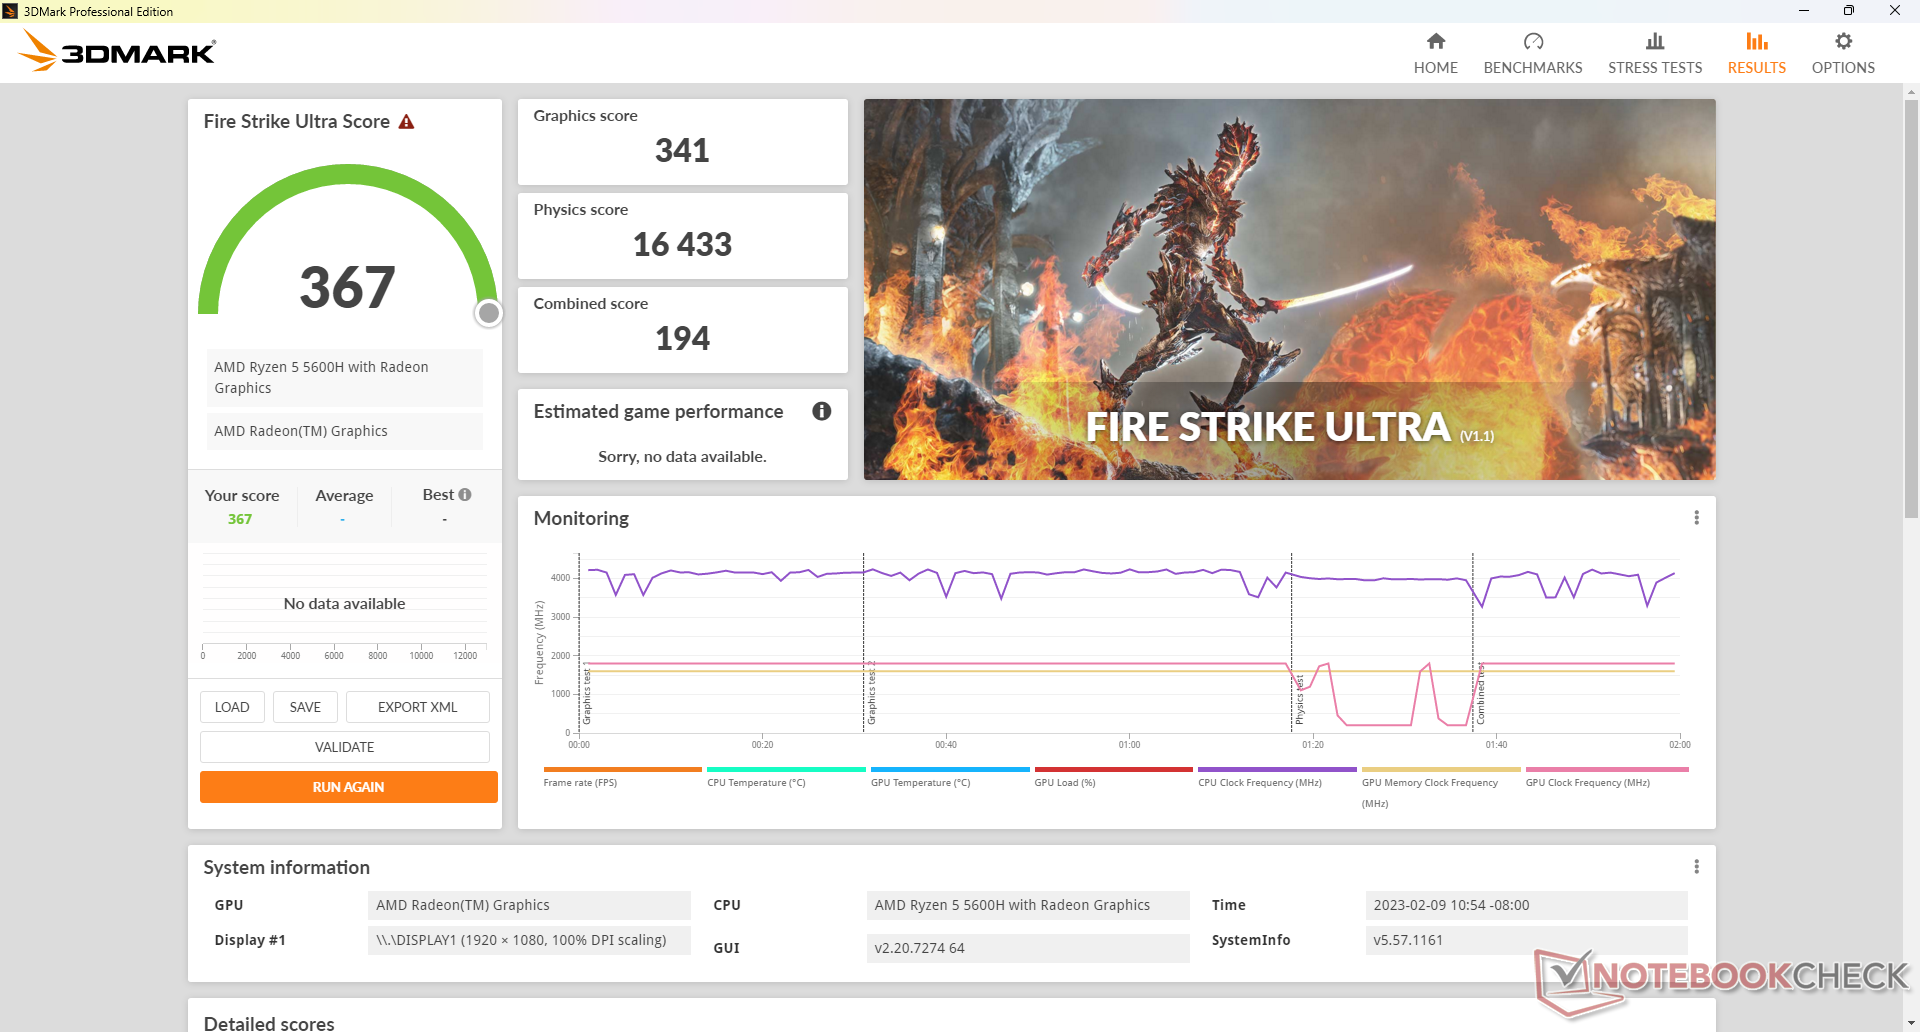
| 3DMark 11 Performance | 3560 points | |
| 3DMark Cloud Gate Standard Score | 13742 points | |
| 3DMark Fire Strike Score | 1670 points | |
| 3DMark Time Spy Score | 710 points | |
Help | ||
| Cyberpunk 2077 1.6 | |
| 1280x720 Low Preset | |
| Average AMD Radeon RX Vega 7 (18.1 - 35.8, n=5) | |
| Asus VivoBook 15 X M1503QA | |
| 1920x1080 Low Preset | |
| Lenovo IdeaPad Gaming 3 15ARH7 | |
| Samsung Galaxy Book2 15 | |
| Average AMD Radeon RX Vega 7 (10 - 20.9, n=4) | |
| Asus VivoBook 15 X M1503QA | |
Idling on Witcher 3 reveals performance stability issues as frame rates would periodically dip to 15 FPS before immediately recovering as shown by the graph below. This is usually attributed to poor resource management of background applications that can interrupt the main program in focus. Inexpensive laptops like the Vivobook tend to have more bloatware than usual.
Witcher 3 FPS Chart
| low | med. | high | ultra | |
|---|---|---|---|---|
| GTA V (2015) | 52.4 | 45.6 | 11.9 | 5.09 |
| The Witcher 3 (2015) | 36 | 23 | 11.2 | 8 |
| Dota 2 Reborn (2015) | 94.3 | 59 | 28 | 26.3 |
| Final Fantasy XV Benchmark (2018) | 19 | 9.75 | 6.53 | |
| X-Plane 11.11 (2018) | 32.9 | 26.1 | 23.4 | |
| Strange Brigade (2018) | 39.7 | 15.2 | 12.8 | 11 |
| Cyberpunk 2077 1.6 (2022) | 10 |
Emissions
System Noise — Very Quiet Most Of The Time
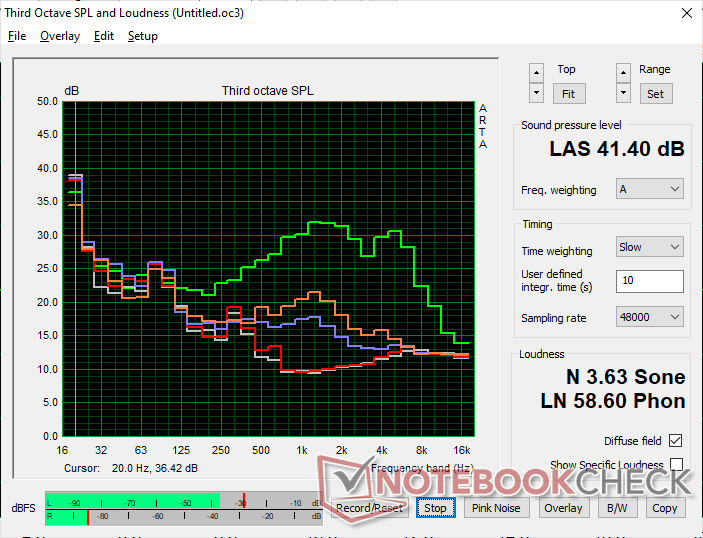
The system is excellent at remaining quiet for long periods of stress. When running the first benchmark scene of 3DMark 06, for example, the test had to be repeated three times before fan noise would increase appreciably. Even then, fan noise is just audible at 27.3 dB(A) against a silent background of 23.8 dB(A) compared to 35 dB(A) or even 45 dB(A) on the Dell Inspiron 15 3501 or VivoBook S15, respectively.
We suspect that the quieter-than-average fan noise above may be linked to the slower-than-average graphics performance of our single-channel configuration. When running Prime95 and FurMark to stress the processor even further, for example, fan noise would top out at a louder ceiling of 41 dB(A). Otherwise, expect the system to run quietly for most daily workloads including browsing or video streaming.

Noise level
| Idle |
| 24.1 / 24.1 / 24.1 dB(A) |
| Load |
| 27.3 / 41.4 dB(A) |
 | ||
30 dB silent 40 dB(A) audible 50 dB(A) loud |
||
min: | ||
| Asus VivoBook 15 X M1503QA Vega 7, R5 5600H, Intel SSD 670p SSDPEKNU512GZ | Asus Vivobook 15 K513EQ GeForce MX350, i7-1165G7, Intel SSD 660p SSDPEKNW512G8 | Asus VivoBook S15 D533UA Vega 8, R7 5700U, WDC PC SN530 SDBPNPZ-1T00 | Asus ZenBook UX535-M01440 GeForce GTX 1650 Ti Max-Q, i7-10750H, WDC PC SN730 SDBPNTY-1T00 | Lenovo ThinkBook 15 G3 ACL 21A400B2GE Vega 7, R5 5500U, Samsung PM991A MZALQ256HBJD | Dell Inspiron 15 3501 Iris Xe G7 96EUs, i7-1165G7, Samsung PM991a MZ9LQ512HBLU-00BD1 | |
|---|---|---|---|---|---|---|
| Noise | -14% | -20% | -14% | -7% | -9% | |
| off / environment * (dB) | 23.8 | 23.4 2% | 26 -9% | 24.6 -3% | 25.5 -7% | 26 -9% |
| Idle Minimum * (dB) | 24.1 | 23.6 2% | 26 -8% | 24.6 -2% | 25.5 -6% | 26 -8% |
| Idle Average * (dB) | 24.1 | 23.6 2% | 26 -8% | 24.6 -2% | 25.5 -6% | 26 -8% |
| Idle Maximum * (dB) | 24.1 | 23.6 2% | 28.8 -20% | 24.6 -2% | 25.5 -6% | 26 -8% |
| Load Average * (dB) | 27.3 | 41 -50% | 45 -65% | 41.3 -51% | 28.5 -4% | 35.9 -32% |
| Witcher 3 ultra * (dB) | 29.7 | 42.9 -44% | 42 -41% | |||
| Load Maximum * (dB) | 41.4 | 47 -14% | 45 -9% | 41.4 -0% | 45.6 -10% | 35.8 14% |
* ... smaller is better
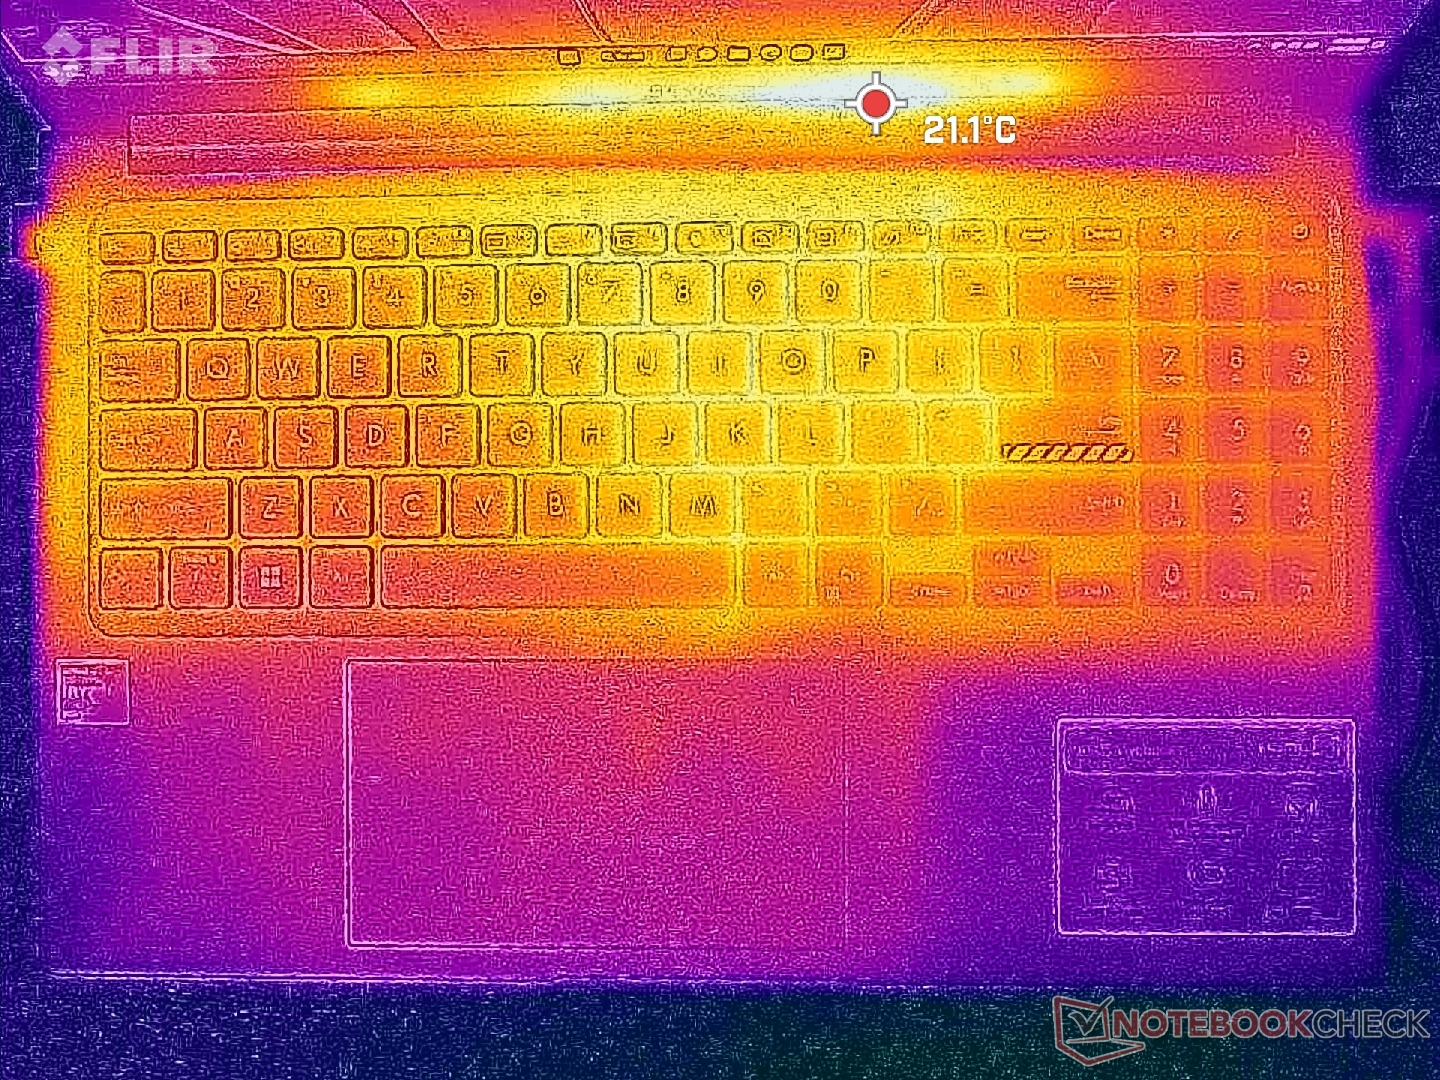
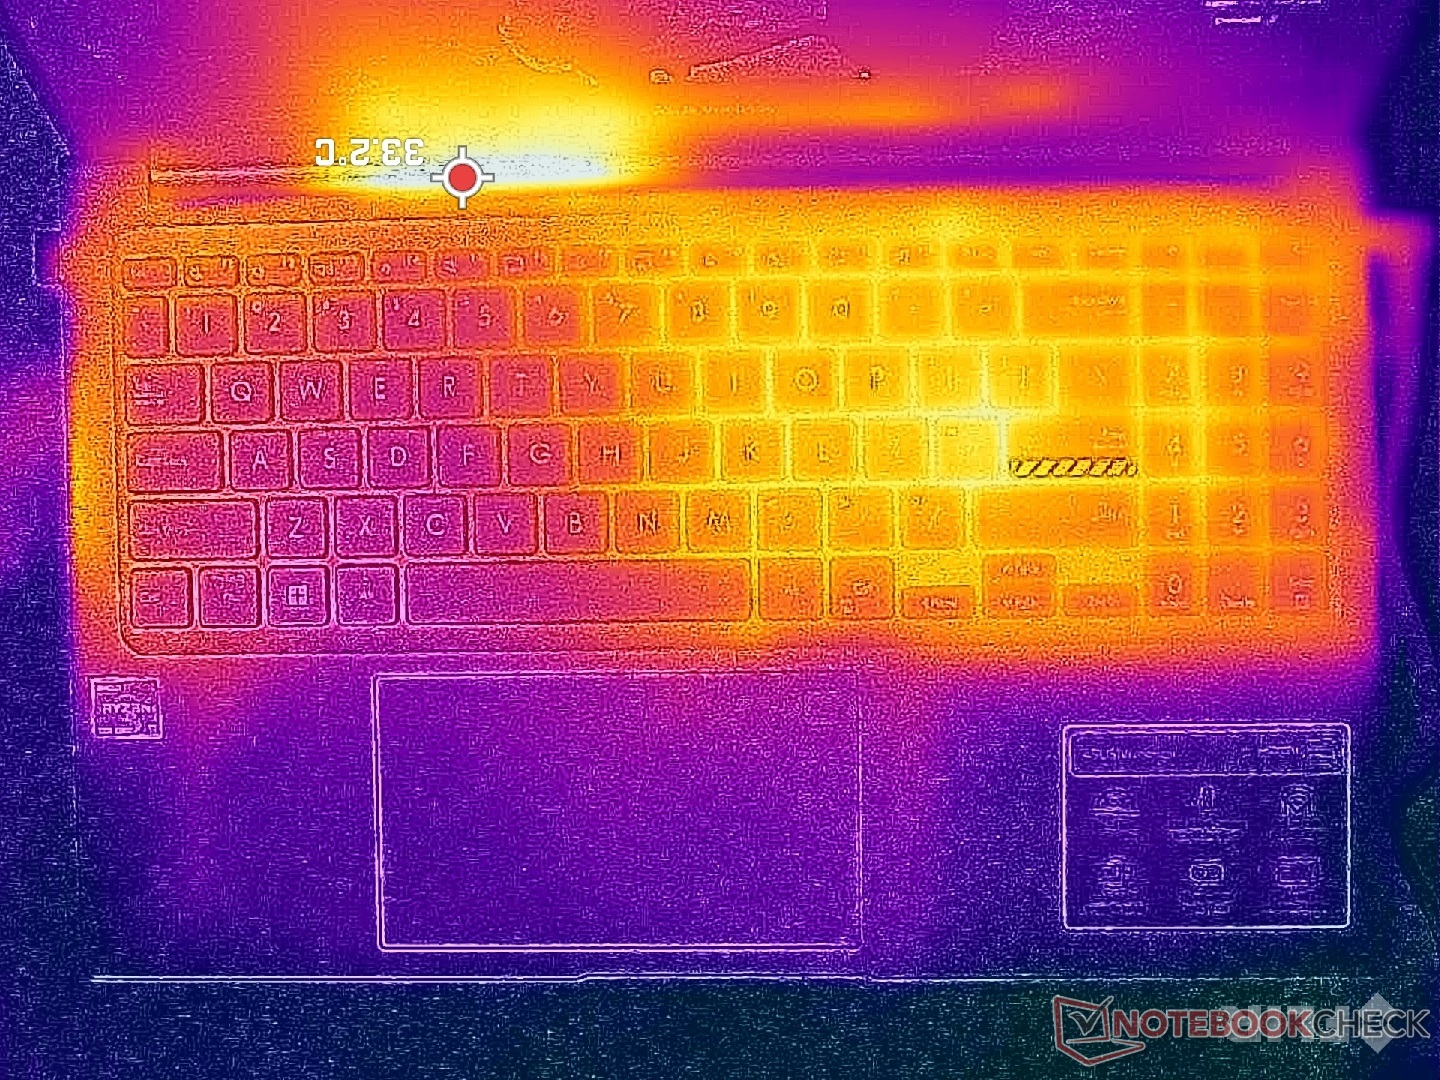
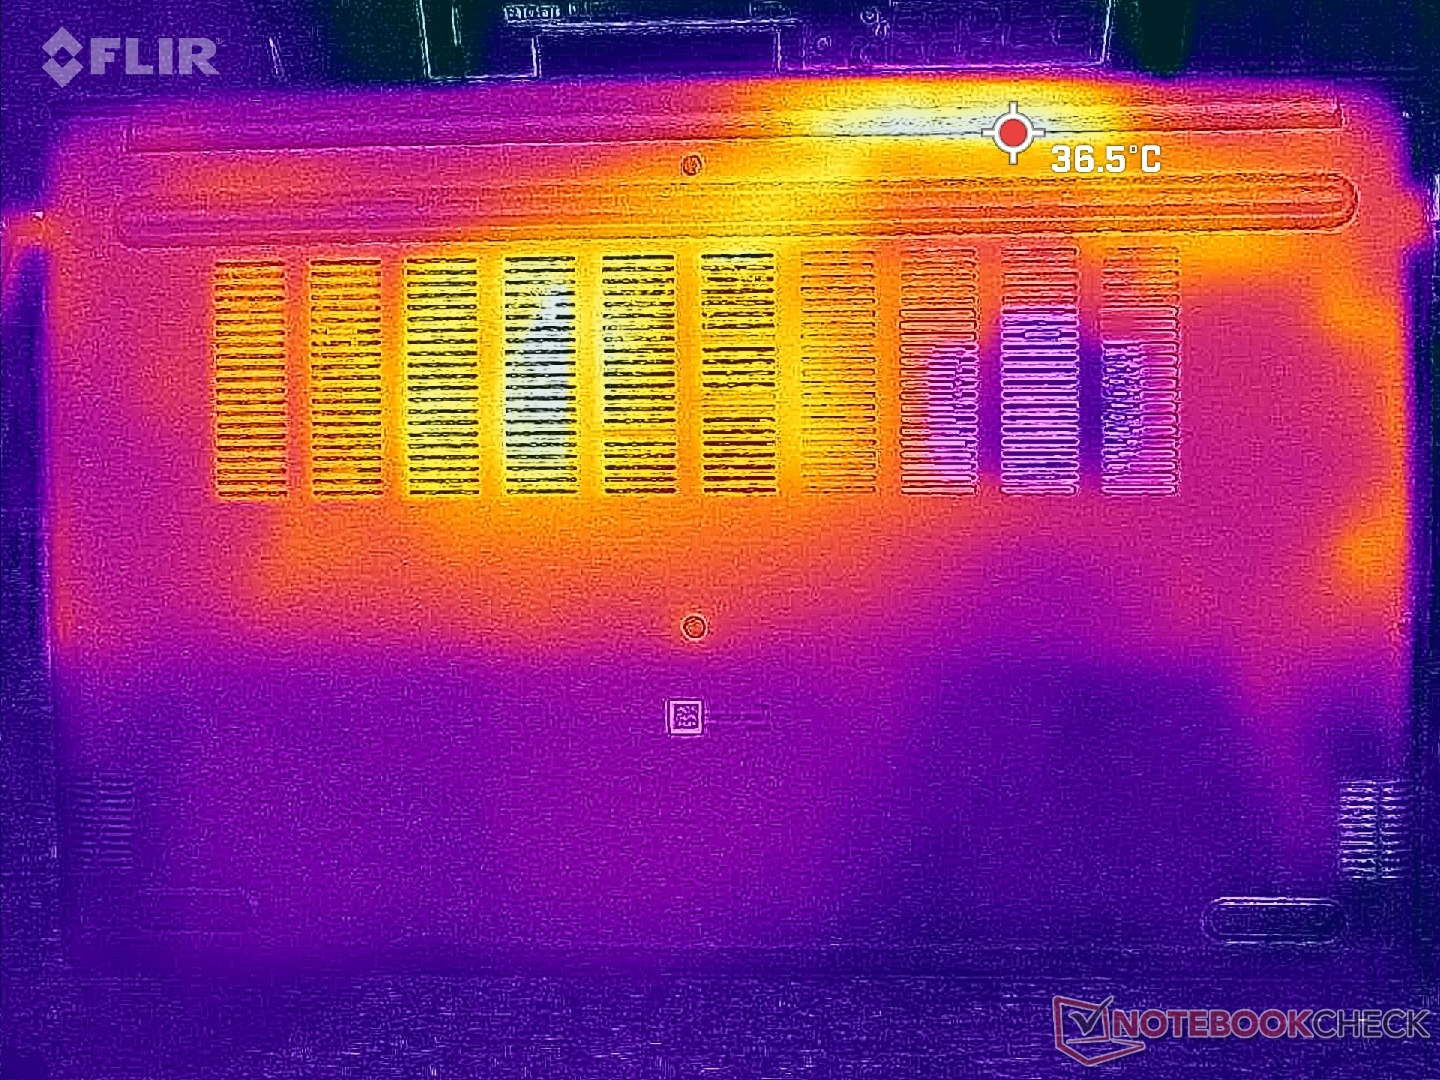
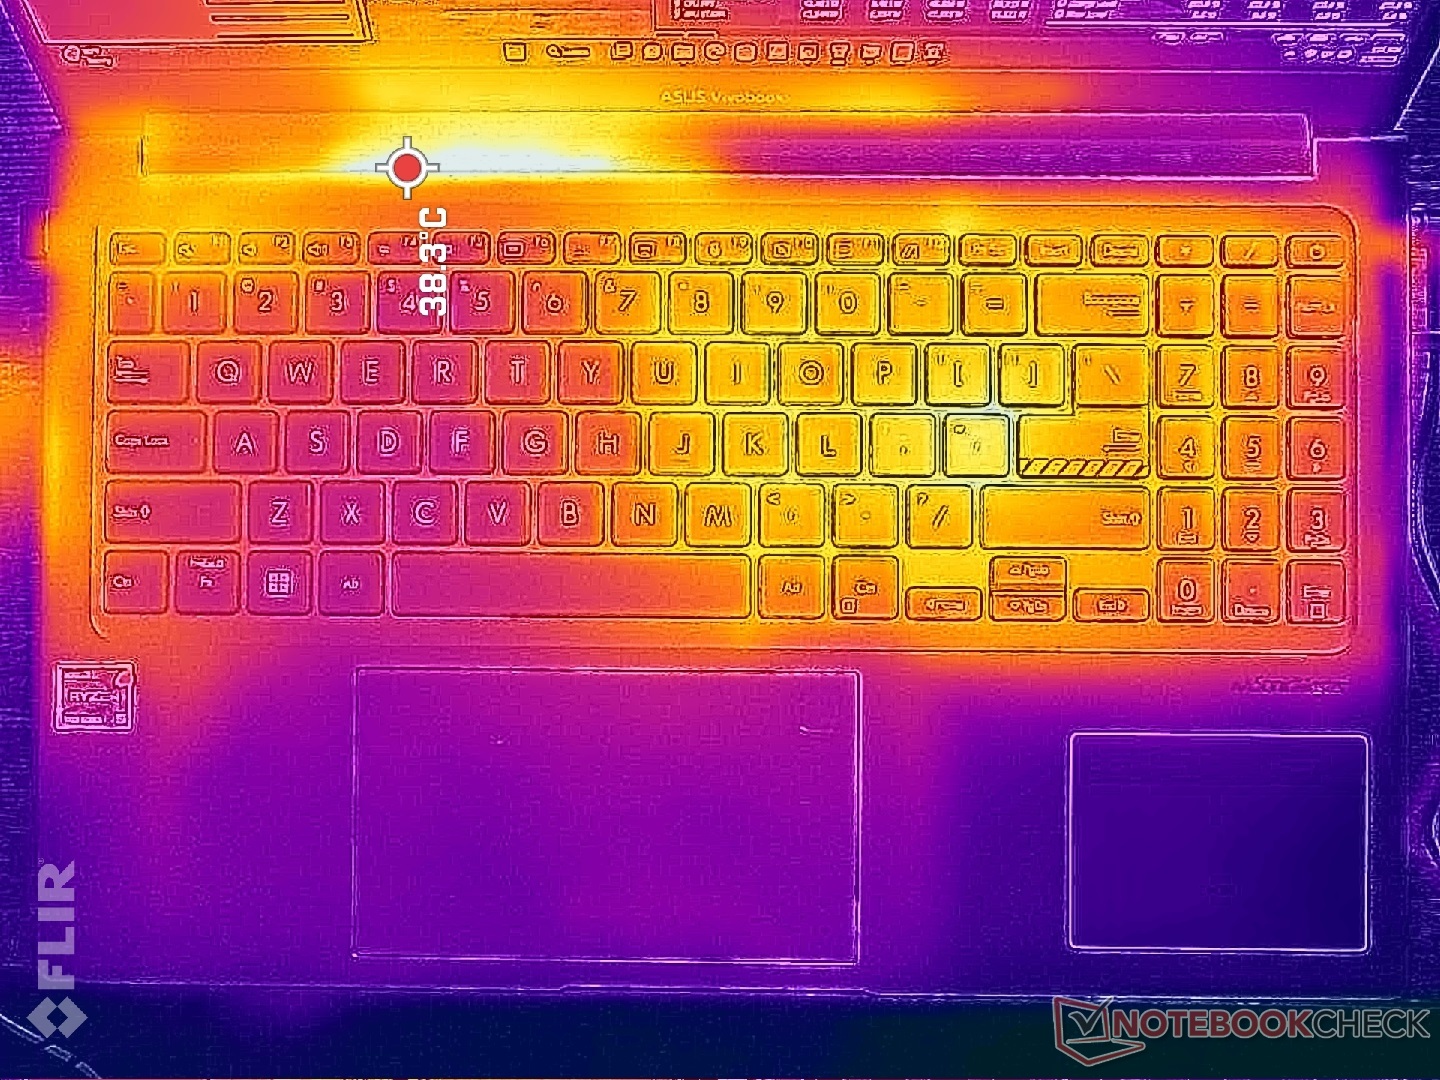
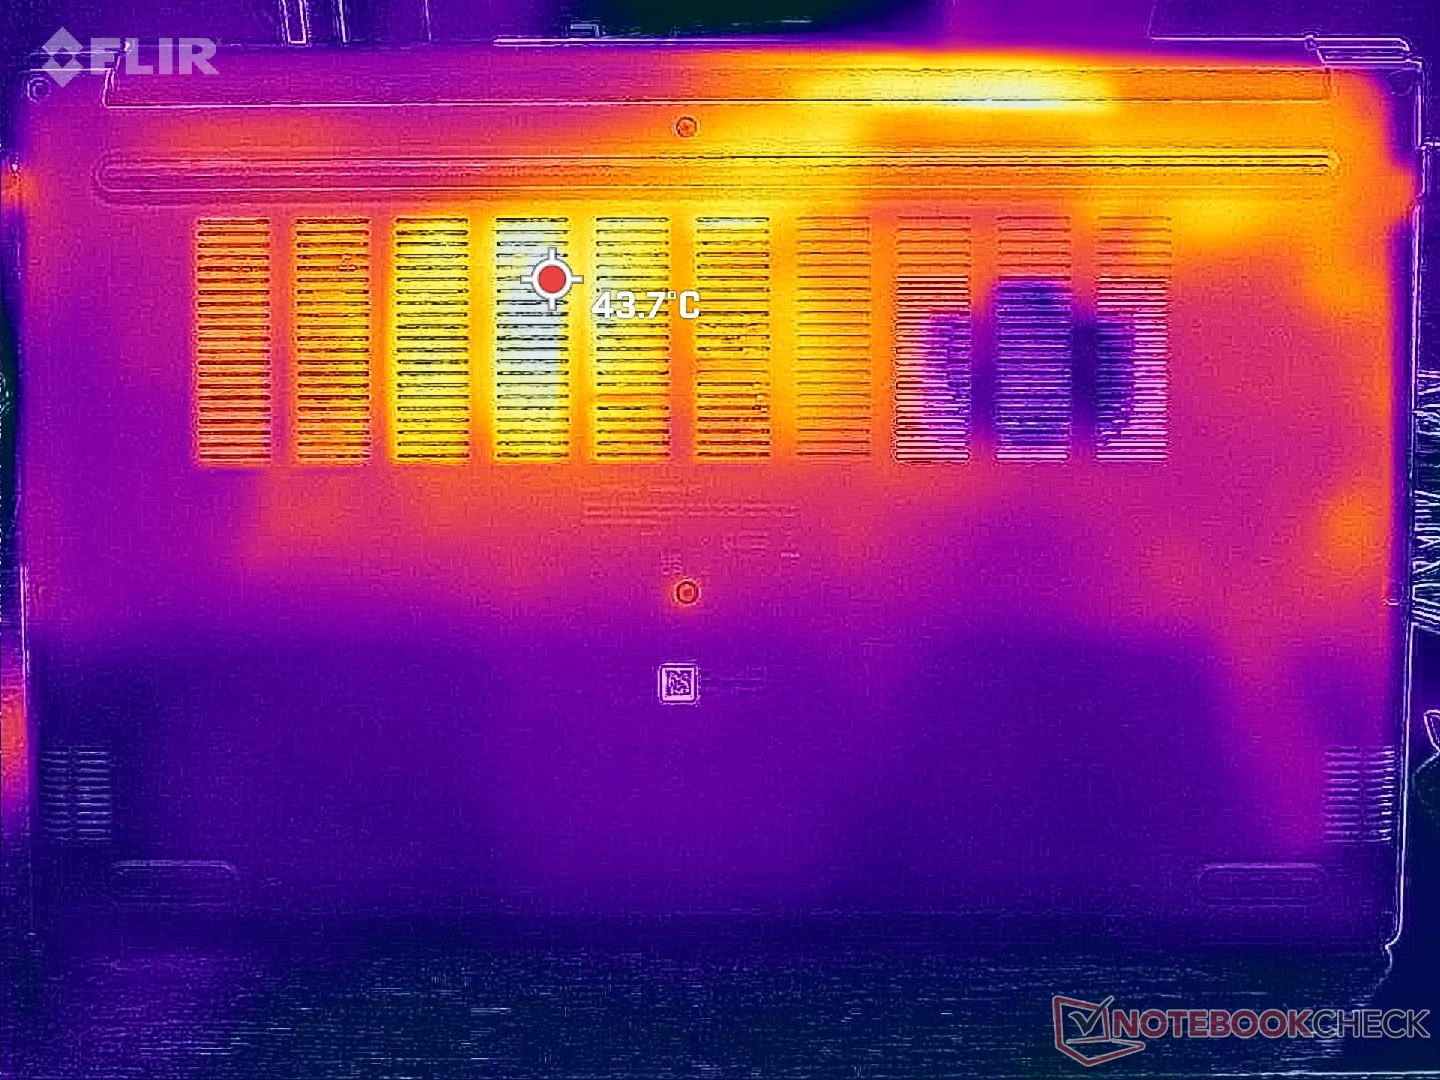
Temperature
Surface temperatures are always warmer on the right half of the chassis due to the positioning of the cooling solution inside. The difference between the coolest and warmest sides of the keyboard can be as high as 10 C. Surfaces never become uncomfortably warm no matter the onscreen load.
The competing Dell Inspiron 15 3501 can be even warmer at up to 50 C on the top and bottom sides whereas our Asus would top out at around 35 C.
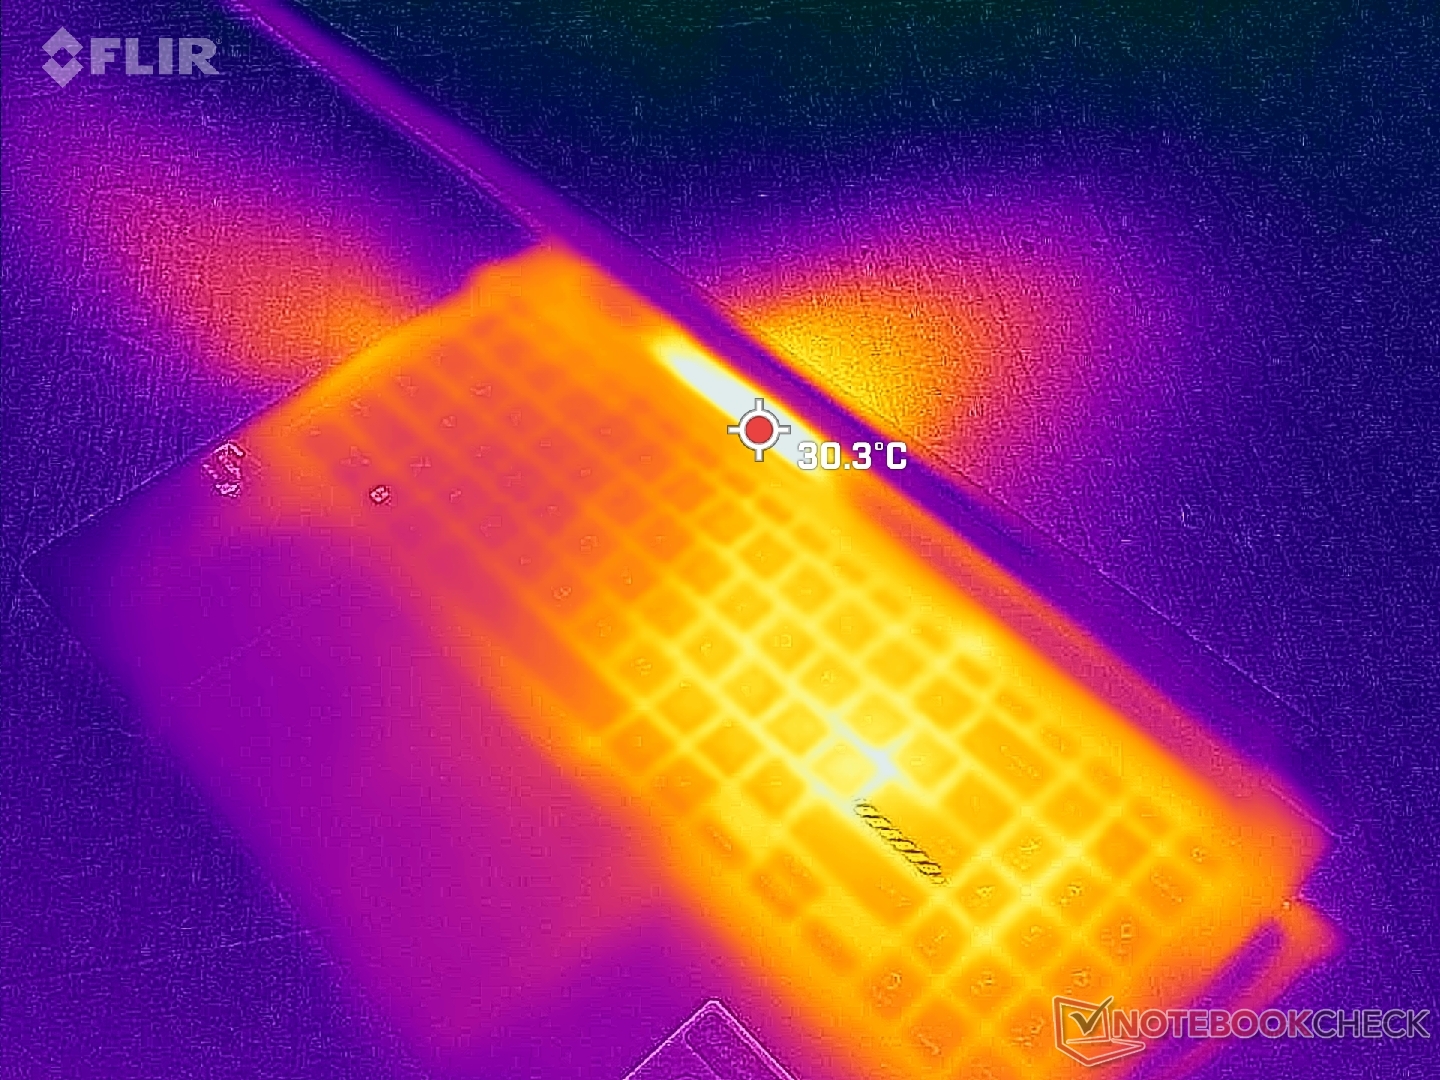
(+) The maximum temperature on the upper side is 33.4 °C / 92 F, compared to the average of 36.9 °C / 98 F, ranging from 21.1 to 71 °C for the class Multimedia.
(+) The bottom heats up to a maximum of 35.6 °C / 96 F, compared to the average of 39.2 °C / 103 F
(+) In idle usage, the average temperature for the upper side is 22.4 °C / 72 F, compared to the device average of 31.3 °C / 88 F.
(+) Playing The Witcher 3, the average temperature for the upper side is 24.6 °C / 76 F, compared to the device average of 31.3 °C / 88 F.
(+) The palmrests and touchpad are cooler than skin temperature with a maximum of 20.8 °C / 69.4 F and are therefore cool to the touch.
(+) The average temperature of the palmrest area of similar devices was 28.7 °C / 83.7 F (+7.9 °C / 14.3 F).

| Asus VivoBook 15 X M1503QA AMD Ryzen 5 5600H, AMD Radeon RX Vega 7 | Asus Vivobook 15 K513EQ Intel Core i7-1165G7, NVIDIA GeForce MX350 | Asus VivoBook S15 D533UA AMD Ryzen 7 5700U, AMD Radeon RX Vega 8 (Ryzen 4000/5000) | Asus ZenBook UX535-M01440 Intel Core i7-10750H, NVIDIA GeForce GTX 1650 Ti Max-Q | Lenovo ThinkBook 15 G3 ACL 21A400B2GE AMD Ryzen 5 5500U, AMD Radeon RX Vega 7 | Dell Inspiron 15 3501 Intel Core i7-1165G7, Intel Iris Xe Graphics G7 96EUs | |
|---|---|---|---|---|---|---|
| Heat | -30% | -22% | -15% | -25% | -20% | |
| Maximum Upper Side * (°C) | 33.4 | 48.8 -46% | 46.1 -38% | 37.8 -13% | 42.2 -26% | 45.6 -37% |
| Maximum Bottom * (°C) | 35.6 | 42 -18% | 46.6 -31% | 44.2 -24% | 48.8 -37% | 41 -15% |
| Idle Upper Side * (°C) | 24.6 | 30 -22% | 27.4 -11% | 28.1 -14% | 27.8 -13% | 28.2 -15% |
| Idle Bottom * (°C) | 26 | 35 -35% | 28.2 -8% | 27.7 -7% | 32.3 -24% | 29.1 -12% |
* ... smaller is better
Stress Test
CPU clock rates, temperature, and board power draw would boost to and stabilize at 4 GHz, 78 C, and 41 W, respectively, with no significant dips or cycling behavior. In contrast, many Ultrabooks powered by U-series CPUs would spike to high clock rates for only a short few seconds before throttling performance in order to keep temperatures in check.
GPU clock rates and temperature would stabilize at 1800 MHz and a relatively cool 55 C compared to 78 C on the smaller 14-inch VivoBook S 14X. However, the latter model offers faster graphics performance than our unit in review.
Running on battery power impacts performance. A 3DMark 11 test on batteries would return Physics and Graphics scores 8132 and 3391 points, respectively, compared to 8662 and 3505 points when on mains.
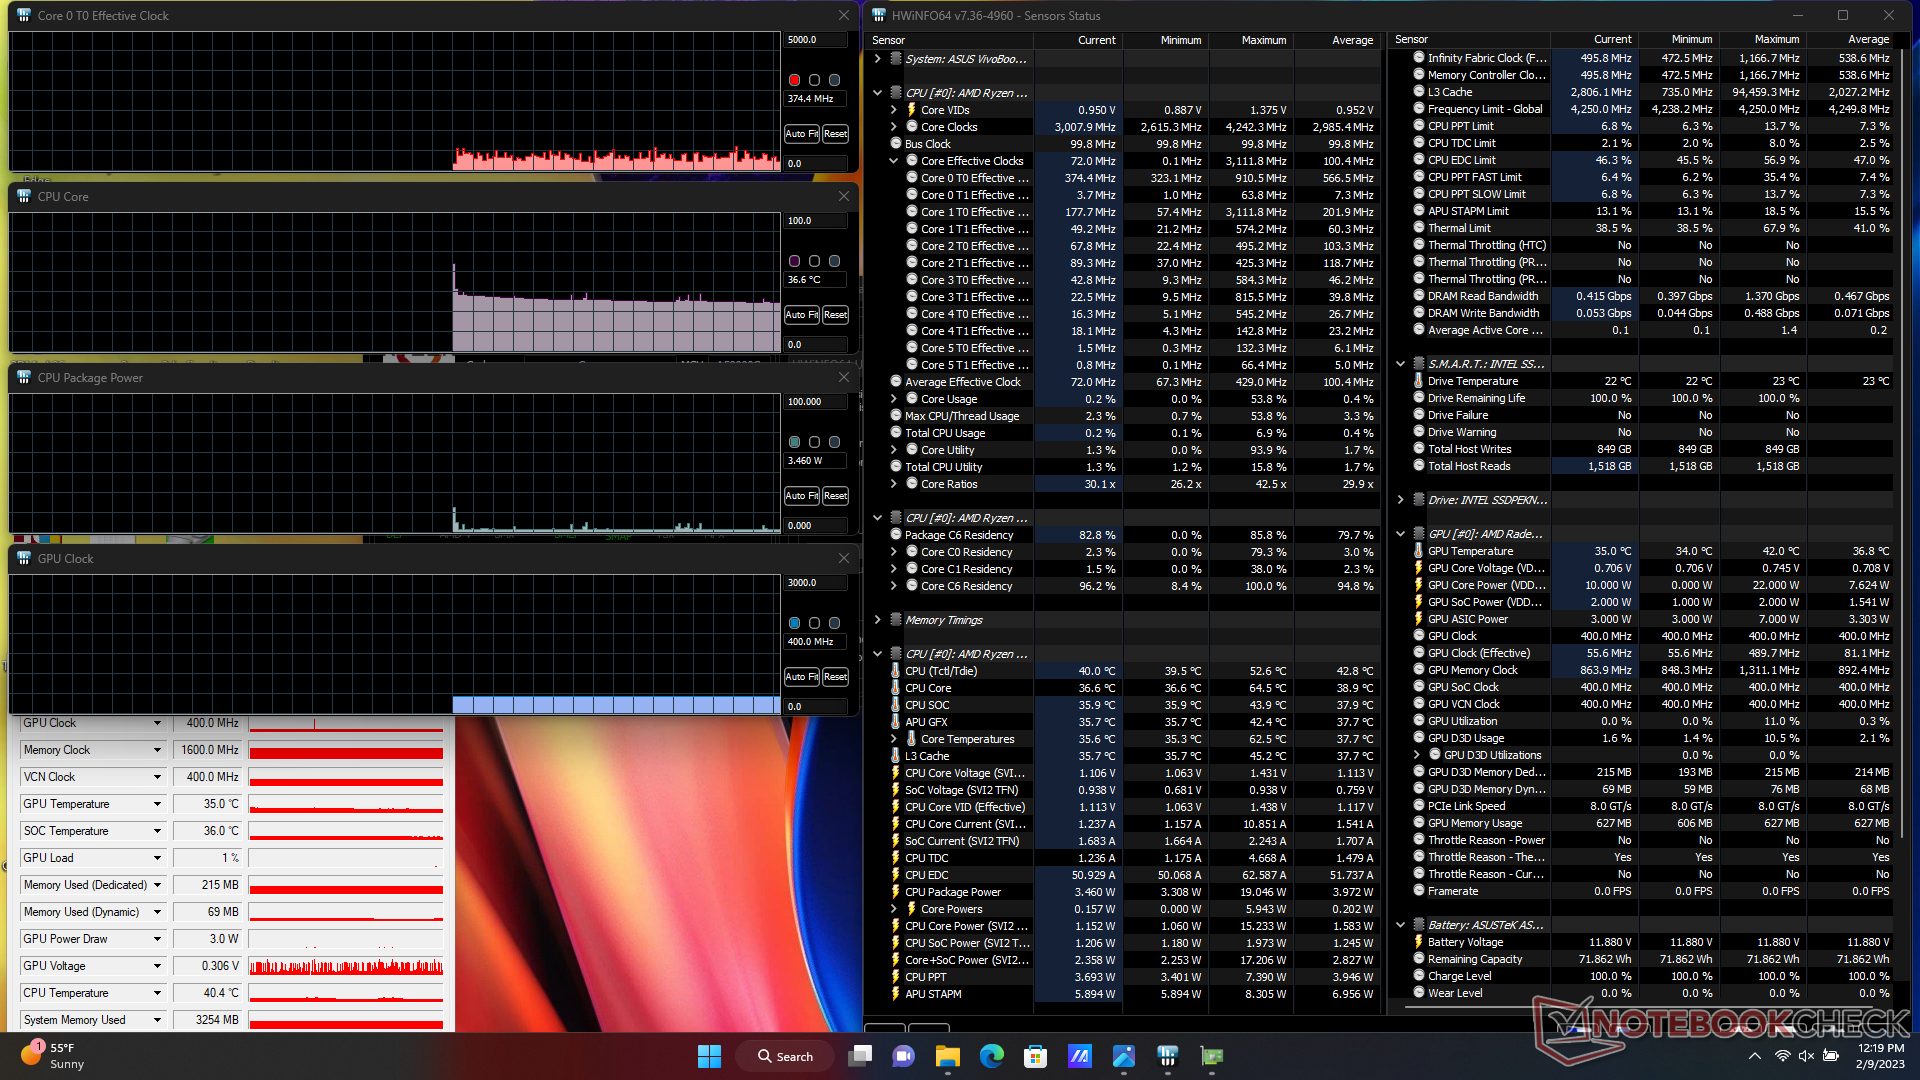
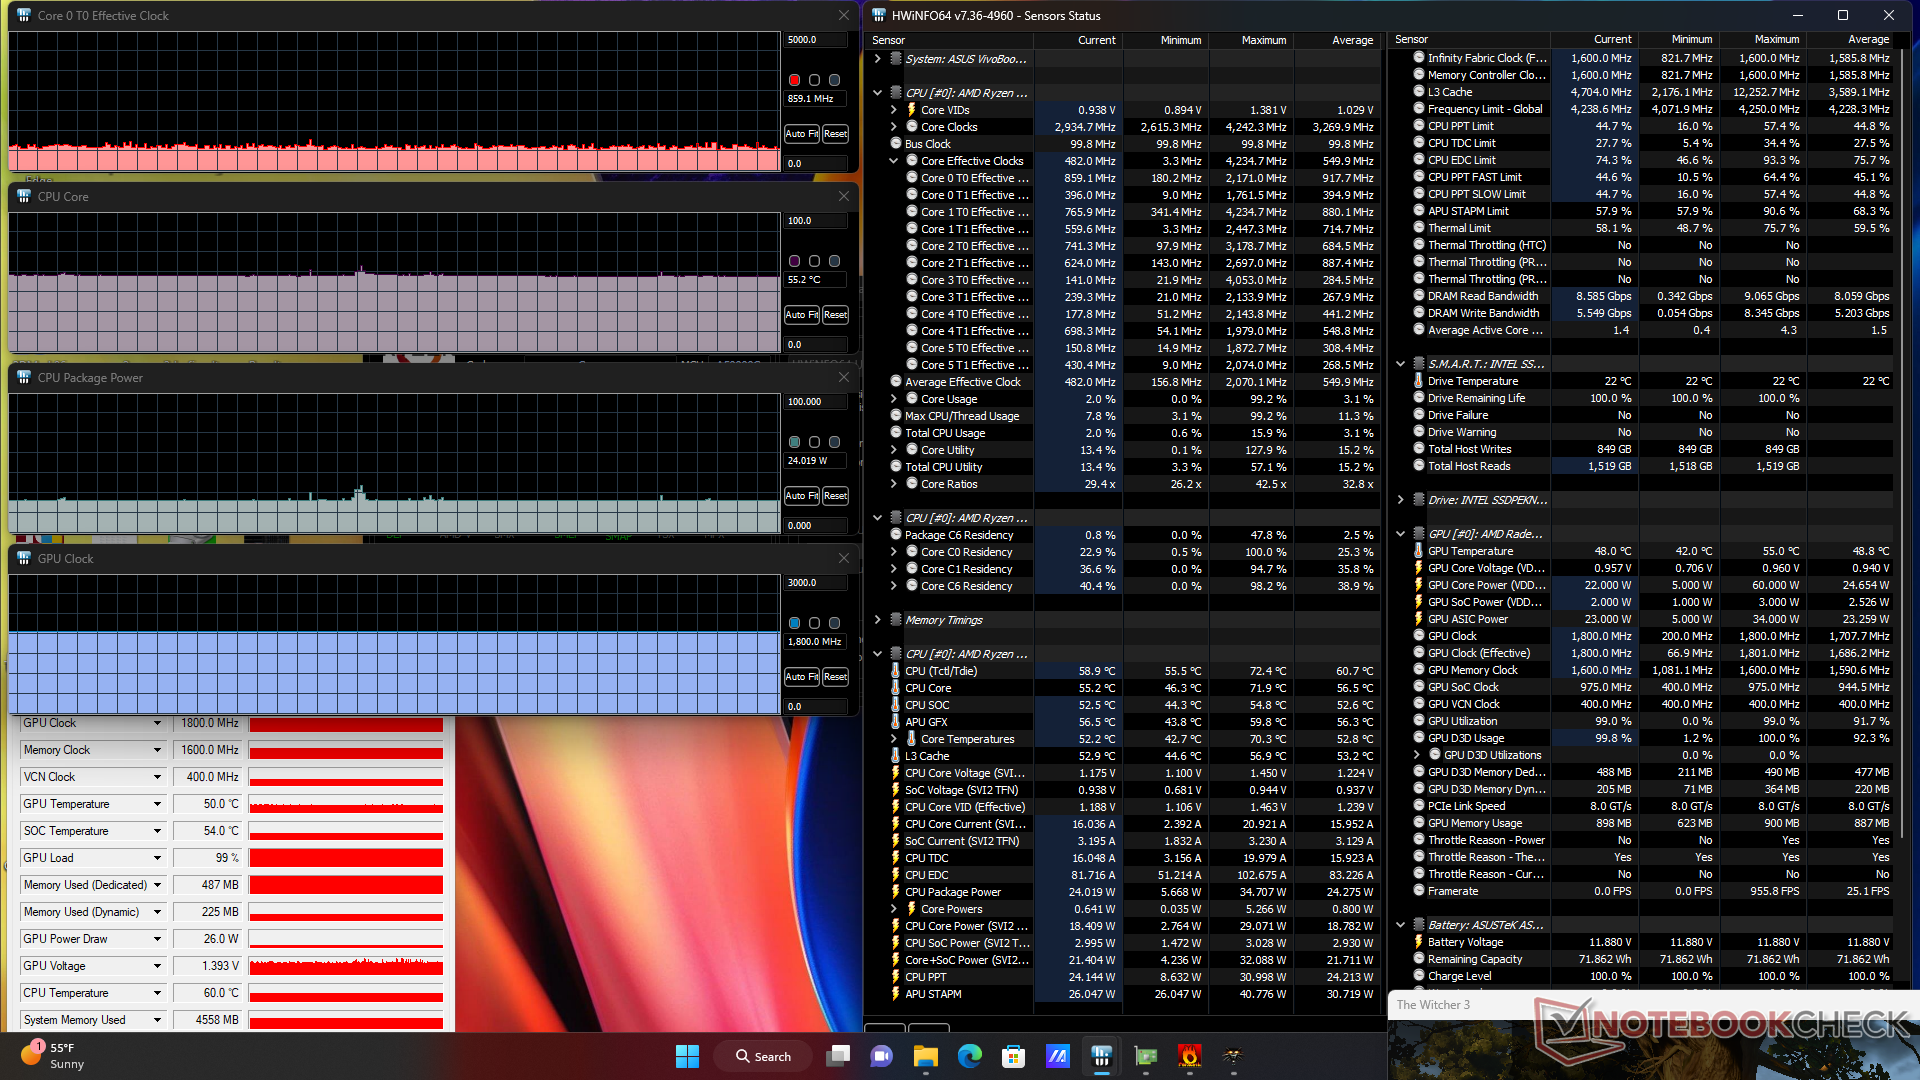
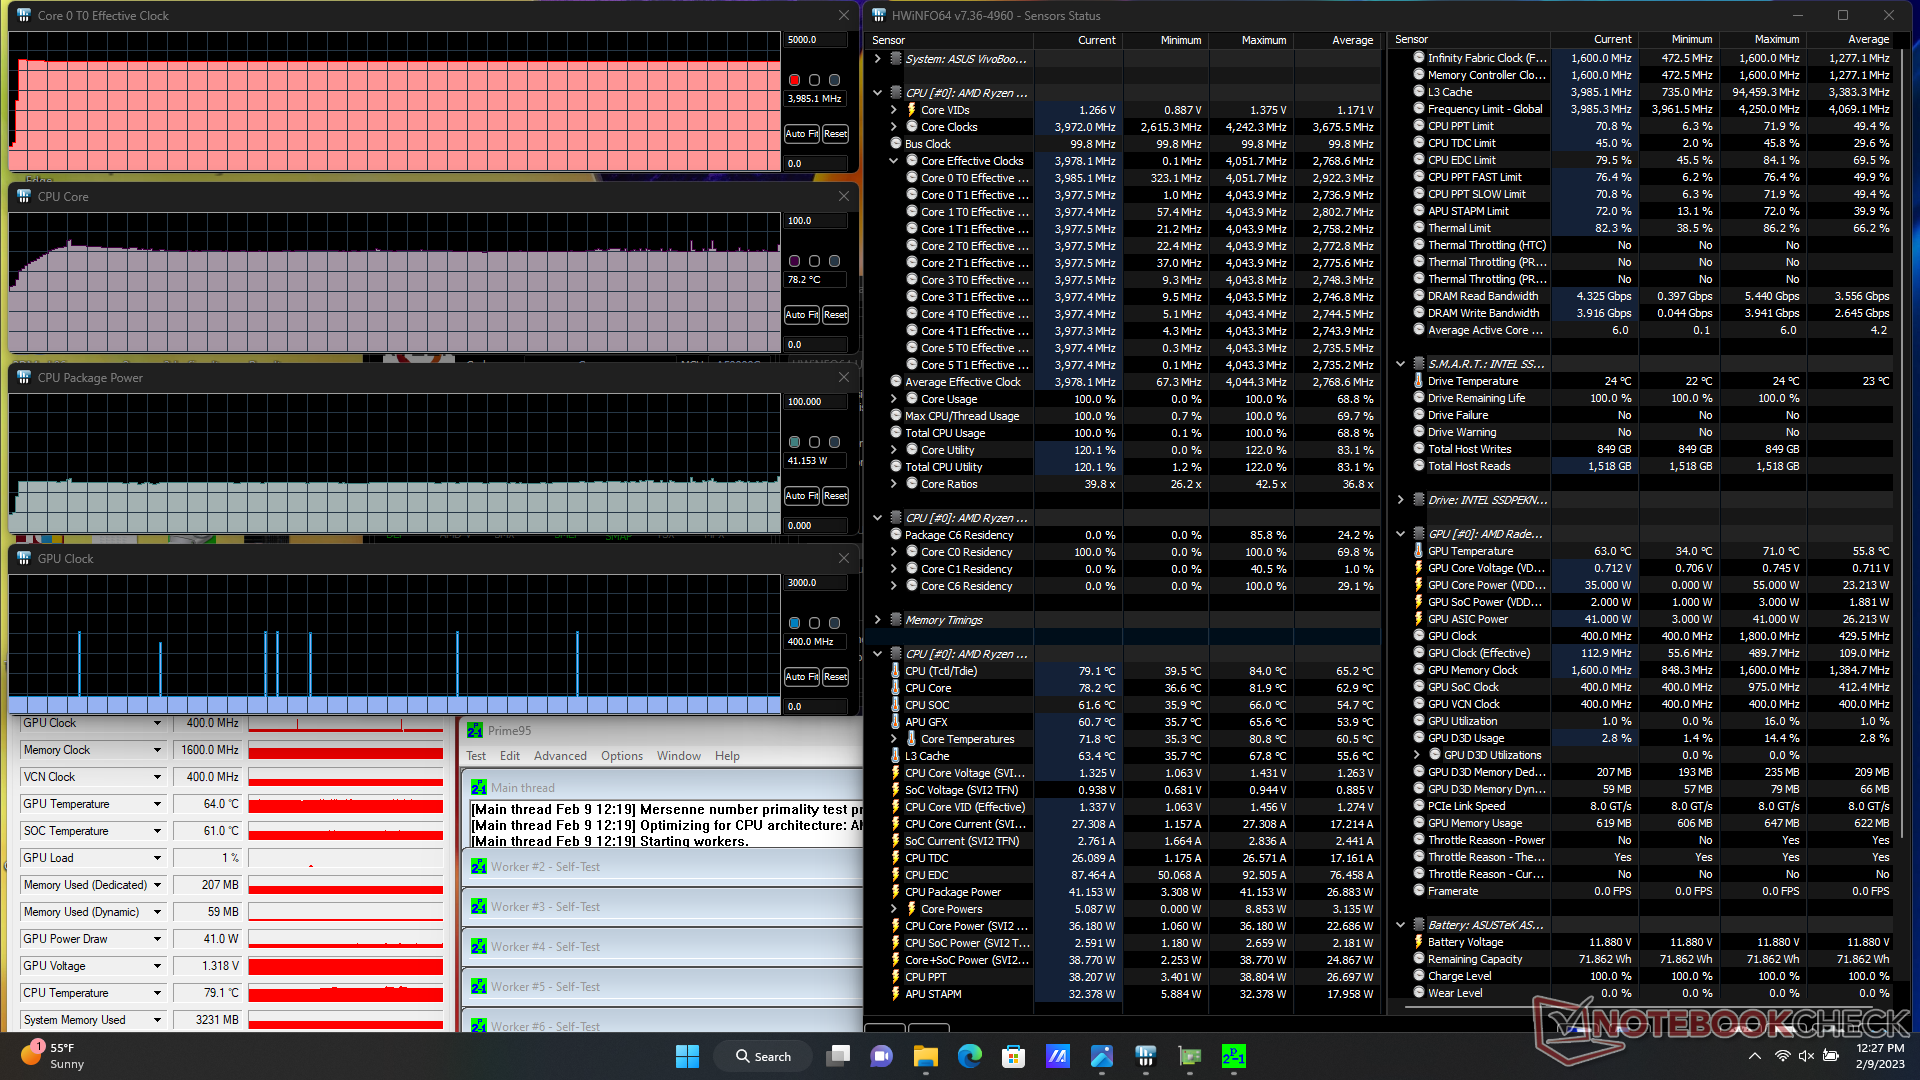
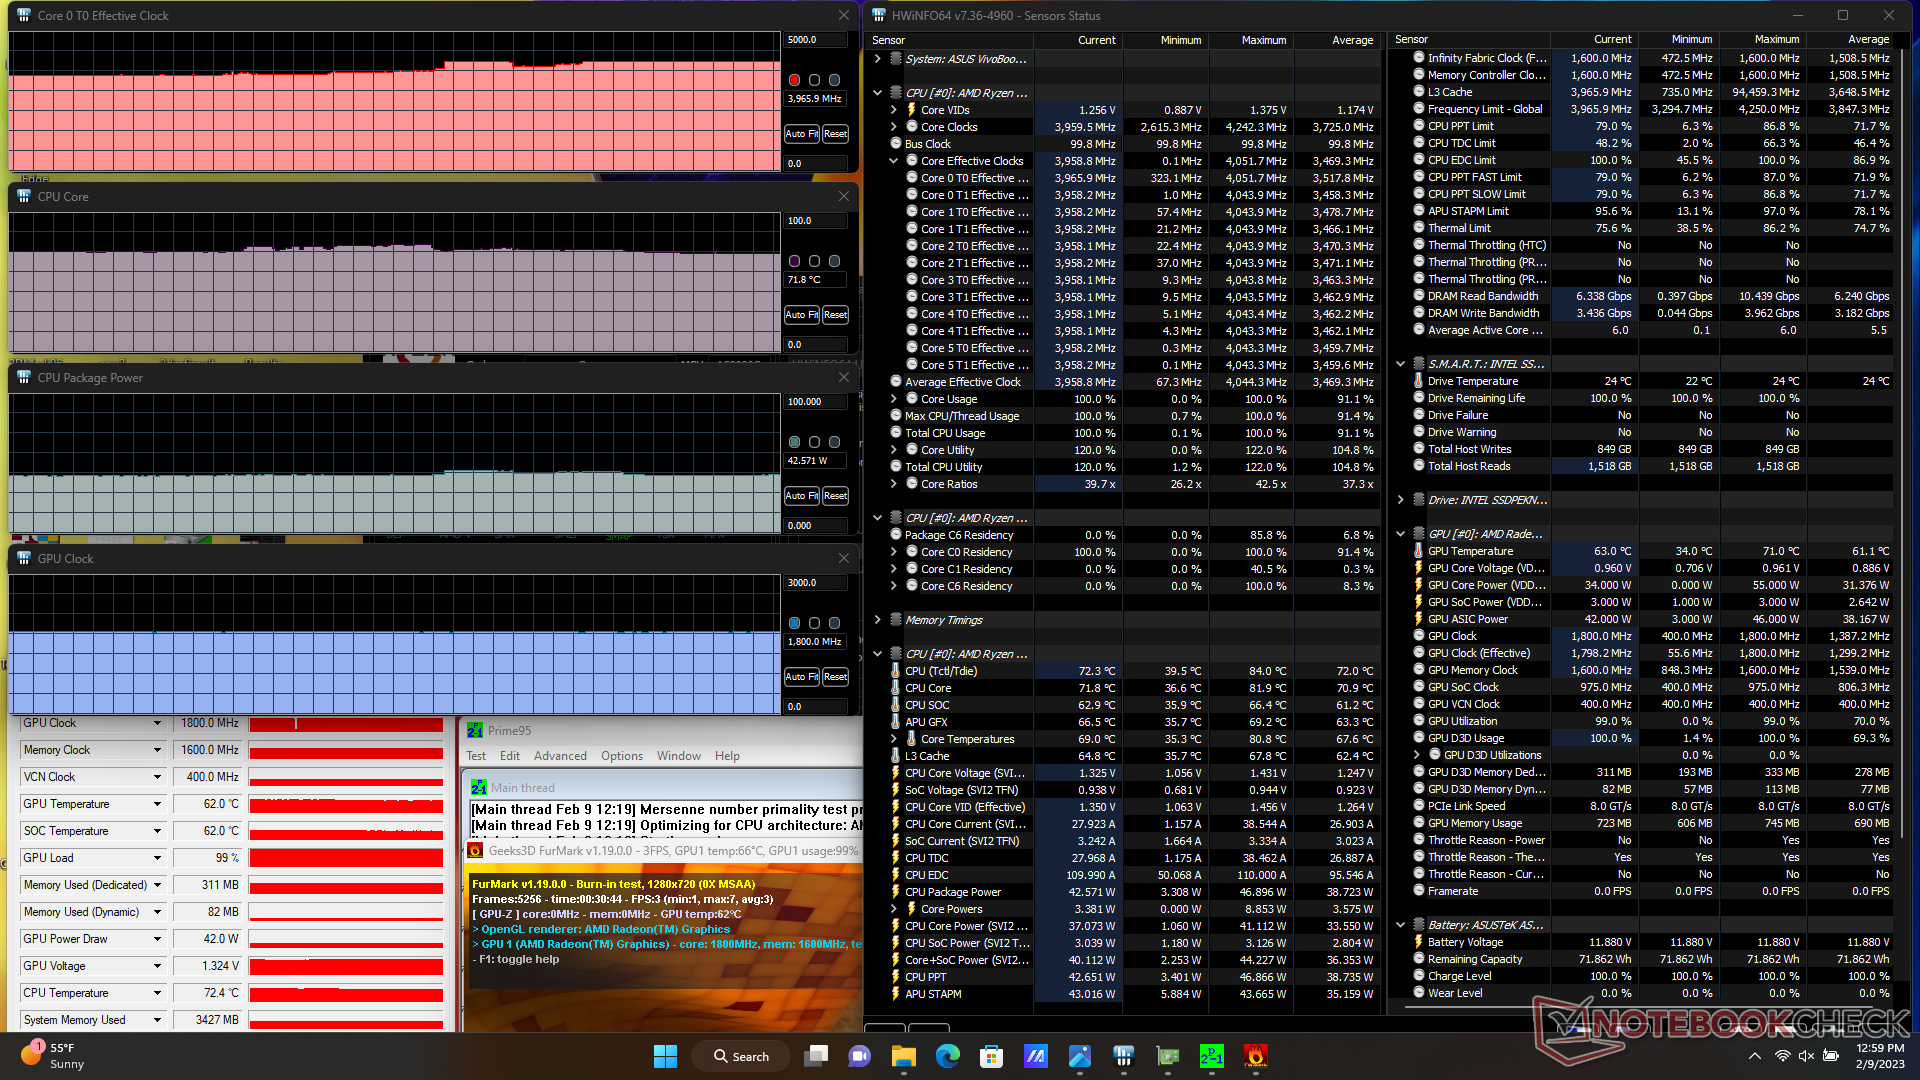
| CPU Clock (GHz) | GPU Clock (MHz) | Average CPU Temperature (°C) | |
| System Idle | -- | -- | 37 |
| Prime95 Stress | 4.0 | -- | 78 |
| Prime95 + FurMark Stress | ~4.0 | 1800 | 72 |
| Witcher 3 Stress | ~0.9 | 1800 | 55 |
Speakers
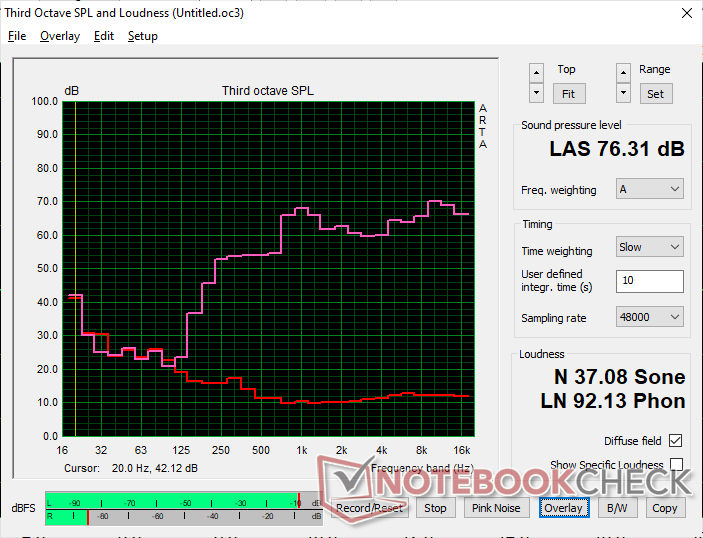
Asus VivoBook 15 X M1503QA audio analysis
(±) | speaker loudness is average but good (76.3 dB)
Bass 100 - 315 Hz
(-) | nearly no bass - on average 21.9% lower than median
(±) | linearity of bass is average (12.8% delta to prev. frequency)
Mids 400 - 2000 Hz
(±) | higher mids - on average 5% higher than median
(+) | mids are linear (5.6% delta to prev. frequency)
Highs 2 - 16 kHz
(+) | balanced highs - only 3.2% away from median
(+) | highs are linear (4.1% delta to prev. frequency)
Overall 100 - 16.000 Hz
(±) | linearity of overall sound is average (20.3% difference to median)
Compared to same class
» 66% of all tested devices in this class were better, 9% similar, 25% worse
» The best had a delta of 5%, average was 17%, worst was 45%
Compared to all devices tested
» 52% of all tested devices were better, 8% similar, 40% worse
» The best had a delta of 4%, average was 24%, worst was 134%
Apple MacBook Pro 16 2021 M1 Pro audio analysis
(+) | speakers can play relatively loud (84.7 dB)
Bass 100 - 315 Hz
(+) | good bass - only 3.8% away from median
(+) | bass is linear (5.2% delta to prev. frequency)
Mids 400 - 2000 Hz
(+) | balanced mids - only 1.3% away from median
(+) | mids are linear (2.1% delta to prev. frequency)
Highs 2 - 16 kHz
(+) | balanced highs - only 1.9% away from median
(+) | highs are linear (2.7% delta to prev. frequency)
Overall 100 - 16.000 Hz
(+) | overall sound is linear (4.6% difference to median)
Compared to same class
» 0% of all tested devices in this class were better, 0% similar, 100% worse
» The best had a delta of 5%, average was 17%, worst was 45%
Compared to all devices tested
» 0% of all tested devices were better, 0% similar, 100% worse
» The best had a delta of 4%, average was 24%, worst was 134%
Energy Management
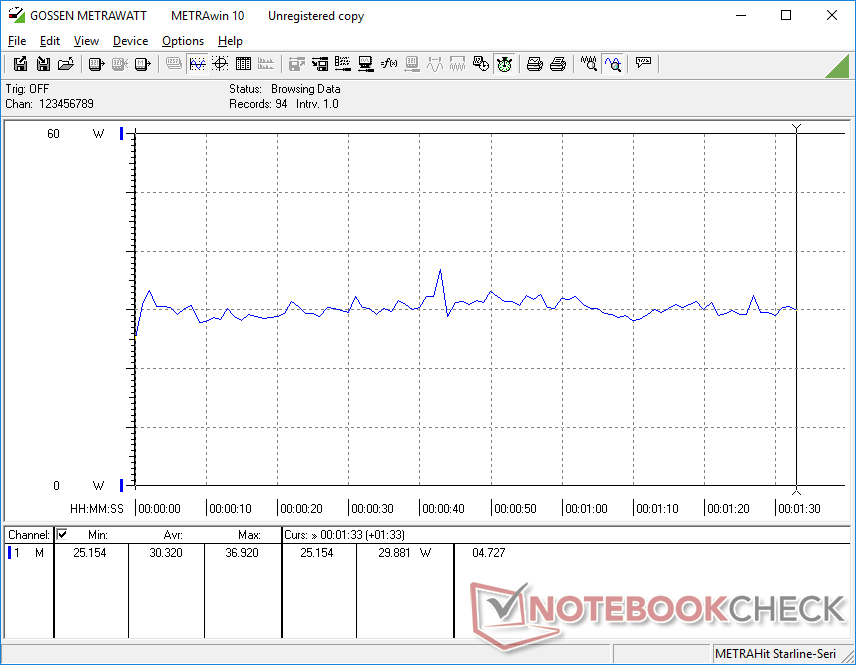
Power Consumption
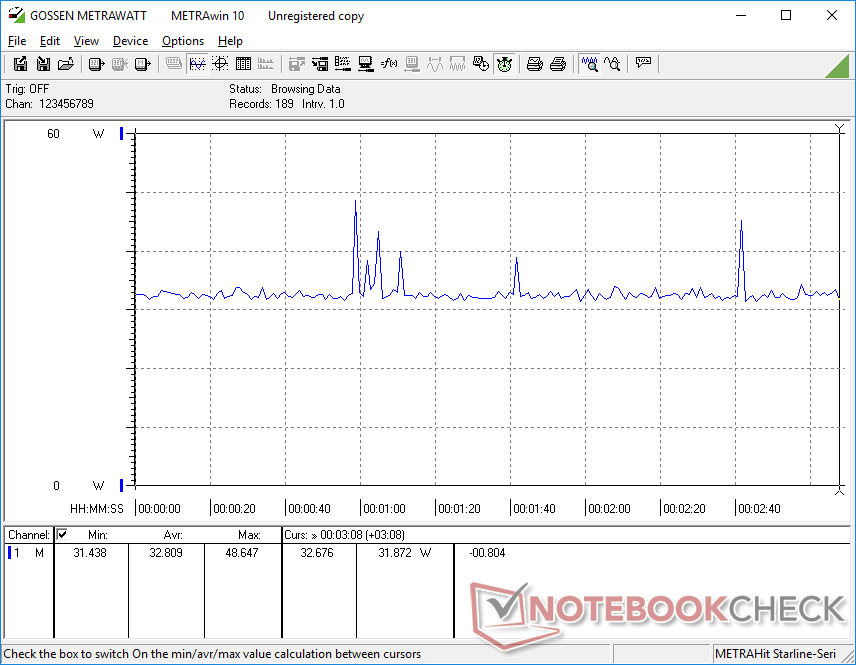
Idling on desktop demands between 5 W and 14 W depending on the brightness setting and power profile which is a few watts more than most IPS-based alternatives like the Dell Inspiron 15 3501 or Lenovo ThinkBook 15 G3. Since OLED consumes more power when displaying white, it's recommended to use darker wallpapers or backgrounds to prolong battery life.
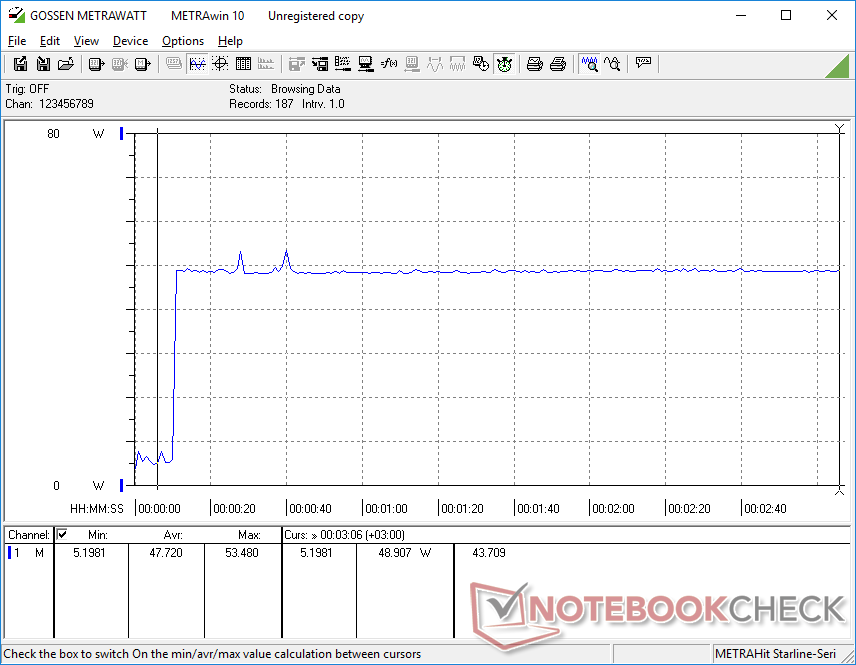
Running higher loads like 3DMark or Witcher 3 would consume around 33 W on average compared to 40 W or higher on the VivoBook S15 D533UA or Lenovo ThinkBook 15 G3. Graphics performance is weaker on our review unit, however, due to its single-channel memory as mentioned earlier. Upgrading our unit to dual-channel would increase both performance and power consumption accordingly.
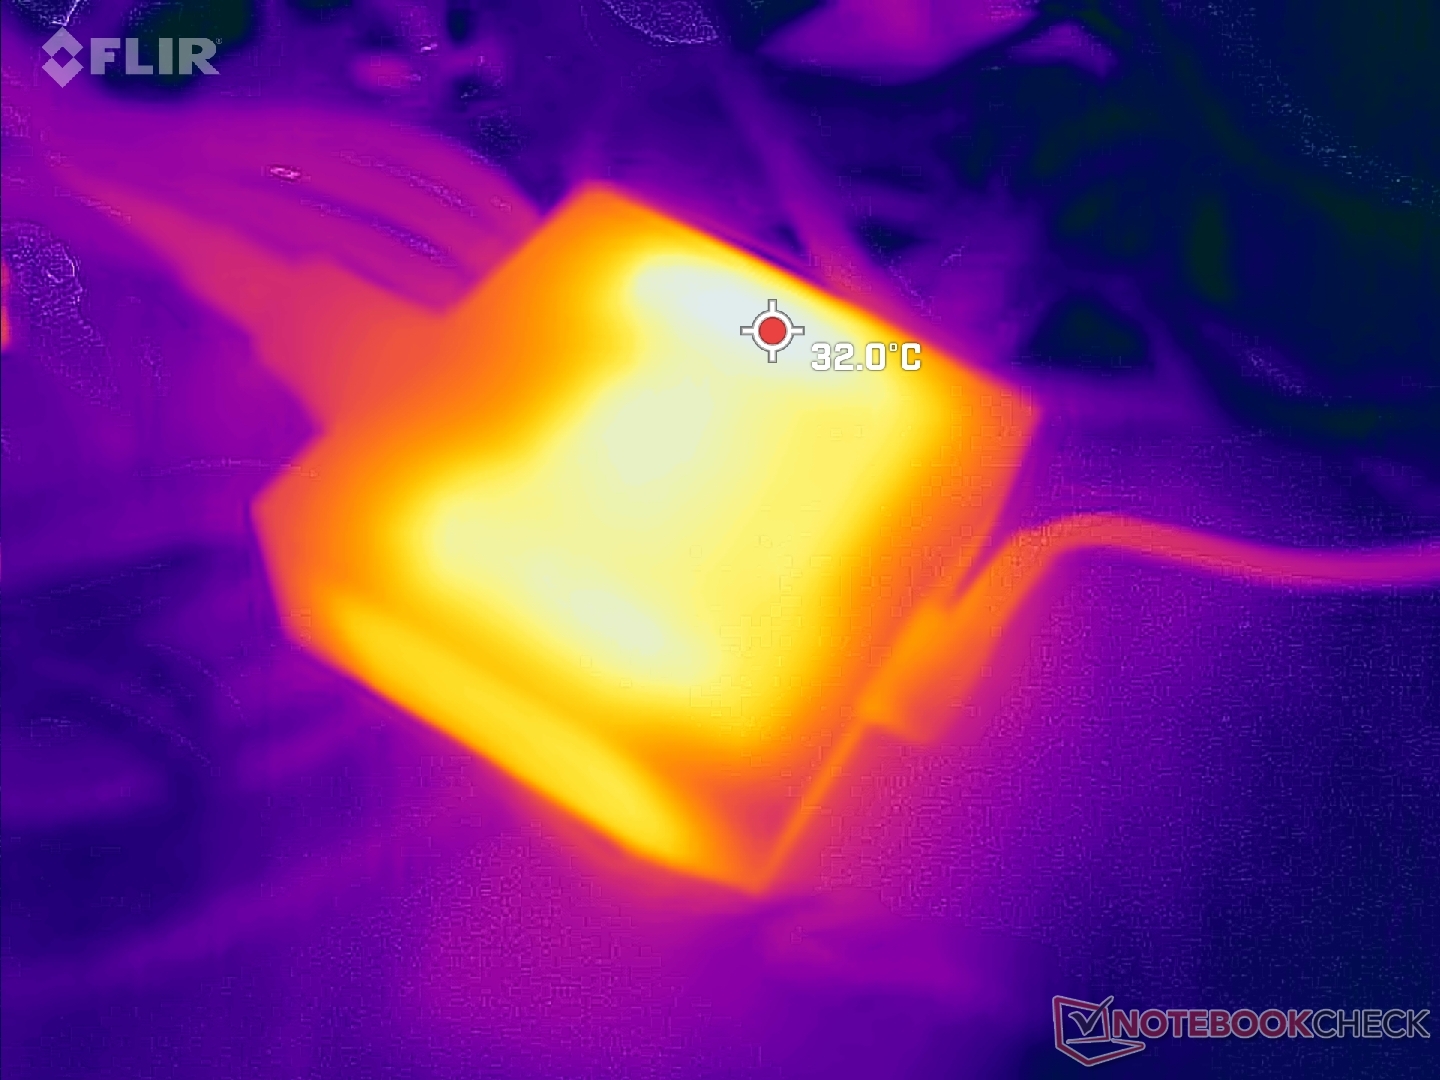
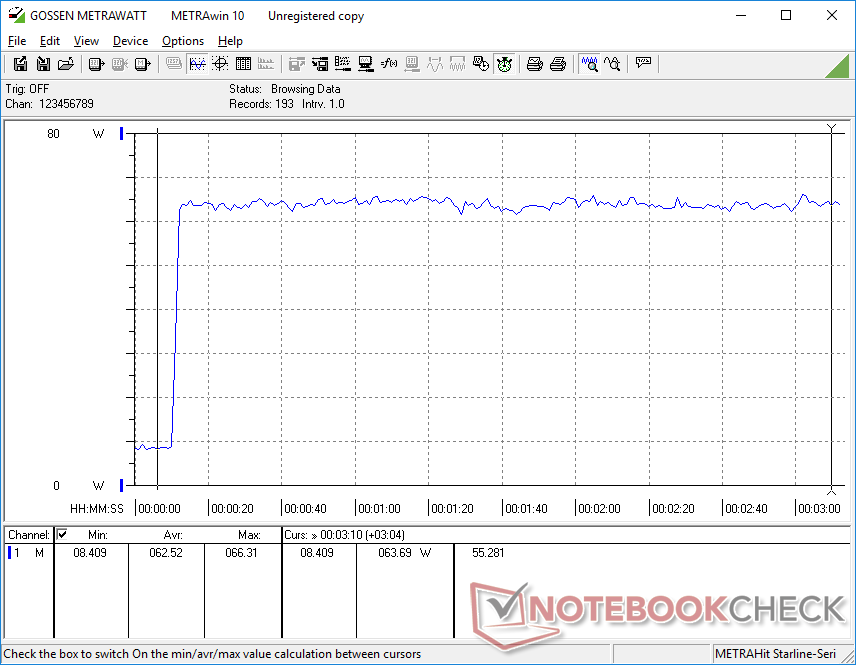
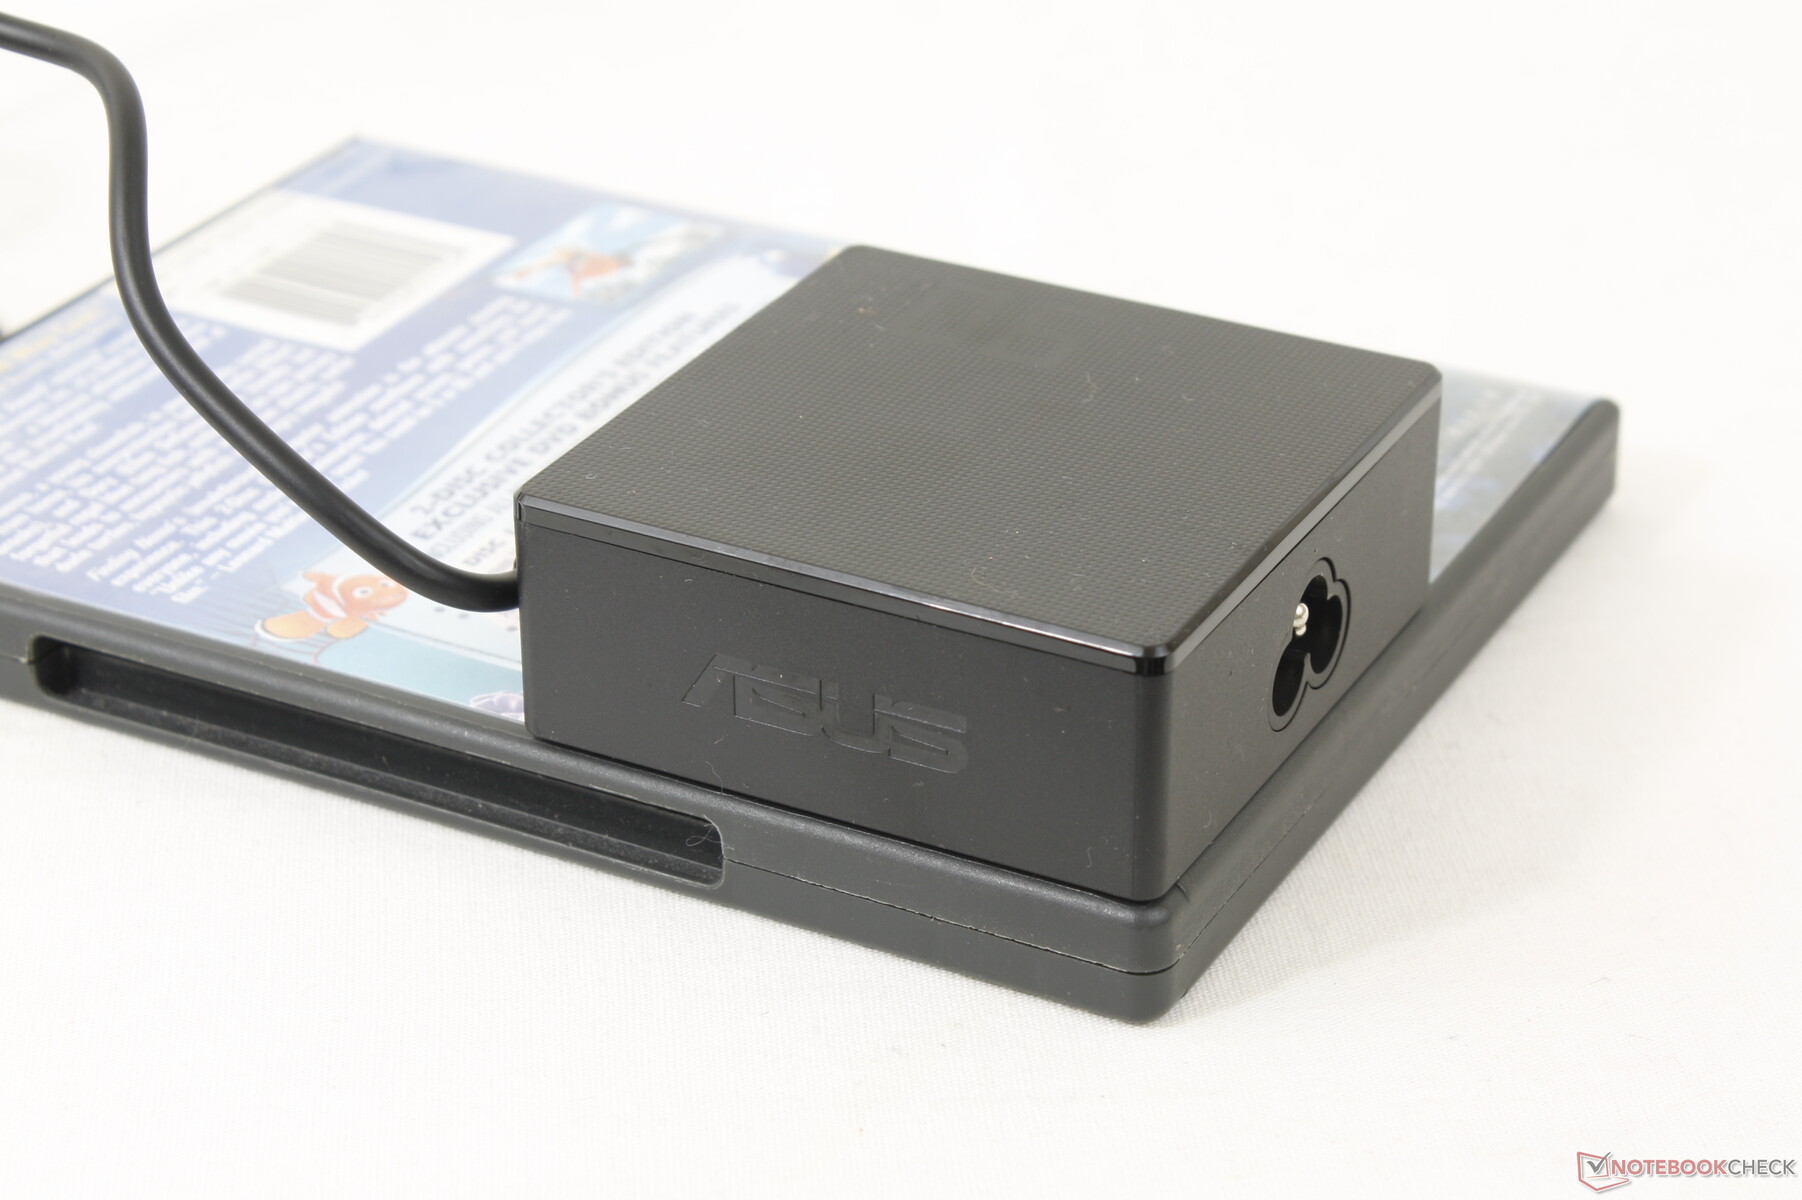
We're able to record a maximum draw of 63 W from the small (7.5 x 7.5 x 2.9 cm) 90 W AC adapter when running both Prime95 and FurMark simultaneously. The adapter has more than enough headroom to both power the system and recharge the battery at a reasonable speed.
| Off / Standby | |
| Idle | |
| Load |
|
Key:
min: | |
| Asus VivoBook 15 X M1503QA R5 5600H, Vega 7, Intel SSD 670p SSDPEKNU512GZ, OLED, 1920x1080, 15.6" | Asus Vivobook 15 K513EQ i7-1165G7, GeForce MX350, Intel SSD 660p SSDPEKNW512G8, OLED, 1920x1080, 15.6" | Asus VivoBook S15 D533UA R7 5700U, Vega 8, WDC PC SN530 SDBPNPZ-1T00, IPS, 1920x1080, 15.6" | Asus ZenBook UX535-M01440 i7-10750H, GeForce GTX 1650 Ti Max-Q, WDC PC SN730 SDBPNTY-1T00, IPS, 3840x2160, 15.6" | Lenovo ThinkBook 15 G3 ACL 21A400B2GE R5 5500U, Vega 7, Samsung PM991A MZALQ256HBJD, IPS, 1920x1080, 15.6" | Dell Inspiron 15 3501 i7-1165G7, Iris Xe G7 96EUs, Samsung PM991a MZ9LQ512HBLU-00BD1, IPS, 1920x1080, 15.6" | |
|---|---|---|---|---|---|---|
| Power Consumption | -14% | -9% | -65% | -4% | 13% | |
| Idle Minimum * (Watt) | 5.4 | 3.7 31% | 5 7% | 4.4 19% | 4.2 22% | 3.6 33% |
| Idle Average * (Watt) | 7.4 | 6.3 15% | 7.7 -4% | 9.8 -32% | 8.3 -12% | 6.4 14% |
| Idle Maximum * (Watt) | 13.8 | 9.7 30% | 12.2 12% | 14.5 -5% | 10.4 25% | 7.9 43% |
| Load Average * (Watt) | 30.3 | 59 -95% | 41 -35% | 83 -174% | 49 -62% | 39 -29% |
| Witcher 3 ultra * (Watt) | 32.8 | 51.4 -57% | 43 -31% | 67 -104% | 39.7 -21% | 37.6 -15% |
| Load Maximum * (Watt) | 63 | 67.7 -7% | 65 -3% | 123 -95% | 49.3 22% | 41.8 34% |
* ... smaller is better
Power Consumption Witcher 3 / Stresstest
Power Consumption external Monitor
Battery Life — Long Living Machine
Battery capacity is large at 70 Wh relative to other Vivobook models where ~40 Wh is typical. The increase is more than enough to offset the higher power demands of the OLED panel and H-series CPU. We're able to record a real-world browsing runtime of over 11 hours compared to 9 hours on the VivoBook S15.
Charging from empty to full capacity is relatively fast at around 90 minutes. Unfortunately, the system cannot be charged via USB-C.
| Asus VivoBook 15 X M1503QA R5 5600H, Vega 7, 70 Wh | Asus Vivobook 15 K513EQ i7-1165G7, GeForce MX350, 42 Wh | Asus VivoBook S15 D533UA R7 5700U, Vega 8, 50 Wh | Asus ZenBook UX535-M01440 i7-10750H, GeForce GTX 1650 Ti Max-Q, 96 Wh | Lenovo ThinkBook 15 G3 ACL 21A400B2GE R5 5500U, Vega 7, 45 Wh | Dell Inspiron 15 3501 i7-1165G7, Iris Xe G7 96EUs, 42 Wh | |
|---|---|---|---|---|---|---|
| Battery runtime | -35% | -20% | -1% | -28% | -39% | |
| Reader / Idle (h) | 18.9 | 13.3 -30% | 18.3 -3% | |||
| WiFi v1.3 (h) | 11.2 | 6 -46% | 9 -20% | 10.1 -10% | 8.1 -28% | 6.8 -39% |
| Load (h) | 1.8 | 1.3 -28% | 2 11% | |||
| H.264 (h) | 11.9 |
Pros
Cons
Verdict — Great Display And Processor For The Price
The VivoBook 15X OLED excels in offering long battery life, fast processor performance, and a Pantone calibrated OLED display all for a reasonable price point. Most other Ultrabooks in the same price range typically offer slower U-series processors and/or an IPS display with inferior colors. The VivoBook 15X OLED is therefore better suited for the occasional on-the-go graphics editing than one might expect from a budget 15.6-inch laptop.
A notable setback to the model is its limited 8 GB of soldered single-channel RAM which significantly impacts graphics performance. Fortunately, the bottom panel comes off relatively easy for users to add additional RAM which we highly recommend. Upgrading to 16 GB of dual-channel RAM essentially unlocks the performance of the GPU while boosting the multi-tasking capabilities of the laptop as a whole.
Another limitation to keep in mind is the lack of DisplayPort or HDMI 2.0 support. 4K monitors at 60 Hz are not compatible at all. Users may want to look at the VivoBook Pro 16X series or any other Intel-powered alternative which should offer better docking capabilities than our AMD unit. But if you're constantly moving from point A to point B while editing photos in between, then the affordable VivoBook 15X OLED fills that niche quite nicely.
The VivoBook 15X OLED punches above its weight and price category when it comes to battery life, processor performance, and display colors.
Price and Availability
Asus VivoBook 15 X M1503QA
- 02/13/2023 v7 (old)
Allen Ngo
More articles related to this device
Asus VivoBook 15 X M1503QA (VivoBook 15 X Series)Related Articles


Transparency
The selection of devices to be reviewed is made by our editorial team. The test sample was provided to the author as a loan by the manufacturer or retailer for the purpose of this review. The lender had no influence on this review, nor did the manufacturer receive a copy of this review before publication. There was no obligation to publish this review. As an independent media company, Notebookcheck is not subjected to the authority of manufacturers, retailers or publishers.
This is how Notebookcheck is testing
Every year, Notebookcheck independently reviews hundreds of laptops and smartphones using standardized procedures to ensure that all results are comparable. We have continuously developed our test methods for around 20 years and set industry standards in the process. In our test labs, high-quality measuring equipment is utilized by experienced technicians and editors. These tests involve a multi-stage validation process. Our complex rating system is based on hundreds of well-founded measurements and benchmarks, which maintains objectivity. Further information on our test methods can be found here.
Price comparison
