Notebookcheck Logo

Intel Core i5-14600K vs AMD E1-1200 vs Intel Core i9-14900

Intel Core i5-14600K

► remove from comparison Intel i5-14600K

The Intel Core i5-14600K is a modern desktop processor based on the Raptor Lake architecture, which inherits the 13th generation of Intel Core processors with minor improvements. The processor offers a base clock of 3.5 GHz and reaches up to 5.3 GHz in Turbo. The basic CPU structure remains unchanged. This means that the Intel Core i5-14600K also has 6 P-cores and 8 E-cores, which means that up to 20 threads can be processed in parallel. The Intel Core i5-14600K still offers a freely selectable multiplier, which makes overclocking much easier. The LGA 1700 socket, which was already introduced with Alder-Lake, is also used as the basis.

Performance

Compared to the Intel Core i5-13600K , the IPC of the new Core i5-14600K has only been increased slightly. This means that the difference in performance is also only slight. The hybrid architecture relies on the Intel Thread Director, which is responsible for the correct allocation of tasks. As a further innovation, the manufacturer is increasingly relying on AI, which is also used for overclocking. With one click in the Intel Extreme Utility, the tool checks the entire system and makes the necessary settings.

Graphics unit

Like the Intel Core i5-13600K, the Intel Core i5-14600K also has an integrated graphics unit. The Intel Iris Xe architecture continues to serve as the basis. In terms of performance, however, nothing has changed with the Intel UHD Graphics 770.

Power consumption

The TDP of the Intel Core i5-14600K is 125 watts, with the option of consuming up to 181 watts in Turbo mode. If all limits are removed, the energy requirement rises to up to 240 watts. For cooling, we recommend a powerful air cooler or a 240 AiO.

AMD E1-1200

► remove from comparison

The AMD E1-1200 (codename Zacate, not to be confused with the Ryzen 3 1200 from 2017) is a dual-core processor for small notebooks and netbooks. It is produced on a 40 nm process and offers a relatively powerful integrated GPU and a single channel DDR3-1066 memory controller. Compared to the older E-300, which is based on the same chip, the E1-1200 offers a 100 MHz higher CPU clock rate.

The E1-1200 has two Bobcat cores running at 1.4 GHz (no Boost here) that can access 512 KB of L2 cache per core. In comparison to the Atom processors, the Bobcat architecture uses an "out-of-order" execution and is therefore faster at the same clock speed.

The integrated Radeon HD 7310 GPU offers 80 shaders and an UVD3 video decoder. Compared to the slow GMA 3150 in the Atom processors, an HD 7310 offers a lot more performance and is about as fast as the Nvidia ION graphics solution. The HD 7310's clock rate is 500 MHz to be very similar to the HD 6310 (488 - 500 MHz depending on the APU).

Performance

The average E1-1200 in our database is in the same league as the Celeron N2807 and the AMD E-300, as far as multi-thread benchmark scores are concerned. This is an outrageously slow chip, as of mid 2022.

Power consumption

This E-series APU has a default TDP of 18 W, meaning an active cooling solution is pretty much a must.

The AMD E1-1200 is built with a 40 nm process for very, very, very low, as of 2022, energy efficiency.

Intel Core i9-14900

► remove from comparison Intel i9-14900

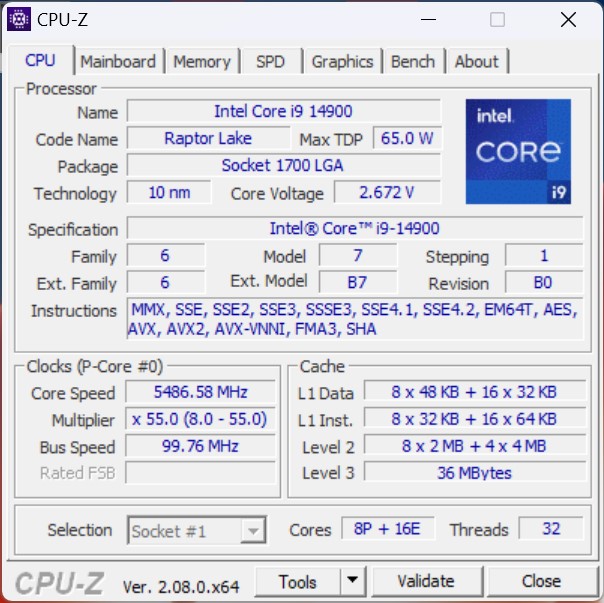
The Intel Core i9-14900 is a high-end processor based on the Raptor Lake architecture. The base clock is 2 GHz and can reach up to 5.8 GHz under optimal conditions. Similar to the top model (Intel Core i9-14900K), the total of 32 threads are divided into 8 p- and 16 e-cores. The 8 performance cores (p-cores) also offer hyperthreading, which means that a total of 32 threads can be processed simultaneously. The non-K model is an economical processor. There is still the option of DDR4 or DDR5 memory.

Performance

Compared to the Intel Core i9-14900K, the Core i9-14900 offers the same number of physical computing units. However, due to the lower power consumption, the Intel Core i9-14900 delivers slightly less performance. The intended use is primarily for compact PCs with limited cooling options.

Graphics unit

Like the Intel Core i9-14900K, the Intel Core i9-14900 offers an integrated graphics unit. The Intel Iris Xe architecture continues to serve as the basis. In terms of performance, however, nothing has changed with the Intel UHD Graphics 770.

Power consumption

The Intel Core i9-14900 is specified with a TDP of 65 watts, which corresponds to the PL1 value. In boost mode, the processor's performance can increase to up to 219 watts (PL2). However, this requires very good cooling. Compared to the Intel Core i9-13900, the specified power consumption has not changed.

ModelIntel Core i5-14600KAMD E1-1200Intel Core i9-14900
CodenameRaptor LakeZacateRaptor Lake
SeriesIntel Raptor Lake-RAMD E-SeriesIntel Raptor Lake-R
Series: Raptor Lake-R Raptor Lake
Intel Core i9-14900K3.2 - 6 GHz24 / 32 cores36 MB L3
Intel Core i7-14700K2.5 - 5.6 GHz20 / 28 cores33 MB L3
Intel Core i9-149002 - 5.8 GHz24 / 32 cores36 MB L3
Intel Core i7-147001.5 - 5.4 GHz20 / 28 cores33 MB L3
Intel Core i5-14600K « 3.5 - 5.3 GHz14 / 20 cores24 MB L3
Intel Core i5-145002.6 - 5 GHz14 / 20 cores24 MB L3
Intel Core i5-14500T1.7 - 4.8 GHz14 / 20 cores24 MB L3
AMD E2-20001.75 GHz2 / 2 cores
AMD E2-18001.7 GHz2 / 2 cores
AMD E-4501.65 GHz2 / 2 cores
AMD E-3501.6 GHz2 / 2 cores
AMD E1-15001.48 GHz2 / 2 cores
AMD E1-1200 « 1.4 GHz2 / 2 cores
AMD E-3001.3 GHz2 / 2 cores
AMD E-2401.5 GHz1 / 1 cores
Intel Core i9-14900K3.2 - 6 GHz24 / 32 cores36 MB L3
Intel Core i7-14700K2.5 - 5.6 GHz20 / 28 cores33 MB L3
Intel Core i9-14900 « 2 - 5.8 GHz24 / 32 cores36 MB L3
Intel Core i7-147001.5 - 5.4 GHz20 / 28 cores33 MB L3
Intel Core i5-14600K3.5 - 5.3 GHz14 / 20 cores24 MB L3
Intel Core i5-145002.6 - 5 GHz14 / 20 cores24 MB L3
Intel Core i5-14500T1.7 - 4.8 GHz14 / 20 cores24 MB L3
Clock3500 - 5300 MHz1400 MHz2000 - 5800 MHz
L2 Cache20 MB1 MB32 MB
L3 Cache24 MB36 MB
Cores / Threads14 / 20
6 x 5.3 GHz Intel Raptor Cove P-Core
8 x 3.5 GHz Intel Gracemont E-Core
2 / 224 / 32
8 x 5.8 GHz Intel Raptor Cove P-Core
16 x 4.3 GHz Intel Gracemont E-Core
TDP125 Watt18 Watt65 Watt
Technology10 nm40 nm10 nm
max. Temp.100 °C100 °C
SocketLGA 1700FT1 (BGA413)LGA 1700
FeaturesIntel UHD Graphics 770, DDR5 5600 MT/s, DDR4 3200 MT/sDDR3-1066 RAM (sin. chan.), PCIe 2 [?], MMX (+), SSE, SSE2, SSE3, SSSE3, SSE4A
iGPUIntel UHD Graphics 770 (300 - 1550 MHz)AMD Radeon HD 7310Intel UHD Graphics 770 (300 - 1650 MHz)
Architecturex86x86x86
$319 U.S.$549 U.S.
Announced
Manufacturerwww.intel.comwww.amd.comwww.intel.de
L1 Cache128 KB
Die Size75 mm2257 mm2
TDP Turbo PL2219 Watt

Benchmarks

Performance Rating - CB R15 + R20 + 7-Zip + X265 + Blender + 3DM11 CPU - i5-14600K
44.1 pt (73%)
Restrict / Search: Model: Max. age: years
Performance Rating - CB R15 + R20 + 7-Zip + X265 + Blender + 3DM11 CPU - i9-14900
47.2 pt (79%)
Restrict / Search: Model: Max. age: years
Cinebench 2024 - Cinebench 2024 CPU Single Core
122 Points (69%)
129 Points (72%)
Cinebench 2024 - Cinebench 2024 CPU Multi Core
1392 Points (26%)
1245 Points (23%)
Cinebench R23 - Cinebench R23 Multi Core
24491 Points (23%)
31070 Points (29%)
Cinebench R23 - Cinebench R23 Single Core
2064 Points (87%)
2212 Points (93%)
Cinebench R20 - Cinebench R20 CPU (Single Core)
790 Points (86%)
846 Points (92%)
Cinebench R20 - Cinebench R20 CPU (Multi Core)
9371 Points (23%)
11291 Points (28%)
Cinebench R15 - Cinebench R15 CPU Multi 64 Bit
3640 Points (23%)
4793 Points (30%)
Cinebench R15 - Cinebench R15 CPU Single 64 Bit
297 Points (82%)
315 Points (87%)
Cinebench R11.5 - Cinebench R11.5 CPU Multi 64 Bit
41 Points (53%)
min: 0.47     avg: 0.5     median: 0.5 (1%)     max: 0.54 Points
56.6 Points (73%)
Cinebench R11.5 - Cinebench R11.5 CPU Single 64 Bit
3.6 Points (85%)
min: 0.27     avg: 0.3     median: 0.3 (6%)     max: 0.28 Points
3.8 Points (90%)
Cinebench R10 - Cinebench R10 Rend. Single (32bit)
11396 Points (69%)
min: 888     avg: 906     median: 912 (6%)     max: 918 Points
12284 Points (74%)
Cinebench R10 - Cinebench R10 Rend. Multi (32bit)
75358 Points (55%)
min: 1654     avg: 1709     median: 1682 (1%)     max: 1791 Points
82492 Points (60%)
Cinebench R10 - Cinebench R10 Rend. Multi (64bit)
115171 Points (74%)
min: 1887     avg: 1909     median: 1913 (1%)     max: 1926 Points
121768 Points (78%)
Cinebench R10 - Cinebench R10 Rend. Single (64bit)
16643 Points (20%)
min: 984     avg: 1000     median: 1008 (1%)     max: 1008 Points
17590 Points (21%)
wPrime 2.10 - wPrime 2.0 1024m *
158.8 s (2%)
min: 2347     avg: 2479     median: 2410 (28%)     max: 2679 s
85.6 s (1%)
wPrime 2.10 - wPrime 2.0 32m *
2.4 s (0%)
min: 74     avg: 78.7     median: 76 (15%)     max: 86.2 s
2.4 s (0%)
WinRAR - WinRAR 4.0
11491 Points (18%)
min: 398     avg: 417.5     median: 417.5 (1%)     max: 437 Points
12359 Points (20%)
7-Zip 18.03 - 7-Zip 18.03 Multi Thread 4 runs
93235 MIPS (54%)
101652 MIPS (58%)
7-Zip 18.03 - 7-Zip 18.03 Single Thread 4 runs
6910 MIPS (81%)
7276 MIPS (86%)
X264 HD Benchmark 4.0 - x264 Pass 2
209 fps (5%)
222 fps (6%)
X264 HD Benchmark 4.0 - x264 Pass 1
411 fps (11%)
358.5 fps (9%)
HWBOT x265 Benchmark v2.2 - HWBOT x265 4k Preset
28.6 fps (50%)
31.6 fps (56%)
TrueCrypt - TrueCrypt Serpent
1.8 GB/s (53%)
2.4 GB/s (71%)
TrueCrypt - TrueCrypt Twofish
3.4 GB/s (59%)
4.9 GB/s (84%)
TrueCrypt - TrueCrypt AES
19.5 GB/s (51%)
18.5 GB/s (48%)
Blender - Blender 3.3 Classroom CPU *
223 Seconds (3%)
263 Seconds (3%)
Blender - Blender 2.79 BMW27 CPU *
134 Seconds (1%)
131 Seconds (1%)
R Benchmark 2.5 - R Benchmark 2.5 *
0.4 sec (9%)
0.4 sec (8%)
3DMark 06 - CPU - 3DMark 06 - CPU
18096 Points (39%)
min: 837     avg: 872     median: 873.5 (2%)     max: 905 Points
18728 Points (40%)
Super Pi mod 1.5 XS 1M - Super Pi mod 1.5 XS 1M *
6.2 s (1%)
min: 48.44     avg: 54.1     median: 57 (12%)     max: 57 s
5.8 s (1%)
Super Pi mod 1.5 XS 2M - Super Pi mod 1.5 XS 2M *
13.7 s (1%)
min: 110.5     avg: 120.8     median: 124 (5%)     max: 128 s
12.6 s (1%)
Super Pi Mod 1.5 XS 32M - Super Pi mod 1.5 XS 32M *
316.7 s (1%)
min: 2718     avg: 2755     median: 2766 (12%)     max: 2780 s
303.4 s (1%)
SiSoft Sandra Dhrystone (MIPS) - SiSoft Sandra Dhrystone (MIPS)
100%
1 E1-1200 +
8000 MIPS (4%)
SiSoft Sandra Whetstone (MFLOPS) - SiSoft Sandra Whetstone (MFLOPS)
100%
1 E1-1200 +
6460 MFLOPS (5%)
Windows 7 Experience Index - Win7 CPU
100%
1 E1-1200 +
min: 3.4     avg: 3.5     median: 3.6 (46%)     max: 3.6 Points
3DMark Vantage - 3DM Vant. Perf. CPU no Physx
96263 Points (74%)
min: 1347     avg: 1594     median: 1645.5 (1%)     max: 1738 Points
93183 Points (72%)
3DMark 11 - 3DM11 Performance Physics
31641 Points (78%)
min: 598     avg: 602     median: 604 (1%)     max: 605 Points
28622 Points (70%)
3DMark - 3DMark Ice Storm Physics
123069 Points (100%)
8205 Points (7%)
88787 Points (72%)
3DMark - 3DMark Ice Storm Extreme Physics
123244 Points (100%)
90442 Points (73%)
3DMark - 3DMark Ice Storm Unlimited Physics
109954 Points (88%)
93001 Points (75%)
3DMark - 3DMark Cloud Gate Physics
27407 Points (69%)
596 Points (2%)
20179 Points (51%)
3DMark - 3DMark Fire Strike Standard Physics
40164 Points (72%)
748 Points (1%)
42316 Points (75%)
3DMark - 3DMark Time Spy CPU
18768 Points (79%)
19492 Points (82%)
Geekbench 6.4 - Geekbench 6.4 Single-Core
2879 Points (72%)
3022 Points (75%)
Geekbench 6.4 - Geekbench 6.4 Multi-Core
17409 Points (68%)
15962 Points (62%)
Geekbench 6.0 - Geekbench 6.0 Single-Core
2764 Points (88%)
Geekbench 6.0 - Geekbench 6.0 Multi-Core
16875 Points (69%)
Geekbench 5.5 - Geekbench 5.1 - 5.5 64 Bit Single-Core
2017 Points (79%)
2140 Points (84%)
Geekbench 5.5 - Geekbench 5.1 - 5.5 64 Bit Multi-Core
17516 Points (31%)
17395 Points (31%)
Geekbench 5.0 - Geekbench 5.0 64 Bit Single-Core
2004 Points (9%)
2077 Points (9%)
Geekbench 5.0 - Geekbench 5.0 64 Bit Multi-Core
17374 Points (55%)
17218 Points (54%)
Geekbench 4.4 - Geekbench 4.1 - 4.4 64 Bit Single-Core
8904 Points (89%)
9143 Points (91%)
Geekbench 4.4 - Geekbench 4.1 - 4.4 64 Bit Multi-Core
64035 Points (64%)
67178 Points (67%)
Geekbench 2 - 32 Bit - Geekbench Stream
100%
1 E1-1200 +
1437 Points (8%)
Geekbench 2 - 32 Bit - Geekbench Memory
100%
1 E1-1200 +
1179 Points (8%)
Geekbench 2 - 32 Bit - Geekbench Floating Point
100%
1 E1-1200 +
1597 Points (3%)
Geekbench 2 - 32 Bit - Geekbench Integer
100%
1 E1-1200 +
1433 Points (3%)
Geekbench 2 - 32 Bit - Geekbench Total Score
100%
1 E1-1200 +
1440 Points (4%)
Mozilla Kraken 1.1 - Kraken 1.1 Total Score *
450 ms (1%)
436 ms (1%)
WebXPRT 4 - WebXPRT 4 Score
301 Points (83%)
WebXPRT 3 - WebXPRT 3 Score
354 Points (64%)
315 Points (57%)
CrossMark - CrossMark Overall
2310 Points (86%)
2133 Points (80%)
Power Consumption - Prime95 Power Consumption - external Monitor *
370 Watt (64%)
145.5 Watt (25%)
Power Consumption - Cinebench R15 Multi Power Consumption - external Monitor *
329 Watt (60%)
253 Watt (46%)
Power Consumption - Idle Power Consumption - external Monitor *
110.4 Watt (73%)
29.9 Watt (20%)
Power Consumption - Power Efficiency - Cinebench R15 Multi external Monitor
11.1 Points per Watt (8%)
18.9 Points per Watt (14%)

Average Benchmarks Intel Core i5-14600K → 100% n=18

Average Benchmarks AMD E1-1200 → 5% n=18

Average Benchmarks Intel Core i9-14900 → 107% n=18

- Range of benchmark values for this graphics card
red legend - Average benchmark values for this graphics card
* Smaller numbers mean a higher performance
1 This benchmark is not used for the average calculation

v1.33
log 08. 17:30:58

#0 ran 0s before starting gpusingle class +0s ... 0s

#1 checking url part for id 15093 +0s ... 0s

#2 checking url part for id 3146 +0s ... 0s

#3 checking url part for id 18150 +0s ... 0s

#4 redirected to Ajax server, took 1757345458s time from redirect:0 +0s ... 0s

#5 did not recreate cache, as it is less than 5 days old! Created at Sun, 07 Sep 2025 05:18:17 +0200 +0s ... 0s

#6 composed specs +0.007s ... 0.007s

#7 did output specs +0s ... 0.007s

#8 getting avg benchmarks for device 15093 +0.004s ... 0.012s

#9 got single benchmarks 15093 +0.005s ... 0.016s

#10 getting avg benchmarks for device 3146 +0.001s ... 0.017s

#11 got single benchmarks 3146 +0.006s ... 0.023s

#12 getting avg benchmarks for device 18150 +0.004s ... 0.027s

#13 got single benchmarks 18150 +0.004s ... 0.031s

#14 got avg benchmarks for devices +0s ... 0.031s

#15 min, max, avg, median took s +0.06s ... 0.091s

#16 return log +0s ... 0.091s

Please share our article, every link counts!
Mail Logo
> Expert Reviews and News on Laptops, Smartphones and Tech Innovations > Benchmarks / Tech > Processor Comparison - Head 2 Head
Redaktion, 2017-09- 8 (Update: 2023-07- 1)