Notebookcheck Logo

Intel Core Ultra 5 235 vs AMD Ryzen 9 9950X

Intel Core Ultra 5 235

► remove from comparison Intel Ultra 5 235

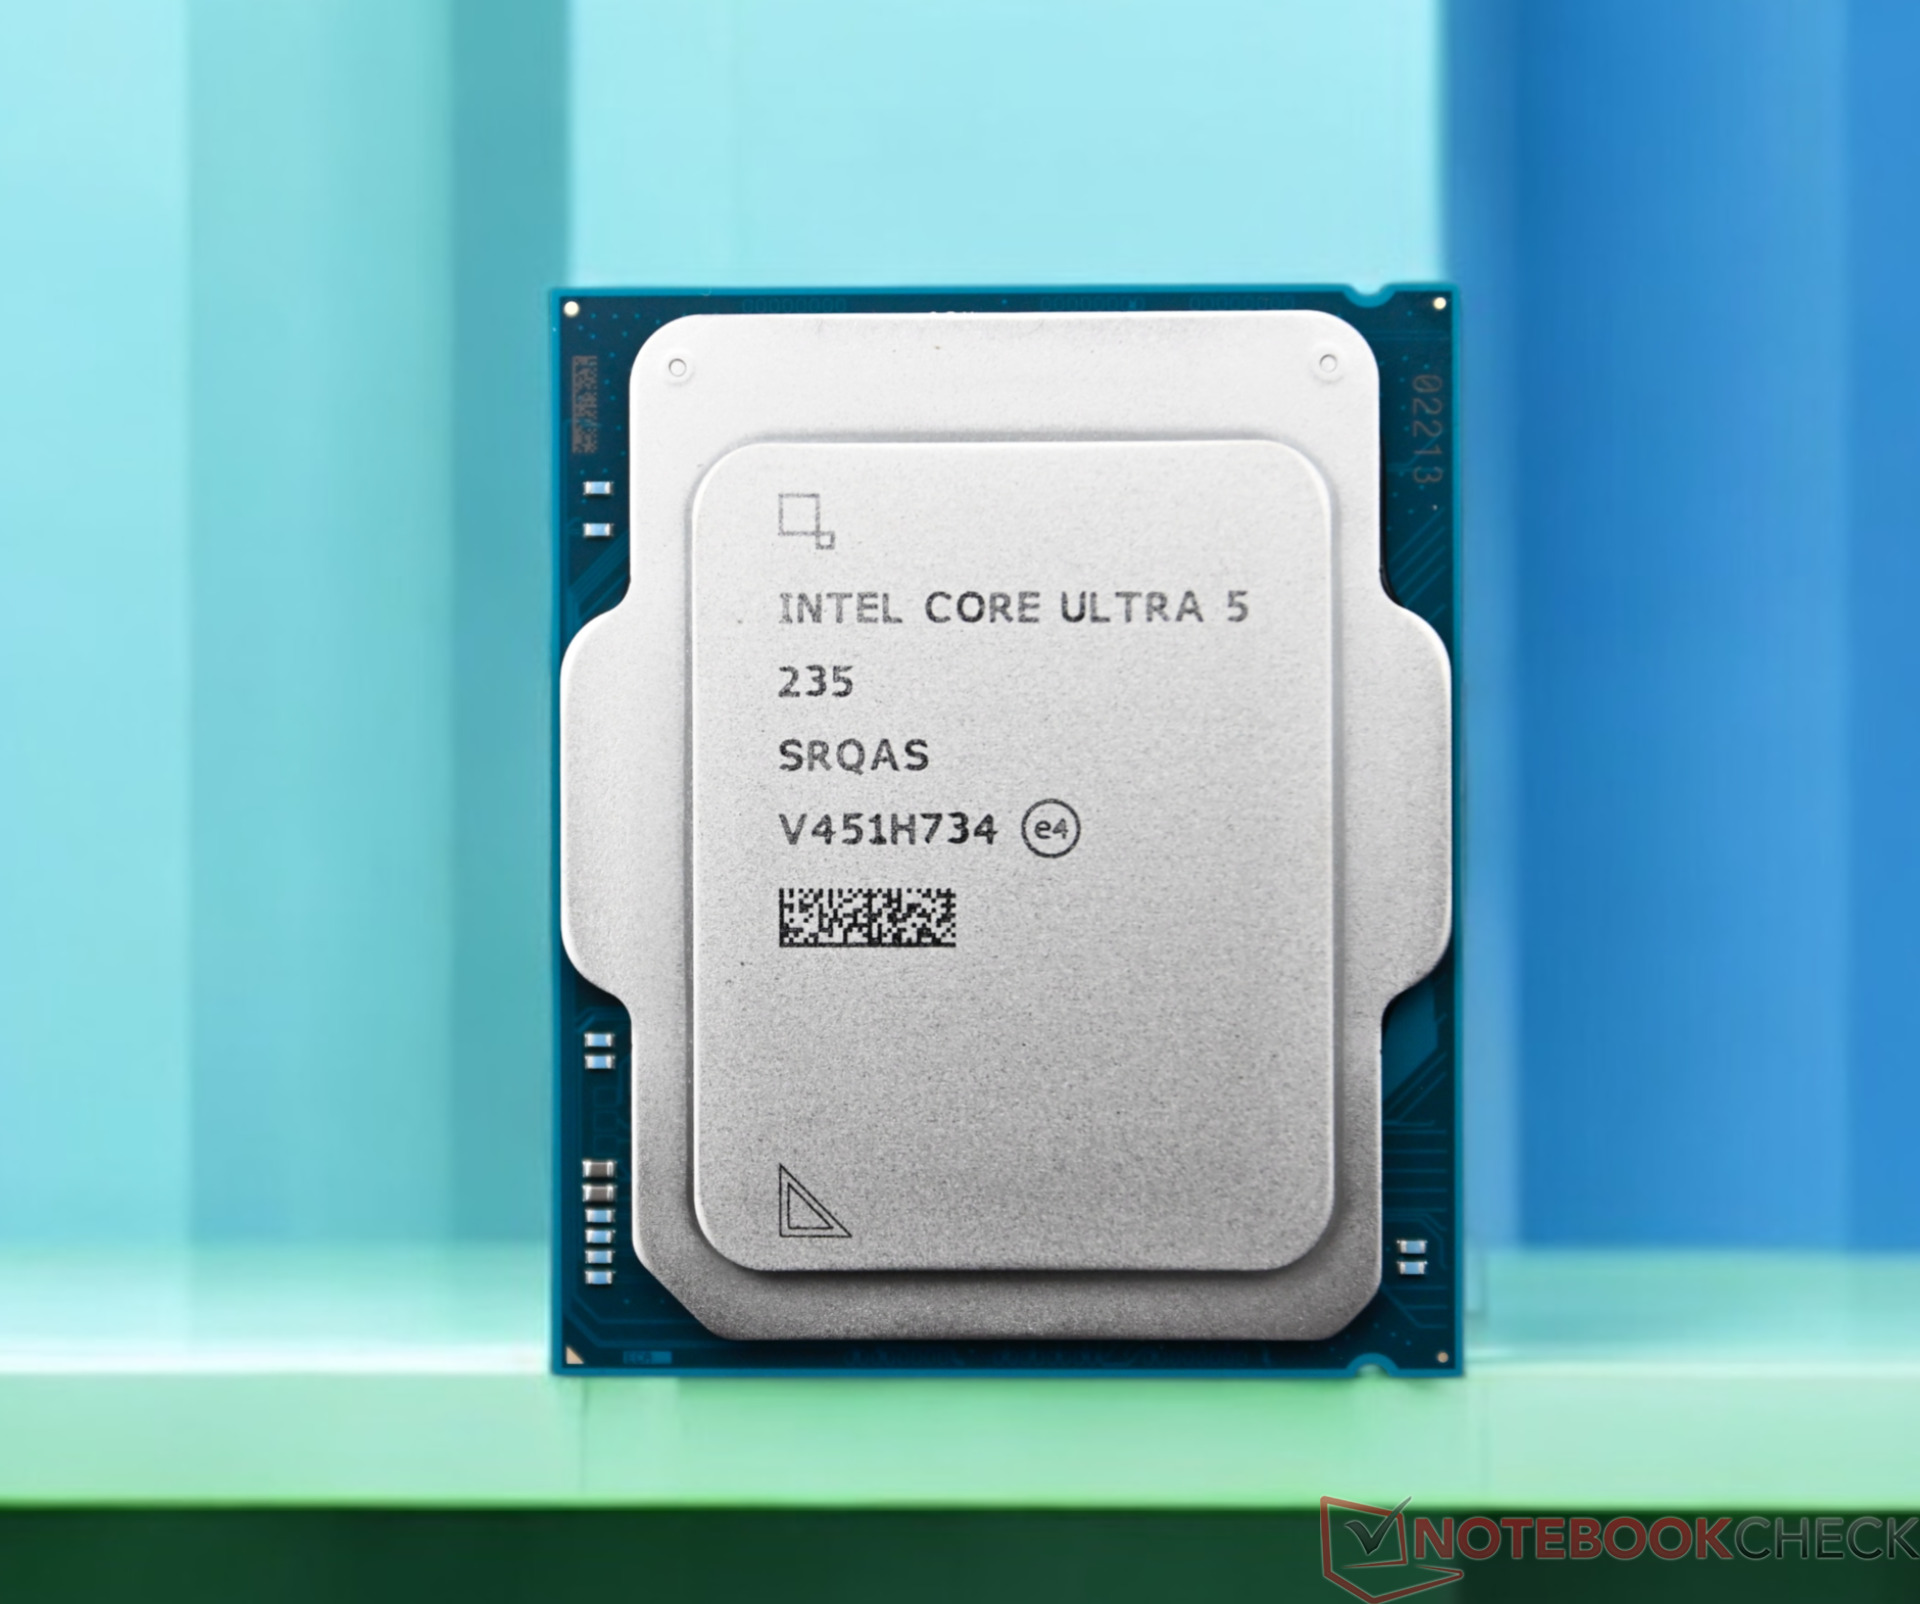
The Intel Core Ultra 5 235 is a desktop processor based on the Arrow Lake-S series that was introduced at the beginning of 2025. It offers 14 cores divided in 6 performance cores with up to 5 GHz and 8 efficiency cores with up to 4.4 GHz.

The CPU performance is comparable to the old Intel Core i5-13600K and therefore well suited for demanding tasks.

The Arrow Lake-S chips are composed of several chiplets. The CPU part is manufactured at TSMC in the modern N3B (3nm) process, the GPU also comes from TSMC in the N5P process. The SoC and I/O tile are manufactured in the TSMC N6 process. The base tile is manufactured by Intel in the 22nm process and carries the individual chiplets thanks to Fovero's 3D packaging.

The TDP is specified at 65 watts (long-term) to 121 watts (Turbo).

AMD Ryzen 9 9950X

AMD Ryzen 9 9950X

The Ryzen 9 9950X is a very, very powerful desktop CPU of the Granite Ridge product family that features 16 Zen 5 cores (32 threads), PCIe 5 support and a basic iGPU. The Ryzen was launched in June 2024, with sales slated to start in August.

The 9950X shares some of the specifications with the mighty Zen 4-powered Ryzen 9 7950X, including (but not limited to) the 16 MB L2 cache, the 64 MB L3 cache, the 5.7 GHz top clock speed and the 170 W long-term TDP.

Architecture and Features

Just like Strix Point APUs, Granite Ridge processors make use of the new Zen 5 microarchitecture. However, there are no efficient cores here; all of 9950X's cores are full Zen 5 cores. Furthermore, Granite Ridge is a multi-die design with only the CPU cores produced using a fairly modern 4 nm TSMC process. Strix Point processors are a single-die design, from what we know.

According to AMD, Zen 5 delivers a 16% IPC improvement over Zen 4 thanks to branch prediction improvements and other refinements.

Elsewhere, the 9950X has an impressive 64 MB of L3 cache and 24 direct PCIe 5 lanes (3.93 GB/s throughput per lane) with up to 12 additional PCIe 4 lanes available depending on the motherboard. It supports DDR5 RAM as fast as 5,600 MT/s (up to 8,000 MT/s if overclocked).

The 9950X is unlocked for overclocking. Naturally, the AM5 socket CPU supports Windows 11, 64-bit Windows 10 as well as many Linux distros.

Performance

According to early July leaks, its multi-thread performance is about as good as that of the 24-core Core i9-14900K Intel CPU. We'll definitely update this section once we get our hands on a system powered by the 9950X.

Graphics

The Radeon 610M comes equipped with just 128 unified shaders running at up to 2,200 MHz. Its gaming performance is slated to be extremely low and only just sufficient for pre-2020 games in resolutions such as 1024x768.

Power consumption

The CPU cores are built with TSMC's N4P process for good, as of mid 2024, power efficiency. (Apple is the leader in this regard with the second-generation 3 nm process.)

The Ryzen 9's long-term TDP is 170 W. It'll probably consume up to 250 W when under heavy short-term loads. If overclocked, the power consumption figures will increase significantly.

ModelIntel Core Ultra 5 235AMD Ryzen 9 9950X
CodenameArrow Lake-SGranite Ridge
SeriesIntel Arrow LakeAMD Granite Ridge (Zen 5, AM5)
Series: Granite Ridge (Zen 5, AM5) Granite Ridge
Intel Core Ultra 9 285K compare3.2 - 5.7 GHz24 / 24 cores36 MB L3
Intel Core Ultra 5 245K compare3.6 - 5.2 GHz14 / 14 cores24 MB L3
Intel Core Ultra 5 235 « 3.4 - 5 GHz14 / 14 cores24 MB L3
Intel Core Ultra 5 225F compare3.3 - 4.9 GHz10 / 10 cores20 MB L3
AMD Ryzen 9 9950X3D compare4.3 - 5.7 GHz16 / 32 cores128 MB L3
AMD Ryzen 9 9950X « 4.3 - 5.7 GHz16 / 32 cores64 MB L3
AMD Ryzen 9 9900X compare4.4 - 5.6 GHz12 / 24 cores64 MB L3
AMD Ryzen 7 9700X compare3.8 - 5.5 GHz8 / 16 cores32 MB L3
AMD Ryzen 7 9800X3D compare4.7 - 5.2 GHz8 / 16 cores96 MB L3
AMD Ryzen 5 9600X compare3.9 - 5.4 GHz6 / 12 cores32 MB L3
Clock3400 - 5000 MHz4300 - 5700 MHz
L2 Cache26 MB16 MB
L3 Cache24 MB64 MB
Cores / Threads14 / 14
6 x 5.0 GHz Intel Lion Cove P-core
8 x 4.4 GHz Intel Skymont E-core
16 / 32
16 x 5.7 GHz AMD Zen 5
TDP65 Watt170 Watt
TDP Turbo PL2121 Watt
SocketLGA1851AM5
iGPUIntel Graphics 4-Core iGPU (Arc) (300 - 2000 MHz)AMD Radeon 610M ( - 2200 MHz)
Architecturex86x86
$247 U.S.
Announced
Manufacturerwww.intel.dewww.amd.com
L1 Cache1 MB
Technology4 nm & 6 nm
max. Temp.95 °C
FeaturesDDR5-5600 RAM, PCIe 5 + PCIe 4, SMT, AES, AVX, AVX2, AVX512, FMA3, MMX (+), SHA, SSE, SSE2, SSE3, SSSE3, SSE4.1, SSE4.2, SSE4A

Benchmarks

Performance Rating - CB R15 + R20 + 7-Zip + X265 + Blender + 3DM11 CPU - Ultra 5 235
43.8 pt (73%)
Restrict / Search: Model: Max. age: years
Performance Rating - CB R15 + R20 + 7-Zip + X265 + Blender + 3DM11 CPU - Ryzen 9 9950X
51.5 pt (86%)
Restrict / Search: Model: Max. age: years
Cinebench 2024 - Cinebench 2024 CPU Single Core
127 Points (71%)
136 Points (76%)
Cinebench 2024 - Cinebench 2024 CPU Multi Core
1172 Points (22%)
2254 Points (42%)
Cinebench R23 - Cinebench R23 Multi Core
21677 Points (20%)
40924 Points (38%)
Cinebench R23 - Cinebench R23 Single Core
2057 Points (87%)
2202 Points (93%)
Cinebench R20 - Cinebench R20 CPU (Single Core)
795 Points (87%)
871 Points (95%)
Cinebench R20 - Cinebench R20 CPU (Multi Core)
8518 Points (21%)
15788 Points (38%)
Cinebench R15 - Cinebench R15 CPU Multi 64 Bit
3642 Points (23%)
6335 Points (40%)
Cinebench R15 - Cinebench R15 CPU Single 64 Bit
312 Points (86%)
344 Points (95%)
Cinebench R11.5 - Cinebench R11.5 CPU Multi 64 Bit
44.3 Points (57%)
72.3 Points (94%)
Cinebench R11.5 - Cinebench R11.5 CPU Single 64 Bit
3.8 Points (90%)
min: 4.03     avg: 4     median: 4 (96%)     max: 4.21 Points
Cinebench R10 - Cinebench R10 Rend. Single (32bit)
11400 Points (69%)
9402 Points (57%)
Cinebench R10 - Cinebench R10 Rend. Multi (32bit)
84924 Points (62%)
71611 Points (52%)
Cinebench R10 - Cinebench R10 Rend. Multi (64bit)
131431 Points (84%)
Cinebench R10 - Cinebench R10 Rend. Single (64bit)
17602 Points (21%)
wPrime 2.10 - wPrime 2.0 1024m *
77.7 s (1%)
29.3 s (0%)
wPrime 2.10 - wPrime 2.0 32m *
2.8 s (1%)
2.1 s (0%)
WinRAR - WinRAR 4.0
9883 Points (16%)
13778 Points (22%)
7-Zip 18.03 - 7-Zip 18.03 Multi Thread 4 runs
71174 MIPS (41%)
160423 MIPS (92%)
7-Zip 18.03 - 7-Zip 18.03 Single Thread 4 runs
6479 MIPS (76%)
7852 MIPS (93%)
X264 HD Benchmark 4.0 - x264 Pass 2
200.9 fps (67%)
271 fps (91%)
X264 HD Benchmark 4.0 - x264 Pass 1
378 fps (87%)
392 fps (90%)
HWBOT x265 Benchmark v2.2 - HWBOT x265 4k Preset
25 fps (44%)
45.1 fps (79%)
TrueCrypt - TrueCrypt Serpent
1.4 GB/s (41%)
3.4 GB/s (100%)
TrueCrypt - TrueCrypt Twofish
2.8 GB/s (48%)
5.6 GB/s (97%)
TrueCrypt - TrueCrypt AES
15.9 GB/s (41%)
32.4 GB/s (84%)
Blender - Blender 3.3 Classroom CPU *
278 Seconds (4%)
118 Seconds (2%)
Blender - Blender 2.79 BMW27 CPU *
168 Seconds (1%)
77 Seconds (1%)
R Benchmark 2.5 - R Benchmark 2.5 *
0.4 sec (9%)
0.3 sec (7%)
3DMark 06 - CPU - 3DMark 06 - CPU
19133 Points (41%)
21838 Points (46%)
Super Pi mod 1.5 XS 1M - Super Pi mod 1.5 XS 1M *
7.6 s (2%)
7.3 s (2%)
Super Pi mod 1.5 XS 2M - Super Pi mod 1.5 XS 2M *
16.7 s (1%)
15.6 s (1%)
3DMark Vantage - 3DM Vant. Perf. CPU no Physx
104702 Points (80%)
3DMark 11 - 3DM11 Performance Physics
26990 Points (66%)
38269 Points (94%)
3DMark - 3DMark Ice Storm Physics
113507 Points (92%)
3DMark - 3DMark Ice Storm Extreme Physics
114645 Points (93%)
3DMark - 3DMark Ice Storm Unlimited Physics
116826 Points (94%)
3DMark - 3DMark Cloud Gate Physics
24481 Points (62%)
3DMark - 3DMark Fire Strike Standard Physics
37722 Points (67%)
49522 Points (88%)
3DMark - 3DMark Time Spy CPU
16138 Points (68%)
16112 Points (68%)
Geekbench 6.4 - Geekbench 6.4 Single-Core
2971 Points (74%)
3408 Points (85%)
Geekbench 6.4 - Geekbench 6.4 Multi-Core
17484 Points (68%)
21383 Points (83%)
Geekbench 6.0 - Geekbench 6.0 Single-Core
3105 Points (99%)
Geekbench 6.0 - Geekbench 6.0 Multi-Core
21003 Points (86%)
Geekbench 5.5 - Geekbench 5.1 - 5.5 64 Bit Single-Core
2171 Points (85%)
2559 Points (100%)
Geekbench 5.5 - Geekbench 5.1 - 5.5 64 Bit Multi-Core
17696 Points (32%)
23982 Points (43%)
Geekbench 5.0 - Geekbench 5.0 64 Bit Single-Core
2127 Points (9%)
2445 Points (11%)
Geekbench 5.0 - Geekbench 5.0 64 Bit Multi-Core
17664 Points (56%)
23387 Points (74%)
Geekbench 4.4 - Geekbench 4.1 - 4.4 64 Bit Single-Core
9043 Points (90%)
10016 Points (100%)
Geekbench 4.4 - Geekbench 4.1 - 4.4 64 Bit Multi-Core
65823 Points (66%)
100326 Points (100%)
Mozilla Kraken 1.1 - Kraken 1.1 Total Score *
436 ms (1%)
377 ms (0%)
WebXPRT 4 - WebXPRT 4 Score
313 Points (86%)
357 Points (98%)
WebXPRT 3 - WebXPRT 3 Score
329 Points (59%)
409 Points (73%)
CrossMark - CrossMark Overall
2131 Points (80%)
2451 Points (92%)
Power Consumption - Prime95 Power Consumption - external Monitor *
163 Watt (28%)
319 Watt (55%)
Power Consumption - Cinebench R15 Multi Power Consumption - external Monitor *
225 Watt (41%)
313 Watt (57%)
Power Consumption - Idle Power Consumption - external Monitor *
92.3 Watt (61%)
100 Watt (66%)
Power Consumption - Power Efficiency - Cinebench R15 Multi external Monitor
16.2 Points per Watt (12%)
20.2 Points per Watt (15%)

Average Benchmarks Intel Core Ultra 5 235 → 100% n=44

Average Benchmarks AMD Ryzen 9 9950X → 143% n=44

- Range of benchmark values for this graphics card
red legend - Average benchmark values for this graphics card
* Smaller numbers mean a higher performance
1 This benchmark is not used for the average calculation

Add one or more devices and compare

In the following list you can select (and also search for) devices that should be added to the comparison. You can select more than one device.

restrict list:
v1.33
log 24. 12:22:25

#0 ran 0s before starting gpusingle class +0s ... 0s

#1 checking url part for id 19651 +0s ... 0s

#2 checking url part for id 17637 +0s ... 0s

#3 redirected to Ajax server, took 1756030945s time from redirect:0 +0s ... 0s

#4 did not recreate cache, as it is less than 5 days old! Created at Fri, 22 Aug 2025 05:18:47 +0200 +0s ... 0s

#5 composed specs +0.007s ... 0.007s

#6 did output specs +0s ... 0.007s

#7 getting avg benchmarks for device 19651 +0.005s ... 0.012s

#8 got single benchmarks 19651 +0.005s ... 0.017s

#9 getting avg benchmarks for device 17637 +0.004s ... 0.021s

#10 got single benchmarks 17637 +0.005s ... 0.026s

#11 got avg benchmarks for devices +0s ... 0.026s

#12 min, max, avg, median took s +0.056s ... 0.081s

#13 return log +0.003s ... 0.084s

Please share our article, every link counts!
Mail Logo
> Expert Reviews and News on Laptops, Smartphones and Tech Innovations > Benchmarks / Tech > Processor Comparison - Head 2 Head
Redaktion, 2017-09- 8 (Update: 2023-07- 1)