Notebookcheck Logo

Intel Core 2 Duo T8300 vs Intel Core i5-520UM

Intel Core 2 Duo T8300

► remove from comparison

The Intel Core 2 Duo T8300 was at the time of announcement a fast dual-core CPU for laptops with 3 MB level 2 cache. It is based on the Penryn core with all features enabled (but without the full 6MB level 2 cache). The later announced Core 2 Duo P7450 was cheaper and used less power.

Intel Core i5-520UM

► remove from comparison Intel 520UM

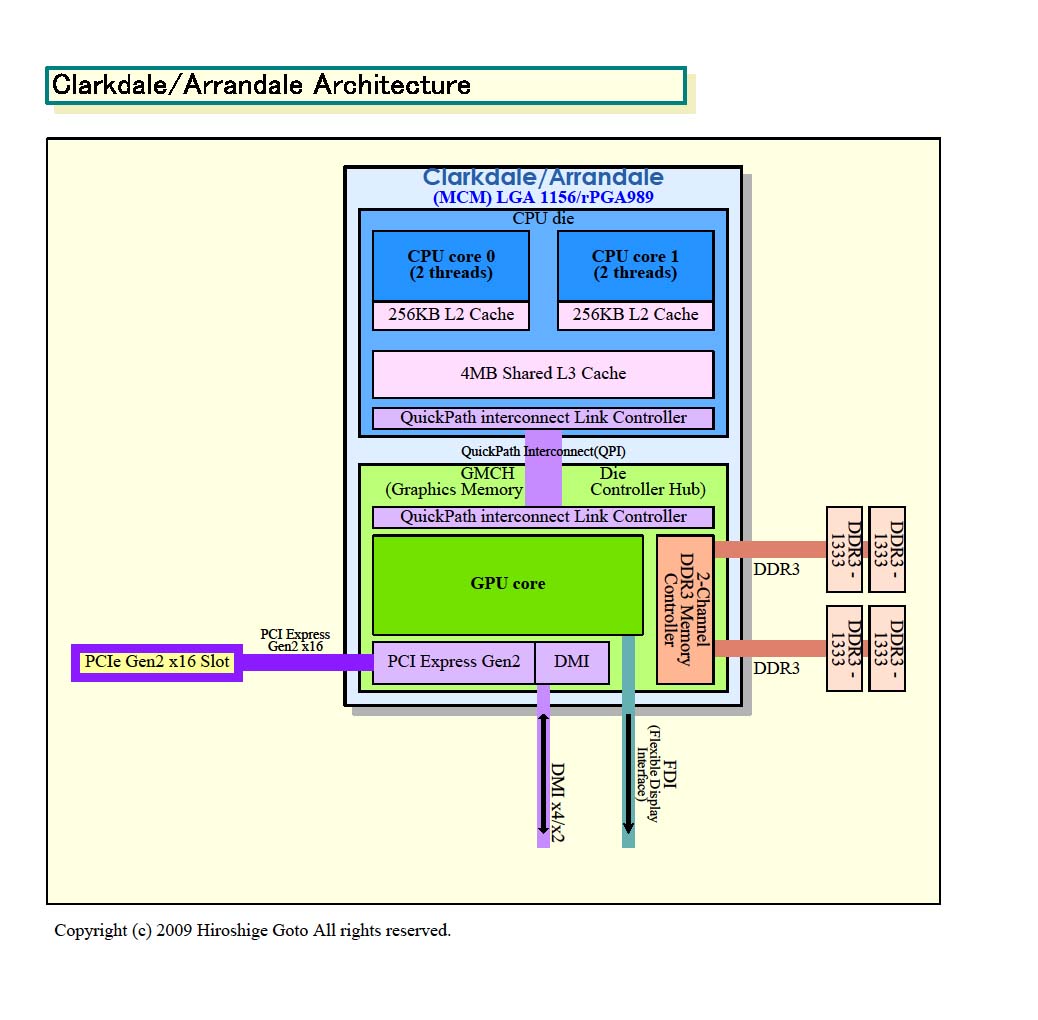
The Intel Core i5-520UM is a Ultra Low Voltage dual-core processor for small and light laptops. It is clocked with 1.06 - 1.86 GHz (if Turbo Boost is enabled). Each core is based on the Nehalem (Westmere) micro-architecture. Hyperthreading enables the Dual Core CPU to handle 4 threads at once (for a better usage of the pipeline). Compared to the Core i7-620UM, the i5 offers only 3MB Level 3 cache (i7 4MB) and a lower maximum Turbo Boost frequency. Other Core i5 CPUs (withouth the U in the name) are faster due to the higher clock speed, but need more power.

A feature of the new Core i5-520UM is the integrated graphics card (called Intel HD Graphics) and memory controller. Both are on a separate die that is still manufactured in 45nm whereas the CPU die is already manufactured in the new 32nm process.

Due to the integrated memory controller, the HyperThreading and Turbo Boost, the  Core i5-520UM is faster than a similar clocked Core 2 Duo (1.2 GHz) in all (us known) applications and benchmarks. Still the Turbo Boost may not trigger very often (sometimes it is even not activated in the BIOS) and therefore the maximum of 1.86 GHz is not very important. 

The 32nm cpu cores of the Westmere generation can also process some new instructions to accelerate AES encryptions. Modern applications that support AES encoding can profit significantly using the new instructions (e.g. the Communications Suite test in the PCMark Vantage boosts up to 70% using AES in the faster Core i5-520M).

The integrated Intel Graphics Media Accelerator HD (GMA HD) graphics card is between 166-500 MHz (Turbo Boost) and therefore the base speed is clearly below the non low voltage versions. The performance should still be faster than the old GMA 4500MHD.

The power consumption of 18 Watt TDP (max.) counts for the whole package and therefore it is clearly better than the 17 Watt TDP of the Core 2 Duo SL-series (CPU alone).

ModelIntel Core 2 Duo T8300Intel Core i5-520UM
SeriesIntel Core 2 DuoIntel Core i5
CodenamePenrynArrandale
Series: Core i5 Arrandale
Intel Core 2 Duo T9900 compare3.06 GHz2 / 2 cores
Intel Core 2 Duo T9800 compare2.92 GHz2 / 2 cores
Intel Core 2 Duo P9700 compare2.8 GHz2 / 2 cores
Intel Core 2 Duo T9600 compare2.8 GHz2 / 2 cores
Intel Core 2 Duo P9600 compare2.66 GHz2 / 2 cores
Intel Core 2 Duo T9550 compare2.66 GHz2 / 2 cores
Intel Core 2 Duo T9500 compare2.6 GHz2 / 2 cores
Intel Core 2 Duo SP9600 compare2.53 GHz2 / 2 cores
Intel Core 2 Duo P9500 compare2.53 GHz2 / 2 cores
Intel Core 2 Duo T9400 compare2.53 GHz2 / 2 cores
Intel Core 2 Duo P8800 compare2.66 GHz2 / 2 cores
Intel Core 2 Duo T9300 compare2.5 GHz2 / 2 cores
Intel Core 2 Duo P8700 compare2.53 GHz2 / 2 cores
Intel Core 2 Duo SP9400 compare2.4 GHz2 / 2 cores
Intel Core 2 Duo P8600 compare2.4 GHz2 / 2 cores
Intel Core 2 Duo T8300 « 2.4 GHz2 / 2 cores
Intel Core 2 Duo SP9300 compare2.26 GHz2 / 2 cores
Intel Core 2 Duo P8400 compare2.26 GHz2 / 2 cores
Intel Core 2 Duo P7570 compare2.26 GHz2 / 2 cores
Intel Core 2 Duo P7550 compare2.26 GHz2 / 2 cores
Intel Core 2 Duo T6770 compare2.3 GHz2 / 2 cores
Intel Core 2 Duo SL9600 compare2.13 GHz2 / 2 cores
Intel Core 2 Duo P7450 compare2.13 GHz2 / 2 cores
Intel Core 2 Duo T6670 compare2.2 GHz2 / 2 cores
Intel Core 2 Duo T6600 compare2.2 GHz2 / 2 cores
Intel Core 2 Duo T8100 compare2.1 GHz2 / 2 cores
Intel Core 2 Duo P7370 compare2 GHz2 / 2 cores
Intel Core 2 Duo P7350 compare2 GHz2 / 2 cores
Intel Core 2 Duo T6570 compare2.1 GHz2 / 2 cores
Intel Core 2 Duo T6500 compare2.1 GHz2 / 2 cores
Intel Core 2 Duo SL9400 compare1.86 GHz2 / 2 cores
Intel Core 2 Duo SL9380 compare1.8 GHz2 / 2 cores
Intel Core 2 Duo T6400 compare2 GHz2 / 2 cores
Intel Core 2 Duo SL9300 compare1.6 GHz2 / 2 cores
Intel Core 2 Duo SU9600 compare1.6 GHz2 / 2 cores
Intel Core 2 Duo SU9400 compare1.4 GHz2 / 2 cores
Intel Core 2 Duo SU7300 compare1.3 GHz2 / 2 cores
Intel Core 2 Duo SU9300 compare1.2 GHz2 / 2 cores
Intel Core i5-580M compare2.67 - 3.33 GHz2 / 4 cores3 MB L3
Intel Core i5-560M compare2.67 - 3.2 GHz2 / 4 cores3 MB L3
Intel Core i5-480M compare2.67 - 2.93 GHz2 / 4 cores3 MB L3
Intel Core i5-540M compare2.53 - 3.07 GHz2 / 4 cores3 MB L3
Intel Core i5-460M compare2.53 - 2.8 GHz2 / 4 cores3 MB L3
Intel Core i5-520M compare2.4 - 2.93 GHz2 / 4 cores3 MB L3
Intel Core i5-450M compare2.4 - 2.66 GHz2 / 4 cores3 MB L3
Intel Core i5-430M compare2.26 - 2.53 GHz2 / 4 cores3 MB L3
Intel Core i5-560UM compare1.33 - 2.13 GHz2 / 4 cores3 MB L3
Intel Core i5-470UM compare1.33 - 1.87 GHz2 / 4 cores3 MB L3
Intel Core i5-540UM compare1.2 - 2 GHz2 / 4 cores3 MB L3
Intel Core i5-520UM « 1.06 - 1.87 GHz2 / 4 cores3 MB L3
Intel Core i5-430UM compare1.2 - 1.73 GHz2 / 4 cores3 MB L3
Clock2400 MHz1060 - 1866 MHz
FSB8002500
L2 Cache3 MB512 KB
Cores / Threads2 / 22 / 4
TDP35 Watt18 Watt
Transistors410 Million382+177 Million
Technology45 nm, 1-1.25V32 nm
Die Size107 mm281+114 mm2
max. Temp.105 °C105 °C
SocketBGA479, PGA478BGA1288
FeaturesVirtualization (VT-x), Intel 64, Idle States, Enhanced Speedstep, Execute Disable BitTurbo Boost (1.86 GHz max), Hyper Threading, Enhanced Speedstep, integrated GMA HD 166-500MHz
Architecturex86x86
$241 U.S.$241 U.S.
Announced
Manufacturerark.intel.comark.intel.com
L3 Cache3 MB

Benchmarks

Cinebench R11.5 - Cinebench R11.5 CPU Multi 64 Bit
100%
1 520UM +
min: 1.02     avg: 1.2     median: 1.2 (2%)     max: 1.33 Points
Cinebench R10 - Cinebench R10 Rend. Single (32bit)
min: 2406     avg: 2612     median: 2626 (16%)     max: 2704 Points
min: 1471     avg: 1981     median: 1942.5 (12%)     max: 2569 Points
Cinebench R10 - Cinebench R10 Rend. Multi (32bit)
min: 3918     avg: 4773     median: 4837 (4%)     max: 4965 Points
min: 2785     avg: 3670     median: 3778 (3%)     max: 4340 Points
Cinebench R10 - Cinebench R10 Rend. Multi (64bit)
100%
1 520UM +
min: 3946     avg: 4600     median: 4632.5 (3%)     max: 5187 Points
Cinebench R10 - Cinebench R10 Rend. Single (64bit)
100%
1 520UM +
min: 2263     avg: 2561     median: 2423.5 (3%)     max: 3135 Points
wPrime 2.10 - wPrime 2.0 1024m *
100%
1 520UM +
min: 995     avg: 1110     median: 1110 (13%)     max: 1225 s
wPrime 2.10 - wPrime 2.0 32m *
100%
1 520UM +
min: 31.8     avg: 35.2     median: 35.2 (7%)     max: 38.5 s
3DMark 06 - CPU - 3DMark 06 - CPU
min: 1986     avg: 2121     median: 2143 (5%)     max: 2181 Points
min: 982     avg: 1429     median: 1492 (3%)     max: 1718 Points
Super Pi mod 1.5 XS 1M - Super Pi mod 1.5 XS 1M *
min: 20     avg: 20.8     median: 21 (5%)     max: 21 s
min: 24     avg: 26.7     median: 25 (5%)     max: 31 s
Super Pi mod 1.5 XS 2M - Super Pi mod 1.5 XS 2M *
min: 50     avg: 50.5     median: 50.5 (2%)     max: 51 s
min: 56     avg: 62.3     median: 58 (2%)     max: 73 s
Super Pi Mod 1.5 XS 32M - Super Pi mod 1.5 XS 32M *
1206 s (5%)
min: 1303     avg: 1439     median: 1341 (6%)     max: 1674 s
SiSoft Sandra Dhrystone (MIPS) - SiSoft Sandra Dhrystone (MIPS)
100%
1 T8300 +
22062 MIPS (10%)
SiSoft Sandra Whetstone (MFLOPS) - SiSoft Sandra Whetstone (MFLOPS)
100%
1 T8300 +
17583 MFLOPS (13%)
PCMark 05 - PCMark 05 - Standard
min: 4358     avg: 5255     median: 5311 (11%)     max: 6090 Points
min: 2848     avg: 3571     median: 3925 (8%)     max: 3940 Points
Windows Vista Experience Index - Windows Vista Leistungsindex - Prozessor
100%
1 T8300 +
min: 4     avg: 5.1     median: 5.3 (76%)     max: 5.4 Points
Windows 7 Experience Index - Win7 CPU
100%
1 520UM +
min: 3.9     avg: 4.7     median: 4.8 (61%)     max: 5.4 Points
3DMark Vantage - 3DM Vant. Perf. CPU no Physx
4628 Points (4%)
min: 3751     avg: 4065     median: 4064.5 (4%)     max: 4378 Points

Average Benchmarks Intel Core 2 Duo T8300 → 100% n=8

Average Benchmarks Intel Core i5-520UM → 85% n=8

- Range of benchmark values for this graphics card
- Average benchmark values for this graphics card
* Smaller numbers mean a higher performance
1 This benchmark is not used for the average calculation

Add one or more devices and compare

In the following list you can select (and also search for) devices that should be added to the comparison. You can select more than one device.

restrict list:

show all (including archived), 2024, 2023
v1.26
log 24. 00:09:30

#0 checking url part for id 379 +0s ... 0s

#1 checking url part for id 563 +0s ... 0s

#2 not redirecting to Ajax server +0s ... 0s

#3 did not recreate cache, as it is less than 5 days old! Created at Wed, 22 May 2024 05:37:27 +0200 +0.001s ... 0.001s

#4 composed specs +0.023s ... 0.024s

#5 did output specs +0s ... 0.024s

#6 getting avg benchmarks for device 379 +0.002s ... 0.027s

#7 got single benchmarks 379 +0.045s ... 0.072s

#8 getting avg benchmarks for device 563 +0.002s ... 0.074s

#9 got single benchmarks 563 +0.021s ... 0.095s

#10 got avg benchmarks for devices +0s ... 0.095s

#11 min, max, avg, median took s +0.072s ... 0.167s

#12 return log +0.024s ... 0.192s

Please share our article, every link counts!
> Expert Reviews and News on Laptops, Smartphones and Tech Innovations > Benchmarks / Tech > Processor Comparison - Head 2 Head
Redaktion, 2017-09- 8 (Update: 2023-07- 1)