Notebookcheck Logo

UNISOC T618 vs Apple A12 Bionic vs Qualcomm Snapdragon 670

UNISOC T618

► remove from comparison  T618

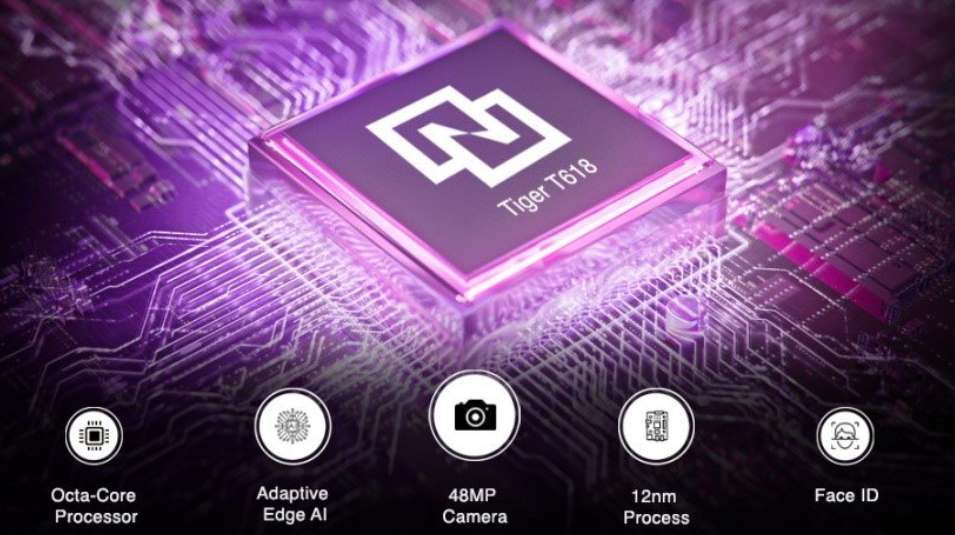
The Unisoc Tiger T618 (former Spreadtrum) is an entry level octa core SoC with two fast ARM Cortex A75 cores at up to 2 GHz and six power efficient ARM Cortex A55 cores at up to 2 GHz. The SoC furthermore includes an LTE modem (TDD-LTE, FDD-LTE, TDSCDMA, WCDMA, CDMA, GSM), a LPDDR3-933 / LPDDR4x-1866 memory controller and an ARM Mali G52MP2 GPU and a tri core ISP. The chip is manufactured at TSMC in 12nm FinFET. AI acceleration is handled by a visual digital signal processor (VDSP) clocked at up to 936 MHz.

Apple A12 Bionic

► remove from comparison Apple A12 Bionic

The Apple A12 Bionic is a System on a Chip (SoC) from Apple that is found in the iPhone Xs and Xr. It was announced late 2018 and offers 6 cores divided in 2 performance cores and four power efficiency cores. Compared to the previous A11 Bionic, the A12 should offer a 15% improved CPU performance for the performance cores and a 50% lower power consumption for the efficiency cores (both according to Apple).

The chip also includes a new GPU that is advertised as 50% faster, the M12 Motion co-processor and a Neural Engine with 8 cores for up to 5 trillion operations per second.

With 6.9 billion transistors, the A12 Bionic is a big chip especially compared to the Snapdragon 835 (3 Billion) or a Skylake desktop quad-core Soc (1.75 Billion). Compared to the A11, the A12 integrates 60% more transistors.

Qualcomm Snapdragon 670

► remove from comparison Qualcomm SD 670

The Qualcomm Snapdragon 670 (SD670) is a fast mid-range ARM-based SoC largely found on Android tablets and smartphones. Announced late 2018, the SD670 is the successor to the Snapdragon 660. It features 8 Kryo 360 cores (custom design, 64-Bit capable) that are divided in two clusters. A fast cluster of two cores with up to 2 GHz and a power saving efficiency cluster with up to 1.7 GHz. Both clusters can also used together.

In addition to the 8 CPU cores, the SoC integrates a mid range Adreno 616 GPU with a LPDDR4X-3733 memory controller (dual-channel 1867 MHz) and supports Wi-Fi (802.11ac + MIMO, max. 867 Mbps), Bluetooth 5, and LTE (X12 LTE modem with up to 600 Mbps download and 150 Mbps upload).

Performance

In Benchmarks the Snapdragon 670 is slightly faster than the old Snapdragon 660 and therefore a solid mid-range processor.

CPU

The Snapdragon 660 is based on a similar concept as ARM's big.LITTLE, which combines a low power CPU cluster (2x Kyro clocked at up to 1.8 GHz) and a performance CPU cluster (2x Kyro clocked at up to 2.2 GHz). The clock speed of each cluster can be individually adjusted (but not per core) and the lowest clock speed is 310 MHz (unverified).

Power Consumption

Thanks to the new 10 nm LPP process at Samsung, the energy efficiency has been improved noticeably compared to its 14 nm predecessors.

ModelUNISOC T618Apple A12 BionicQualcomm Snapdragon 670
Series Apple Apple A-SeriesQualcomm Snapdragon
CodenameCortex-A75 / A55Kryo 360 Gold / Silver
Series: Apple A-Series
UNISOC T6191.8 - 2.2 GHz8 / 8 cores1 MB L3 Cortex-A75 / A55
UNISOC T618 « 2 - 2 GHz8 / 8 cores1 MB L3 Cortex-A75 / A55
UNISOC T6161.8 - 2 GHz8 / 8 cores1 MB L3 Cortex-A75 / A55
UNISOC T6121.8 - 2 GHz8 / 8 cores1 MB L3 Cortex-A75 / A55
UNISOC T6101.8 - 2 GHz8 / 8 cores1 MB L3 Cortex-A75 / A55
UNISOC T6061.6 GHz8 / 8 cores1 MB L3 Cortex-A75 / A55
UNISOC Tangula T7001.8 - 1.8 GHz8 / 8 cores Cortex-A75 / A55
Apple A15 Bionic2.02 - 3.23 GHz6 / 6 cores32 MB L3
Apple A12 Bionic « - 2.49 GHz6 / 6 cores
Clock2000 - 2000 MHz <=2490 MHz2016 MHz
L3 Cache1 MB
Cores / Threads8 / 86 / 68 / 8
Technology12 nm7 nm10 nm
FeaturesARM Mali G52 MP2, Vivimagic 5.0 Tri-Core-ISP, LTE / 4G Modem, VDSPARMv8 Instruction SetAdreno 616 GPU, X12 LTE Modem, Hexagon 685 DSP, Specra ISP
iGPUARM Mali-G52 MP2 (850 MHz)Apple A12 Bionic GPUQualcomm Adreno 616
ArchitectureARMARMARM
Announced
L1 Cache256 KB
L2 Cache8 MB
Transistors6900 Million
Manufacturerwww.qualcomm.com

Benchmarks

Performance Rating - Geekbench 5.5, PCM Work, Sling Shot Physics, Antutu v8 CPU - T618
0.5 pt (37%)
Performance Rating - Geekbench 5.5, PCM Work, Sling Shot Physics, Antutu v8 CPU - SD 670
0.5 pt (37%)
3DMark - 3DMark Ice Storm Unlimited Physics
100%
T618 +
22763 Points (19%)
min: 27400     avg: 27548     median: 27547 (23%)     max: 27717 Points
min: 13055     avg: 15710     median: 15631 (13%)     max: 18523 Points
3DMark - 3DMark Sling Shot Extreme (ES 3.1) Unlimited Physics
100%
T618 +
min: 2526     avg: 2954     median: 3004.5 (35%)     max: 3202 Points
min: 2424     avg: 2584     median: 2573.5 (30%)     max: 2763 Points
3DMark - 3DMark Sling Shot (ES 3.0) Unlimited Physics
100%
T618 +
min: 2611     avg: 2910     median: 2961 (34%)     max: 3148 Points
min: 2413     avg: 2562     median: 2532.5 (29%)     max: 2771 Points
Geekbench 5.5 - Geekbench 5.1 - 5.4 64 Bit Single-Core
100%
T618 +
min: 365     avg: 380.2     median: 382 (16%)     max: 393 Points
min: 1116     avg: 1118     median: 1117.5 (47%)     max: 1119 Points
min: 333     avg: 344     median: 349 (15%)     max: 350 Points
Geekbench 5.5 - Geekbench 5.1 - 5.4 64 Bit Multi-Core
100%
T618 +
min: 1229     avg: 1332     median: 1325.5 (2%)     max: 1461 Points
min: 2772     avg: 2815     median: 2814.5 (5%)     max: 2857 Points
min: 1331     avg: 1368     median: 1343 (2%)     max: 1429 Points
Geekbench 5.0 - Geekbench 5.0 64 Bit Single-Core
1118 Points (5%)
31%
1 SD 670 +
344 Points (1%)
Geekbench 5.0 - Geekbench 5.0 64 Bit Multi-Core
2910 Points (9%)
45%
1 SD 670 +
1322 Points (4%)
Geekbench 4.4 - Geekbench 4.1 - 4.4 64 Bit Single-Core
100%
T618 +
1911 Points (19%)
min: 4750     avg: 4779     median: 4774 (48%)     max: 4824 Points
min: 1616     avg: 1651     median: 1624 (16%)     max: 1712 Points
Geekbench 4.4 - Geekbench 4.1 - 4.4 64 Bit Multi-Core
100%
T618 +
5744 Points (6%)
min: 11244     avg: 11418     median: 11480 (13%)     max: 11598 Points
min: 5164     avg: 5359     median: 5172 (6%)     max: 5742 Points
Geekbench 4.0 - Geekbench 4.0 64 Bit Single-Core
100%
1 SD 670 +
min: 1641     avg: 1671     median: 1671 (23%)     max: 1701 Points
Geekbench 4.0 - Geekbench 4.0 64 Bit Multi-Core
100%
1 SD 670 +
min: 5059     avg: 5409     median: 5409 (13%)     max: 5759 Points
Geekbench 3 - Geekbench 3 64 Bit Multi-Core
100%
1 SD 670 +
min: 4883     avg: 5255     median: 5254.5 (8%)     max: 5626 Points
Geekbench 3 - Geekbench 3 64 Bit Single-Core
100%
1 SD 670 +
min: 1625     avg: 1699     median: 1698.5 (25%)     max: 1772 Points
Geekbench 2 - 32 Bit - Geekbench Stream
100%
1 SD 670 +
min: 2711     avg: 2860     median: 2860 (23%)     max: 3009 Points
Geekbench 2 - 32 Bit - Geekbench Memory
100%
1 SD 670 +
min: 2336     avg: 2974     median: 2974 (27%)     max: 3612 Points
Geekbench 2 - 32 Bit - Geekbench Floating Point
100%
1 SD 670 +
min: 10750     avg: 10965     median: 10965 (21%)     max: 11180 Points
Geekbench 2 - 32 Bit - Geekbench Integer
100%
1 SD 670 +
min: 4873     avg: 4998     median: 4997.5 (10%)     max: 5122 Points
Geekbench 2 - 32 Bit - Geekbench Total Score
100%
1 SD 670 +
min: 6461     avg: 6467     median: 6467 (17%)     max: 6473 Points
Mozilla Kraken 1.1 - Kraken 1.1 Total Score *
100%
T618 +
min: 2762     avg: 2962     median: 2874.2 (3%)     max: 3432 ms
min: 603     avg: 627     median: 626.5 (1%)     max: 653 ms
min: 3361     avg: 3525     median: 3542.5 (4%)     max: 3655 ms
Octane V2 - Octane V2 Total Score
100%
T618 +
min: 10787     avg: 12599     median: 12356.5 (11%)     max: 14722 Points
min: 41367     avg: 42312     median: 42333.5 (38%)     max: 43280 Points
min: 10245     avg: 10864     median: 10950 (10%)     max: 11312 Points
WebXPRT 4 - WebXPRT 4 Score
100%
1 T618 +
58 Points (17%)
WebXPRT 3 - WebXPRT 3 Score
100%
T618 +
min: 68     avg: 75.7     median: 74.5 (16%)     max: 93 Points
min: 155     avg: 159.5     median: 159.5 (33%)     max: 166 Points
min: 53     avg: 60.3     median: 62 (13%)     max: 66 Points
AnTuTu v6 - AnTuTu v6 Total Score
100%
1 SD 670 +
min: 122959     avg: 125140     median: 126219 (43%)     max: 126241 Points
AnTuTu v7 - AnTuTu v7 MEM
min: 7312     avg: 9998     median: 10135.5 (31%)     max: 12409 Points
112%
1 SD 670 +
min: 8358     avg: 10655     median: 11377 (35%)     max: 12229 Points
AnTuTu v7 - AnTuTu v7 UX
min: 59570     avg: 65177     median: 66701 (82%)     max: 67735 Points
62%
1 SD 670 +
min: 37937     avg: 40332     median: 41165 (51%)     max: 41893 Points
AnTuTu v7 - AnTuTu v7 GPU
min: 129473     avg: 147840     median: 151931 (47%)     max: 158023 Points
29%
1 SD 670 +
min: 44292     avg: 44371     median: 44354 (14%)     max: 44466 Points
AnTuTu v7 - AnTuTu v7 CPU
min: 106600     avg: 124761     median: 127986 (78%)     max: 136472 Points
48%
1 SD 670 +
min: 58993     avg: 61007     median: 61972 (38%)     max: 62055 Points
AnTuTu v7 - AnTuTu v7 Total Score
min: 302955     avg: 347775     median: 358800 (63%)     max: 370545 Points
44%
1 SD 670 +
min: 153450     avg: 156363     median: 156772 (28%)     max: 158868 Points
AnTuTu v8 - AnTuTu v8 UX
100%
T618 +
min: 38514     avg: 46604     median: 40597 (34%)     max: 60702 Points
min: 71574     avg: 71607     median: 71606.5 (60%)     max: 71639 Points
min: 37207     avg: 37562     median: 37561.5 (31%)     max: 37916 Points
AnTuTu v8 - AnTuTu v8 MEM
100%
T618 +
min: 31976     avg: 38448     median: 40494 (33%)     max: 42875 Points
min: 45962     avg: 56767     median: 56767 (46%)     max: 67572 Points
min: 34880     avg: 35785     median: 35785 (29%)     max: 36690 Points
AnTuTu v8 - AnTuTu v8 GPU
100%
T618 +
min: 32932     avg: 39187     median: 40289 (7%)     max: 44339 Points
min: 166588     avg: 170290     median: 170290 (31%)     max: 173992 Points
min: 48878     avg: 49010     median: 49010 (9%)     max: 49142 Points
AnTuTu v8 - AnTuTu v8 CPU
100%
T618 +
min: 62476     avg: 65538     median: 66592 (24%)     max: 67546 Points
min: 98561     avg: 122385     median: 122385 (44%)     max: 146209 Points
min: 67666     avg: 67716     median: 67715.5 (24%)     max: 67765 Points
AnTuTu v8 - AnTuTu v8 Total Score
100%
T618 +
min: 173051     avg: 189777     median: 192320 (19%)     max: 203961 Points
min: 411764     avg: 421049     median: 421048 (41%)     max: 430333 Points
min: 189340     avg: 190072     median: 190072 (18%)     max: 190804 Points
Antutu v9 - AnTuTu v9 Total Score
100%
1 T618 +
min: 201310     avg: 218309     median: 213115 (13%)     max: 240502 Points
549549 Points (33%)
Antutu v9 - AnTuTu v9 CPU
100%
1 T618 +
min: 67085     avg: 69141     median: 68306 (19%)     max: 72033 Points
129427 Points (35%)
PassMark PerformanceTest Mobile V1 - PerformanceTest Mobile V1 CPU Tests
min: 482773     avg: 486852     median: 486197 (64%)     max: 491585 Points
35%
1 SD 670 +
min: 169943     avg: 171622     median: 171622 (23%)     max: 173300 Points
PCMark for Android - PCM f. Android Storage 2.0 score
100%
1 T618 +
min: 9058     avg: 10105     median: 10105 (16%)     max: 11152 Points
PCMark for Android - PCM f. Android Work Score 3.0
100%
1 T618 +
min: 7404     avg: 7980     median: 8273 (38%)     max: 8414 Points
PCMark for Android - PCM f. Android Computer Vision
100%
1 T618 +
5739 Points (30%)
65%
1 SD 670 +
min: 3349     avg: 3641     median: 3758 (20%)     max: 3817 Points
PCMark for Android - PCM f. Android Storage
0 Points (0%)
100%
1 SD 670 +
min: 5708     avg: 9382     median: 11203 (24%)     max: 11236 Points
PCMark for Android - PCM f. Android Work Score 2.0
100%
1 T618 +
min: 82     avg: 3510     median: 3509.5 (23%)     max: 6937 Points
201%
1 SD 670 +
min: 6633     avg: 7024     median: 7037.5 (46%)     max: 7387 Points
PCMark for Android - PCM f. Android Work Score
100%
1 T618 +
12638 Points (63%)
69%
1 SD 670 +
min: 7988     avg: 8742     median: 8761.5 (44%)     max: 9458 Points
CrossMark - CrossMark Overall
100%
1 T618 +
min: 359     avg: 372.3     median: 372.5 (14%)     max: 385 Points
Power Consumption - Geekbench 5.5 Power Consumption 150cd *
100%
1 T618 +
min: 4.22     avg: 5.1     median: 5.1 (2%)     max: 6.22 Watt
Power Consumption - Idle Power Consumption 150cd 1min *
100%
1 T618 +
min: 1.179     avg: 1.9     median: 1.9 (2%)     max: 2.42 Watt

Average Benchmarks UNISOC T618 → 100% n=15

Average Benchmarks Apple A12 Bionic → 205% n=15

Average Benchmarks Qualcomm Snapdragon 670 → 92% n=15

- Range of benchmark values for this graphics card
- Average benchmark values for this graphics card
* Smaller numbers mean a higher performance
1 This benchmark is not used for the average calculation

v1.26
log 06. 17:13:35

#0 checking url part for id 12997 +0s ... 0s

#1 checking url part for id 10166 +0s ... 0s

#2 checking url part for id 11379 +0s ... 0s

#3 not redirecting to Ajax server +0s ... 0s

#4 did not recreate cache, as it is less than 5 days old! Created at Sat, 04 May 2024 05:40:37 +0200 +0.001s ... 0.001s

#5 composed specs +0.062s ... 0.063s

#6 did output specs +0s ... 0.063s

#7 getting avg benchmarks for device 12997 +0.015s ... 0.078s

#8 got single benchmarks 12997 +0.023s ... 0.101s

#9 getting avg benchmarks for device 10166 +0.003s ... 0.103s

#10 got single benchmarks 10166 +0.013s ... 0.116s

#11 getting avg benchmarks for device 11379 +0.011s ... 0.127s

#12 got single benchmarks 11379 +0.011s ... 0.138s

#13 got avg benchmarks for devices +0s ... 0.138s

#14 No cached benchmark found, getting uncached values +0.195s ... 0.332s

#15 min, max, avg, median took s +0.015s ... 0.347s

#16 return log +0s ... 0.347s

Please share our article, every link counts!
> Expert Reviews and News on Laptops, Smartphones and Tech Innovations > Benchmarks / Tech > Processor Comparison - Head 2 Head
Redaktion, 2017-09- 8 (Update: 2023-07- 1)