AMD Radeon Pro Vega 20 vs NVIDIA Quadro P5000 Max-Q
AMD Radeon Pro Vega 20 ► remove from comparison
The AMD Radeon Pro Vega 20 is a dedicated graphics card for laptops. It was introduced as an option to the 2018 MacBook Pro. The graphics card offers 20 CUs (1,280 shaders) and 4 GB HBM2 memory. The performance should be on a level with the Radeon RX Vega M GL (also 1,280 shaders) and therefore between a Nvidia GeForce GTX 1050 and 1050 Ti.
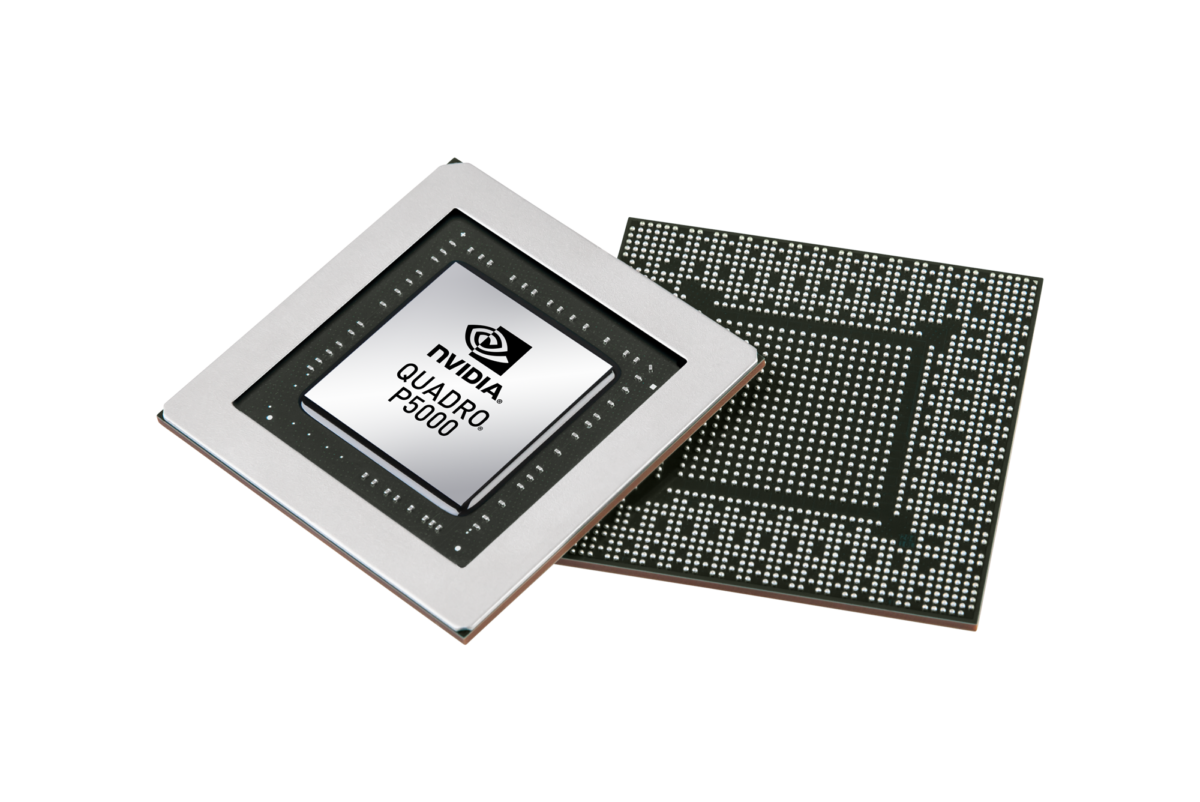
NVIDIA Quadro P5000 Max-Q ► remove from comparison
The Nvidia Quadro P5000 Max-Q (official Nvidia Quadro P5000 with Max-Q Design) is a mobile high-end workstation graphics card for notebooks. It is the power efficient variant of the normal Quadro P5000 for laptops and offers slightly reduced clock speeds (1101 - 1366 MHz versus 1164 - 1506 MHz) and a greatly reduced power consumption (80 versus 100 Watt TGP). Similar to the consumer GeForce GTX 1070 Max-Q (Laptop), it is based on a slimmed-down GP104 chip with 2048 shaders. The graphics card is designed for the Kaby Lake generation.
The Quadro GPUs offer certified drivers , which are optimized for stability and performance in professional applications (CAD, DCC, medical, prospection, and visualizing applications). The performance in these areas is therefore much better compared to corresponding consumer GPUs.
Performance
The theoretical performance should be slightly below the normal Quadro P4000 due to the reduced clock speeds.
Power Consumption
With an TGP of 80 Watt, the P5000 Max-Q is only slightly higher rated (5 Watt) as the much slower Quadro P3000 (75 Watt) and therefore similar sized laptops can use the P5000 Max-Q.
AMD Radeon Pro Vega 20 NVIDIA Quadro P5000 Max-Q Quadro P Series Codename Vega Mobile N17E-Q5 Max-Q Architecture Vega Pascal Pipelines 1280 - unified 2048 - unified Core Speed 815 - 1283 (Boost) MHz 1101 - 1366 (Boost) MHz Memory Type HBM2 GDDR5 Max. Amount of Memory 4 GB 16 GB Shared Memory no no technology 14 nm 16 nm Notebook Size large large Date of Announcement 15.11.2018 11.01.2017 Memory Speed 6006 MHz Memory Bus Width 256 Bit API DirectX 12_1, Shader 5.0, OpenGL 4.5 Power Consumption 100 Watt Features Optimus,
PhysX, 3D Vision Pro, nView, Optimus Link to Manufacturer Page www.nvidia.com
Benchmarks 3DMark - 3DMark Time Spy Score
min: 2732 avg: 2795 median: 2794.5 (8%) max: 2857 Points
3DMark - 3DMark Time Spy Graphics
min: 2568 avg: 2601 median: 2600.5 (7%) max: 2633 Points
3DMark - 3DMark Ice Storm Unlimited Graphics
278586 Points (32%)
3DMark - 3DMark Cloud Gate Score
21984 Points (24%)
3DMark - 3DMark Cloud Gate Graphics
62318 Points (16%)
3DMark - 3DMark Fire Strike Standard Score
min: 7015 avg: 7448 median: 7558 (13%) max: 7770 Points
3DMark - 3DMark Fire Strike Standard Graphics
min: 8979 avg: 9044 median: 9043.5 (10%) max: 9108 Points
3DMark 11 - 3DM11 Performance Score
min: 11353 avg: 11935 median: 11934.5 (17%) max: 12516 Points
3DMark 11 - 3DM11 Performance GPU
min: 12104 avg: 12289 median: 12289 (11%) max: 12474 Points
3DMark Vantage + AMD Radeon Pro Vega 20 3DMark Vantage - 3DM Vant. Perf. total
33590 Points (10%)
3DM Vant. Perf. GPU no PhysX + AMD Radeon Pro Vega 20 3DMark Vantage - 3DM Vant. Perf. GPU no PhysX
32473 Points (18%)
3DMark 06 3DMark 06 - Standard 1280x1024 + AMD Radeon Pro Vega 20
32864 Points (43%)
Unigine Valley 1.0 - Unigine Valley 1.0 DX
35.1 fps (12%)
SPECviewperf 12 + AMD Radeon Pro Vega 20 SPECviewperf 12 - specvp12 sw-03
70.7 fps (18%)
specvp12 snx-02 + AMD Radeon Pro Vega 20 SPECviewperf 12 - specvp12 snx-02
19.5 fps (3%)
specvp12 showcase-01 + AMD Radeon Pro Vega 20 SPECviewperf 12 - specvp12 showcase-01
44.6 fps (10%)
specvp12 mediacal-01 + AMD Radeon Pro Vega 20 SPECviewperf 12 - specvp12 mediacal-01
20.7 fps (5%)
specvp12 maya-04 + AMD Radeon Pro Vega 20 SPECviewperf 12 - specvp12 maya-04
60.6 fps (17%)
specvp12 energy-01 + AMD Radeon Pro Vega 20 SPECviewperf 12 - specvp12 energy-01
5.5 fps (5%)
specvp12 creo-01 + AMD Radeon Pro Vega 20 SPECviewperf 12 - specvp12 creo-01
49.2 fps (20%)
specvp12 catia-04 + AMD Radeon Pro Vega 20 SPECviewperf 12 - specvp12 catia-04
78.4 fps (13%)
SPECviewperf 13 specvp13 sw-04 + AMD Radeon Pro Vega 20 SPECviewperf 13 - specvp13 sw-04
min: 68.3 avg: 76.1 median: 76.1 (20%) max: 83.9 fps
specvp13 snx-03 + AMD Radeon Pro Vega 20 SPECviewperf 13 - specvp13 snx-03
min: 35.11 avg: 35.7 median: 35.7 (4%) max: 36.27 fps
specvp13 showcase-02 + AMD Radeon Pro Vega 20 SPECviewperf 13 - specvp13 showcase-02
min: 44.48 avg: 46.8 median: 46.8 (10%) max: 49.03 fps
specvp13 medical-02 + AMD Radeon Pro Vega 20 SPECviewperf 13 - specvp13 medical-02
min: 15.87 avg: 16.5 median: 16.5 (3%) max: 17.03 fps
specvp13 maya-05 + AMD Radeon Pro Vega 20 SPECviewperf 13 - specvp13 maya-05
min: 120.2 avg: 121.1 median: 121.1 (14%) max: 122 fps
specvp13 energy-02 + AMD Radeon Pro Vega 20 SPECviewperf 13 - specvp13 energy-02
min: 8.46 avg: 10.1 median: 10.1 (3%) max: 11.82 fps
specvp13 creo-02 + AMD Radeon Pro Vega 20 SPECviewperf 13 - specvp13 creo-02
min: 74.1 avg: 75.8 median: 75.8 (11%) max: 77.4 fps
specvp13 catia-05 + AMD Radeon Pro Vega 20 SPECviewperf 13 - specvp13 catia-05
min: 111 avg: 112.1 median: 112.1 (12%) max: 113.1 fps
specvp13 3dsmax-06 + AMD Radeon Pro Vega 20 SPECviewperf 13 - specvp13 3dsmax-06
min: 69.1 avg: 71.6 median: 71.6 (12%) max: 74.1 fps
Cinebench R10 Cinebench R10 Shading (32bit) + AMD Radeon Pro Vega 20 Cinebench R10 - Cinebench R10 Shading (32bit)
12230 Points (9%)
Cinebench R11.5 Cinebench R11.5 OpenGL 64 Bit + AMD Radeon Pro Vega 20 Cinebench R11.5 - Cinebench R11.5 OpenGL 64 Bit
96.1 fps (33%)
Cinebench R15 + AMD Radeon Pro Vega 20 Cinebench R15 - Cinebench R15 OpenGL 64 Bit
min: 124.8 avg: 129.5 median: 129.5 (8%) max: 134.2 fps
Cinebench R15 OpenGL Ref. Match 64 Bit + AMD Radeon Pro Vega 20 Cinebench R15 - Cinebench R15 OpenGL Ref. Match 64 Bit
min: 98 avg: 98.8 median: 98.8 (99%) max: 99.5 %
GFXBench - GFXBench 5.0 Aztec Ruins High Tier Offscreen
65.5 fps (12%)
GFXBench - GFXBench 5.0 Aztec Ruins Normal Tier Offscreen
167.1 fps (12%)
GFXBench - GFXBench Car Chase Offscreen
142.4 fps (16%)
GFXBench 3.1 - GFXBench Manhattan ES 3.1 Offscreen
117.8 fps (2%)
GFXBench 3.0 - GFXBench 3.0 Manhattan Offscreen
111.3 fps (7%)
GFXBench (DX / GLBenchmark) 2.7 + AMD Radeon Pro Vega 20 GFXBench (DX / GLBenchmark) 2.7 - GFXBench T-Rex HD Offscreen C24Z16
578 fps (5%)
LuxMark v2.0 64Bit - LuxMark v2.0 Room GPU
1091 Samples/s (5%)
LuxMark v2.0 64Bit - LuxMark v2.0 Sala GPU
2081 Samples/s (4%)
ComputeMark v2.1 - ComputeMark v2.1 Result
6431 Points (7%)
Average Benchmarks AMD Radeon Pro Vega 20 → 0% n=
- Range of benchmark values for this graphics card
- Average benchmark values for this graphics card
* Smaller numbers mean a higher performance
1 This benchmark is not used for the average calculation
Game Benchmarks The following benchmarks stem from our benchmarks of review laptops. The performance depends on the used graphics memory, clock rate, processor, system settings, drivers, and operating systems. So the results don't have to be representative for all laptops with this GPU. For detailed information on the benchmark results, click on the fps number.
100%
Radeon Pro Vega 20:
76.1 fps
100%
Radeon Pro Vega 20:
50.7 fps
100%
Radeon Pro Vega 20:
47.2 fps
100%
Radeon Pro Vega 20:
43.9 fps
100%
Radeon Pro Vega 20:
161.9 fps
100%
Radeon Pro Vega 20:
52.6 fps
100%
Radeon Pro Vega 20:
44.2 fps
100%
Radeon Pro Vega 20:
37.1 fps
100%
Radeon Pro Vega 20:
127.1 fps
100%
Radeon Pro Vega 20:
73.7 fps
100%
Radeon Pro Vega 20:
62.6 fps
100%
Radeon Pro Vega 20:
59.6 fps
100%
Radeon Pro Vega 20:
64.2 fps
100%
Radeon Pro Vega 20:
52.7 fps
100%
Radeon Pro Vega 20:
48.5 fps
100%
Radeon Pro Vega 20:
45.2 fps
100%
Radeon Pro Vega 20:
111 fps
100%
Radeon Pro Vega 20:
47 fps
100%
Radeon Pro Vega 20:
41 fps
100%
Radeon Pro Vega 20:
35 fps
100%
Radeon Pro Vega 20:
142 fps
100%
Radeon Pro Vega 20:
76 fps
100%
Radeon Pro Vega 20:
65 fps
100%
Radeon Pro Vega 20:
44 fps
100%
Radeon Pro Vega 20:
59 fps
100%
Radeon Pro Vega 20:
40 fps
100%
Radeon Pro Vega 20:
37 fps
100%
Radeon Pro Vega 20:
37 fps
100%
Radeon Pro Vega 20:
72.3 fps
100%
Radeon Pro Vega 20:
58 fps
100%
Radeon Pro Vega 20:
49.4 fps
100%
Radeon Pro Vega 20:
236.8 fps
100%
Radeon Pro Vega 20:
190.7 fps
100%
Radeon Pro Vega 20:
122.4 fps
100%
Radeon Pro Vega 20:
179.3 fps
100%
Radeon Pro Vega 20:
64.9 fps
100%
Radeon Pro Vega 20:
61.3 fps
100%
Radeon Pro Vega 20:
49.1 fps
100%
Radeon Pro Vega 20:
120.4 fps
100%
Radeon Pro Vega 20:
87.3 fps
100%
Radeon Pro Vega 20:
74.6 fps
100%
Radeon Pro Vega 20:
102 fps
100%
Radeon Pro Vega 20:
105 fps
100%
Radeon Pro Vega 20:
84.5 fps
100%
Radeon Pro Vega 20:
78.3 fps
100%
Radeon Pro Vega 20:
41.1 fps
100%
Radeon Pro Vega 20:
119 fps
100%
Radeon Pro Vega 20:
49.6 fps
100%
Radeon Pro Vega 20:
29.4 31.8 ~ 31 fps
Average Gaming AMD Radeon Pro Vega 20 → 100% Average Gaming 30-70 fps → 100%
AMD Radeon Pro Vega 20 low med. high ultra QHD 4K Just Cause 4 76.1 50.7 47.2 43.9 Darksiders III 161.9 52.6 44.2 37.1 Battlefield V 127.1 73.7 62.6 59.6 Hitman 2 64.2 52.7 48.5 45.2 Shadow of the Tomb Raider 111 47 41 35 F1 2018 142 76 65 44 Far Cry 5 59 40 37 37 X-Plane 11.11 72.3 58 49.4 Rocket League 236.8 190.7 122.4 For Honor 179.3 64.9 61.3 49.1 Rise of the Tomb Raider 120.4 87.3 74.6 Dota 2 Reborn 102 105 84.5 78.3 41.1 The Witcher 3 119 49.6 31 < 30 fps < 60 fps < 120 fps ≥ 120 fps 1 6 6 6 4 1 7 5 1 9 2 1
For more games that might be playable and a list of all games and graphics cards visit our Gaming List
v1.26
log 21. 15:44:13
#0 checking url part for id 9391 +0s ... 0s
#1 checking url part for id 8084 +0s ... 0s
#2 not redirecting to Ajax server +0s ... 0s
#3 did not recreate cache, as it is less than 5 days old! Created at Sun, 19 May 2024 05:37:06 +0200 +0.001s ... 0.001s
#4 composed specs +0.117s ... 0.118s
#5 did output specs +0s ... 0.118s
#6 start showIntegratedCPUs +0s ... 0.118s
#7 getting avg benchmarks for device 9391 +0.025s ... 0.143s
#8 got single benchmarks 9391 +0.011s ... 0.154s
#9 getting avg benchmarks for device 8084 +0.002s ... 0.156s
#10 got single benchmarks 8084 +0s ... 0.156s
#11 got avg benchmarks for devices +0s ... 0.156s
#12 min, max, avg, median took s +0.154s ... 0.31s
#13 before gaming benchmark output +0s ... 0.31s
#14 Got 50 rows for game benchmarks. +0.005s ... 0.315s
#15 composed SQL query for gamebenchmarks +0s ... 0.315s
#16 got data and put it in $dataArray +0.009s ... 0.324s
#17 benchmarks composed for output. +0.031s ... 0.354s
#18 calculated avg scores. +0s ... 0.354s
#19 return log +0.045s ... 0.4s
Please share our article, every link counts!
Redaktion, 2017-09- 8 (Update: 2023-07- 1)
 Deutsch
 English
 Español
 Français
 Italiano
 Nederlands
 Polski
 Português
 Русский
 Türkçe
 Svenska
 Chinese
 Magyar