Notebookcheck Logo

AMD Ryzen 3 3300X vs Intel Core i7-1068G7

AMD Ryzen 3 3300X

► remove from comparison AMD R3 3300X

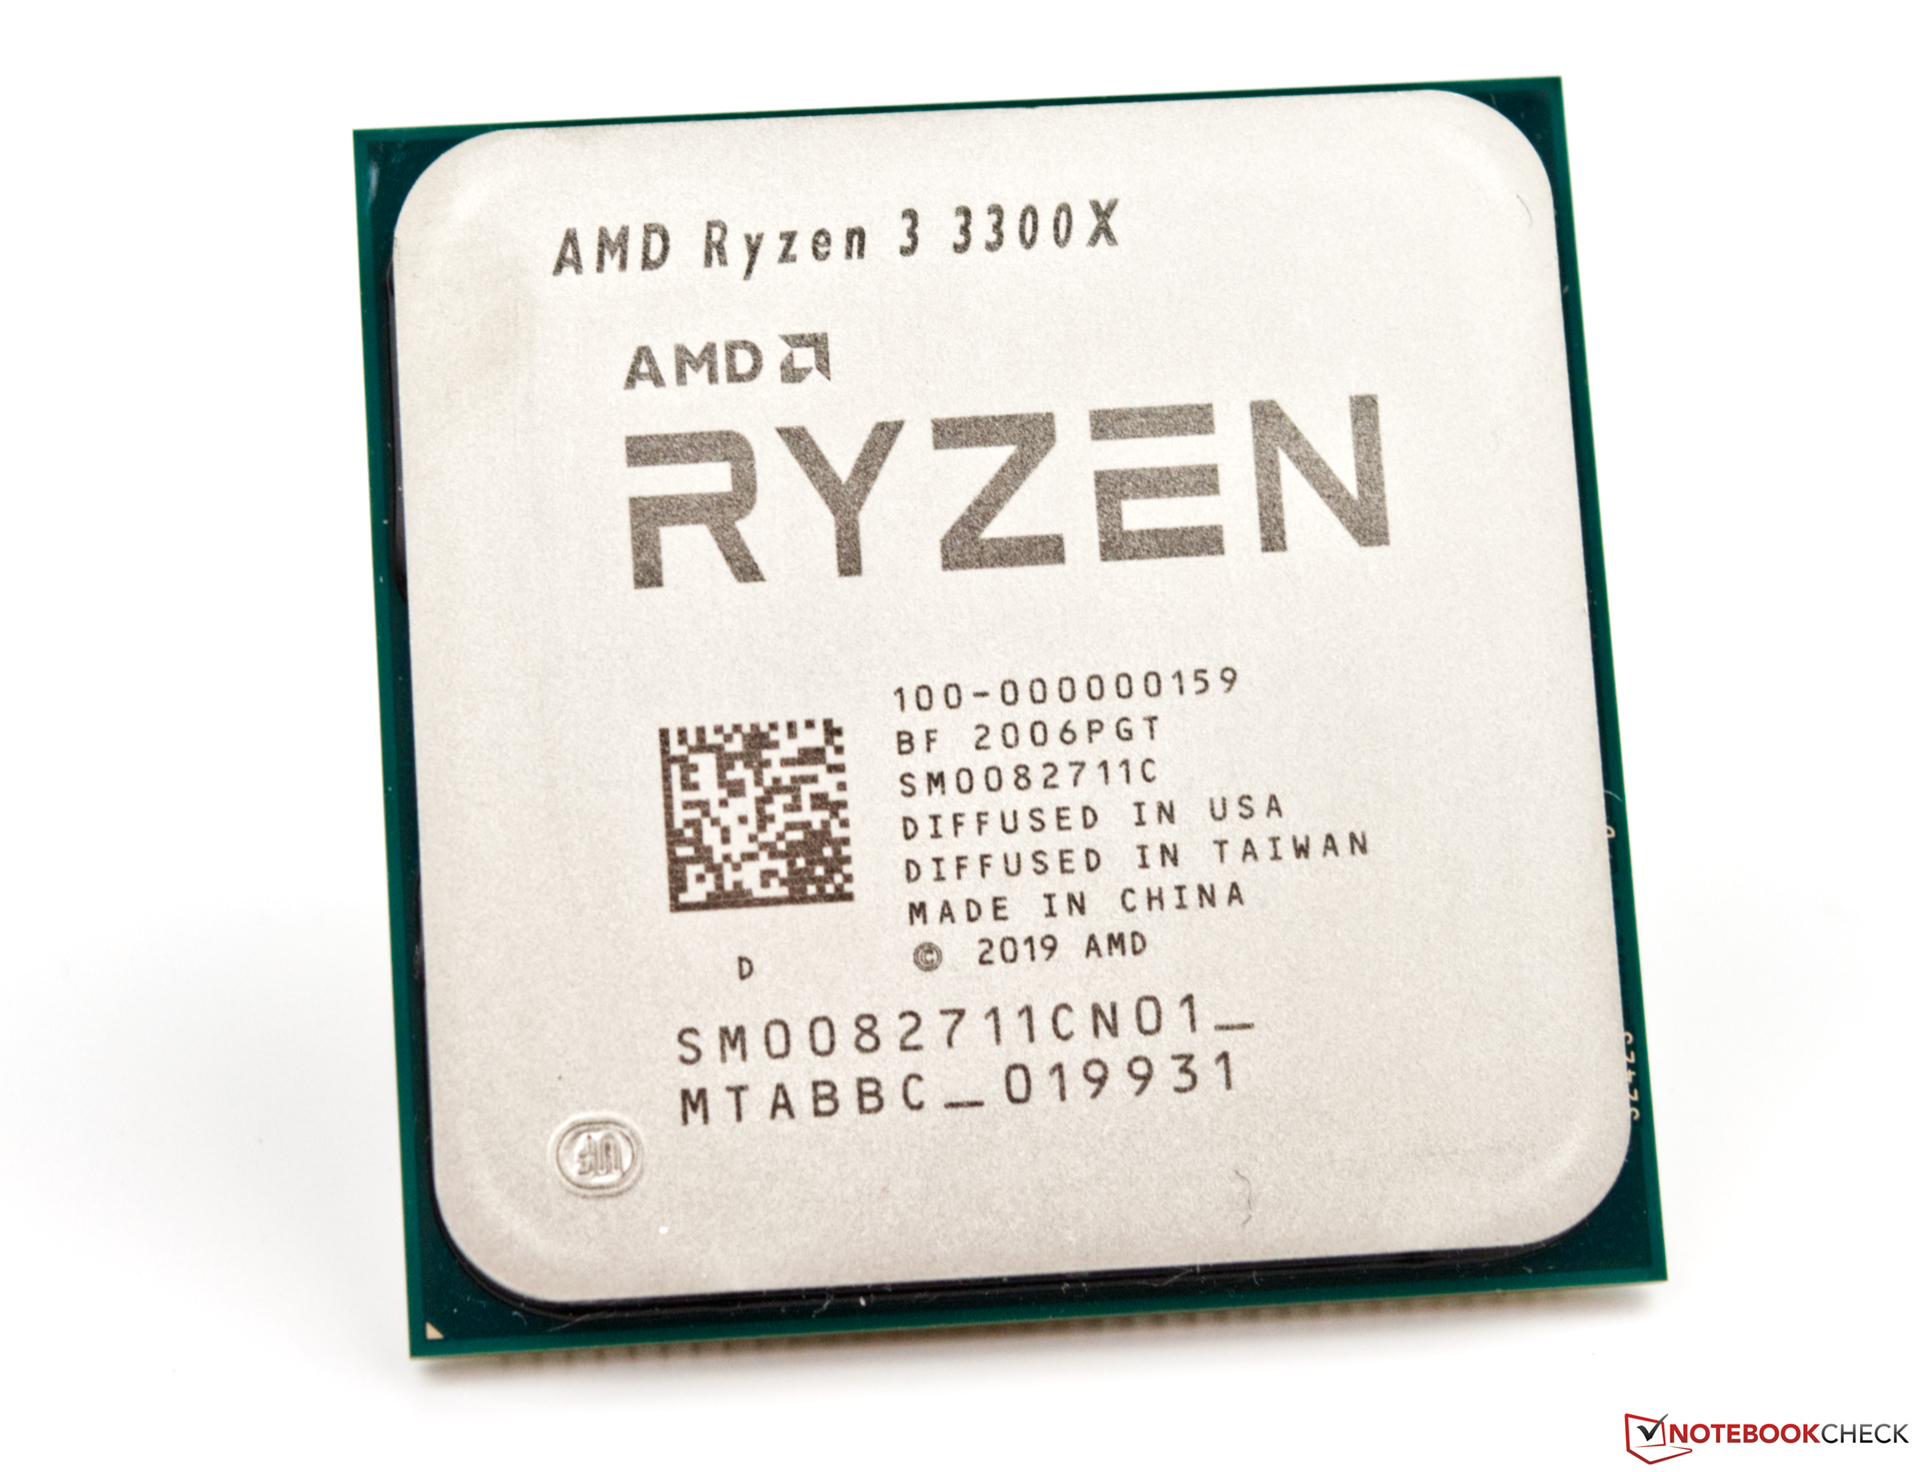
The Ryzen 3 3300X is a mid-range desktop processor of the Matisse series with 4 cores and 8 threads. It clocks from 3.8 (base) - 4.3 GHz (boost) and uses the Zen 2 microarchitecture. It uses all four cores in a single CCX-cluster, unlike the slower Ryzen 3 3100 which uses two clusters. The CPU is manufactured in the modern 7nm process at TSMC. The I/O die on the package is separate and manufactured in 12 nm at Globalfoundries. The TDP is specified at 65 Watt and therefore the CPU wont need a big beefy cooler.

Thanks to the high clock rates, the Ryzen 3300X is performing similar than the old Core i7-7700K (a former high end CPU) and therefore a good pick for entry level gaming systems.

Intel Core i7-1068G7

► remove from comparison Intel i7-1068G7

The Intel Core i7-1068G7 is a quad-core SoC for laptops and Ultrabooks based on the Ice-Lake-U generation that was announced in Mai 2019 (Computex). It integrates four Sunnycove processor cores (8 threads thanks to HyperThreading) clocked at 2.3 (base) - 4.1 (single core Turbo) GHz. All four cores can run at up to 3.6 GHz using Turbo Boost. According to Intel the Sunnycove cores achieve 18% more IPCs (Instructions per Clock) and therefore the CPU performance should be similar to the higher clocked Whiskey-Lake and Coffee-Lake predecessors (e.g. Core i7-8559U, 2.7 - 4.5 GHz). The Core i7-1068G7 is the fastest and only 28 Watt Ice Lake-U chip at the time of announcement in 2019.

The biggest improvement for Ice-Lake is the integrated Gen 11 graphics card called Iris Plus Graphics. The Core i7-1065G7 integrates the biggest G7 variant with 64 CUs clocked at 300 - 1100 MHz. The Iris Plus G7 should be twice as fast as the predecessors and best the AMD Vega 10 GPU in current Ryzen APUs.

Other improvements for Ice Lake are the AI hardware acceleration and the partial integration of Thunderbolt and Wifi 6 in the chip. The integrated DDR4 memory controller supports modules with up to 3200 MHz (and LPDDDR4 3733).

The Core i7-1068G7 is produced in the new  10nm process at Intel that should offer a comparable performance to the 7nm process at TSMC. The TDP is specified at 28 Watts and therefore the CPU is best used in small multimedia laptops from 13-inch upwards (e.g. like a MacBook Pro 13).

ModelAMD Ryzen 3 3300XIntel Core i7-1068G7
SeriesAMD Matisse (Ryzen 3000 Desktop)Intel Ice Lake
CodenameMatisse (Zen 2)Ice Lake U
Series: Ice Lake Ice Lake U
AMD Ryzen 9 3950X compare3.5 - 4.7 GHz16 / 32 cores64 MB L3
AMD Ryzen 9 3900X compare3.8 - 4.6 GHz12 / 24 cores64 MB L3
AMD Ryzen 9 3900 compare3.1 - 4.3 GHz12 / 24 cores64 MB L3
AMD Ryzen 7 3800XT compare3.9 - 4.7 GHz8 / 16 cores32 MB L3
AMD Ryzen 7 3700X compare3.6 - 4.4 GHz8 / 16 cores32 MB L3
AMD Ryzen 3 3300X « 3.8 - 4.3 GHz4 / 8 cores16 MB L3
AMD Ryzen 3 3100 compare3.6 - 3.9 GHz4 / 8 cores16 MB L3
Intel Core i7-1068G7 « 2.3 - 4.1 GHz4 / 8 cores8 MB L3
Intel Core i5-1034G1 compare0.8 - 3.6 GHz4 / 8 cores6 MB L3
Clock3800 - 4300 MHz2300 - 4100 MHz
L1 Cache256 KB192 KB
L2 Cache2 MB2 MB
L3 Cache16 MB8 MB
Cores / Threads4 / 84 / 8
TDP65 Watt28 Watt
Technology7 nm10 nm
SocketAM4 (1331)
FeaturesMMX(+), SSE, SSE2, SSE3, SSSE3, SSE4.1, SSE4.2, SSE4A, x86-64, AMD-V, AES, AVX, AVX2, FMA3, SHA, Precision Boost 2AVX512, DL Boost, Turbo Boost 2.0
Architecturex86x86
$120 U.S.
Announced
iGPUIntel Iris Plus Graphics G7 (Ice Lake 64 EU) (300 - 1100 MHz)

Benchmarks

Performance Rating - CB R15 + R20 + 7-Zip + X265 + Blender + 3DM11 CPU - R3 3300X
33.9 pt (47%)
Cinebench R20 - Cinebench R20 CPU (Single Core)
500 Points (56%)
Cinebench R20 - Cinebench R20 CPU (Multi Core)
2430 Points (6%)
Cinebench R15 - Cinebench R15 CPU Multi 64 Bit
1071 Points (7%)
Cinebench R15 - Cinebench R15 CPU Single 64 Bit
195 Points (59%)
Cinebench R11.5 - Cinebench R11.5 CPU Multi 64 Bit
11.8 Points (15%)
Cinebench R11.5 - Cinebench R11.5 CPU Single 64 Bit
2.3 Points (57%)
Cinebench R10 - Cinebench R10 Rend. Single (32bit)
5856 Points (35%)
Cinebench R10 - Cinebench R10 Rend. Multi (32bit)
25416 Points (18%)
Cinebench R10 - Cinebench R10 Rend. Multi (64bit)
40869 Points (28%)
Cinebench R10 - Cinebench R10 Rend. Single (64bit)
10250 Points (12%)
wPrime 2.10 - wPrime 2.0 1024m *
164.5 s (2%)
wPrime 2.10 - wPrime 2.0 32m *
6 s (1%)
WinRAR - WinRAR 4.0
7177 Points (11%)
7-Zip 18.03 - 7-Zip 18.03 Multli Thread 4 runs
30353 MIPS (17%)
7-Zip 18.03 - 7-Zip 18.03 Single Thread 4 runs
5329 MIPS (64%)
X264 HD Benchmark 4.0 - x264 Pass 2
61.8 fps (22%)
X264 HD Benchmark 4.0 - x264 Pass 1
233.5 fps (54%)
HWBOT x265 Benchmark v2.2 - HWBOT x265 4k Preset
8.3 fps (15%)
TrueCrypt - TrueCrypt Serpent
0.6 GB/s (0%)
TrueCrypt - TrueCrypt Twofish
1 GB/s (17%)
TrueCrypt - TrueCrypt AES
5.9 GB/s (15%)
Blender - Blender 2.79 BMW27 CPU *
449.4 Seconds (3%)
R Benchmark 2.5 - R Benchmark 2.5 *
0.5 sec (12%)
Super Pi mod 1.5 XS 1M - Super Pi mod 1.5 XS 1M *
9.5 s (2%)
Super Pi mod 1.5 XS 2M - Super Pi mod 1.5 XS 2M *
20.6 s (1%)
Super Pi Mod 1.5 XS 32M - Super Pi mod 1.5 XS 32M *
531 s (2%)
3DMark 11 - 3DM11 Performance Physics
12952 Points (35%)
3DMark - 3DMark Ice Storm Physics
75411 Points (61%)
3DMark - 3DMark Ice Storm Extreme Physics
75503 Points (61%)
3DMark - 3DMark Ice Storm Unlimited Physics
77142 Points (65%)
3DMark - 3DMark Cloud Gate Physics
10377 Points (26%)
3DMark - 3DMark Fire Strike Standard Physics
14632 Points (26%)
3DMark - 3DMark Time Spy CPU
5161 Points (22%)
Geekbench 5.5 - Geekbench 5.1 - 5.4 64 Bit Single-Core
1296 Points (55%)
1173 Points (49%)
Geekbench 5.5 - Geekbench 5.1 - 5.4 64 Bit Multi-Core
5311 Points (10%)
4449 Points (8%)
Geekbench 5.0 - Geekbench 5.0 64 Bit Single-Core
1299 Points (6%)
Geekbench 5.0 - Geekbench 5.0 64 Bit Multi-Core
5406 Points (17%)
Geekbench 4.4 - Geekbench 4.1 - 4.4 64 Bit Single-Core
5753 Points (57%)
Geekbench 4.4 - Geekbench 4.1 - 4.4 64 Bit Multi-Core
20529 Points (23%)
Mozilla Kraken 1.1 - Kraken 1.1 Total Score *
716 ms (1%)
WebXPRT 3 - WebXPRT 3 Score
233 Points (49%)
Power Consumption - Prime95 Power Consumption - external Monitor *
144.7 Watt (25%)
Power Consumption - Cinebench R15 Multi Power Consumption - external Monitor *
137.3 Watt (25%)
Power Consumption - Cinebench R15 Multi Power Efficiency - external Monitor
7.8 Points per Watt (6%)

Average Benchmarks AMD Ryzen 3 3300X → 100% n=2

Average Benchmarks Intel Core i7-1068G7 → 87% n=2

- Range of benchmark values for this graphics card
- Average benchmark values for this graphics card
* Smaller numbers mean a higher performance
1 This benchmark is not used for the average calculation

Add one or more devices and compare

In the following list you can select (and also search for) devices that should be added to the comparison. You can select more than one device.

restrict list:

show all (including archived), 2024, 2023
v1.27
log 16. 21:07:19

#0 checking url part for id 12167 +0s ... 0s

#1 checking url part for id 11444 +0s ... 0s

#2 not redirecting to Ajax server +0s ... 0s

#3 did not recreate cache, as it is less than 5 days old! Created at Sun, 16 Jun 2024 05:37:17 +0200 +0.001s ... 0.001s

#4 composed specs +0.021s ... 0.022s

#5 did output specs +0s ... 0.022s

#6 getting avg benchmarks for device 12167 +0.016s ... 0.038s

#7 got single benchmarks 12167 +0.008s ... 0.046s

#8 getting avg benchmarks for device 11444 +0.003s ... 0.049s

#9 got single benchmarks 11444 +0.005s ... 0.055s

#10 got avg benchmarks for devices +0s ... 0.055s

#11 min, max, avg, median took s +0.162s ... 0.216s

#12 return log +0.054s ... 0.27s

Please share our article, every link counts!
> Expert Reviews and News on Laptops, Smartphones and Tech Innovations > Benchmarks / Tech > Processor Comparison - Head 2 Head
Redaktion, 2017-09- 8 (Update: 2023-07- 1)