Notebookcheck Logo

Intel Pentium Gold 7505 vs AMD Athlon Silver 3050U

Intel Pentium Gold 7505

► remove from comparison

The Intel Pentium Gold 7505 is a power-efficient dual-core SoC for laptops and Ultrabooks based on the Tiger Lake-U generation that was announced in the third quarter of 2020. Unlike many other TGL-UP3 processors, the Pentium features an Infrastructure Processing Unit (Intel IPU). It integrates two Willow Cove processor cores (4 threads thanks to HyperThreading) clocked at 2 - 3.5 GHz (at 15 Watt TDP).

Another novelty is the integrated Xe graphics adapter based on the completely new Gen 12 architecture. It should offer a significantly higher performance compared to the older UHD Graphics G1 (Ice Lake).

Other improvements from Ice Lake are also integrated in Tiger Lake like the AI hardware acceleration and the partial integration of Thunderbolt and WiFi 6 in the chip.

Performance

The average 7505 in our database lags just slightly behind the N95, as far as multi-thread benchmark scores are concerned. In other words, this is an entry-level chip that's good enough for basic day-to-day activities only, as of late 2022.

Power consumption

This Pentium series chip has a default TDP (also known as the long-term power limit) of 15 W. Which is a tad too high to allow for passively cooled designs.

The Intel Pentium 7505 is built with Intel's 3rd generation 10 nm process marketed as SuperFin for low, as of mid 2023, energy efficiency.

AMD Athlon Silver 3050U

► remove from comparison AMD Athlon 3050U

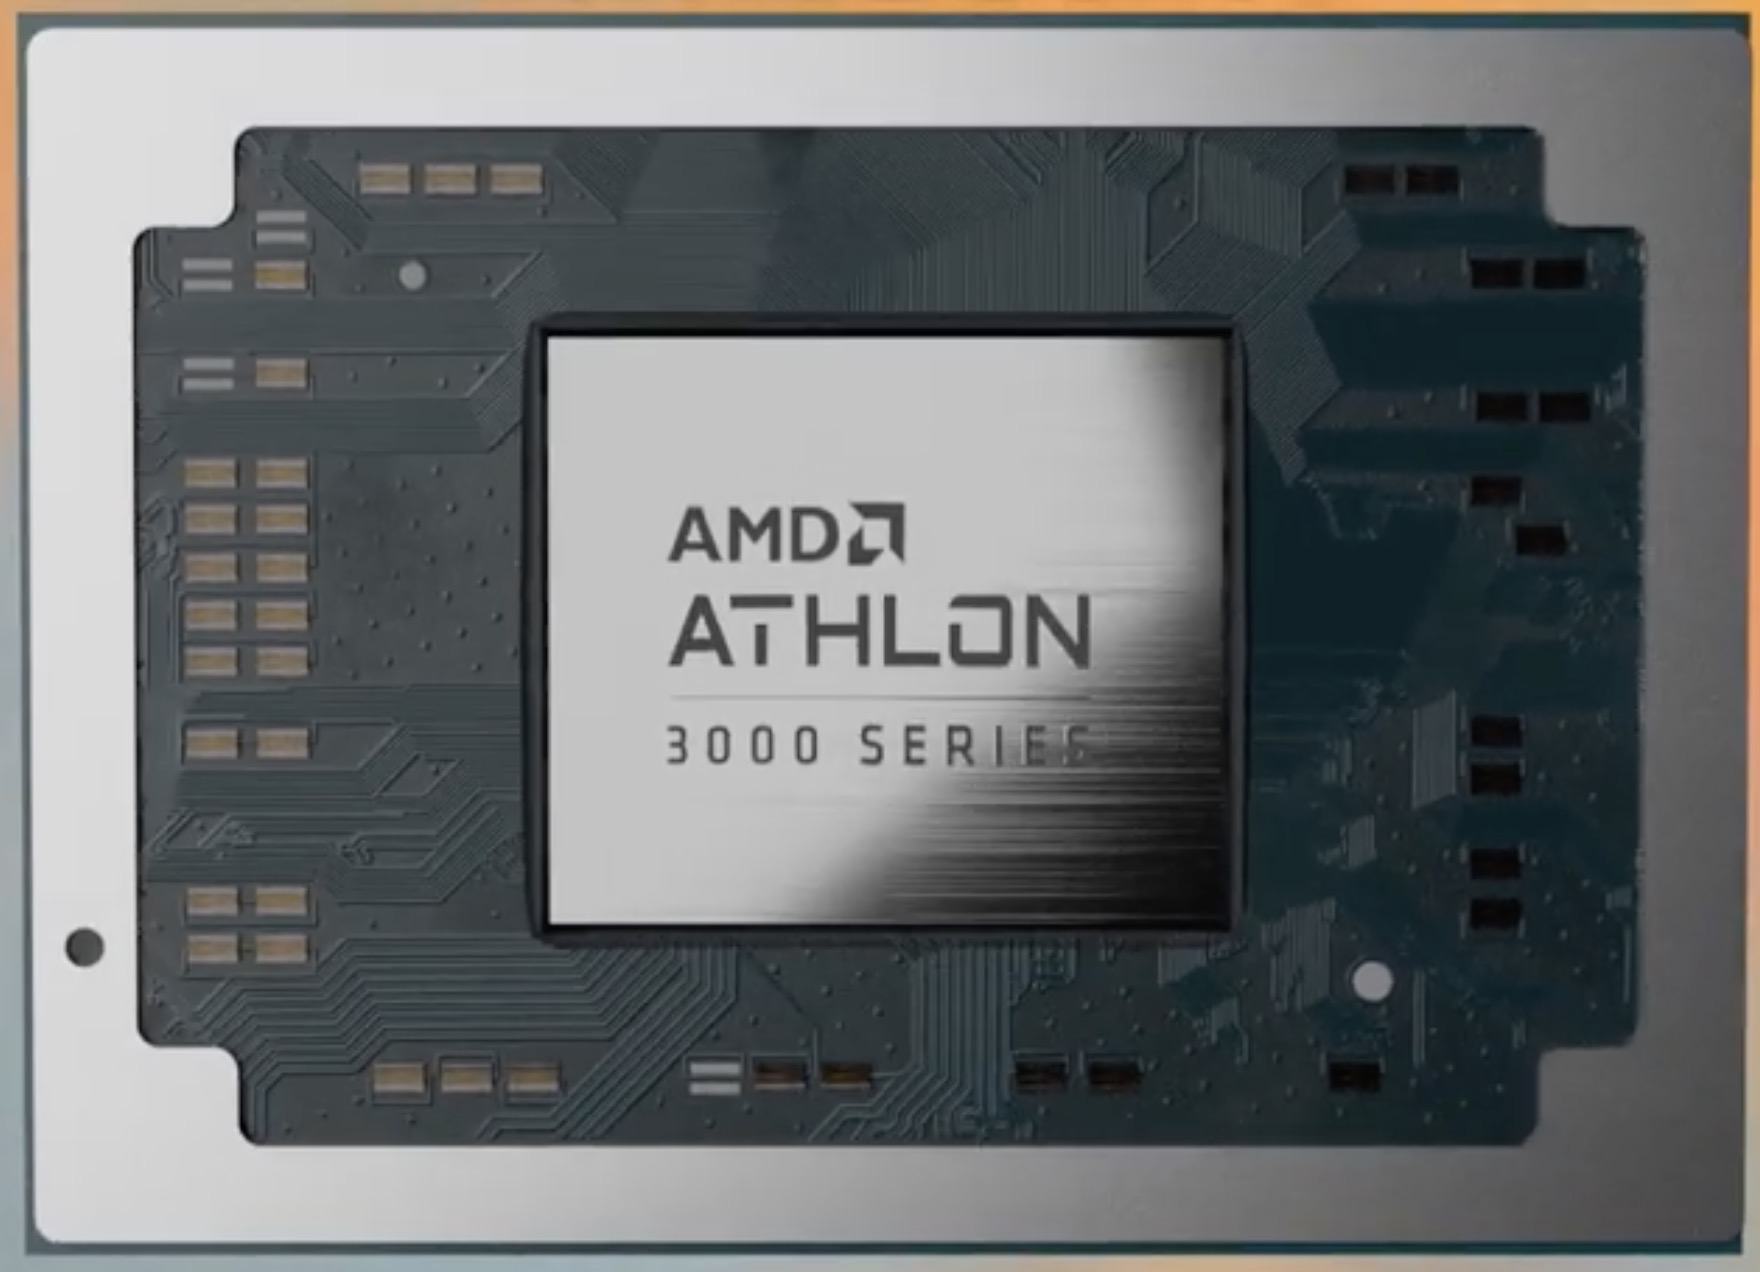
The AMD Athlon Silver 3050U is a mobile processor for thin and light entry level laptops. It is based on the Picasso series (e.g. Ryzen 3000U APUs) and offers two Zen cores clocked at 2.3 to 3.2 GHz without SMT (two threads at once) and 4 MB of L3 Cache. The integrated graphics card is called Radeon RX Vega 2 and offers only 2 CUs (128 shaders) clocked at up to 1,100 MHz.

In Chromebooks, AMD calles the APU AMD Athlon Silver 3050C, but with the exact same specifications (and performance).

Performance

We have not tested a single system built around the 3050U, as of August 2023. Expect the chip to be just a few percentage points slower than the Athlon 3150U (two Zen cores, 4 threads, up to 3.3 GHz). This kind of performance should suffice for most day-to-day tasks but not much more than that.

Power consumption

This Athlon series chip has a default TDP of 15 W (also known as the long-term power limit). Laptop makers are free to change that to anything between 12 W and 25 W with clock speeds and peformance changing accordingly as a result. Either way, that's a tad too high to allow for passively cooled designs.

Last but not the least, the APU is built with a 14 nm process leading to poor, as of early 2023, energy efficiency.

ModelIntel Pentium Gold 7505AMD Athlon Silver 3050U
SeriesIntel Tiger LakeAMD Picasso (Ryzen 3000 APU)
CodenameTiger Lake-UDali (Zen)
Series: Picasso (Ryzen 3000 APU) Dali (Zen)
Intel Celeron 6305 compare1.8 GHz2 / 2 cores4 MB L3
Intel Pentium Gold 7505 « 2 - 3.5 GHz2 / 4 cores4 MB L3
AMD Athlon Gold 3150U compare2.4 - 3.3 GHz2 / 4 cores4 MB L3
AMD Athlon Silver 3050U « 2.3 - 3.2 GHz2 / 2 cores4 MB L3
Clock2000 - 3500 MHz2300 - 3200 MHz
L1 Cache160 KB192 KB
L2 Cache2.5 MB1 MB
L3 Cache4 MB4 MB
Cores / Threads2 / 42 / 2
TDP15 Watt15 Watt
Technology10 nm14 nm
max. Temp.100 °C95 °C
SocketBGA1449FP5
FeaturesDDR4-3200/LPDDR4x-3733 RAM, PCIe 3, 4 GT/s bus, DL Boost, GNA, MMX, SSE, SSE2, SSE3, SSSE3, SSE4.1, SSE4.2, AVX, AVX2, AVX-512 [?], BMI2, ABM, FMA, ADX, VMX, SMEP, SMAP, EIST, TM1, TM2, HT, Turbo, SST, AES-NI, RDRAND, RDSEED, SHADDR4-2400 RAM, PCIe 3, MMX, SSE, SSE2, SSE3, SSSE3, SSE4A, SSE4.1, SSE4.2, AVX, AVX2, BMI2, ABM, FMA, ADX, SMEP, SMAP, CPB, AES-NI, RDRAND, RDSEED, SHA, SME
iGPUIntel UHD Graphics Xe G4 48EUs (400 - 1250 MHz)AMD Radeon RX Vega 2 ( - 1100 MHz)
Architecturex86x86
Announced
Manufacturerark.intel.comwww.amd.com
Transistors4500 Million

Benchmarks

Performance Rating - CB R15 + R20 + 7-Zip + X265 + Blender + 3DM11 CPU - Pentium 7505
27.7 pt (38%)
Cinebench R23 - Cinebench R23 Multi Core
min: 2594     avg: 2600     median: 2600 (2%)     max: 2606 Points
Cinebench R23 - Cinebench R23 Single Core
min: 1110     avg: 1113     median: 1112.5 (47%)     max: 1115 Points
Cinebench R20 - Cinebench R20 CPU (Single Core)
min: 428     avg: 429     median: 429 (48%)     max: 430 Points
Cinebench R20 - Cinebench R20 CPU (Multi Core)
1017 Points (2%)
Cinebench R15 - Cinebench R15 CPU Multi 64 Bit
min: 397     avg: 400     median: 400 (3%)     max: 403 Points
Cinebench R15 - Cinebench R15 CPU Single 64 Bit
min: 164.9     avg: 165     median: 165 (50%)     max: 165.1 Points
Cinebench R11.5 - Cinebench R11.5 CPU Multi 64 Bit
4.5 Points (6%)
Cinebench R11.5 - Cinebench R11.5 CPU Single 64 Bit
1.9 Points (48%)
Cinebench R10 - Cinebench R10 Rend. Single (32bit)
6773 Points (41%)
Cinebench R10 - Cinebench R10 Rend. Multi (32bit)
14093 Points (10%)
wPrime 2.10 - wPrime 2.0 1024m *
454.1 s (5%)
wPrime 2.10 - wPrime 2.0 32m *
14.5 s (3%)
WinRAR - WinRAR 4.0
2522 Points (4%)
7-Zip 18.03 - 7-Zip 18.03 Multli Thread 4 runs
min: 10347     avg: 10756     median: 10755.5 (6%)     max: 11164 MIPS
7-Zip 18.03 - 7-Zip 18.03 Single Thread 4 runs
min: 4032     avg: 4062     median: 4062 (49%)     max: 4092 MIPS
X264 HD Benchmark 4.0 - x264 Pass 2
24.9 fps (9%)
X264 HD Benchmark 4.0 - x264 Pass 1
131.1 fps (30%)
HWBOT x265 Benchmark v2.2 - HWBOT x265 4k Preset
min: 3.4     avg: 3.4     median: 3.4 (6%)     max: 3.46 fps
TrueCrypt - TrueCrypt Serpent
0.2 GB/s (0%)
TrueCrypt - TrueCrypt Twofish
0.3 GB/s (6%)
TrueCrypt - TrueCrypt AES
2.4 GB/s (6%)
Blender - Blender 3.3 Classroom CPU *
min: 2115     avg: 2130     median: 2129.5 (27%)     max: 2144 Seconds
Blender - Blender 2.79 BMW27 CPU *
min: 1142     avg: 1150     median: 1150 (8%)     max: 1158 Seconds
R Benchmark 2.5 - R Benchmark 2.5 *
min: 0.739     avg: 0.7     median: 0.7 (16%)     max: 0.75 sec
3DMark 06 - CPU - 3DMark 06 - CPU
4890 Points (10%)
Super Pi mod 1.5 XS 1M - Super Pi mod 1.5 XS 1M *
9.8 s (2%)
Super Pi mod 1.5 XS 2M - Super Pi mod 1.5 XS 2M *
22.1 s (1%)
Super Pi Mod 1.5 XS 32M - Super Pi mod 1.5 XS 32M *
523 s (2%)
3DMark 11 - 3DM11 Performance Physics
min: 5054     avg: 5285     median: 5285 (14%)     max: 5516 Points
3DMark - 3DMark Cloud Gate Physics
min: 4164     avg: 4223     median: 4222.5 (11%)     max: 4281 Points
3DMark - 3DMark Fire Strike Standard Physics
min: 6057     avg: 6200     median: 6199.5 (11%)     max: 6342 Points
3DMark - 3DMark Time Spy CPU
min: 2287     avg: 2326     median: 2325.5 (10%)     max: 2364 Points
Geekbench 5.5 - Geekbench 5.1 - 5.4 64 Bit Single-Core
min: 1093     avg: 1143     median: 1129 (48%)     max: 1206 Points
743 Points (31%)
Geekbench 5.5 - Geekbench 5.1 - 5.4 64 Bit Multi-Core
min: 2210     avg: 2332     median: 2326 (4%)     max: 2459 Points
1429 Points (3%)
Geekbench 5.0 - Geekbench 5.0 64 Bit Single-Core
min: 1126     avg: 1158     median: 1157.5 (5%)     max: 1189 Points
Geekbench 5.0 - Geekbench 5.0 64 Bit Multi-Core
min: 2181     avg: 2305     median: 2305 (7%)     max: 2429 Points
Geekbench 4.4 - Geekbench 4.1 - 4.4 64 Bit Single-Core
min: 4806     avg: 4999     median: 4998.5 (50%)     max: 5191 Points
Geekbench 4.4 - Geekbench 4.1 - 4.4 64 Bit Multi-Core
min: 8981     avg: 9426     median: 9426 (11%)     max: 9871 Points
Mozilla Kraken 1.1 - Kraken 1.1 Total Score *
min: 903     avg: 907     median: 906.5 (1%)     max: 910 ms
Sunspider - Sunspider 1.0 Total Score *
152.9 ms (2%)
Octane V2 - Octane V2 Total Score
49676 Points (45%)
WebXPRT 4 - WebXPRT 4 Score
min: 142.3     avg: 142.8     median: 142.8 (41%)     max: 143.3 Points
WebXPRT 3 - WebXPRT 3 Score
min: 181.4     avg: 184.4     median: 184.4 (38%)     max: 187.4 Points
CrossMark - CrossMark Overall
min: 853     avg: 878     median: 877.5 (34%)     max: 902 Points
Power Consumption - Prime95 Power Consumption - external Monitor *
23.6 Watt (4%)
Power Consumption - Cinebench R15 Multi Power Consumption - external Monitor *
23 Watt (4%)
Power Consumption - Idle Power Consumption - external Monitor *
3.8 Watt (3%)
Power Consumption - Idle Power Consumption 150cd 1min *
6.6 Watt (7%)
Power Consumption - Cinebench R15 Multi Power Efficiency - external Monitor
17.3 Points per Watt (13%)

Average Benchmarks Intel Pentium Gold 7505 → 100% n=2

Average Benchmarks AMD Athlon Silver 3050U → 64% n=2

- Range of benchmark values for this graphics card
- Average benchmark values for this graphics card
* Smaller numbers mean a higher performance
1 This benchmark is not used for the average calculation

Add one or more devices and compare

In the following list you can select (and also search for) devices that should be added to the comparison. You can select more than one device.

restrict list:

show all (including archived), 2024, 2023
v1.26
log 04. 12:56:19

#0 checking url part for id 12234 +0s ... 0s

#1 checking url part for id 11695 +0s ... 0s

#2 not redirecting to Ajax server +0s ... 0s

#3 did not recreate cache, as it is less than 5 days old! Created at Sat, 04 May 2024 05:40:37 +0200 +0.001s ... 0.001s

#4 composed specs +0.016s ... 0.017s

#5 did output specs +0s ... 0.017s

#6 getting avg benchmarks for device 12234 +0.022s ... 0.039s

#7 got single benchmarks 12234 +0.016s ... 0.055s

#8 getting avg benchmarks for device 11695 +0.003s ... 0.058s

#9 got single benchmarks 11695 +0.017s ... 0.074s

#10 got avg benchmarks for devices +0s ... 0.074s

#11 min, max, avg, median took s +0.146s ... 0.221s

#12 return log +0.026s ... 0.246s

Please share our article, every link counts!
> Expert Reviews and News on Laptops, Smartphones and Tech Innovations > Benchmarks / Tech > Processor Comparison - Head 2 Head
Redaktion, 2017-09- 8 (Update: 2023-07- 1)