

Samsung PM9C1a MZAL8512HDLU vs Samsung PM9C1 MZVL81T0HELB-00BTW
Samsung PM9C1a MZAL8512HDLU
► remove from comparison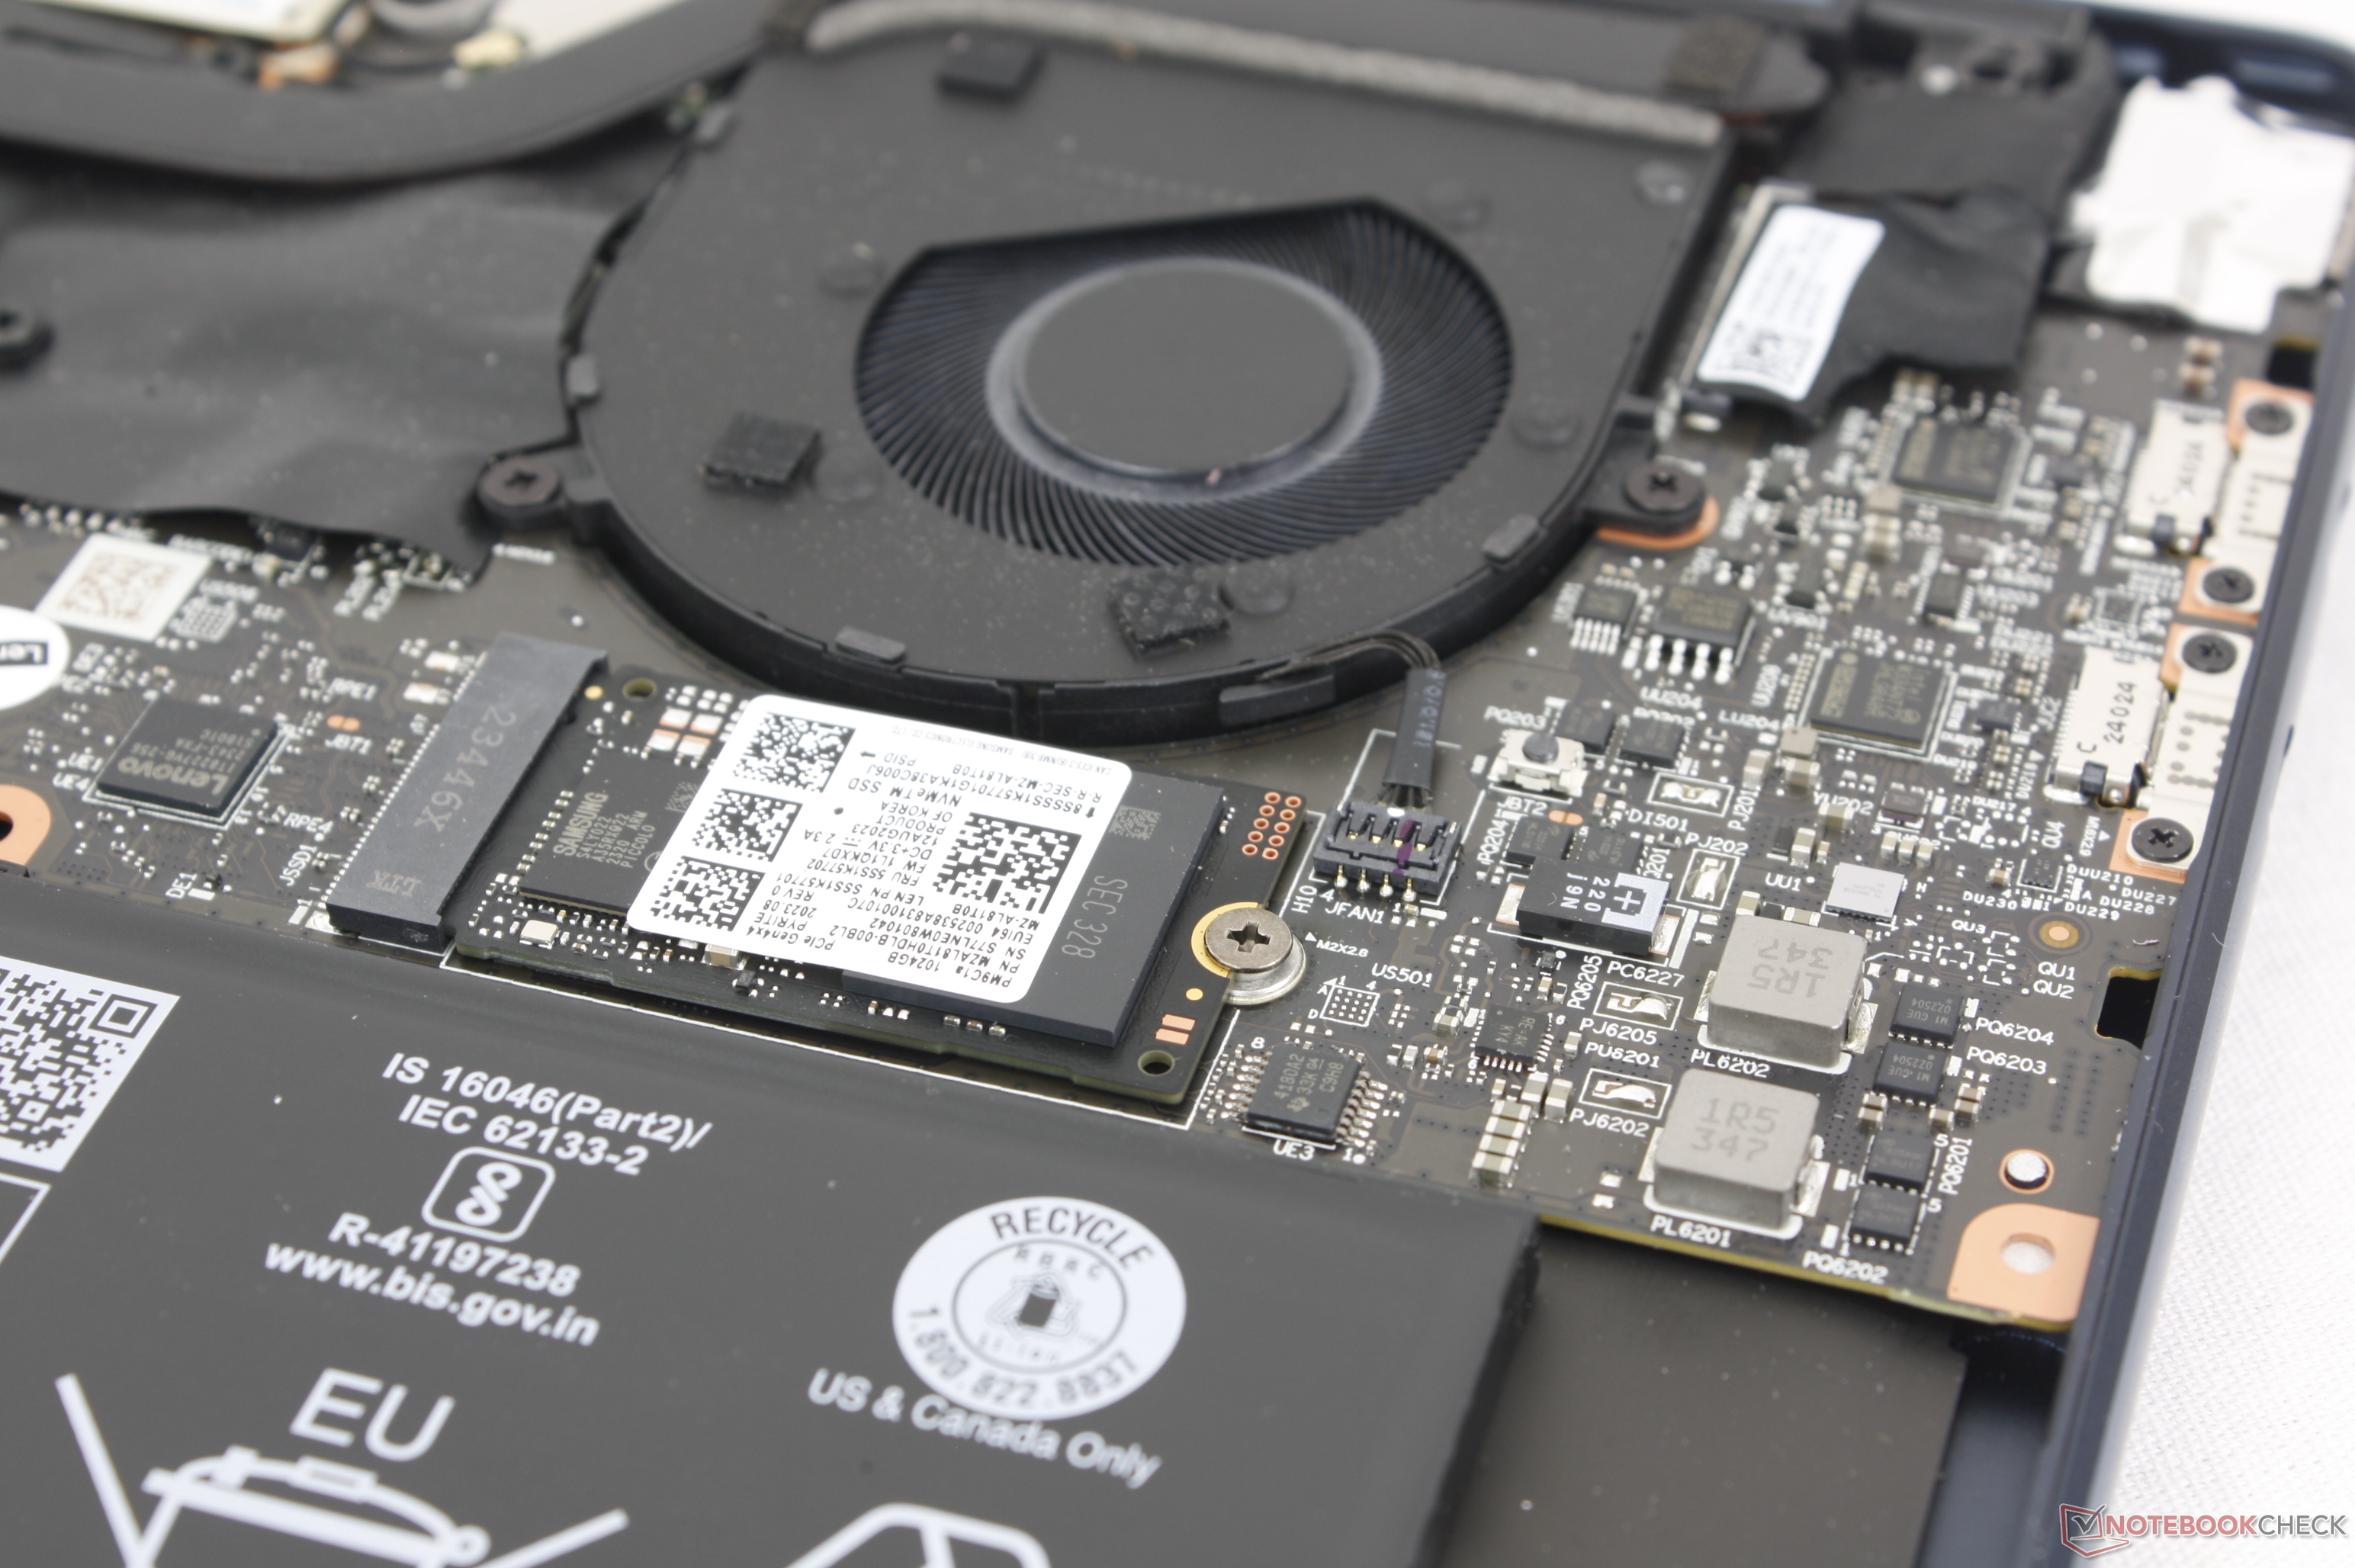
The Samsung PM9C1a MZAL81T0HDLB is a fast 1TB PCIe4 x4 SSD in the small M.2 2242 form factor. The PM9C1a is the successor to the PM9B1 OEM SSSD and advertised as a value drive with improved efficiency.
Samsung PM9C1 MZVL81T0HELB-00BTW
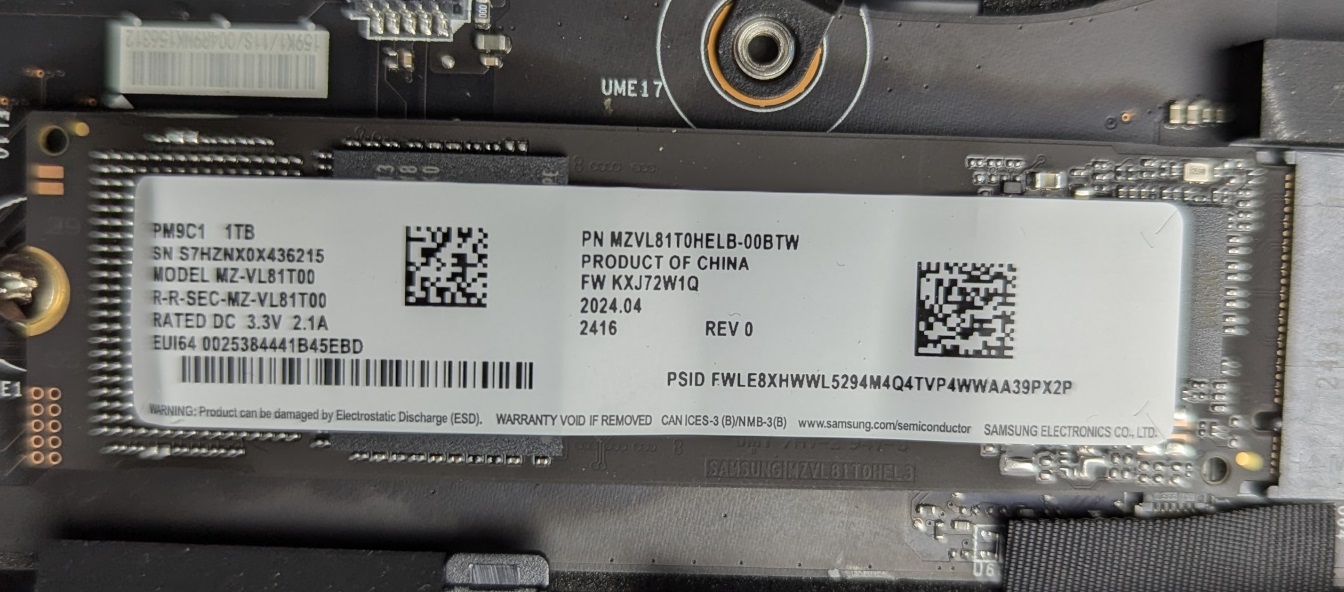
The Samsung PM9C1 MZVL81T0HELB-00BTW is a 1-terabyte PCIe 4 x4 NVMe SSD. It appears the 22 by 80 drive was quietly launched as far back as mid 2020.
Its performance in AS SSD (3.98 GB/s for sequential reads and 2.16 GB/s for writes) as well as other popular benchmark is serviceable but not really impressive, if our December 2024 testing is any indication.
| Samsung PM9C1a MZAL8512HDLU | Samsung PM9C1 MZVL81T0HELB-00BTW | |
| Type | SSD | SSD |
| Size | M.2 2242 | M.2 2280 |
| Capacity | 512 GB | 1024 GB |
| Interface | NVMe | NVMe |
| Announced | 09.04.2024 | 01.06.2020 |
| Link | Samsung PM9C1a MZAL8512HDLU |
Benchmarks
Performance Rating - DiskSpd - PM9C1a MZAL8512HDLU
27.1 pt (31%)
Seagate ST1000LM014 Solid State Hybrid Drive
...
Kingston OM8PGP42048N-A0
Rayson RS1D0TSSD710 1024 GB PCIe 4.0 NVMe
Kingston OM8SEP1024Q-A0
Rayson RS512GSSD710 512 GB PCIe 4.0 NVMe
Samsung PM9C1a MZAL8512HDLU
Micron 2550 1TB
2x Kingston OM8PGP4256Q-A0 (RAID 0)
Phison PS5019-E19 SSO1TBITC4-E19-V7
GOFATOO P110E-512GB
...
Kingston Fury Renegade G5
0%
100%
Performance Rating - DiskSpd - PM9C1 MZVL81T0HELB-00BTW
26 pt (30%)
Seagate ST1000LM014 Solid State Hybrid Drive
...
Micron 2550 512GB
Samsung PM9C1 MZVL81T0HELB-00BTW
Samsung SSD PM981 MZVLB2T0HMLB
Samsung SSD PM981 MZVLB1T0HALR
YMTC PC300-1TB
Intel SSD 760p SSDPEKKW010T8
Kingston OM8PGP42048N-A0
Rayson RS1D0TSSD710 1024 GB PCIe 4.0 NVMe
...
Kingston Fury Renegade G5
0%
100%
AS SSD - Copy Game
min: 1076.85 avg: 1347 median: 1136.1 (19%) max: 1827.64 MB/s
min: 1367.51 avg: 1638 median: 1600.6 (27%) max: 1944.97 MB/s
AS SSD - Copy Program
min: 354.37 avg: 509 median: 375.9 (14%) max: 797.12 MB/s
min: 775.41 avg: 837 median: 814.1 (30%) max: 920.43 MB/s
AS SSD - Copy ISO
min: 2282.75 avg: 2608 median: 2342.7 (21%) max: 3197.73 MB/s
min: 2271.5 avg: 2820 median: 2933.7 (27%) max: 3254.36 MB/s
AS SSD - Score Total
min: 3611 avg: 3963 median: 4099 (25%) max: 4180 Points
min: 3137 avg: 5190 median: 3617 (22%) max: 8735 Points
AS SSD - Score Write
min: 2040 avg: 2263 median: 2324 (32%) max: 2426 Points
min: 1772 avg: 2602 median: 2196 (30%) max: 4136 Points
AS SSD - Score Read
min: 1059 avg: 1161 median: 1211 (19%) max: 1213 Points
min: 951 avg: 1745 median: 1048 (17%) max: 3048 Points
AS SSD - Access Time Write *
min: 0.023 avg: 0.1 median: 0.1 (0%) max: 0.074 ms
min: 0.021 avg: 0 median: 0.1 (0%) max: 0.059 ms
AS SSD - Access Time Read *
min: 0.036 avg: 0.1 median: 0.1 (0%) max: 0.078 ms
min: 0.061 avg: 0.1 median: 0.1 (0%) max: 0.095 ms
AS SSD - 4K-64 Write
min: 1624.51 avg: 1819 median: 1822 (31%) max: 2010 MB/s
min: 1372 avg: 2094 median: 1766.4 (30%) max: 3345.54 MB/s
min: 498 avg: 1251 median: 640.6 (13%) max: 2384.85 MB/s
AS SSD - 4K Write
min: 151.12 avg: 172.9 median: 156.9 (31%) max: 210.74 MB/s
min: 184.1 avg: 198.4 median: 196.5 (38%) max: 214.74 MB/s
min: 55.8 avg: 62.7 median: 60 (19%) max: 69.81 MB/s
AS SSD - Sequential Write
min: 2595 avg: 2715 median: 2640.2 (23%) max: 2908.36 MB/s
min: 1843.96 avg: 3102 median: 2326.3 (21%) max: 5791.27 MB/s
AS SSD - Sequential Read
min: 3623.36 avg: 4208 median: 4488 (35%) max: 4512.58 MB/s
min: 3470.45 avg: 4307 median: 3989.4 (31%) max: 5933.7 MB/s
CrystalDiskMark 5.2 / 6 - CDM 5/6 Write 4K
min: 67.67 avg: 112.2 median: 118.5 (11%) max: 150.3 MB/s
min: 145.2 avg: 176.4 median: 153.5 (14%) max: 248.7 MB/s
CrystalDiskMark 5.2 / 6 - CDM 5/6 Read 4K
min: 65.55 avg: 70.4 median: 67.7 (2%) max: 77.99 MB/s
min: 58.2 avg: 66 median: 64.9 (2%) max: 76.17 MB/s
CrystalDiskMark 5.2 / 6 - CDM 5 Write Seq
min: 2398 avg: 2826 median: 2826 (15%) max: 3254 MB/s
min: 3094 avg: 3746 median: 3348.5 (18%) max: 5194 MB/s
CrystalDiskMark 5.2 / 6 - CDM 5 Read Seq
min: 3131 avg: 3198 median: 3198 (38%) max: 3265 MB/s
min: 3194 avg: 3478 median: 3443 (41%) max: 3832 MB/s
CrystalDiskMark 5.2 / 6 - CDM 5/6 Write 4K Q32T1
min: 182.2 avg: 311.4 median: 371 (12%) max: 381 MB/s
min: 378.8 avg: 442.7 median: 428 (14%) max: 537.8 MB/s
CrystalDiskMark 5.2 / 6 - CDM 5/6 Read 4K Q32T1
min: 341.2 avg: 395.1 median: 378 (6%) max: 466 MB/s
min: 423.6 avg: 532 median: 456 (7%) max: 689.1 MB/s
CrystalDiskMark 5.2 / 6 - CDM 5/6 Write Seq Q32T1
min: 2986 avg: 3510 median: 3649 (24%) max: 3896 MB/s
min: 3398 avg: 3983 median: 3471 (23%) max: 6008 MB/s
CrystalDiskMark 5.2 / 6 - CDM 5/6 Read Seq Q32T1
min: 5119 avg: 5464 median: 5189 (28%) max: 6085 MB/s
min: 5037 avg: 5483 median: 5060 (27%) max: 7200 MB/s
389 MB/s (8%)
613 MB/s (9%)
DiskSpd - DiskSpd 4k_q1t1_write
min: 63.6 avg: 112.7 median: 119.2 (27%) max: 155.3 MB/s
min: 131 avg: 163.5 median: 141.9 (33%) max: 253 MB/s

DiskSpd - DiskSpd 4k_q1t1_read
min: 62.6 avg: 66.2 median: 63 (18%) max: 73 MB/s
min: 52.7 avg: 60.1 median: 57.6 (17%) max: 75.1 MB/s
DiskSpd - DiskSpd 4k_q32t16_write
min: 305 avg: 362.7 median: 386 (6%) max: 397 MB/s
min: 309 avg: 1122 median: 365.5 (6%) max: 2693 MB/s
DiskSpd - DiskSpd 4k_q32t16_read
min: 599 avg: 658 median: 672 (8%) max: 703 MB/s
min: 529 avg: 1522 median: 580.5 (7%) max: 4074 MB/s
DiskSpd - DiskSpd seq_write
min: 2477 avg: 2958 median: 2983 (29%) max: 3414 MB/s
min: 2368 avg: 3239 median: 3132 (31%) max: 4484 MB/s
DiskSpd - DiskSpd seq_read
min: 2565 avg: 2834 median: 2688 (35%) max: 3250 MB/s
min: 2400 avg: 2982 median: 2963 (39%) max: 3670 MB/s
DiskSpd - DiskSpd seq_q8t1_write
min: 3736 avg: 4431 median: 4715 (32%) max: 4841 MB/s
min: 3358 avg: 3733 median: 3486.5 (24%) max: 4989 MB/s
DiskSpd - DiskSpd seq_q8t1_read
min: 6068 avg: 6095 median: 6100 (38%) max: 6118 MB/s
min: 4468 avg: 5298 median: 5039 (31%) max: 7187 MB/s
DiskSpd - DiskSpd Loop seq_q8t1_read
min: 4368 avg: 5506 median: 6049 (37%) max: 6101 MB/s
min: 3522 avg: 4955 median: 4924.5 (30%) max: 7132 MB/s
Average Benchmarks Samsung PM9C1a MZAL8512HDLU → 100% n=33
Average Benchmarks Samsung PM9C1 MZVL81T0HELB-00BTW → 104% n=33
- Range of benchmark values for this graphics card
 - Average benchmark values for this graphics card
* Smaller numbers mean a higher performance
1 This benchmark is not used for the average calculation
* Smaller numbers mean a higher performance
1 This benchmark is not used for the average calculation
v1.33