Mediatek MT6582 vs Intel Core i5-1145G7 vs Mediatek MT6580M
Mediatek MT6582 ► remove from comparison
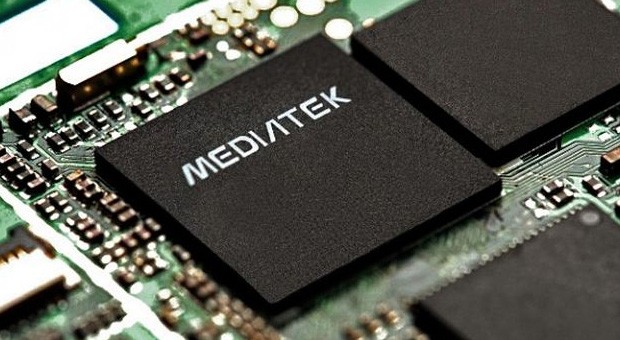
The Mediatek MT6582 is a system-on-a-chip (SoC) for low-cost tablets and smartphones. It is manufactured in 28 nm and offers a quad-core Cortex-A7 processor as well as an ARM Mali-400 MP2 GPU clocked at 500 MHz (according to Wikipedia the main difference to the MT6582M that is clocked at 416 MHz). Furthermore, the chip supports dual SIM, UMTS and HSPA+, WiFi, FM, Bluetooth and GPS.
The CPU performance of the MT6582 is similar to other Cortex-A7 SoCs clocked at the same frequency. Depending on the benchmark, the CPU power is roughly comparable with the Nvidia Tegra 3 and sufficient for everyday applications such as browsing. The GPU will handle only simple Android games in moderate resolutions.
Intel Core i5-1145G7 ► remove from comparison
The Intel Core i5-1145G7 is a power efficient quad-core SoC for laptops and Ultrabooks based on the Tiger Lake-U generation that was announced early 2021. It integrates four Willow Cove processor cores (8 threads thanks to HyperThreading). The base clock speed depends on the TDP settings and ranges from 1.1 GHz (12 Watt TDP) up to 2.6 GHz (28 Watt). The Boost is always specified at 4.4 GHz (one or two cores).
Another novelty is the integrated Xe graphics card with 80 EUs based on the completely new Gen 12 architecture. It offers a significantly higher performance compared to the older Iris Plus G7 (Ice Lake).
Furthermore, Tiger Lake SoCs add PCIe 4 support (4 lanes), AI hardware acceleration, and the partial integration of Thunderbolt 4 / USB 4 and Wifi 6 in the chip. In addition to this, the i5 supports vPro for easy remote management.
The chip is produced on the improved 10nm SuperFin process at Intel that should be comparable to the 7nm process at TSMC (e.g. Ryzen 4000 series).
All articles on Tiger Lake can be found on our Tiger Lake architecture hub .
Mediatek MT6580M ► remove from comparison
The Mediatek MT6580M is a system-on-a-chip (SoC) for low-cost tablets and smartphones. It is manufactured in 28 nm and offers a quad-core Cortex-A7 processor (max 1.3 GHz) as well as an ARM Mali-400 MP2 GPU (MP2 unconfirmed, but the similar MT6582 has a MP2 clocked at 416 MHz). Furthermore, the chip supports dual SIM, UMTS and HSPA+, WiFi, FM, Bluetooth and GPS.
The CPU performance of the MT6580M is similar to other Cortex-A7 SoCs clocked at the same frequency. Depending on the benchmark, the CPU power is roughly comparable with the Nvidia Tegra 3 and sufficient for everyday applications such as browsing. The GPU will handle only simple Android games in moderate resolutions.
Model Mediatek MT6582 Intel Core i5-1145G7 Mediatek MT6580M Series Mediatek Intel Tiger Lake Mediatek Codename Cortex-A7 Tiger Lake-UP3 Cortex-A7 Series: Mediatek Cortex-A7 Clock 1300 MHz 2600 - 4400 MHz 1300 MHz L1 Cache 128 KB 320 KB 128 KB L2 Cache 512 KB 5 MB 512 KB Cores / Threads 4 / 4 4 / 8 4 / 4 Technology 28 nm 10 nm 28 nm Features Mali-400 MP2 @ 500 MHz, HSPA+, TD-SCDMA, Wi-Fi, Bluetooth, GPS, FM DDR4-3200/LPDDR4x-4266 RAM, PCIe 4, 4 GT/s bus, DL Boost, GNA, vPro, MMX, SSE, SSE2, SSE3, SSSE3, SSE4.1, SSE4.2, AVX, AVX2, AVX-512, BMI2, ABM, FMA, ADX, VMX, SMX, SMEP, SMAP, EIST, TM1, TM2, HT, Turbo, SST, AES-NI, RDRAND, RDSEED, SHA, TME Mali-400 MP2 @ 416 MHz, HSPA+, TD-SCDMA, Wi-Fi, Bluetooth, GPS, FM iGPU ARM Mali-400 MP2 (500 MHz)Intel Iris Xe Graphics G7 80EUs (400 - 1300 MHz)ARM Mali-400 MP2 (416 MHz)Architecture ARM x86 ARM Announced Manufacturer www.mediatek.com ark.intel.com www.mediatek.com L3 Cache 8 MB TDP 28 Watt max. Temp. 100 °C Socket BGA1449
Benchmarks Performance Rating - CB R15 + R20 + 7-Zip + X265 + Blender + 3DM11 CPU - i5-1145G7
32.8 pt (45%)
max:
Cinebench R23 - Cinebench R23 Multi Core
min: 4769 avg: 4880 median: 4880 (5%) max: 4991 Points
CPU TDP 14 W TDP 28 W 96% 100%
Cinebench R23 - Cinebench R23 Single Core
min: 1361 avg: 1375 median: 1374.5 (58%) max: 1388 Points
CPU TDP 14 W TDP 28 W 100% 98%
Cinebench R20 - Cinebench R20 CPU (Single Core)
531 Points (59%)
CPU TDP 14 W TDP 28 W 100% 100%
Cinebench R20 - Cinebench R20 CPU (Multi Core)
min: 1693 avg: 1842 median: 1841.5 (4%) max: 1990 Points
CPU TDP 14 W TDP 28 W 85% 100%
Cinebench R15 - Cinebench R15 CPU Multi 64 Bit
min: 791 avg: 792 median: 791.5 (5%) max: 792 Points
CPU TDP 14 W TDP 28 W 100% 100%
Cinebench R15 - Cinebench R15 CPU Single 64 Bit
min: 202 avg: 202.5 median: 202.5 (61%) max: 203 Points
CPU TDP 14 W TDP 28 W 100% 100%
Cinebench R11.5 - Cinebench R11.5 CPU Multi 64 Bit
min: 9.12 avg: 9.3 median: 9.3 (12%) max: 9.41 Points
CPU TDP 14 W TDP 28 W 100% 97%
Cinebench R11.5 - Cinebench R11.5 CPU Single 64 Bit
min: 2.26 avg: 2.3 median: 2.3 (57%) max: 2.36 Points
CPU TDP 14 W TDP 28 W 96% 100%
Cinebench R10 - Cinebench R10 Rend. Single (32bit)
min: 8225 avg: 8275 median: 8274.5 (50%) max: 8324 Points
CPU TDP 14 W TDP 28 W 100% 99%
Cinebench R10 - Cinebench R10 Rend. Multi (32bit)
min: 25475 avg: 25545 median: 25545 (19%) max: 25615 Points
CPU TDP 14 W TDP 28 W 99% 100%
Cinebench R10 - Cinebench R10 Rend. Multi (64bit)
min: 33427 avg: 34400 median: 34399.5 (24%) max: 35372 Points
CPU TDP 14 W TDP 28 W 95% 100%
Cinebench R10 - Cinebench R10 Rend. Single (64bit)
min: 10472 avg: 10648 median: 10648 (13%) max: 10824 Points
CPU TDP 14 W TDP 28 W 100% 97%
wPrime 2.10 - wPrime 2.0 1024m *
min: 227.285 avg: 281.1 median: 281.1 (3%) max: 335 s
CPU TDP 14 W TDP 28 W 100% 101%
wPrime 2.10 - wPrime 2.0 32m *
min: 6.499 avg: 8.4 median: 8.3 (2%) max: 10.2 s
CPU TDP 14 W TDP 28 W 100% 101%
min: 4190 avg: 4707 median: 4706.5 (7%) max: 5223 Points
CPU TDP 14 W TDP 28 W 80% 100%
7-Zip 18.03 - 7-Zip 18.03 Multli Thread 4 runs
min: 20565 avg: 21844 median: 21844 (13%) max: 23123 MIPS
CPU TDP 14 W TDP 28 W 89% 100%
7-Zip 18.03 - 7-Zip 18.03 Single Thread 4 runs
min: 4751 avg: 4802 median: 4802 (57%) max: 4853 MIPS
CPU TDP 14 W TDP 28 W 98% 100%
X264 HD Benchmark 4.0 - x264 Pass 2
46.3 fps (16%)
X264 HD Benchmark 4.0 - x264 Pass 1
192 fps (44%)
HWBOT x265 Benchmark v2.2 - HWBOT x265 4k Preset
min: 5.46 avg: 6 median: 6 (11%) max: 6.6 fps
CPU TDP 14 W TDP 28 W 83% 100%
TrueCrypt - TrueCrypt Serpent
min: 0.437 avg: 0.5 median: 0.5 (0%) max: 0.469 GB/s
CPU TDP 14 W TDP 28 W 93% 100%
TrueCrypt - TrueCrypt Twofish
min: 0.713 avg: 0.8 median: 0.8 (13%) max: 0.802 GB/s
CPU TDP 14 W TDP 28 W 89% 100%
TrueCrypt - TrueCrypt AES
5.6 GB/s (15%)
CPU TDP 14 W TDP 28 W 100% 100%
Blender - Blender 3.3 Classroom CPU *
1116 Seconds (14%)
Blender - Blender 2.79 BMW27 CPU *
min: 601 avg: 641 median: 641 (5%) max: 681 Seconds
CPU TDP 14 W TDP 28 W 100% 101%
R Benchmark 2.5 - R Benchmark 2.5 *
min: 0.627 avg: 0.6 median: 0.6 (14%) max: 0.63 sec
CPU TDP 14 W TDP 28 W 100% 100%
3DMark 06 - CPU - 3DMark 06 - CPU
min: 8786 avg: 8923 median: 8922.5 (19%) max: 9059 Points
CPU TDP 14 W TDP 28 W 97% 100%
Super Pi mod 1.5 XS 1M - Super Pi mod 1.5 XS 1M *
min: 7.2 avg: 7.5 median: 7.5 (2%) max: 7.825 s
CPU TDP 14 W TDP 28 W 100% 100%
Super Pi mod 1.5 XS 2M - Super Pi mod 1.5 XS 2M *
min: 15.7 avg: 16.5 median: 16.5 (1%) max: 17.298 s
CPU TDP 14 W TDP 28 W 100% 100%
Super Pi Mod 1.5 XS 32M - Super Pi mod 1.5 XS 32M *
min: 366 avg: 389.8 median: 389.8 (2%) max: 413.691 s
CPU TDP 14 W TDP 28 W 100% 100%
3DMark Vantage - 3DM Vant. Perf. CPU no Physx
30874 Points (27%)
3DMark 11 - 3DM11 Performance Physics
min: 10880 avg: 11208 median: 11208 (30%) max: 11536 Points
CPU TDP 14 W TDP 28 W 94% 100%
3DMark - 3DMark Ice Storm Physics
min: 5464 avg: 7683 median: 7811 (6%) max: 8382 Points
63423 Points (52%)
CPU TDP ? TDP 28 W 12% 100%
min: 7465 avg: 7576 median: 7575.5 (6%) max: 7686 Points
CPU TDP ? TDP 28 W 12% 100%
3DMark - 3DMark Ice Storm Extreme Physics
min: 5536 avg: 7724 median: 7861 (6%) max: 8383 Points
63591 Points (52%)
CPU TDP ? TDP 28 W 12% 100%
min: 7371 avg: 7572 median: 7572 (6%) max: 7773 Points
CPU TDP ? TDP 28 W 12% 100%
3DMark - 3DMark Ice Storm Unlimited Physics
min: 7473 avg: 8449 median: 8628 (7%) max: 9037 Points
65828 Points (55%)
CPU TDP ? TDP 28 W 13% 100%
min: 7498 avg: 8034 median: 7975.5 (7%) max: 8913 Points
CPU TDP ? TDP 28 W 13% 100%
3DMark - 3DMark Cloud Gate Physics
min: 8524 avg: 8726 median: 8725.5 (22%) max: 8927 Points
CPU TDP 14 W TDP 28 W 95% 100%
3DMark - 3DMark Fire Strike Standard Physics
min: 13209 avg: 13311 median: 13311 (24%) max: 13413 Points
CPU TDP 14 W TDP 28 W 98% 100%
3DMark - 3DMark Time Spy CPU
min: 4092 avg: 4290 median: 4289.5 (18%) max: 4487 Points
CPU TDP 14 W TDP 28 W 91% 100%
3DMark - 3DMark Sling Shot Extreme (ES 3.1) Unlimited Physics
0 Points (0%)
3DMark - 3DMark Sling Shot (ES 3.0) Unlimited Physics
0 Points (0%)
Geekbench 5.5 - Geekbench 5.1 - 5.4 64 Bit Single-Core
min: 1427 avg: 1429 median: 1428.5 (60%) max: 1430 Points
CPU TDP 14 W TDP 28 W 100% 100%
63 Points (3%)
CPU TDP ? TDP 14 W TDP 28 W 4% 100% 100%
Geekbench 5.5 - Geekbench 5.1 - 5.4 64 Bit Multi-Core
min: 5055 avg: 5261 median: 5261 (9%) max: 5467 Points
CPU TDP 14 W TDP 28 W 92% 100%
248 Points (0%)
CPU TDP ? TDP 14 W TDP 28 W 5% 92% 100%
Geekbench 5.0 - Geekbench 5.0 64 Bit Single-Core
1423 Points (6%)
Geekbench 5.0 - Geekbench 5.0 64 Bit Multi-Core
5351 Points (17%)
Geekbench 4.4 - Geekbench 4.1 - 4.4 64 Bit Single-Core
6226 Points (62%)
min: 394 avg: 421 median: 426 (4%) max: 437 Points
Geekbench 4.4 - Geekbench 4.1 - 4.4 64 Bit Multi-Core
20787 Points (23%)
min: 1131 avg: 1167 median: 1161.5 (1%) max: 1237 Points
Geekbench 4.0 - Geekbench 4.0 64 Bit Single-Core
407 Points (6%)
Geekbench 4.0 - Geekbench 4.0 64 Bit Multi-Core
1166 Points (3%)
Geekbench 3 - Geekbench 3 32 Bit Multi-Core
min: 891 avg: 1145 median: 1169.5 (2%) max: 1200 Points
min: 1135 avg: 1165 median: 1170.5 (2%) max: 1184 Points
Geekbench 3 - Geekbench 3 32 Bit Single-Core
min: 347 avg: 354.5 median: 353 (7%) max: 366 Points
min: 354 avg: 355.5 median: 356 (7%) max: 356 Points
Geekbench 3 - Geekbench 3 64 Bit Multi-Core
1191 Points (2%)
1171 Points (2%)
Geekbench 3 - Geekbench 3 64 Bit Single-Core
364 Points (5%)
350 Points (5%)
Geekbench 2 - 32 Bit - Geekbench Stream
min: 371 avg: 375 median: 375 (3%) max: 379 Points
Geekbench 2 - 32 Bit - Geekbench Memory
min: 962 avg: 992 median: 992 (9%) max: 1022 Points
Geekbench 2 - 32 Bit - Geekbench Floating Point
min: 2105 avg: 2122 median: 2121.5 (4%) max: 2138 Points
Geekbench 2 - 32 Bit - Geekbench Integer
min: 1249 avg: 1251 median: 1251 (3%) max: 1253 Points
Geekbench 2 - 32 Bit - Geekbench Total Score
min: 1403 avg: 1416 median: 1416 (4%) max: 1429 Points
Linpack Android / IOS - Linpack Multi Thread
min: 110 avg: 215.7 median: 230 (8%) max: 289.8 MFLOPS
Linpack Android / IOS - Linpack Single Thread
min: 52 avg: 87.8 median: 88.9 (9%) max: 116 MFLOPS
Mozilla Kraken 1.1 - Kraken 1.1 Total Score *
min: 14999 avg: 17878 median: 15823 (19%) max: 28996 ms
min: 702 avg: 712 median: 712 (1%) max: 722 ms
CPU TDP ? TDP 14 W TDP 28 W 100% 125% 125%
min: 14579 avg: 16993 median: 15157 (18%) max: 21257 ms
CPU TDP ? TDP 14 W TDP 28 W 100% 125% 125%
Sunspider - Sunspider 1.0 Total Score *
min: 1361 avg: 1655 median: 1578.5 (17%) max: 2149 ms
Sunspider - Sunspider 0.9.1 Total Score *
min: 832 avg: 1517 median: 1606 (15%) max: 1939 ms
Octane V2 - Octane V2 Total Score
min: 894 avg: 2044 median: 2105 (2%) max: 2452 Points
min: 1645 avg: 2066 median: 2138.5 (2%) max: 2280 Points
WebXPRT 4 - WebXPRT 4 Score
177.4 Points (51%)
WebXPRT 3 - WebXPRT 3 Score
min: 234 avg: 238.5 median: 238.5 (50%) max: 243 Points
CPU TDP 14 W TDP 28 W 100% 96%
Vellamo 3.x - Vellamo 3.x Metal
min: 634 avg: 699 median: 713 (19%) max: 740 Points
Vellamo 3.x - Vellamo 3.x Multicore Beta
min: 1110 avg: 1201 median: 1210 (27%) max: 1273 Points
Vellamo 3.x - Vellamo 3.x Browser
min: 1528 avg: 1743 median: 1691 (22%) max: 2102 Points
Quadrant Standard Edition 2.0 - Quadrant Standard 2.0 Total Score
min: 4838 avg: 6502 median: 5781 (13%) max: 9537 points
AnTuTu v4 - AnTuTu v4 Total Score
min: 17286 avg: 17314 median: 17307 (40%) max: 17349 Points
AnTuTu v5 - AnTuTu v5 Total Score
min: 18063 avg: 19220 median: 19113 (19%) max: 20838 Points
AnTuTu v6 - AnTuTu v6 Total Score
23643 Points (8%)
min: 15185 avg: 22450 median: 23956.5 (8%) max: 25237 Points
AnTuTu v7 - AnTuTu v7 MEM
min: 2654 avg: 2929 median: 2969 (9%) max: 3122 Points
min: 6403 avg: 8560 median: 8949 (11%) max: 9938 Points
AnTuTu v7 - AnTuTu v7 GPU
0 Points (0%)
AnTuTu v7 - AnTuTu v7 CPU
min: 7527 avg: 7814 median: 7615.5 (5%) max: 8496 Points
AnTuTu v7 - AnTuTu v7 Total Score
min: 17073 avg: 19302 median: 19523 (3%) max: 21088 Points
AndEBench - AndEBench Java
min: 299 avg: 344.3 median: 358 (11%) max: 371 Iter./s
AndEBench - AndEBench Native
min: 6523 avg: 6867 median: 6948.5 (23%) max: 7045 Iter./s
PassMark PerformanceTest Mobile V1 - PerformanceTest Mobile V1 CPU Tests
min: 9174 avg: 9761 median: 9807 (1%) max: 10230 Points
PCMark for Android - PCM f. Android Work Score
min: 1910 avg: 2425 median: 2468.5 (12%) max: 2852 Points
min: 2516 avg: 2715 median: 2695.5 (13%) max: 3041 Points
PCMark for Android - PCM f. Android Work Score 2.0
0 Points (0%)
CrossMark - CrossMark Overall
min: 1279 avg: 1285 median: 1284.5 (49%) max: 1290 Points
CPU TDP 14 W TDP 28 W 100% 99%
Power Consumption - Prime95 Power Consumption - external Monitor *
min: 38 avg: 42.8 median: 42.8 (7%) max: 47.5 Watt
CPU TDP 14 W TDP 28 W 102% 100%
Power Consumption - Cinebench R15 Multi Power Consumption - external Monitor *
min: 45.2 avg: 50.4 median: 50.4 (9%) max: 55.5 Watt
CPU TDP 14 W TDP 28 W 102% 100%
Power Consumption - Idle Power Consumption - external Monitor *
10.9 Watt (7%)
Power Consumption - Idle Power Consumption 150cd 1min *
3.6 Watt (4%)
Power Consumption - Cinebench R15 Multi Power Efficiency - external Monitor
17.5 Points per Watt (13%)
Average Benchmarks Mediatek MT6582 → 100% n=4 Average Benchmarks Intel Core i5-1145G7 → 626% n=4 Average Benchmarks Mediatek MT6580M → 97% n=4
- Range of benchmark values for this graphics card
- Average benchmark values for this graphics card
* Smaller numbers mean a higher performance
1 This benchmark is not used for the average calculation
v1.27
log 15. 23:17:53
#0 checking url part for id 5956 +0s ... 0s
#1 checking url part for id 12236 +0s ... 0s
#2 checking url part for id 8081 +0s ... 0s
#3 not redirecting to Ajax server +0s ... 0s
#4 did not recreate cache, as it is less than 5 days old! Created at Thu, 13 Jun 2024 05:33:43 +0200 +0.001s ... 0.001s
#5 composed specs +0.034s ... 0.035s
#6 did output specs +0s ... 0.036s
#7 getting avg benchmarks for device 5956 +0.004s ... 0.039s
#8 got single benchmarks 5956 +0.033s ... 0.072s
#9 getting avg benchmarks for device 12236 +0.016s ... 0.088s
#10 got single benchmarks 12236 +0.017s ... 0.104s
#11 getting avg benchmarks for device 8081 +0.003s ... 0.107s
#12 got single benchmarks 8081 +0.064s ... 0.171s
#13 got avg benchmarks for devices +0s ... 0.171s
#14 No cached benchmark found, getting uncached values +0.209s ... 0.381s
#15 No cached benchmark found, getting uncached values +0.005s ... 0.385s
#16 No cached benchmark found, getting uncached values +0.129s ... 0.514s
#17 No cached benchmark found, getting uncached values +0.019s ... 0.533s
#18 min, max, avg, median took s +0.017s ... 0.55s
#19 return log +0s ... 0.55s
Please share our article, every link counts!
Redaktion, 2017-09- 8 (Update: 2023-07- 1)
 Deutsch
 English
 Español
 Français
 Italiano
 Nederlands
 Polski
 Português
 Русский
 Türkçe
 Svenska
 Chinese
 Magyar