Notebookcheck Logo

Mediatek Helio G99 vs MediaTek Dimensity 7050

Mediatek Helio G99

► remove from comparison Mediatek Helio G99

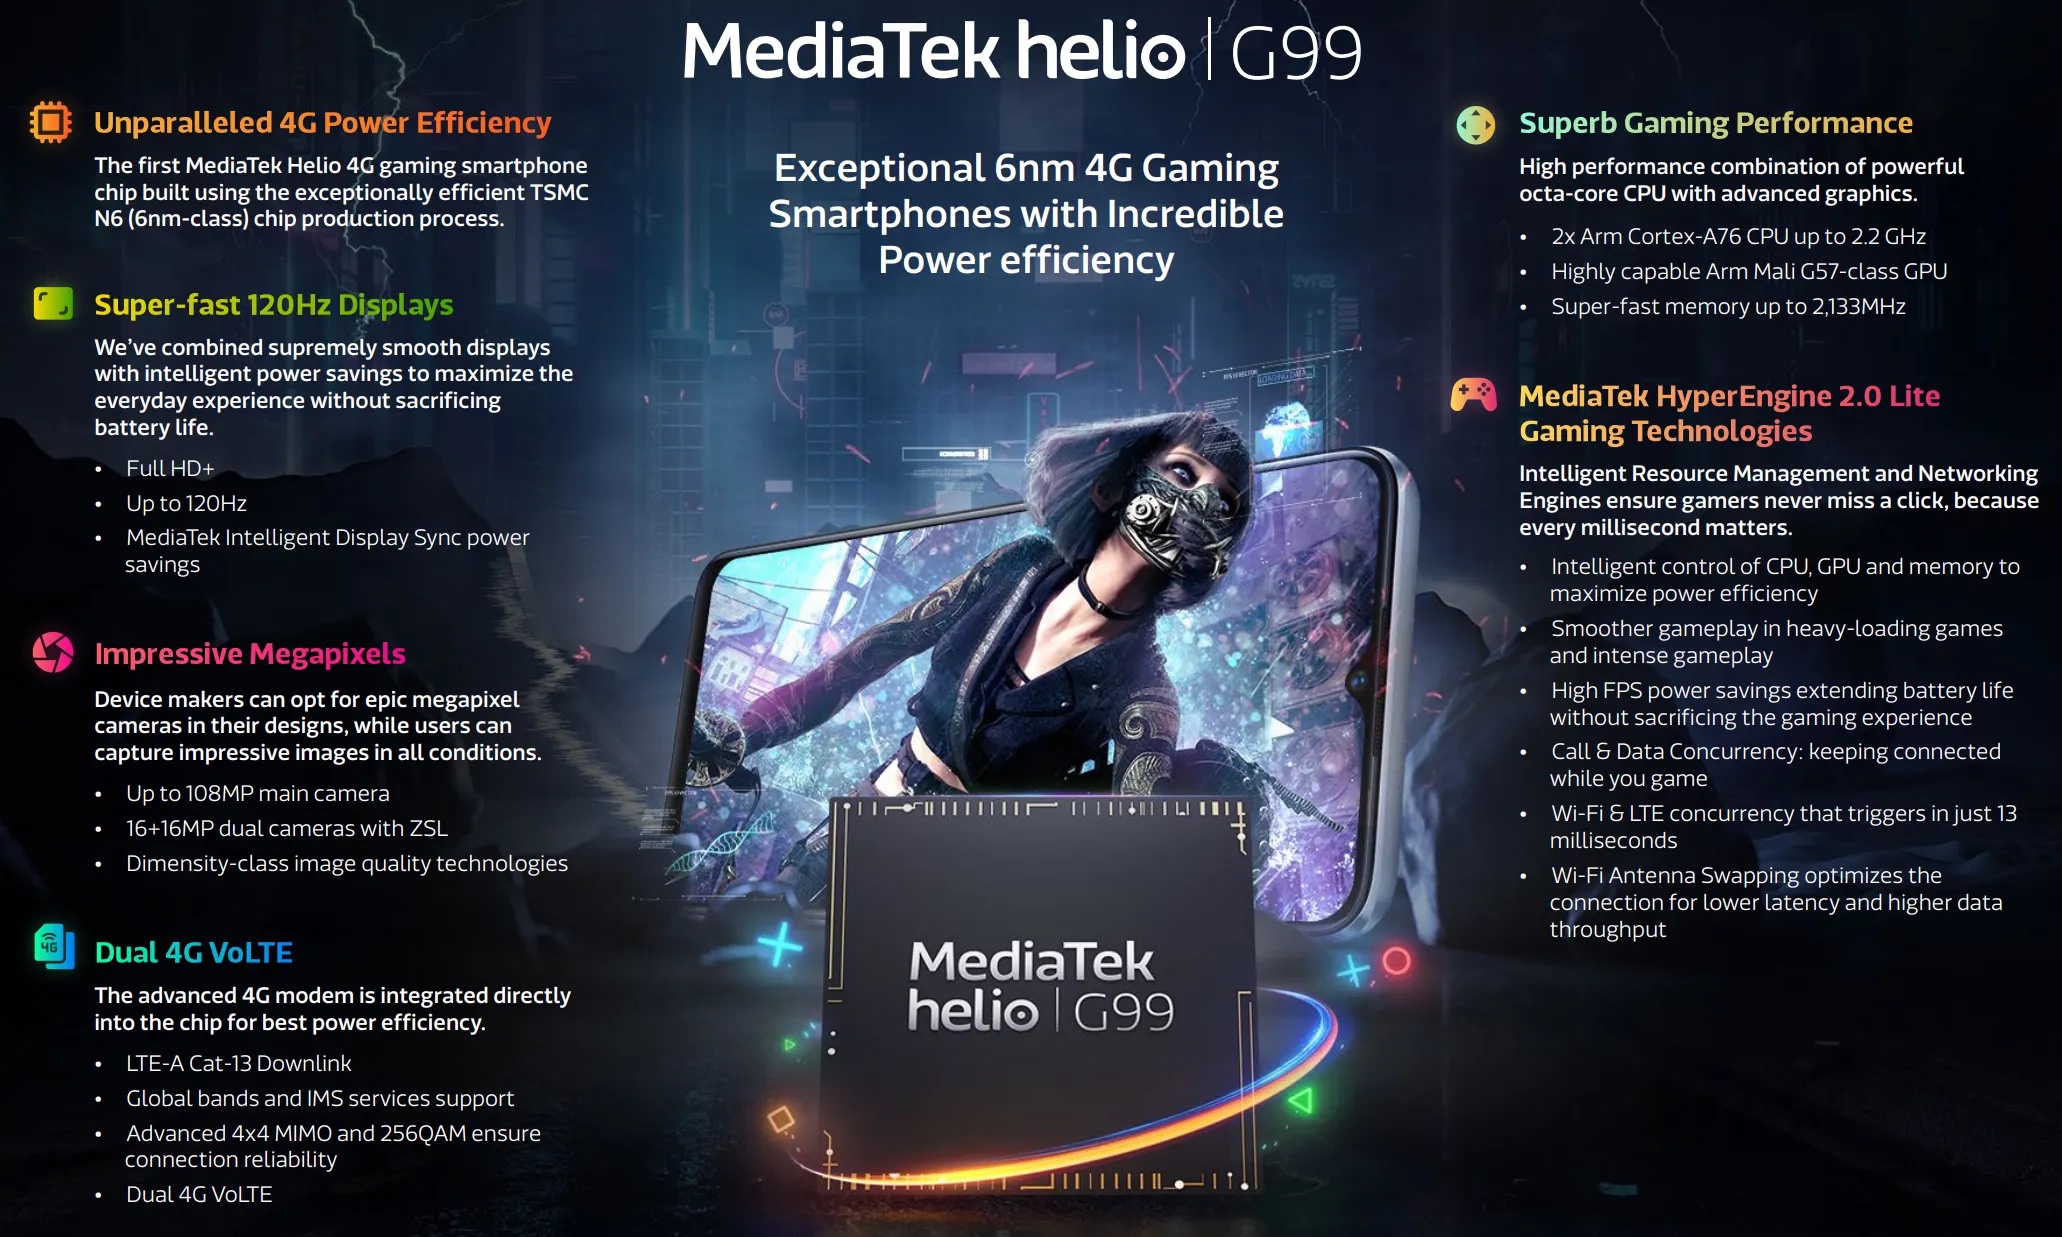
The Mediatek Helio G99 is a mainstream ARM SoC for smartphones (mainly Android based) that was introduced in 2022. It is manufactured in a 6 nm FinFET process and is equipped with 2x big ARM Cortex-A76 cores with up to 2.2 GHz and 6x small and power efficient ARM Cortex-A55 cores (max. 2 GHz) in two clusters (bigLITTLE). The chip integrates an ARM Mali-G57 MC2 (two cores). Compared to the older Helio G96, the G99 is manufactured in the more recent 6nm process and clocks higher.

Furthermore, the integrated LTE / 4G modem supports Cat-13 download speeds. Wi-Fi 5 is also integrated (a/b/g/n/ac). The memory controller supportsLPDDR4x with up to 4,266 Mbps.

MediaTek Dimensity 7050

► remove from comparison Mediatek Dimensity 7050

The Mediatek Dimensity 7050 (Mediatek MT8791N/TN)  is a mid-range ARM SoC (system-on-a-chip) that can be used in both smartphones and tablets (mainly Android). The SoC integrates two ARM Cortex-A78 cores with up to 2.6 GHz for demanding tasks and six power-saving ARM Cortex-A55 cores with clock rates of up to 2 GHz. The specifications are identical to the old Dimensity 1080.

The chip has an integrated sub-6 GHz 5G modem including dual-SIM support that can reach a maximum download speed of up to 2.77 Gbit/s. Wi-Fi 6 (802.11ax) is supported as well as Bluetooth 5.2.

The memory controller copes with LPDDR4x or LPDDR5 working memory as well as UFS 3.1 mass storage. As an integrated graphics card, the SoC uses the ARM Mali-G68 MC4, which supports displays with 120 Hz as well as HDR10+ at a maximum resolution of 2,520 x 1,440 pixels.

The MediaTek Dimensity 7050 is still manufactured in 6 nm.

ModelMediatek Helio G99MediaTek Dimensity 7050
CodenameCortex-A76 / A55Cortex-A78 / A55
SeriesMediatek Mediatek Helio G
Series: Mediatek Helio G Cortex-A76 / A55
Mediatek Helio G100 compare2 - 2.2 GHz8 / 8 cores Cortex-A76 / A55
Mediatek Helio G99 « 2 - 2.2 GHz8 / 8 cores Cortex-A76 / A55
Mediatek Helio G96 compare2 - 2.05 GHz8 / 8 cores Cortex-A76 / A55
Mediatek Helio G95 compare2 - 2.05 GHz8 / 8 cores Cortex-A76 / A55
Mediatek Helio G90T compare2.05 GHz8 / 8 cores Cortex-A76 / A55
Clock2000 - 2200 MHz2000 - 2600 MHz
Cores / Threads8 / 8
2 x 2.2 GHz ARM Cortex-A76
6 x 2.0 GHz ARM Cortex-A55
8 / 8
Technology6 nm6 nm
Features2x Cortex-A76, 6x Cortex-A55, 4G LTE Cat-12/13, 64MP AI-Camera support, LPDDR3/LPDDR4x-2133, eMMC 5.1, UFS 2.1, Beidou, Galileo, Glonass, GPS, Wi-Fi 5 (a/b/g/n/ac), AI Accelerator up to 1 TMACs, H.264 / H.265 / HEVC video encoding (4k30)2x ARM Cortex-A78 (2.6 GHz), 6x ARM Cortex-A55 (2 GHz), ARM Mali-G68 MC4, 5G NR Sub-6 GHz, LTE
iGPUARM Mali-G57 MP2ARM Mali-G68 MP4
ArchitectureARMARM
Announced
Manufacturerwww.mediatek.comwww.mediatek.com

Benchmarks

min: 4044     avg: 4205     median: 4279 (40%)     max: 4307 Points
3DMark - 3DMark Sling Shot (ES 3.0) Unlimited Physics
min: 3438     avg: 3596     median: 3630.5 (41%)     max: 3685 Points
4304 Points (49%)
Geekbench 6.0 - Geekbench 6.0 Single-Core
min: 714     avg: 717     median: 717 (23%)     max: 720 Points
Geekbench 6.0 - Geekbench 6.0 Multi-Core
min: 1916     avg: 1941     median: 1940.5 (8%)     max: 1965 Points
min: 738     avg: 791     median: 795 (30%)     max: 835 Points
min: 1973     avg: 2163     median: 2171.5 (4%)     max: 2335 Points
Geekbench 5.0 - Geekbench 5.0 64 Bit Single-Core
555 Points (2%)
762 Points (3%)
Geekbench 5.0 - Geekbench 5.0 64 Bit Multi-Core
1921 Points (6%)
1960 Points (6%)
Geekbench 4.4 - Geekbench 4.1 - 4.4 64 Bit Single-Core
min: 2512     avg: 2620     median: 2672 (27%)     max: 2675 Points
min: 3616     avg: 3697     median: 3630 (36%)     max: 3844 Points
Geekbench 4.4 - Geekbench 4.1 - 4.4 64 Bit Multi-Core
min: 7018     avg: 7608     median: 7896 (8%)     max: 7911 Points
min: 8532     avg: 8932     median: 8637 (8%)     max: 9628 Points
Geekbench 4.0 - Geekbench 4.0 64 Bit Single-Core
2625 Points (29%)
3562 Points (39%)
Geekbench 4.0 - Geekbench 4.0 64 Bit Multi-Core
min: 7492     avg: 7532     median: 7531.5 (10%)     max: 7571 Points
8166 Points (11%)
Geekbench 3 - Geekbench 3 64 Bit Multi-Core
min: 7124     avg: 7934     median: 7933.5 (12%)     max: 8743 Points
10869 Points (17%)
Geekbench 3 - Geekbench 3 64 Bit Single-Core
min: 2334     avg: 2555     median: 2555 (38%)     max: 2776 Points
3811 Points (57%)
Mozilla Kraken 1.1 - Kraken 1.1 Total Score *
min: 1628.6     avg: 2004     median: 1971 (2%)     max: 2443.7 ms
min: 1263.6     avg: 1474     median: 1488.7 (2%)     max: 1656.2 ms
Octane V2 - Octane V2 Total Score
min: 17228     avg: 21975     median: 22187 (16%)     max: 26476 Points
min: 31245     avg: 34210     median: 34656 (25%)     max: 37214 Points
WebXPRT 4 - WebXPRT 4 Score
min: 39     avg: 73.1     median: 81 (22%)     max: 89 Points
min: 66     avg: 87.8     median: 89 (24%)     max: 107 Points
WebXPRT 3 - WebXPRT 3 Score
min: 80     avg: 95.4     median: 93.5 (17%)     max: 112 Points
min: 81     avg: 97.7     median: 99 (18%)     max: 113 Points
Antutu v9 - AnTuTu v9 Total Score
min: 229468     avg: 317183     median: 319204 (16%)     max: 375956 Points
min: 426859     avg: 466886     median: 442871 (22%)     max: 530929 Points
Antutu v9 - AnTuTu v9 CPU
min: 83150     avg: 98532     median: 100624 (25%)     max: 106860 Points
min: 115632     avg: 126696     median: 122360 (30%)     max: 142097 Points
Antutu v10 - AnTuTu v10 Total Score
min: 383511     avg: 403419     median: 401641 (13%)     max: 422936 Points
min: 503958     avg: 554348     median: 554348 (18%)     max: 604738 Points
Antutu v10 - AnTuTu v10 CPU
min: 120432     avg: 131716     median: 131438 (13%)     max: 140012 Points
min: 170891     avg: 172047     median: 172046 (17%)     max: 173202 Points
PassMark PerformanceTest Mobile V1 - PerformanceTest Mobile V1 CPU Tests
min: 5092     avg: 5252     median: 5252 (1%)     max: 5412 Points
PCMark for Android - PCM f. Android Storage 2.0 random write internal
min: 30.8     avg: 56     median: 63.7 (43%)     max: 71.8 MB/s
min: 58.7     avg: 60     median: 60 (41%)     max: 61.2 MB/s
PCMark for Android - PCM f. Android Storage 2.0 seq write internal
min: 184.1     avg: 571     median: 681 (19%)     max: 830 MB/s
min: 581     avg: 870     median: 869.5 (25%)     max: 1158 MB/s
PCMark for Android - PCM f. Android Storage 2.0 random read internal
min: 17.6     avg: 33.8     median: 40.4 (20%)     max: 45.4 MB/s
min: 37.9     avg: 40.2     median: 40.2 (19%)     max: 42.4 MB/s
PCMark for Android - PCM f. Android Storage 2.0 seq read internal
min: 719.36     avg: 789     median: 796 (20%)     max: 858 MB/s
min: 623     avg: 1061     median: 1060.5 (26%)     max: 1498 MB/s
PCMark for Android - PCM f. Android Storage 2.0 score
min: 14042     avg: 22881     median: 26431 (12%)     max: 28259 Points
min: 27787     avg: 47399     median: 28605.5 (13%)     max: 104598 Points
min: 575     avg: 655     median: 669 (25%)     max: 706 Points
min: 4.31     avg: 5.1     median: 4.4 (2%)     max: 6.66 Watt
min: 1.268     avg: 2.3     median: 1.9 (2%)     max: 3.85 Watt

Average Benchmarks Mediatek Helio G99 → 100% n=29

Average Benchmarks MediaTek Dimensity 7050 → 125% n=29

- Range of benchmark values for this graphics card
red legend - Average benchmark values for this graphics card
* Smaller numbers mean a higher performance
1 This benchmark is not used for the average calculation

Add one or more devices and compare

In the following list you can select (and also search for) devices that should be added to the comparison. You can select more than one device.

restrict list:
v1.34
log 10. 06:45:34

#0 ran 0s before starting gpusingle class +0s ... 0s

#1 checking url part for id 14649 +0s ... 0s

#2 checking url part for id 15080 +0s ... 0s

#3 redirected to Ajax server, took 1760071534s time from redirect:0 +0s ... 0s

#4 did not recreate cache, as it is less than 5 days old! Created at Fri, 10 Oct 2025 05:18:33 +0200 +0s ... 0s

#5 composed specs +0.004s ... 0.004s

#6 did output specs +0s ... 0.004s

#7 getting avg benchmarks for device 14649 +0.001s ... 0.005s

#8 got single benchmarks 14649 +0.027s ... 0.032s

#9 getting avg benchmarks for device 15080 +0.001s ... 0.032s

#10 got single benchmarks 15080 +0.011s ... 0.044s

#11 got avg benchmarks for devices +0s ... 0.044s

#12 min, max, avg, median took s +0.026s ... 0.07s

#13 return log +0s ... 0.07s

Please share our article, every link counts!
Mail Logo
> Expert Reviews and News on Laptops, Smartphones and Tech Innovations > Benchmarks / Tech > Processor Comparison - Head 2 Head
Redaktion, 2017-09- 8 (Update: 2023-07- 1)