Notebookcheck Logo

Intel Celeron N4120 vs Intel Pentium N3700

Intel Celeron N4120

► remove from comparison Intel Celeron N4120

The Intel Celeron N4120 is a quad-core SoC primarily for inexpensive notebooks and was announced late 2019. It runs at 1.1-2.6 GHz (Single Core Burst) and is based on the Gemini Lake platform. Compared to the predecessor, the Celeron N4100, the refresh offers a 200 MHz higher Boost clock. Similar to the Apollo Lake predecessors, the chip is manufactured in a 14 nm process with FinFETs but offers slightly improved processor cores, double the amount of L2 cache, a smaller package, a new generation of monitor outputs (Gen 10) and a partly integrated WiFi chip. Besides four CPU cores, the chip also includes a DirectX 12 capable GPU as well as a DDR4/LPDDR4 memory controller (dual-channel, up to 2400 MHz). The SoC is not replaceable as it is directly soldered to the mainboard.

Architecture

The processor architecture ist still called Goldmont Plus. Compared to the older Goldmont cores in Apollo Lake, they feature an increased level 2 cache (to 4 MB). That means the per-clock-performance should be a bit better, but not near the Core CPUs like Kaby Lake Y.

Performance

The average N4120 in our database is not much faster than AMD's Zen-based, affordable Athlon Silver 3050e, as far as multi-thread benchmark scores are concerned, with the Intel Celeron 6305 and the Core i5-7Y54 found close nearby as well. It's a very basic CPU that we're talking about here. While it does have four cores, these are some seriously slow cores, dashing hopes of anybody looking to get a Core i3-like performance for cheap.

GPU Performance

The UHD Graphics 600 (Gemini Lake) is based on Intel's Gen9 architecture, which supports DirectX 12 and is also used for the Kaby Lake / Skylake / Apollo Lake graphics adapters (like HD Graphics 520). Equipped with 12 EUs and a clock of up to 700 MHz, the performance should be roughly on par with the older HD Graphics 500 (Apollo Lake).

The chip also includes an advanced video engine with hardware support for the playback of VP9 and H.265 material (8-bit color-depth).

Power Consumption

Just like most other N-class Intel processors, Celeron N4120 has a default TDP of 6 W (also known as PL1), making it a good option for passively cooled laptops, tablets, mini-PCs. It's manufactured on a very old (as of late 2022) 14 nm process, though, making for poor energy efficiency.

Intel Pentium N3700

► remove from comparison Intel N3700

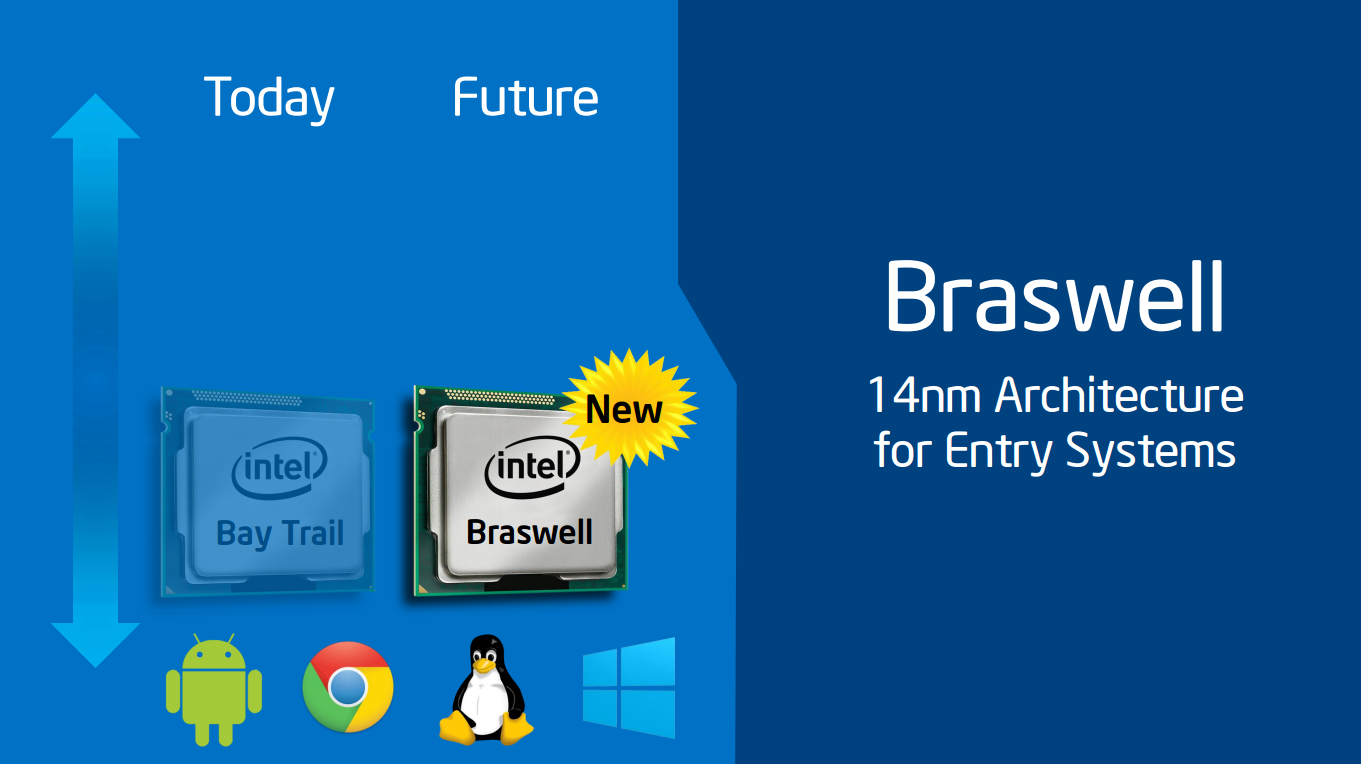
The Intel Pentium N3700 is a quad-core SoC for entry-level notebooks, which has been presented in early 2015. It is clocked at 1.6 - 2.4 GHz and part of the Braswell platform. Thanks to its new 14 nanometer low-power process (P1273) with tri-gate transistors, energy efficiency has been significantly improved compared to its predecessor Bay Trail (e.g. Pentium N3520). In addition to the CPU cores, the SoC offers a DirectX 11.2-capable GPU as well as a DDR3L Memory Controller (2x 64 bit, 25.6 GB/s).

Architecture

The processor cores are based on the Airmont architecture, which is basically a slightly modified shrink of the previous Silvermont core. While performance per clock has not been improved, the more efficient 14 nm process leads to a better utilization of the CPU Burst (alias Turbo Boost) and a therefore somewhat higher overall performance.

Performance

Compared to its predecessor Pentium N3520 (2.17 - 2.42 GHz) or the AMD APU A4-6210, the N3700 offers an almost identical performance. Using Windows, the CPU is adequate for everyday tasks such as Internet browsing or office applications, but may struggle in more demanding software.

Graphics

The HD Graphics (Braswell) is based on the Intel Gen8 architecture, which supports DirectX 11.2 and is also found in the Broadwell series (e.g. HD Graphics 5300). With 16 EUs (Execution Units) and a clock speed of up to 700 MHz, the GPU is about twice as fast as the HD Graphics (Bay Trail), but still not powerful enough to handle demanding 3D games of 2015. The GPU also supports 4K/H.265 video acceleration.

Power Consumption

The entire SoC is rated at an TDP of 6 watts (SDP 4 watts). Thus, the chip can be cooled passively.

ModelIntel Celeron N4120Intel Pentium N3700
CodenameGemini Lake RefreshBraswell
SeriesIntel Gemini LakeIntel Pentium
Series: Pentium Braswell
Intel Pentium Silver J5040 compare2 - 3.2 GHz4 / 4 cores
Intel Pentium Silver N5030 compare1.1 - 3.1 GHz4 / 4 cores
Intel Celeron J4125 compare2 - 2.7 GHz4 / 4 cores
Intel Celeron N4120 « 1.1 - 2.6 GHz4 / 4 cores
Intel Celeron J4025 compare2 - 2.9 GHz2 / 2 cores
Intel Celeron N4020 compare1.1 - 2.8 GHz2 / 2 cores
Intel Pentium N3710 compare1.6 - 2.56 GHz4 / 4 cores
Intel Pentium N3700 « 1.6 - 2.4 GHz4 / 4 cores
Clock1100 - 2600 MHz1600 - 2400 MHz
L2 Cache4 MB2 MB
Cores / Threads4 / 44 / 4
TDP6 Watt6 Watt
Technology14 nm14 nm
max. Temp.105 °C90 °C
SocketBGA1090FCBGA1170
FeaturesDDR4-2400/LPDDR4-2400 RAM, PCIe 2, MMX, SSE, SSE2, SSE3, SSSE3, SSE4.1, SSE4.2, VMX, SMEP, SMAP, MPX, EIST, TM1, TM2, Turbo, AES-NI, RDRAND, RDSEED, SHA, SGXIntel HD Graphics (Braswell, 400 - 700 MHz), Wireless Display, Quick Sync, AES-NI, max. 8 GB Dual-Channel DDR3L-1600 (25,6 GB/s), 5x USB 3.0, 4x PCIe 2.0, 2x SATA 6.0 Gbit/s
iGPUIntel UHD Graphics 600 (200 - 700 MHz)Intel HD Graphics (Braswell) (400 - 700 MHz)
Architecturex86x86
Announced
Manufacturerark.intel.comark.intel.com
$161 U.S.

Benchmarks

Performance Rating - CB R15 + R20 + 7-Zip + X265 + Blender + 3DM11 CPU - Celeron N4120
16.7 pt (28%)
Restrict / Search: Model: Max. age: years
Cinebench R23 - Cinebench R23 Multi Core
min: 965     avg: 1149     median: 1230 (1%)     max: 1253 Points
Cinebench R23 - Cinebench R23 Single Core
min: 409     avg: 416.5     median: 416.5 (18%)     max: 424 Points
Cinebench R20 - Cinebench R20 CPU (Single Core)
min: 159     avg: 163.3     median: 165 (18%)     max: 166 Points
Cinebench R20 - Cinebench R20 CPU (Multi Core)
min: 376     avg: 460.7     median: 490 (1%)     max: 516 Points
Cinebench R15 - Cinebench R15 CPU Multi 64 Bit
min: 223     avg: 227     median: 224 (1%)     max: 234 Points
min: 132     avg: 138.4     median: 141 (1%)     max: 143 Points
Cinebench R15 - Cinebench R15 CPU Single 64 Bit
min: 73     avg: 73.6     median: 73.2 (20%)     max: 74.5 Points
min: 36     avg: 37.4     median: 37 (10%)     max: 39 Points
Cinebench R11.5 - Cinebench R11.5 CPU Multi 64 Bit
2.7 Points (3%)
min: 1.61     avg: 1.7     median: 1.7 (2%)     max: 1.77 Points
Cinebench R11.5 - Cinebench R11.5 CPU Single 64 Bit
0.9 Points (21%)
min: 0.38     avg: 0.4     median: 0.5 (11%)     max: 0.47 Points
Cinebench R10 - Cinebench R10 Rend. Single (32bit)
2159 Points (13%)
min: 1087     avg: 1175     median: 1200 (7%)     max: 1267 Points
Cinebench R10 - Cinebench R10 Rend. Multi (32bit)
6432 Points (5%)
min: 3054     avg: 3610     median: 3148 (2%)     max: 4411 Points
Cinebench R10 - Cinebench R10 Rend. Single (64bit)
100%
1 N3700 +
1554 Points (2%)
wPrime 2.10 - wPrime 2.0 1024m *
661 s (8%)
wPrime 2.10 - wPrime 2.0 32m *
17.6 s (4%)
WinRAR - WinRAR 4.0
100%
1 N3700 +
1030 Points (2%)
7-Zip 18.03 - 7-Zip 18.03 Multi Thread 4 runs
min: 5832     avg: 6817     median: 7184 (4%)     max: 7436 MIPS
7-Zip 18.03 - 7-Zip 18.03 Single Thread 4 runs
min: 2145     avg: 2279     median: 2279 (27%)     max: 2412 MIPS
X264 HD Benchmark 4.0 - x264 Pass 2
100%
1 N3700 +
10 fps (0%)
X264 HD Benchmark 4.0 - x264 Pass 1
100%
1 N3700 +
49.7 fps (1%)
HWBOT x265 Benchmark v2.2 - HWBOT x265 4k Preset
min: 1.02     avg: 1.2     median: 1.3 (2%)     max: 1.38 fps
TrueCrypt - TrueCrypt Serpent
0.2 GB/s (5%)
TrueCrypt - TrueCrypt Twofish
0.3 GB/s (4%)
TrueCrypt - TrueCrypt AES
1.8 GB/s (5%)
Blender - Blender 2.79 BMW27 CPU *
min: 2558     avg: 2571     median: 2570.5 (18%)     max: 2583 Seconds
R Benchmark 2.5 - R Benchmark 2.5 *
min: 1.642     avg: 1.6     median: 1.6 (36%)     max: 1.649 sec
3DMark 06 - CPU - 3DMark 06 - CPU
3403 Points (7%)
min: 1934     avg: 2175     median: 2174.5 (5%)     max: 2415 Points
Super Pi mod 1.5 XS 1M - Super Pi mod 1.5 XS 1M *
25.6 s (6%)
Super Pi mod 1.5 XS 2M - Super Pi mod 1.5 XS 2M *
58.8 s (3%)
Super Pi Mod 1.5 XS 32M - Super Pi mod 1.5 XS 32M *
100%
1 N3700 +
2896 s (13%)
3DMark Vantage - 3DM Vant. Perf. CPU no Physx
100%
1 N3700 +
4950 Points (4%)
3DMark 11 - 3DM11 Performance Physics
min: 2626     avg: 2669     median: 2668.5 (7%)     max: 2711 Points
min: 1463     avg: 1707     median: 1768 (4%)     max: 1809 Points
3DMark - 3DMark Ice Storm Physics
100%
1 N3700 +
min: 15199     avg: 17365     median: 18405 (15%)     max: 18490 Points
3DMark - 3DMark Ice Storm Extreme Physics
100%
1 N3700 +
13625 Points (11%)
3DMark - 3DMark Ice Storm Unlimited Physics
100%
1 N3700 +
15829 Points (13%)
3DMark - 3DMark Cloud Gate Physics
min: 2251     avg: 2348     median: 2373 (6%)     max: 2421 Points
min: 1436     avg: 1557     median: 1611 (4%)     max: 1623 Points
3DMark - 3DMark Fire Strike Standard Physics
min: 3496     avg: 3723     median: 3688 (7%)     max: 3984 Points
min: 2093     avg: 2237     median: 2303 (4%)     max: 2315 Points
3DMark - 3DMark Time Spy CPU
min: 909     avg: 939     median: 938.5 (4%)     max: 968 Points
Geekbench 6.5 - Geekbench 6.5 Single-Core
320 Points (8%)
Geekbench 6.5 - Geekbench 6.5 Multi-Core
1068 Points (4%)
Geekbench 5.5 - Geekbench 5.1 - 5.5 64 Bit Single-Core
min: 438     avg: 442     median: 439 (17%)     max: 449 Points
Geekbench 5.5 - Geekbench 5.1 - 5.5 64 Bit Multi-Core
min: 1505     avg: 1525     median: 1509 (3%)     max: 1561 Points
Geekbench 5.0 - Geekbench 5.0 64 Bit Single-Core
min: 435     avg: 435.5     median: 435.5 (2%)     max: 436 Points
Geekbench 5.0 - Geekbench 5.0 64 Bit Multi-Core
min: 1492     avg: 1503     median: 1503 (5%)     max: 1514 Points
Geekbench 4.4 - Geekbench 4.1 - 4.4 64 Bit Single-Core
min: 1864     avg: 1885     median: 1876 (19%)     max: 1915 Points
Geekbench 4.4 - Geekbench 4.1 - 4.4 64 Bit Multi-Core
min: 5477     avg: 5606     median: 5668 (6%)     max: 5674 Points
Geekbench 3 - Geekbench 3 32 Bit Multi-Core
100%
1 N3700 +
min: 3209     avg: 3211     median: 3210.5 (6%)     max: 3212 Points
Geekbench 3 - Geekbench 3 32 Bit Single-Core
100%
1 N3700 +
min: 952     avg: 956     median: 956 (12%)     max: 960 Points
Geekbench 3 - Geekbench 3 64 Bit Multi-Core
100%
1 N3700 +
3299 Points (5%)
Geekbench 3 - Geekbench 3 64 Bit Single-Core
100%
1 N3700 +
1003 Points (15%)
Mozilla Kraken 1.1 - Kraken 1.1 Total Score *
min: 2125     avg: 2308     median: 2345.5 (3%)     max: 2415 ms
4378 ms (5%)
Sunspider - Sunspider 1.0 Total Score *
520 ms (6%)
min: 343.6     avg: 351.5     median: 351.5 (4%)     max: 359.3 ms
Octane V2 - Octane V2 Total Score
min: 16865     avg: 17701     median: 17701 (13%)     max: 18537 Points
8665 Points (6%)
WebXPRT 3 - WebXPRT 3 Score
min: 85     avg: 90.9     median: 86.2 (15%)     max: 106 Points
PCMark for Android - PCM f. Android Work 3.0 Battery Life
383 min (100%)
PCMark for Android - PCM f. Android Storage 2.0 score
28061 Points (12%)
PCMark for Android - PCM f. Android Work Score 3.0
8969 Points (33%)
Power Consumption - Prime95 Power Consumption - external Monitor *
14.2 Watt (2%)
Power Consumption - Cinebench R15 Multi Power Consumption - external Monitor *
8.3 Watt (2%)
Power Consumption - Idle Power Consumption 150cd 1min *
3.6 Watt (4%)
Power Consumption - Power Efficiency - Cinebench R15 Multi external Monitor
28.4 Points per Watt (21%)

Average Benchmarks Intel Celeron N4120 → 100% n=20

Average Benchmarks Intel Pentium N3700 → 65% n=20

- Range of benchmark values for this graphics card
red legend - Average benchmark values for this graphics card
* Smaller numbers mean a higher performance
1 This benchmark is not used for the average calculation

Add one or more devices and compare

In the following list you can select (and also search for) devices that should be added to the comparison. You can select more than one device.

restrict list:
v1.34
log 13. 23:49:44

#0 ran 0s before starting gpusingle class +0s ... 0s

#1 checking url part for id 11533 +0s ... 0s

#2 checking url part for id 6779 +0s ... 0s

#3 redirected to Ajax server, took 1760392184s time from redirect:0 +0s ... 0s

#4 did not recreate cache, as it is less than 5 days old! Created at Mon, 13 Oct 2025 05:18:33 +0200 +0s ... 0s

#5 composed specs +0.003s ... 0.003s

#6 did output specs +0s ... 0.003s

#7 getting avg benchmarks for device 11533 +0.001s ... 0.005s

#8 got single benchmarks 11533 +0.001s ... 0.005s

#9 getting avg benchmarks for device 6779 +0s ... 0.006s

#10 got single benchmarks 6779 +0.007s ... 0.013s

#11 got avg benchmarks for devices +0s ... 0.013s

#12 min, max, avg, median took s +0.03s ... 0.043s

#13 return log +0.003s ... 0.046s

Please share our article, every link counts!
Mail Logo
> Expert Reviews and News on Laptops, Smartphones and Tech Innovations > Benchmarks / Tech > Processor Comparison - Head 2 Head
Redaktion, 2017-09- 8 (Update: 2023-07- 1)