Apple iPad 6 2018 Tablet Review

The new 2018 iPad is supposed to be an iPad for education purposes. However, Apple does not change a lot. A new processor promises marginal performance improvement (which we will see below), but it does not really expand the functionality of the Apple iPad. This means the support for the Apple Pencil is the big seller for the education sector. Apple also grants discounts for schools. How much is Apple's latest iPad? Instead of $329, schools will get the iPad 6 for $299, but the Apple Pencil is still not included. It retails for $99, and it costs $89 for schools.
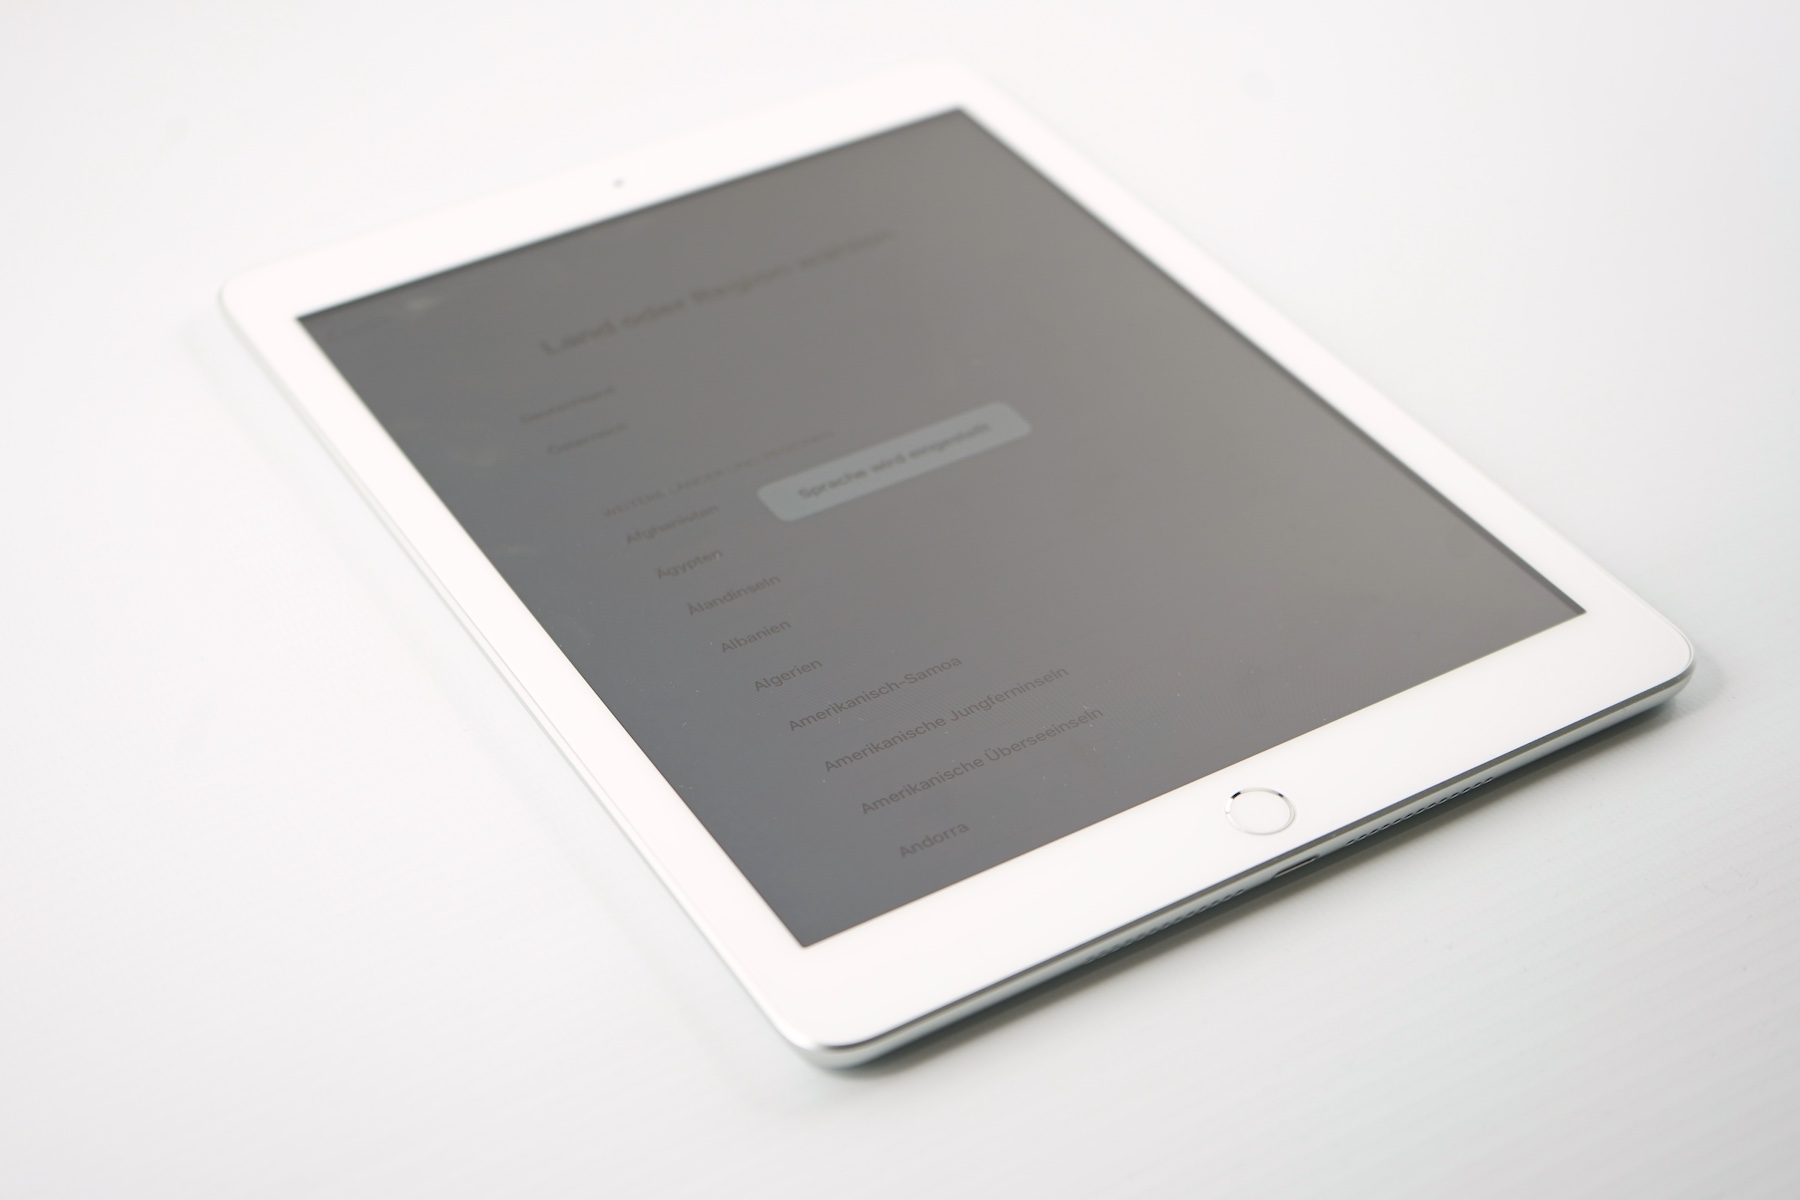
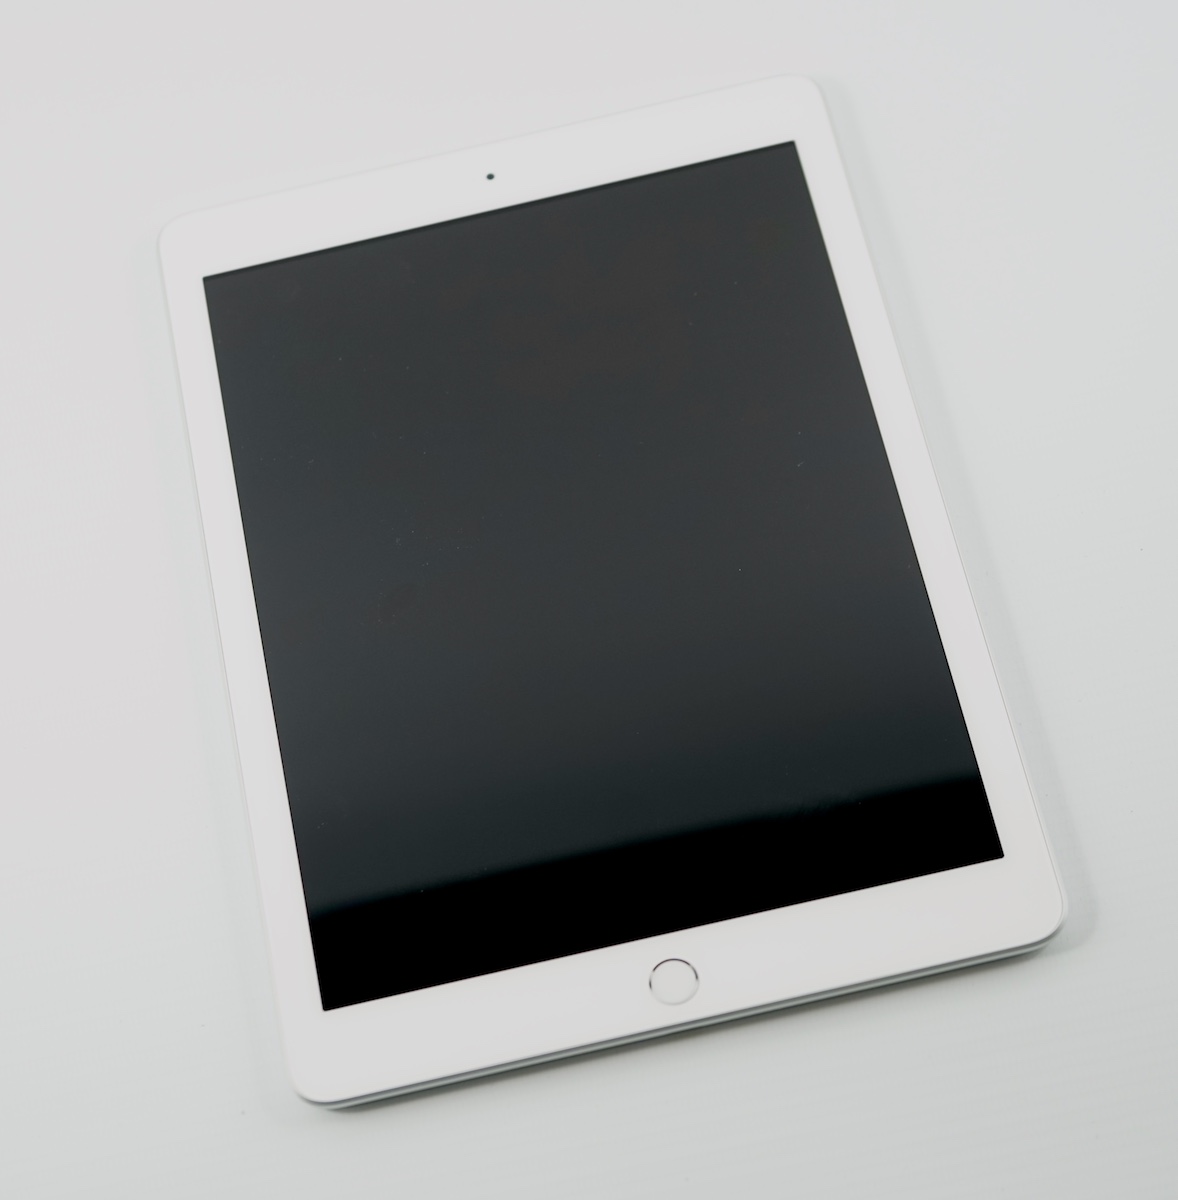
Case - new iPad is similar to the iPad Air
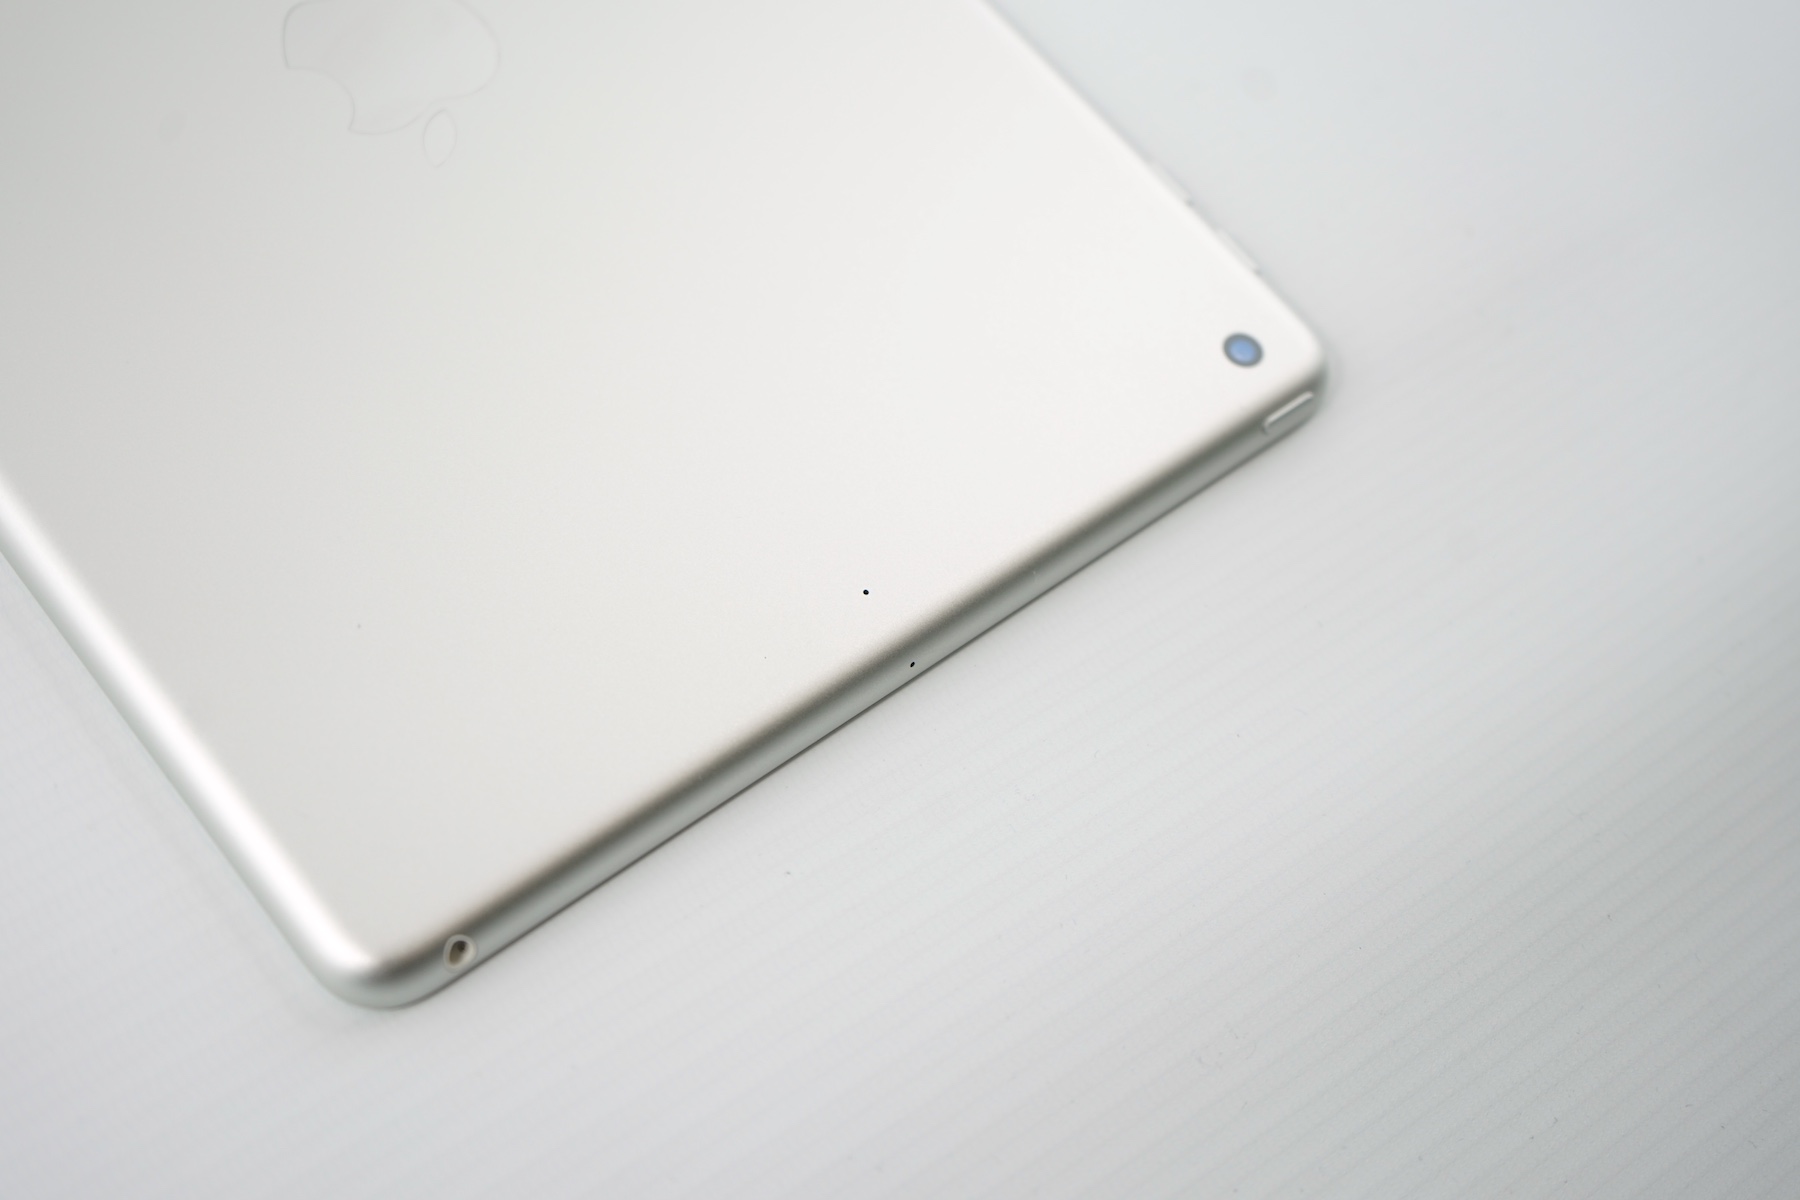
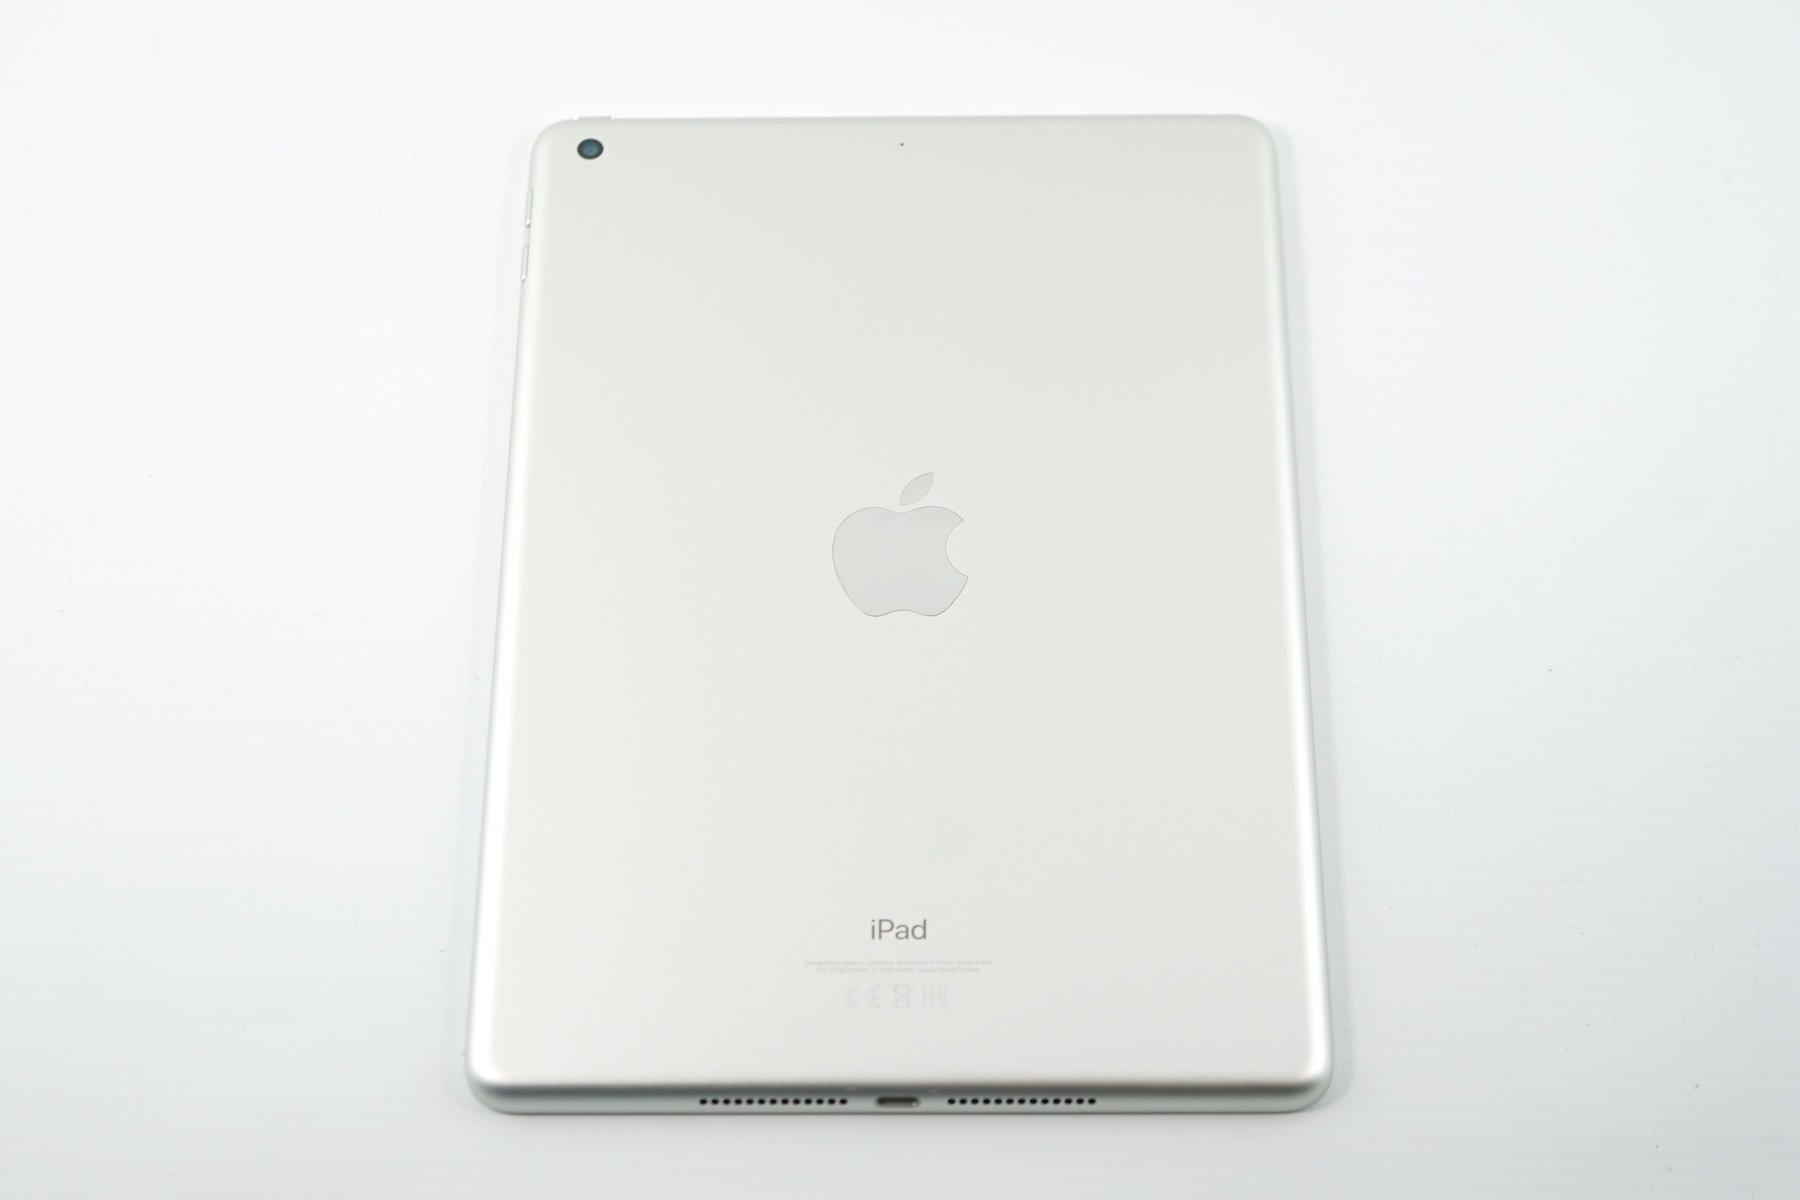
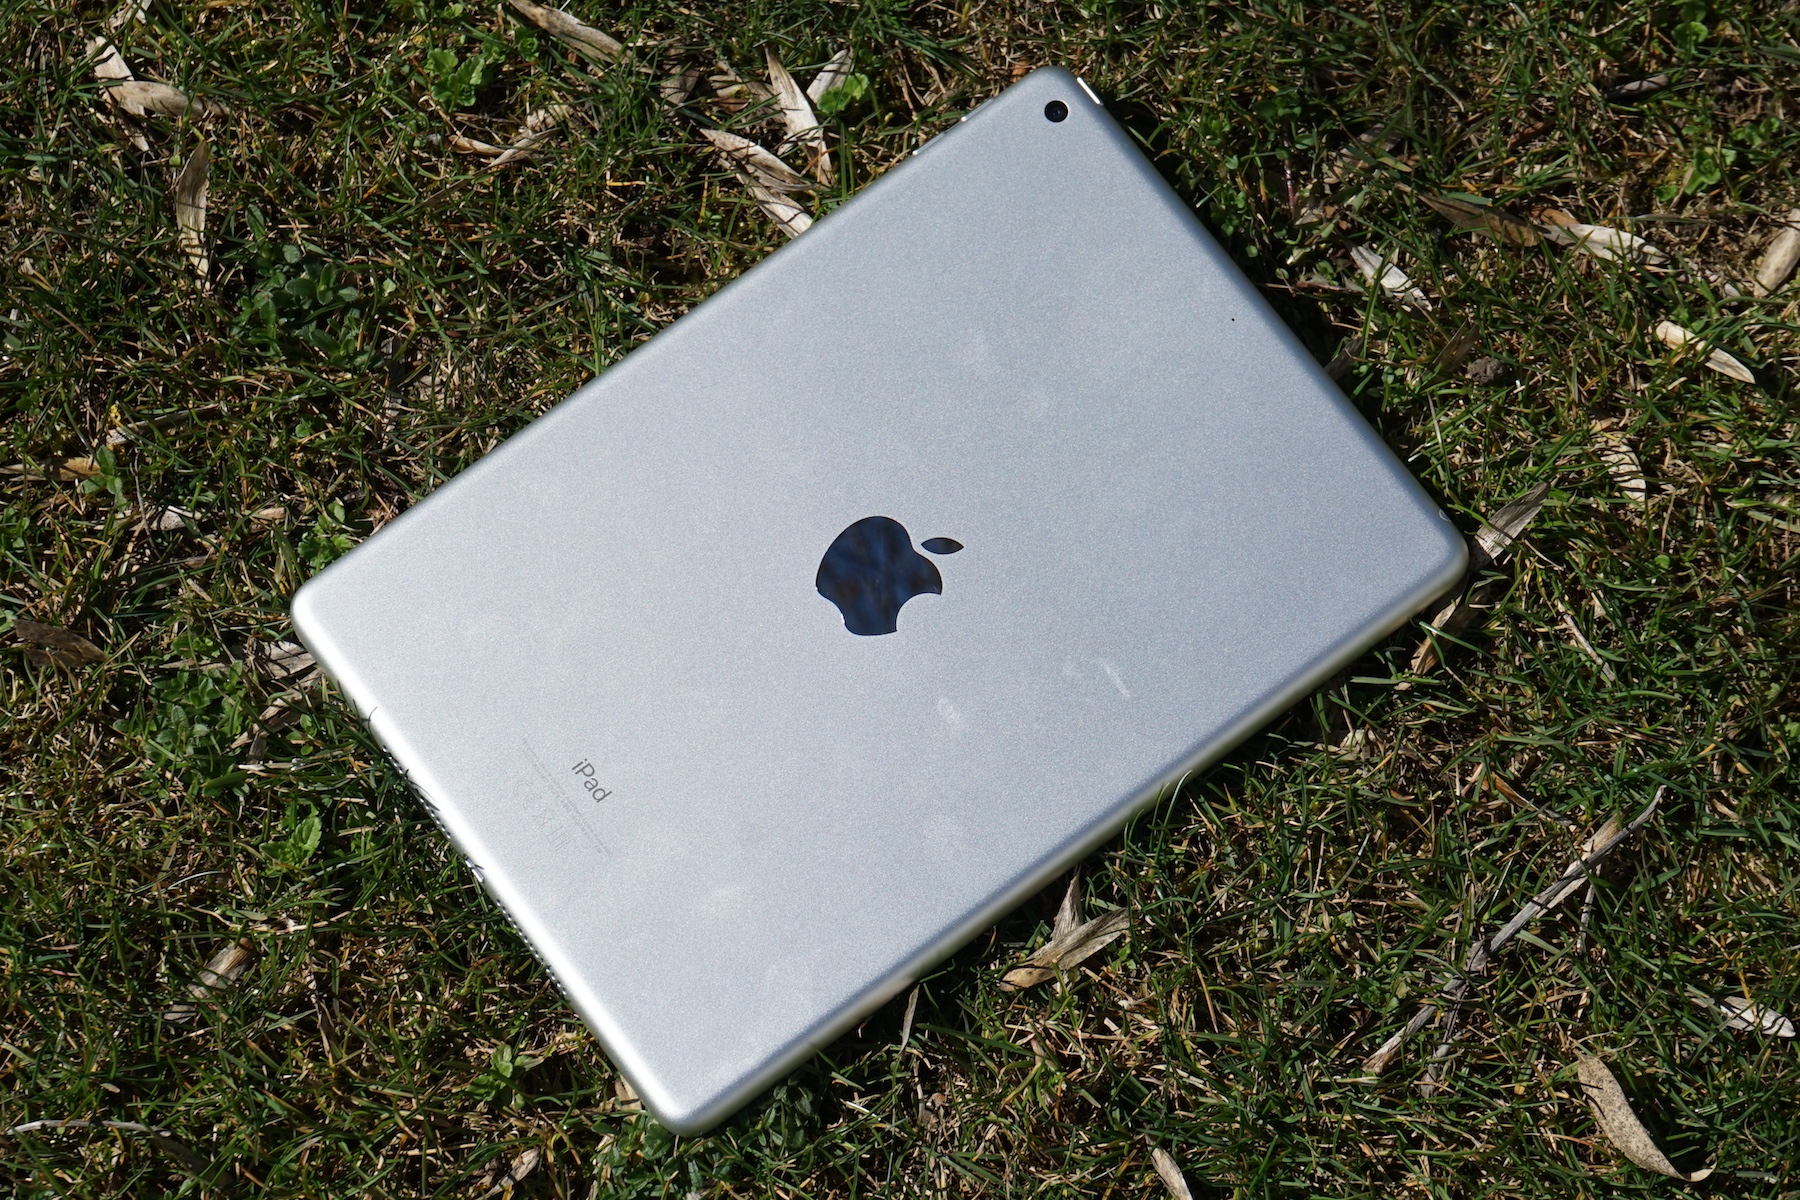
A look at the size comparison confirms the suspicion: The new iPad 6 uses the case from the previous model or its predecessor, respectively. The Apple iPad Air already used this chassis as well. This is not a big surprise since the familiar case with a height of 7.5 mm and a weight of around 470 grams is still a very good base for a tablet. The weight is more important for a tablet than one millimeter more or less anyway. For comparison: Samsung's Galaxy Tab S3 tips the scale at 434 grams, the Pixel C weighs 517 grams, and the Huawei MediaPad M2 is about 500 grams.
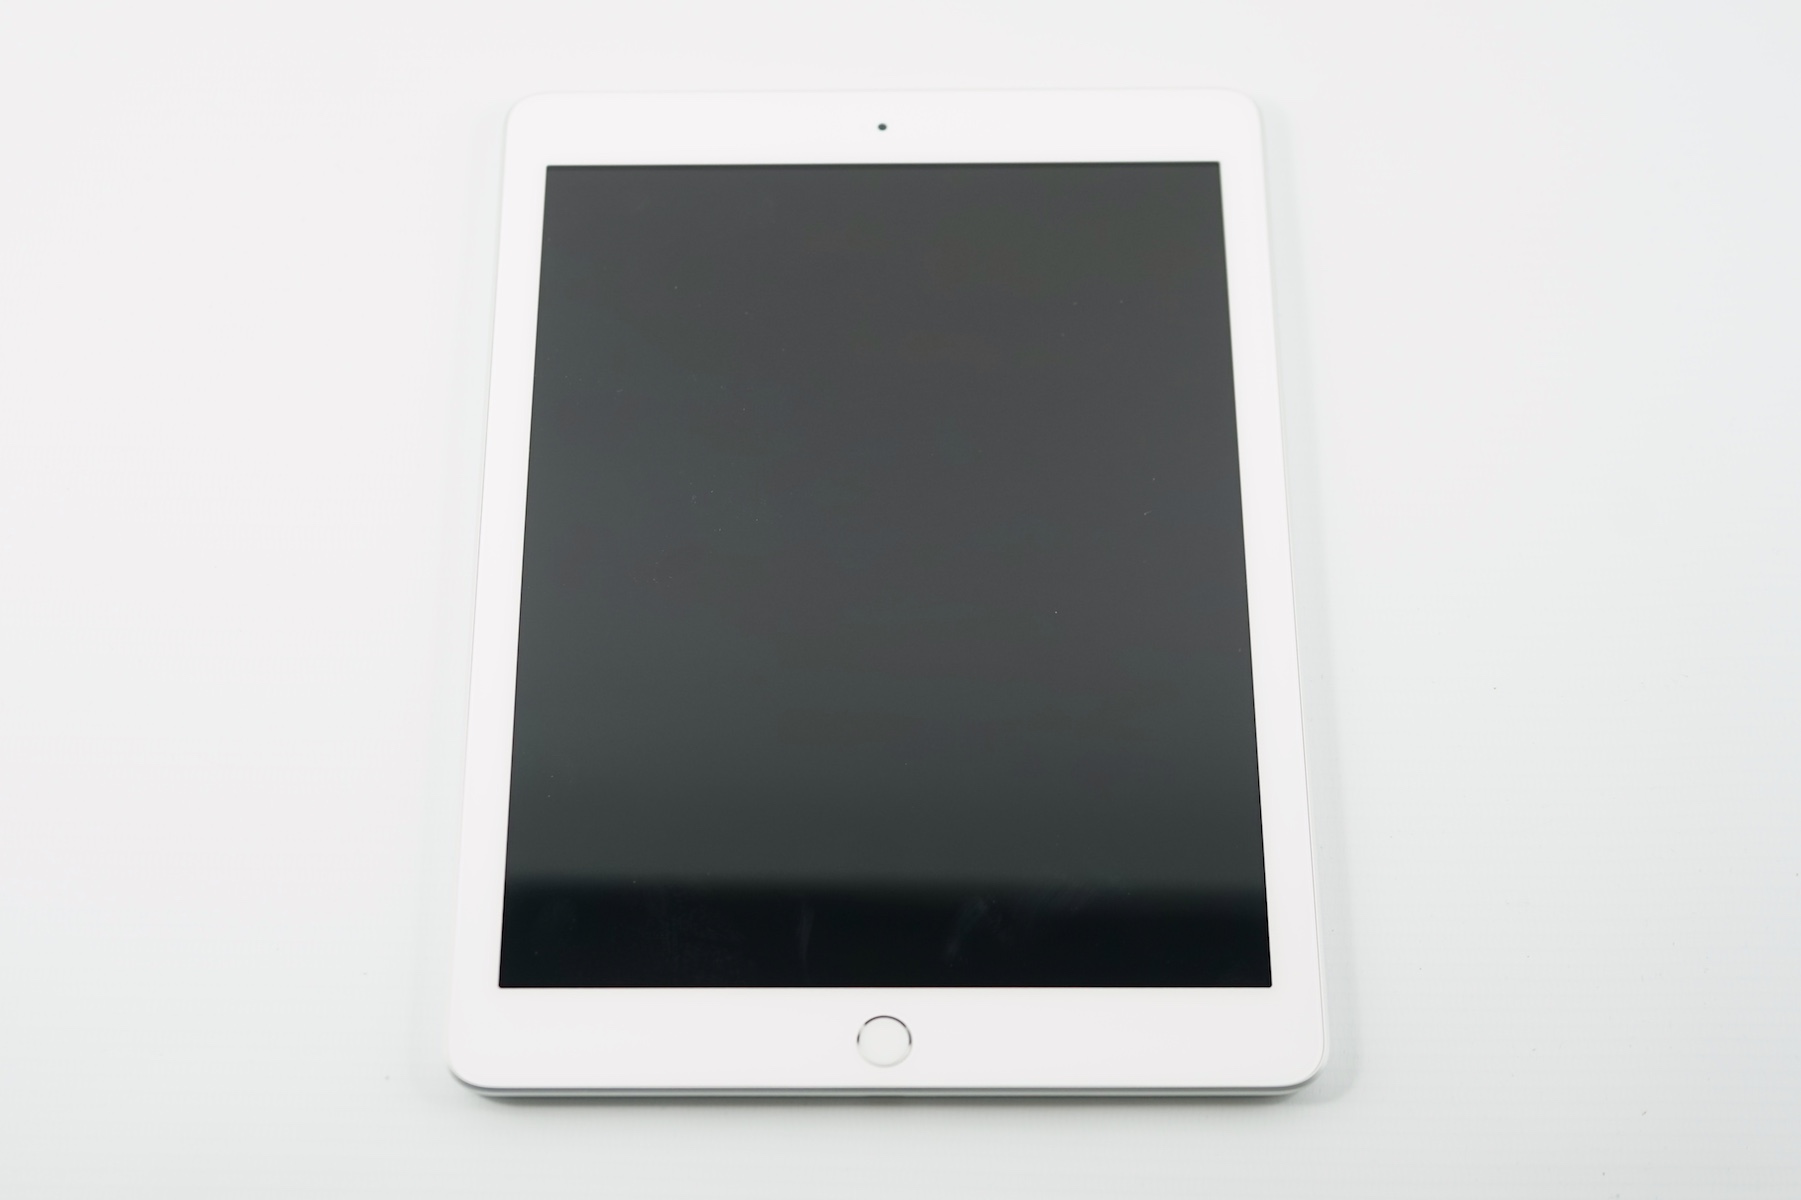
A quick reminder about the familiar case: The aluminum chassis (240 x 169.5 mm) supports Apple's Touch-ID fingerprint scanner inside the Home button. The build quality is very good, just like the stability of the case. More information about the case is available in our reviews of the 2017 Apple iPad or the Apple iPad Air 2, respectively. We also recommend a look at our review of the original Apple iPad for nostalgic reasons. Steve Jobs' first iPad from 2010 with a 25 Wh battery tipped the scale at about 700 grams and was almost twice as thick as the new iPad at 13.4 mm.
Connectivity - iPad 2018 with Pencil, but for a price...
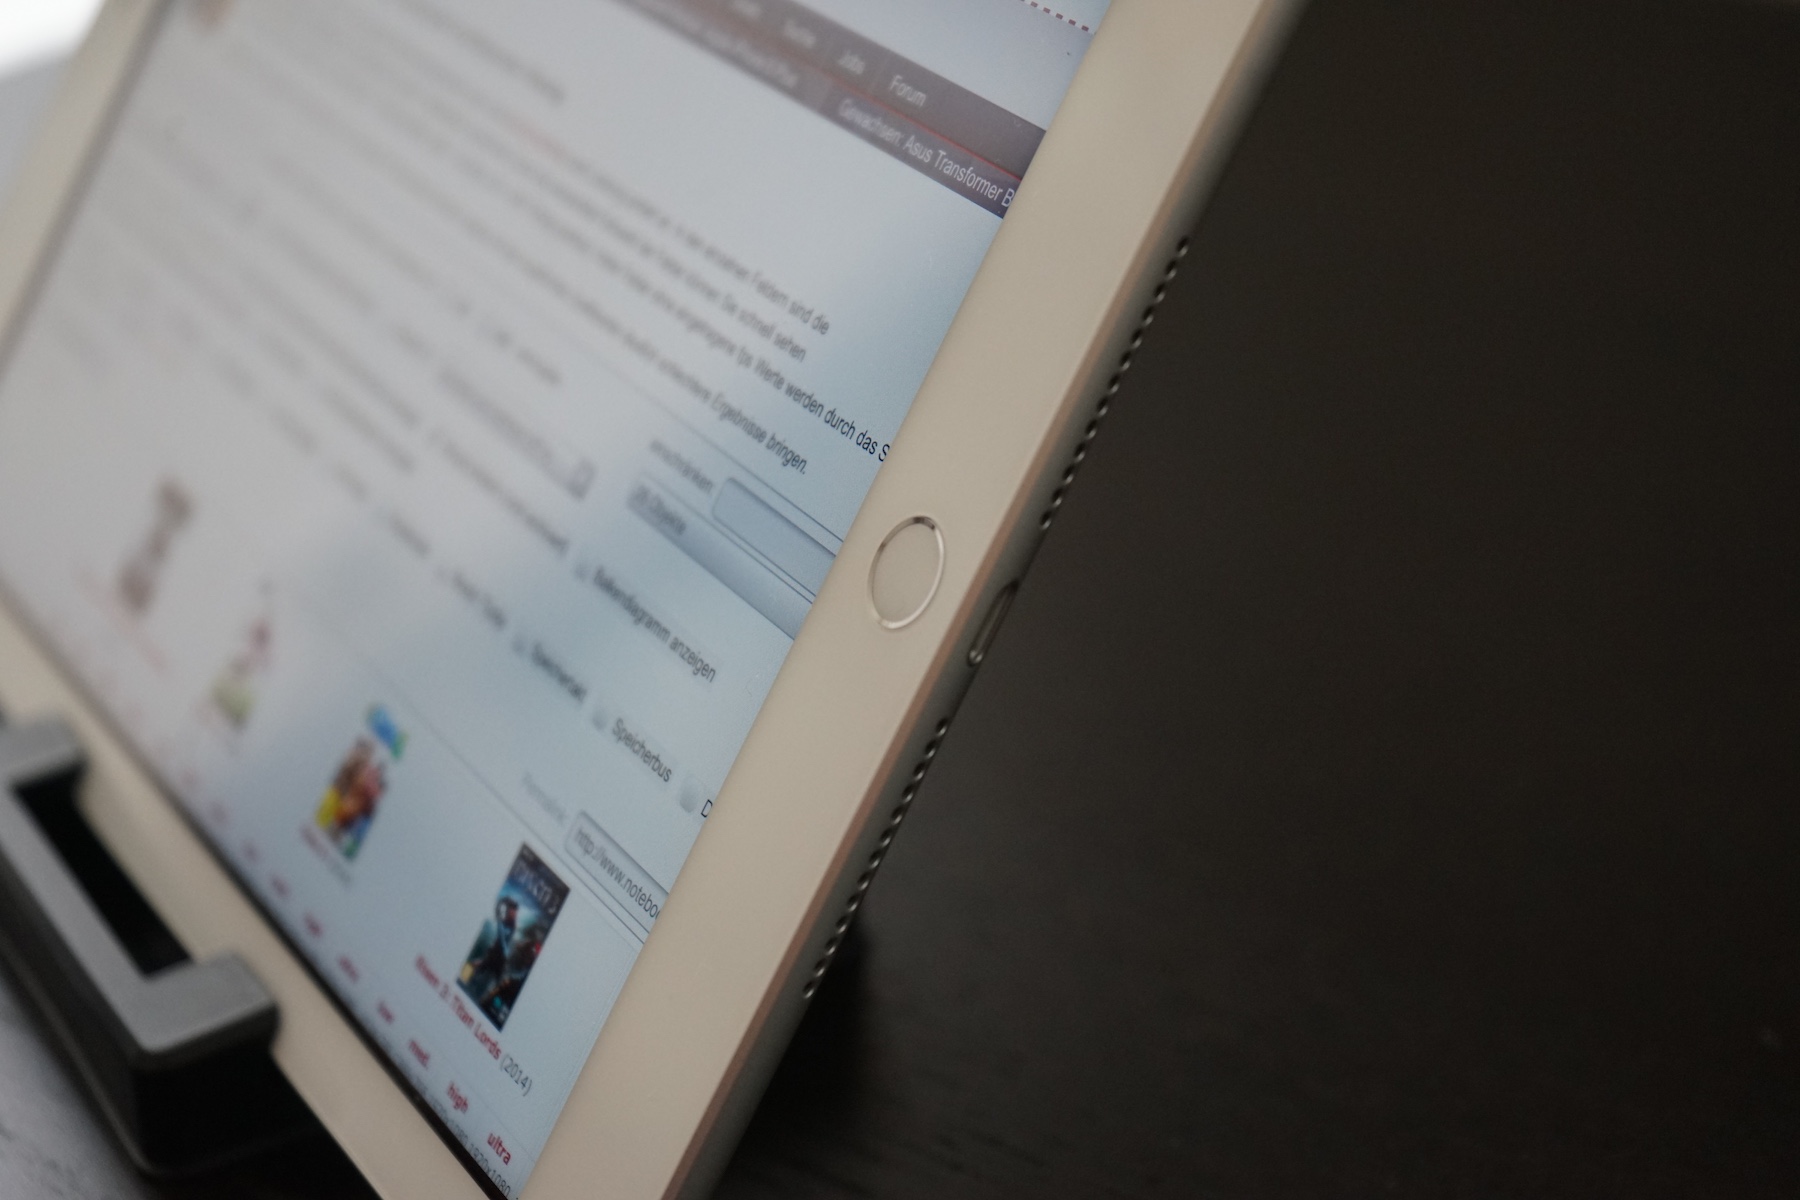
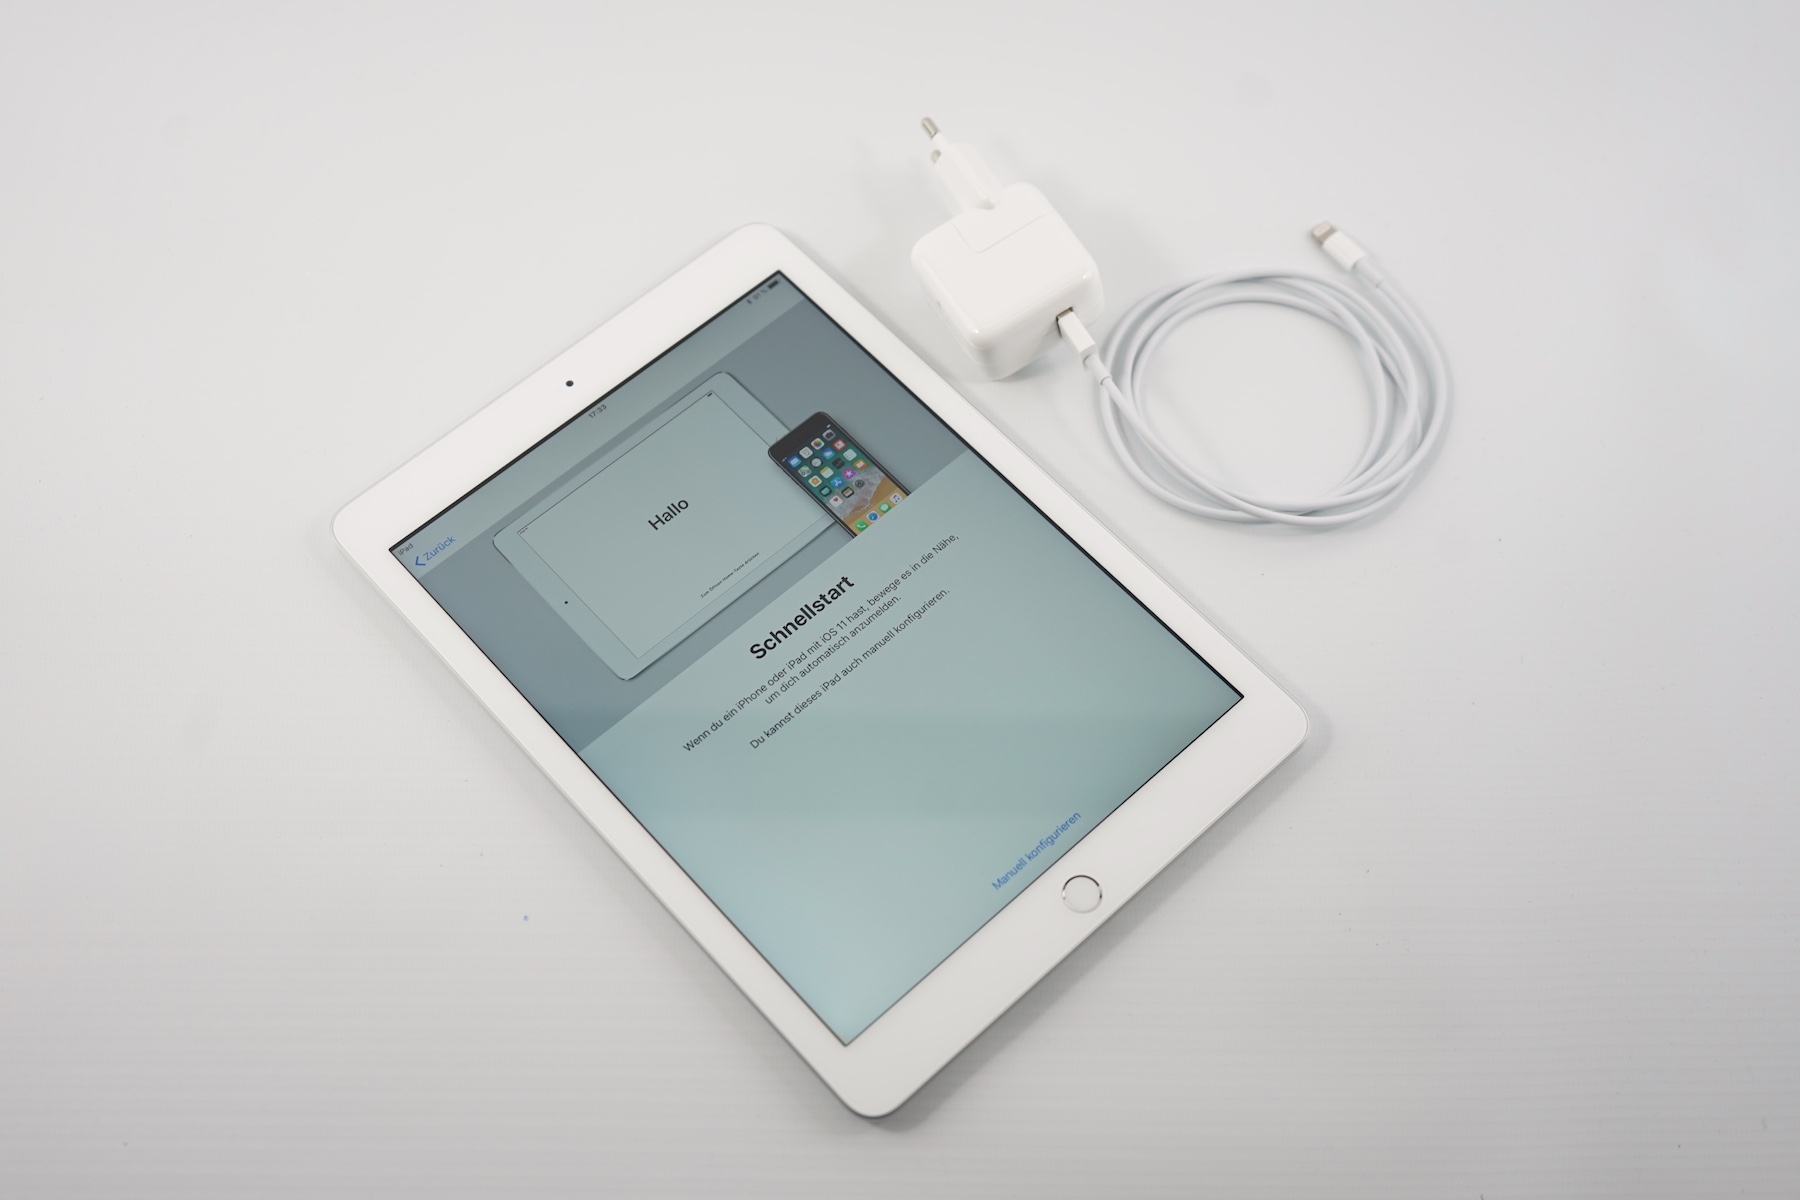
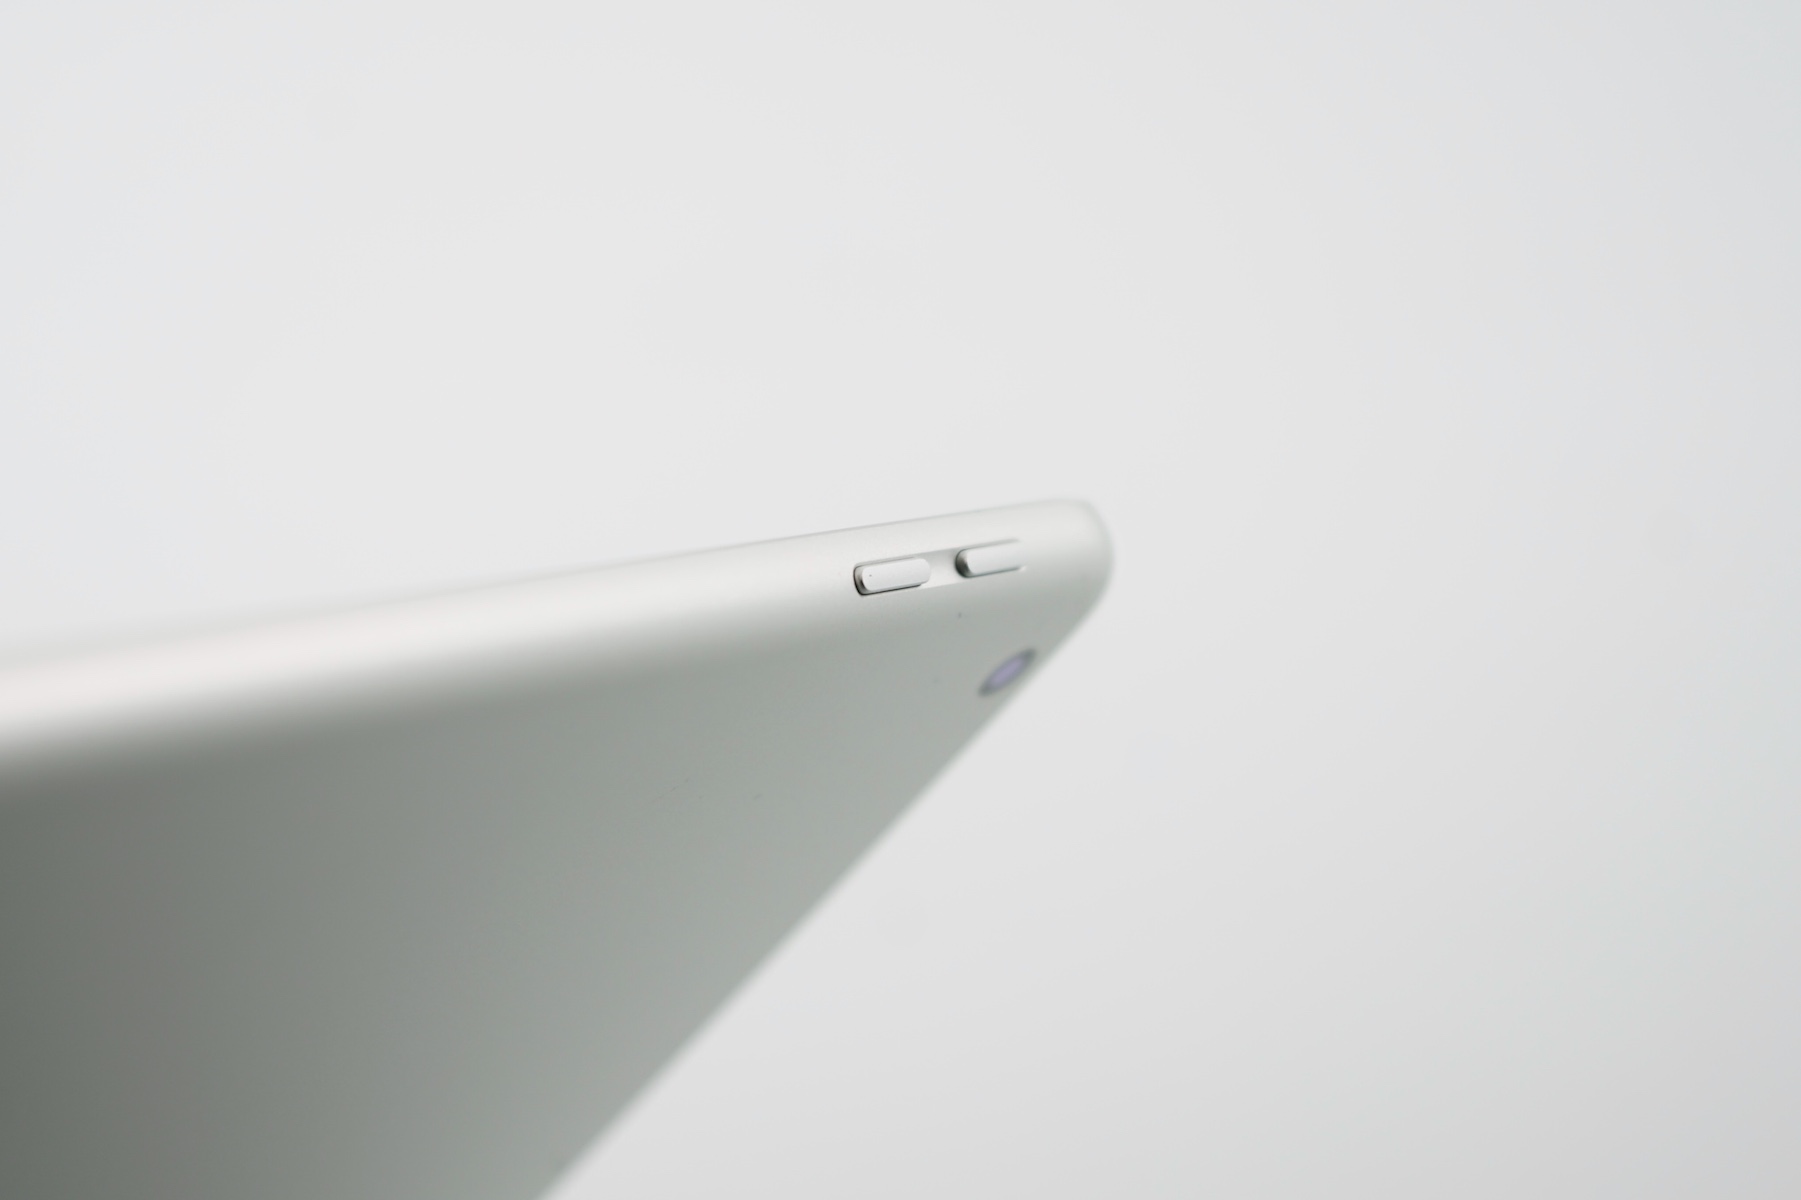
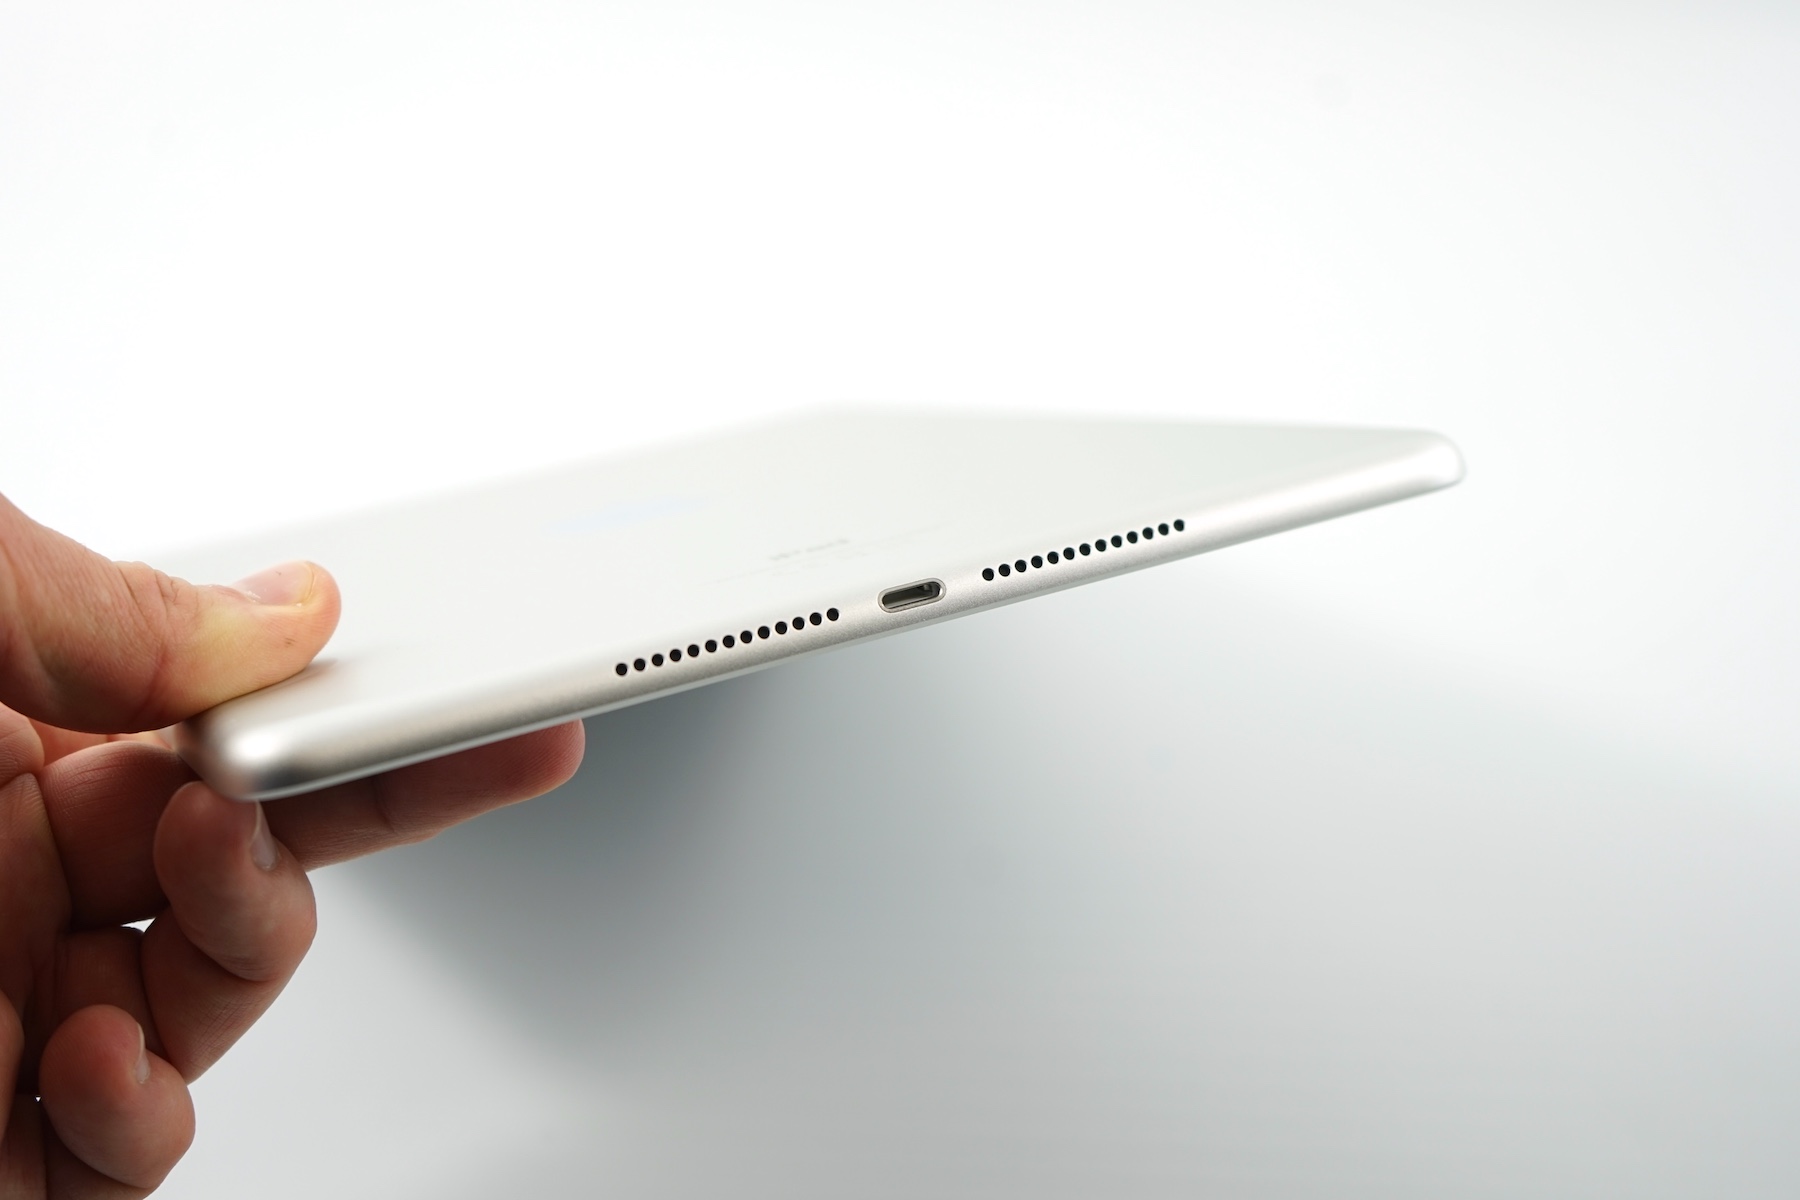
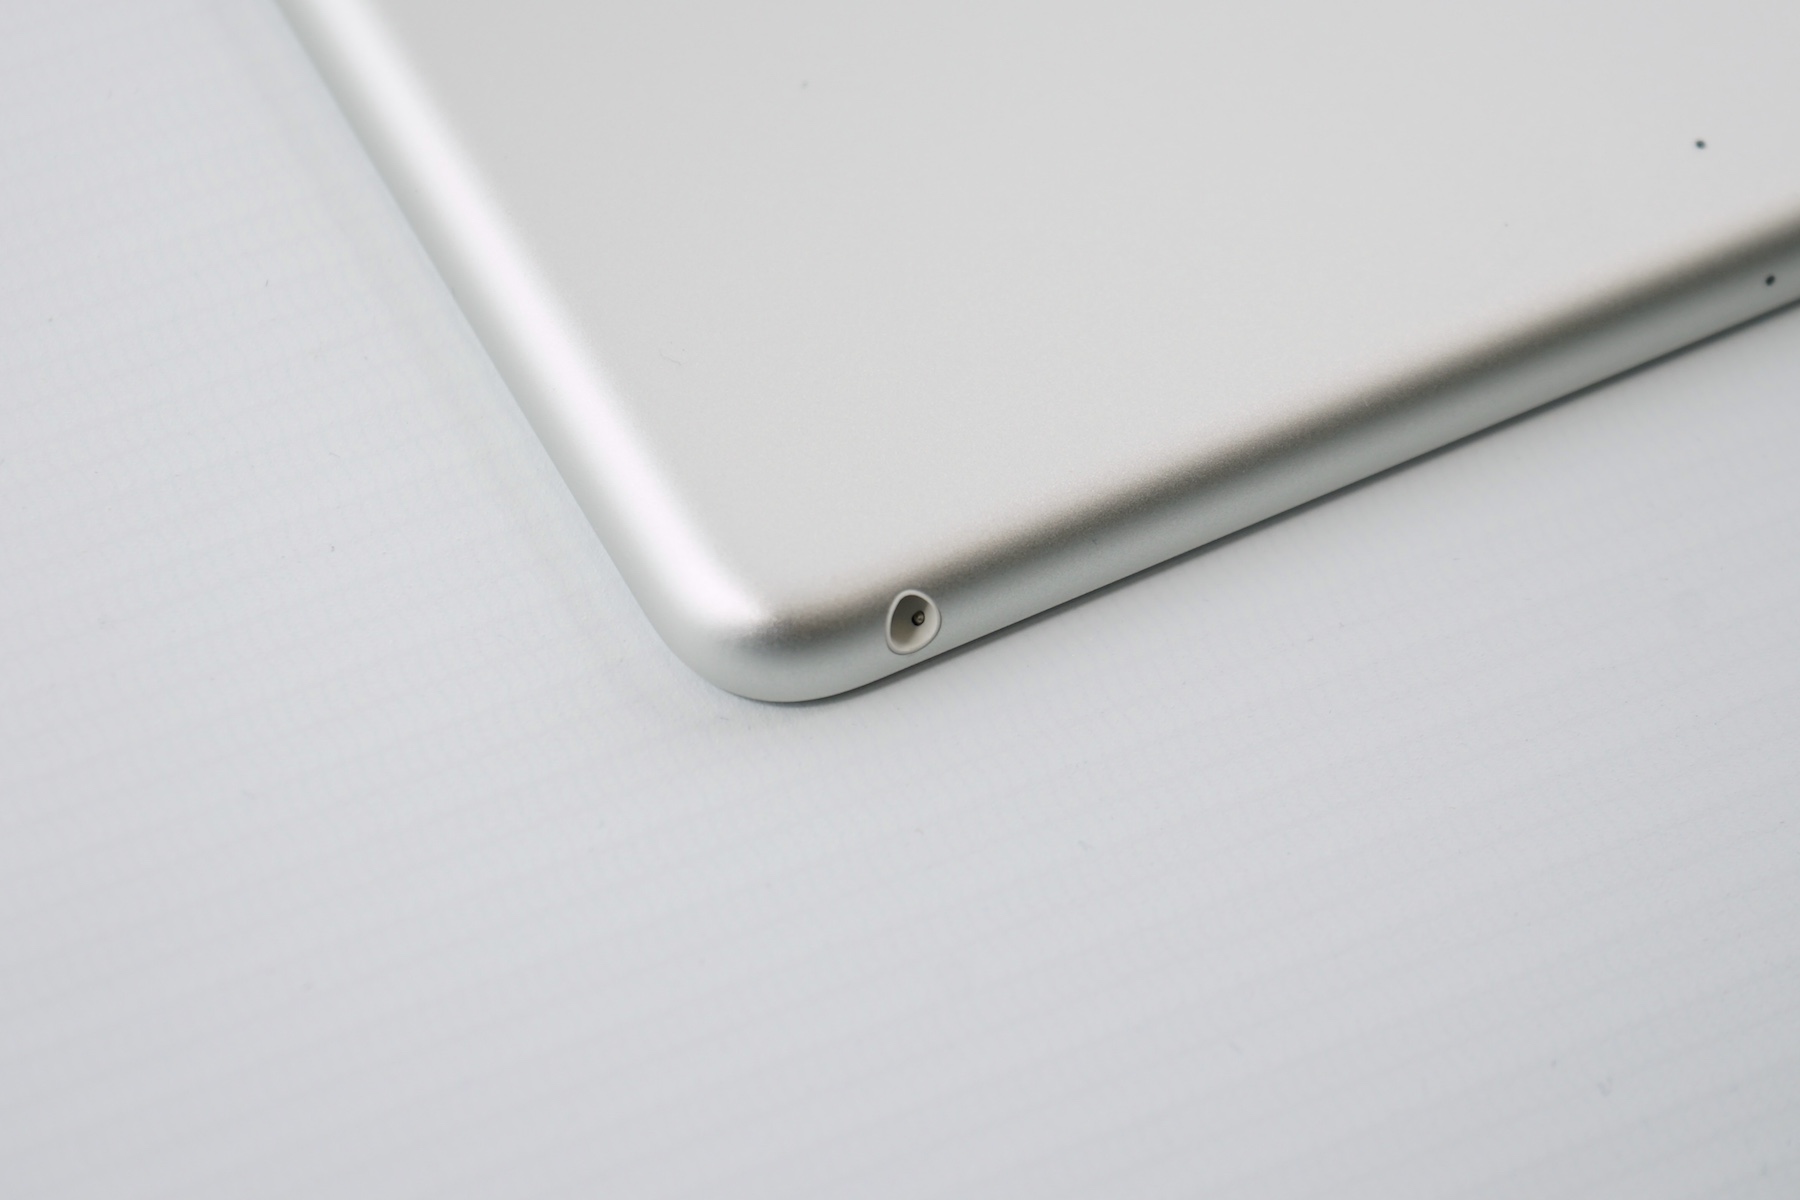
Except for the update from the Apple A9 processor to the A10 Fusion chip, the internals are pretty much the same. You still get the Lightning port for charging and data exchange at the bottom, and there is still a 3.5 mm stereo jack on the upper left. A switch for wireless audio transmission would have probably been too expensive in this price-sensitive education market.
The support for the Apple Pencil is a new feature. This means the active stylus from Apple not only works with the iPad Pro 10.5 (review) and the iPad Pro 12.9 (review), but it also now works with Apple's cheapest tablet. The price of $99 is high, but (less expensive) solutions from other manufacturers work as well. A compatible stylus from Logitech, for example, retails for 49 Euros (~$60).
A quick look at the different SKUs: The base model is equipped with Wi-Fi and 32 GB storage and is available in the colors Space Gray, Silver and Gold. The model with 128 GB storage retails for $429 and there will also be a 4G model for $459 or $559, respectively (with 32 or 128 GB storage). The optional Apple Care+ package costs $69 and also covers two "accidental repairs" within two years, each subject to a $49 service fee each. This means the repair of a broken display will "cost" $118. When and where is the new iPad available? You can order it right now from Apple (online and stores) and retailers should have it in stock soon. We do not expect any special iPad offerings soon, and retailers are usually not much cheaper than Apple.
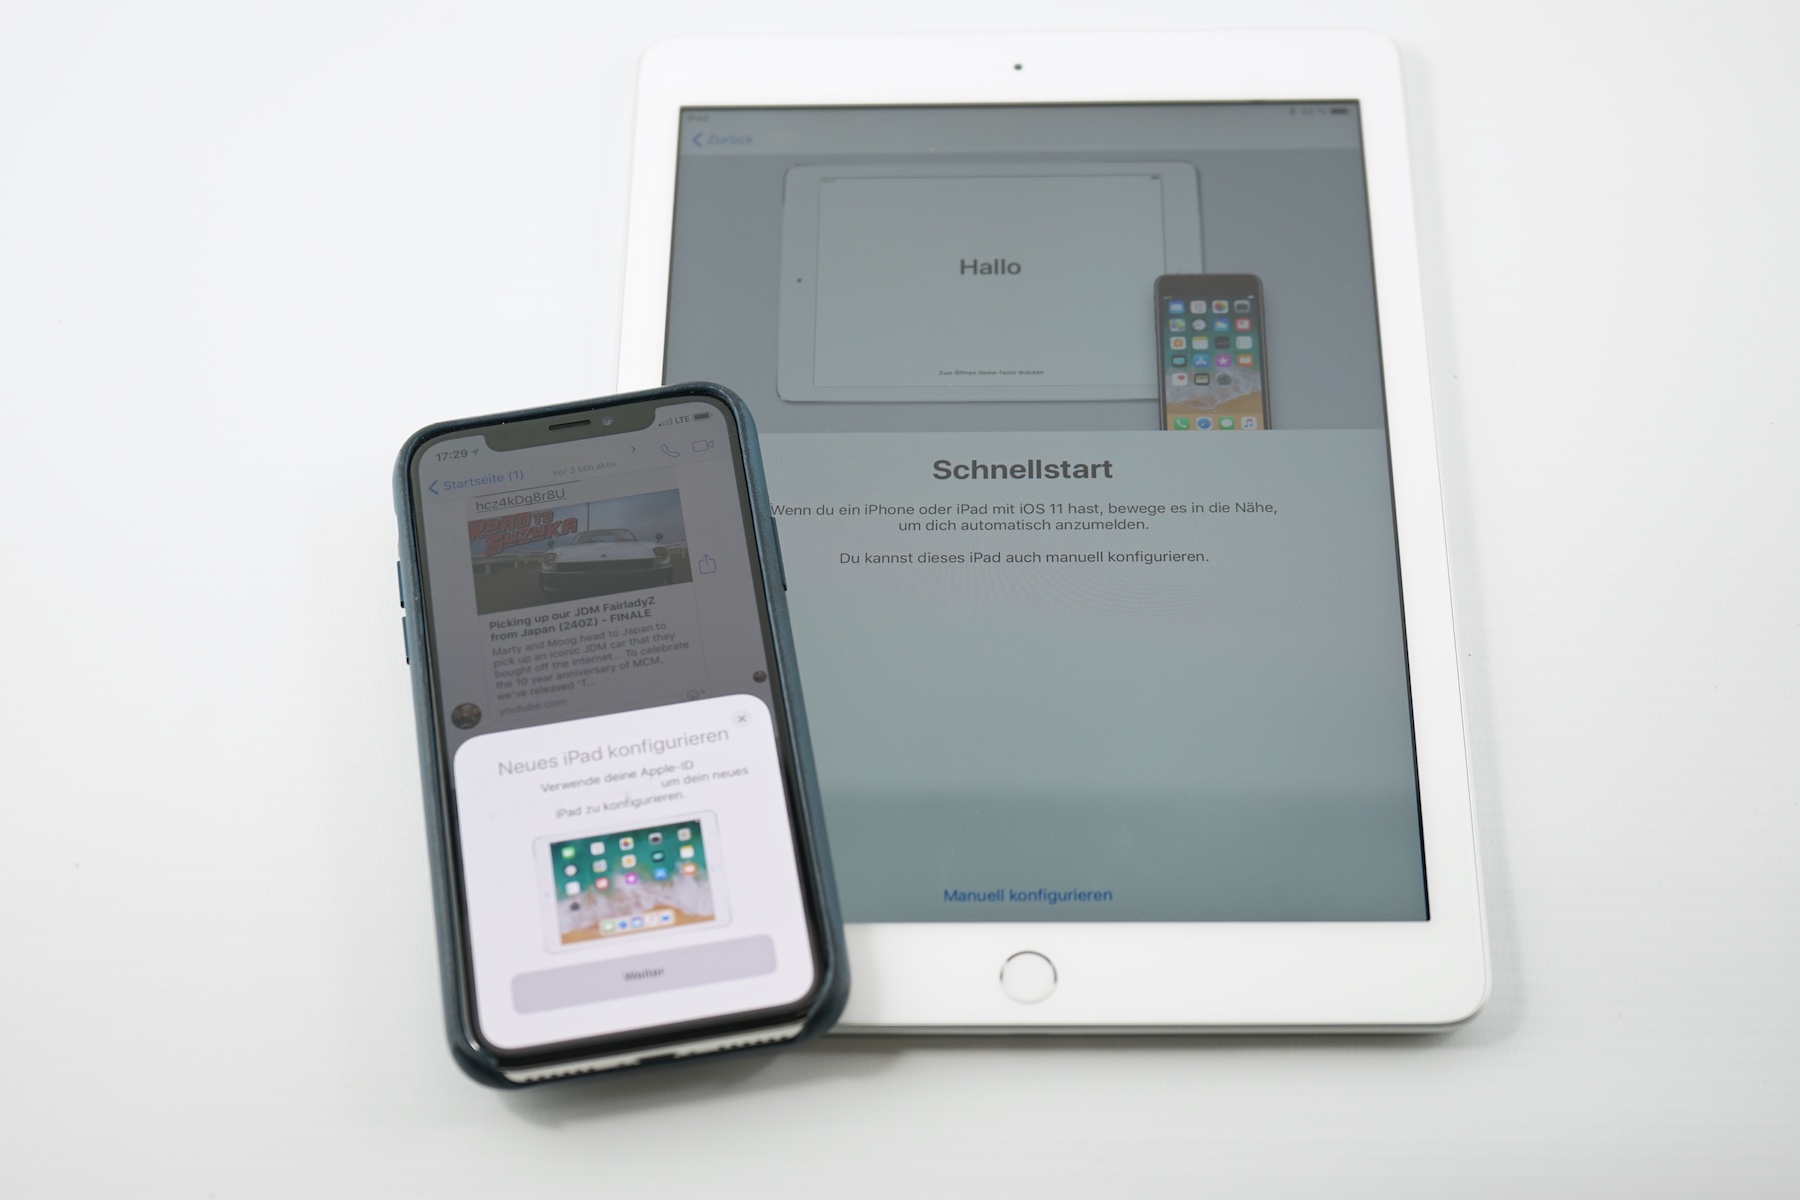
Software
The iPad is shipped with the current iOS 11.3 which was still brand-new at the time of the review, and we noticed some stability issues. Some games and benchmarks just crashed without an error message.
iOS still runs very well on the inexpensive iPad in general. Stutters on the UI are very rare (see linked video below).
Communication and GPS - Improvements for Wi-Fi and 4G
The communication modules appear to be identical at first, but we can determine improvements compared to last year's model in our Wi-Fi test (reference router Linksys EA8500). The iPad 6 with dual-band Wi-Fi and MIMO support manages 20 - 30% higher maximum transfer rates (send and receive), so the affordable iPad can close the gap and reaches the very good level of the iPad Pro siblings.
Apple increases the number of LTE bands from 21 to 23. The bands 27 and 30 are new, and the latter is particularly important for the U.S. Bluetooth is still supported in version 4.2.
Our test model is the Wi-Fi-only version, which does not support GPS location. You will have to get a model with 4G support if you plan on using the iPad for navigation purposes.
Cameras - Technology from the iPad Air or iPhone 5s, respectively
There is nothing new in terms of cameras, either. The hardware is identical to the previous models with an 8 MP sensor at the rear (f/2.4). It should still be the same sensor we know from the iPhone 5s. The front cam is a 1.2 MP sensor for selfies and video conferences or FaceTime HD, respectively, as Apple calls it.
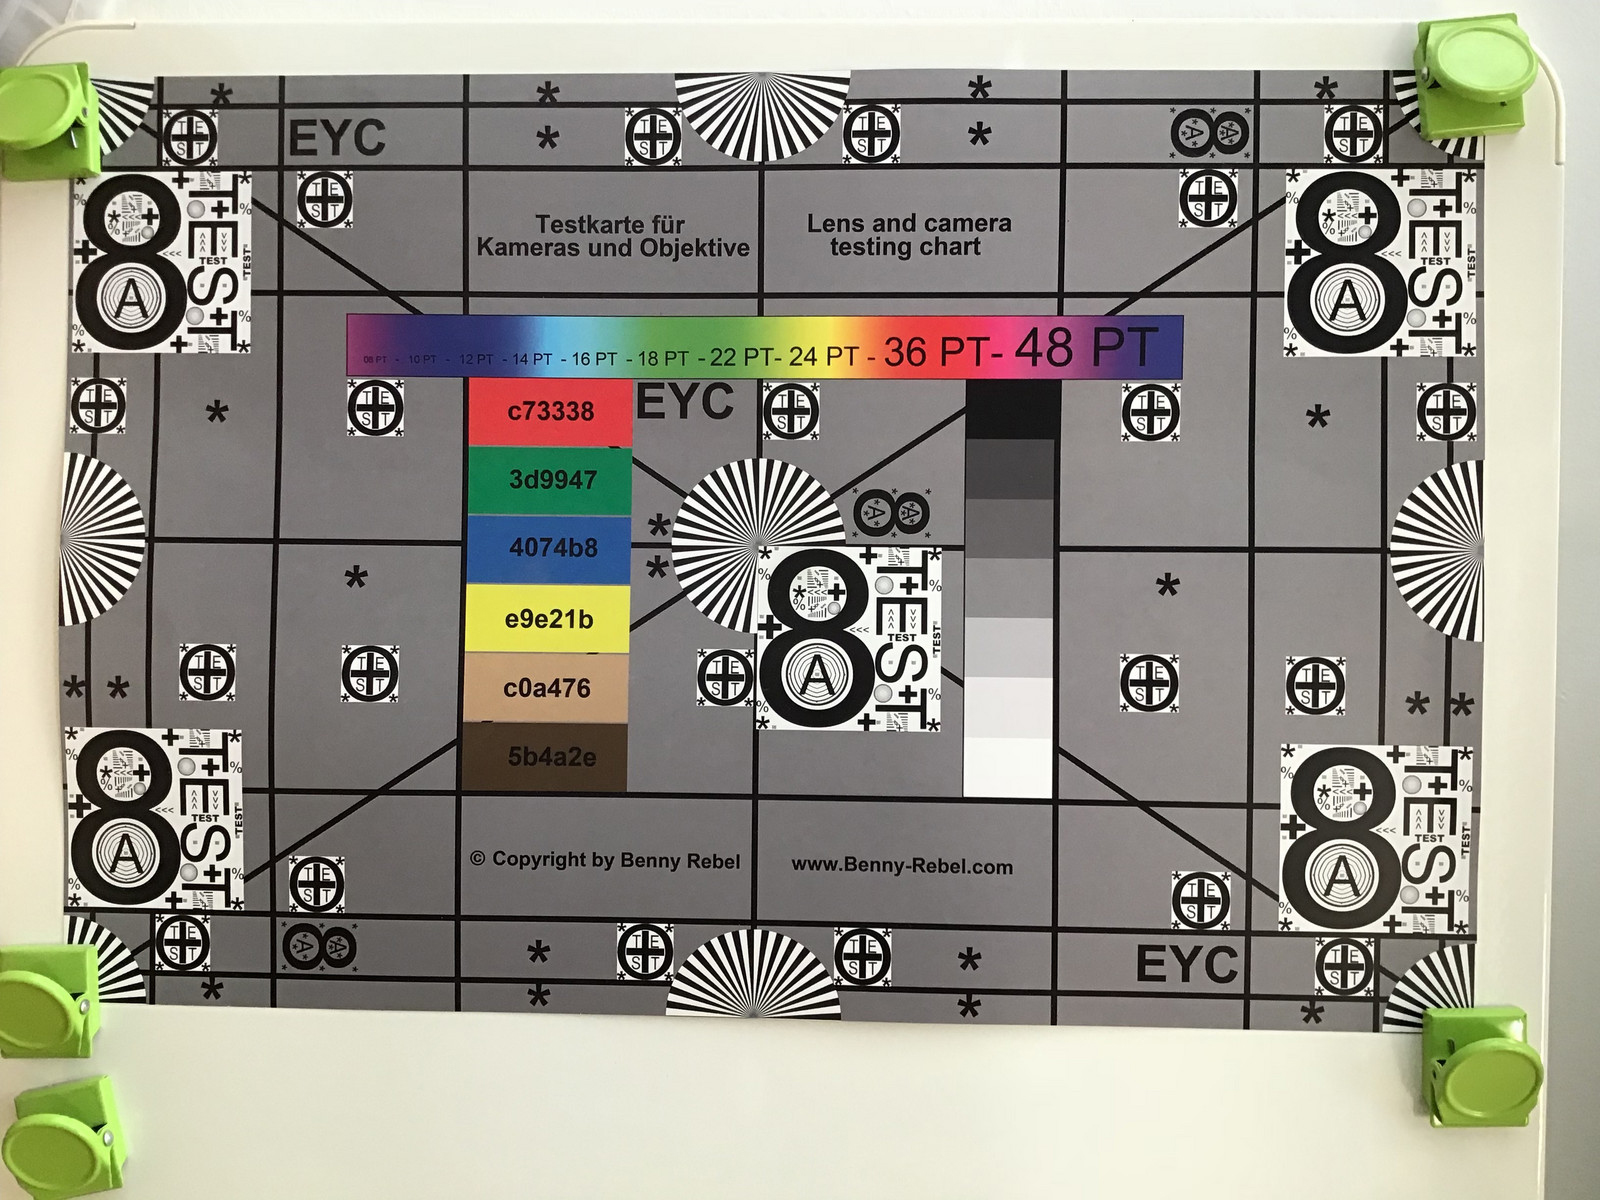
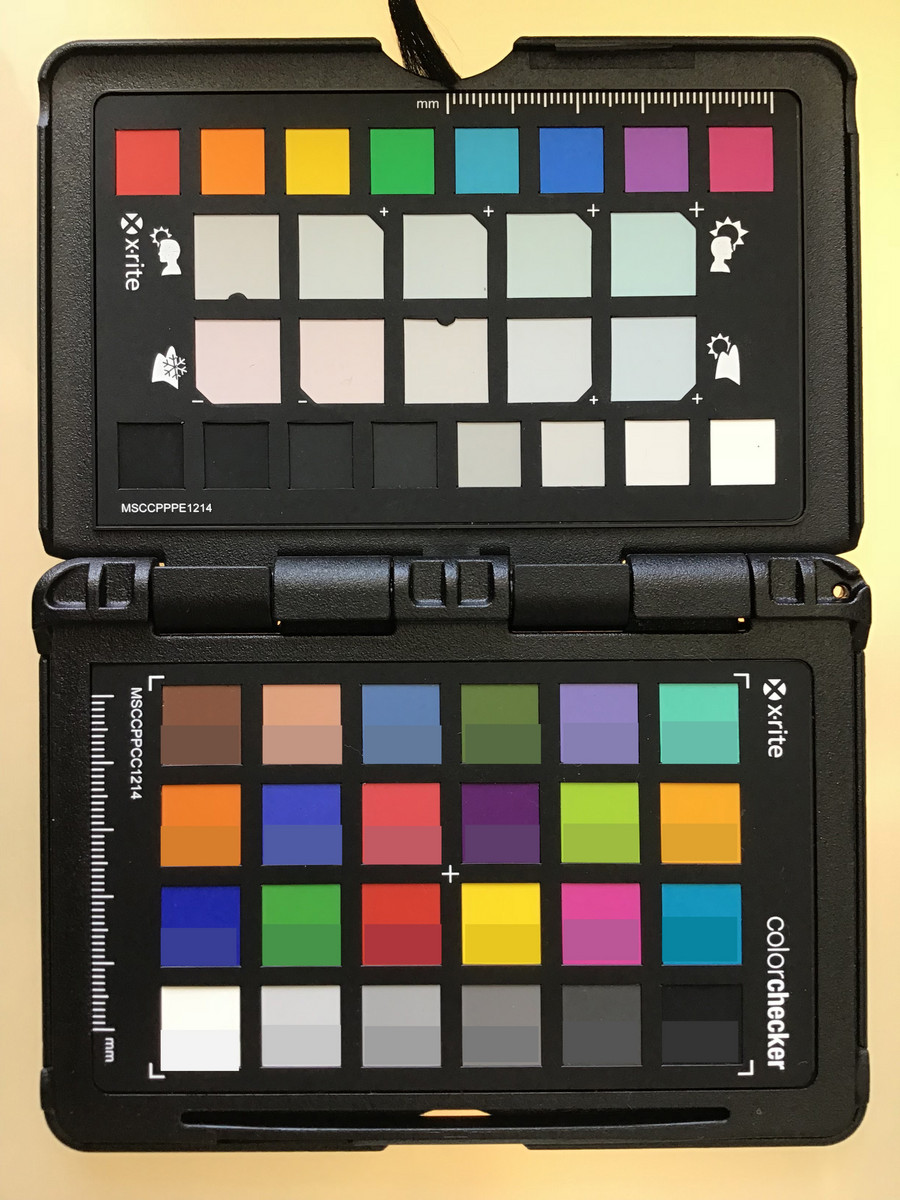
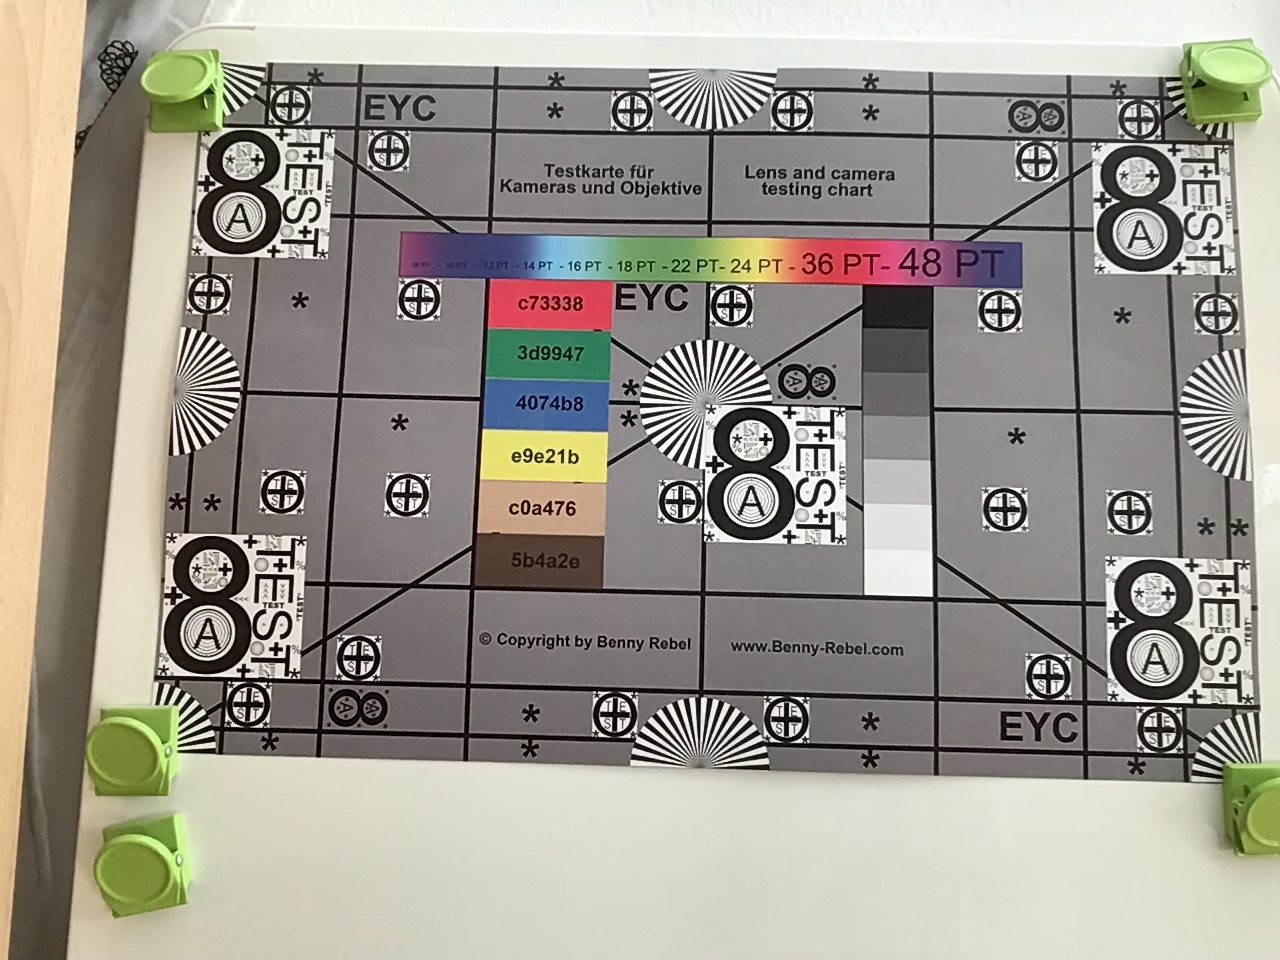
The rather outdated camera hardware still provides very good picture quality, at least in good lighting conditions. The main camera in particular can take sharp and high-contrast images. You will only start to notice drawbacks in terms of details and sharpness when you start to analyze picture details.


The analysis of the color accuracy of the main camera reveals slightly exaggerated colors, especially for yellow, red, and green. The same is true for the front camera, where we can also see problems for the presentation of white colors.

Input Devices & Handling
It is hard or basically impossible to find any new insights about the handling for a tablet, where the basic features did not change for years. Similar to its predecessors and the Apple smartphones, the 2018 iPad executes inputs quickly and reliably without noticeable or visible delays. This is also true for the login process via Touch ID fingerprint scanner inside the Home button.
The support for the Apple Pencil is a new feature. However, the latter is familiar and is already supported by the Pro models. The range of applications is greatly extended thanks to the Pencil, at least when you use the right applications. Among others, the Apple Pencil is supported by the apps Pages, Numbers, Keynote, and also Microsoft's Office app for iOS.
Retina Display - iPad 6 with proven technology
The Retina panel should be identical to the previous models. It features a resolution of 2048x1536 pixels (264 PPI) on a 9.7-inch screen. Apple still uses the 4:3 aspect ratio, which is a key difference compared to most Android tablet, which usually use widescreen panels. They have an advantage when it comes to watching videos or movies, but the 4:3 aspect ratio is usually a better choice for productive tasks like working with text documents, for example.
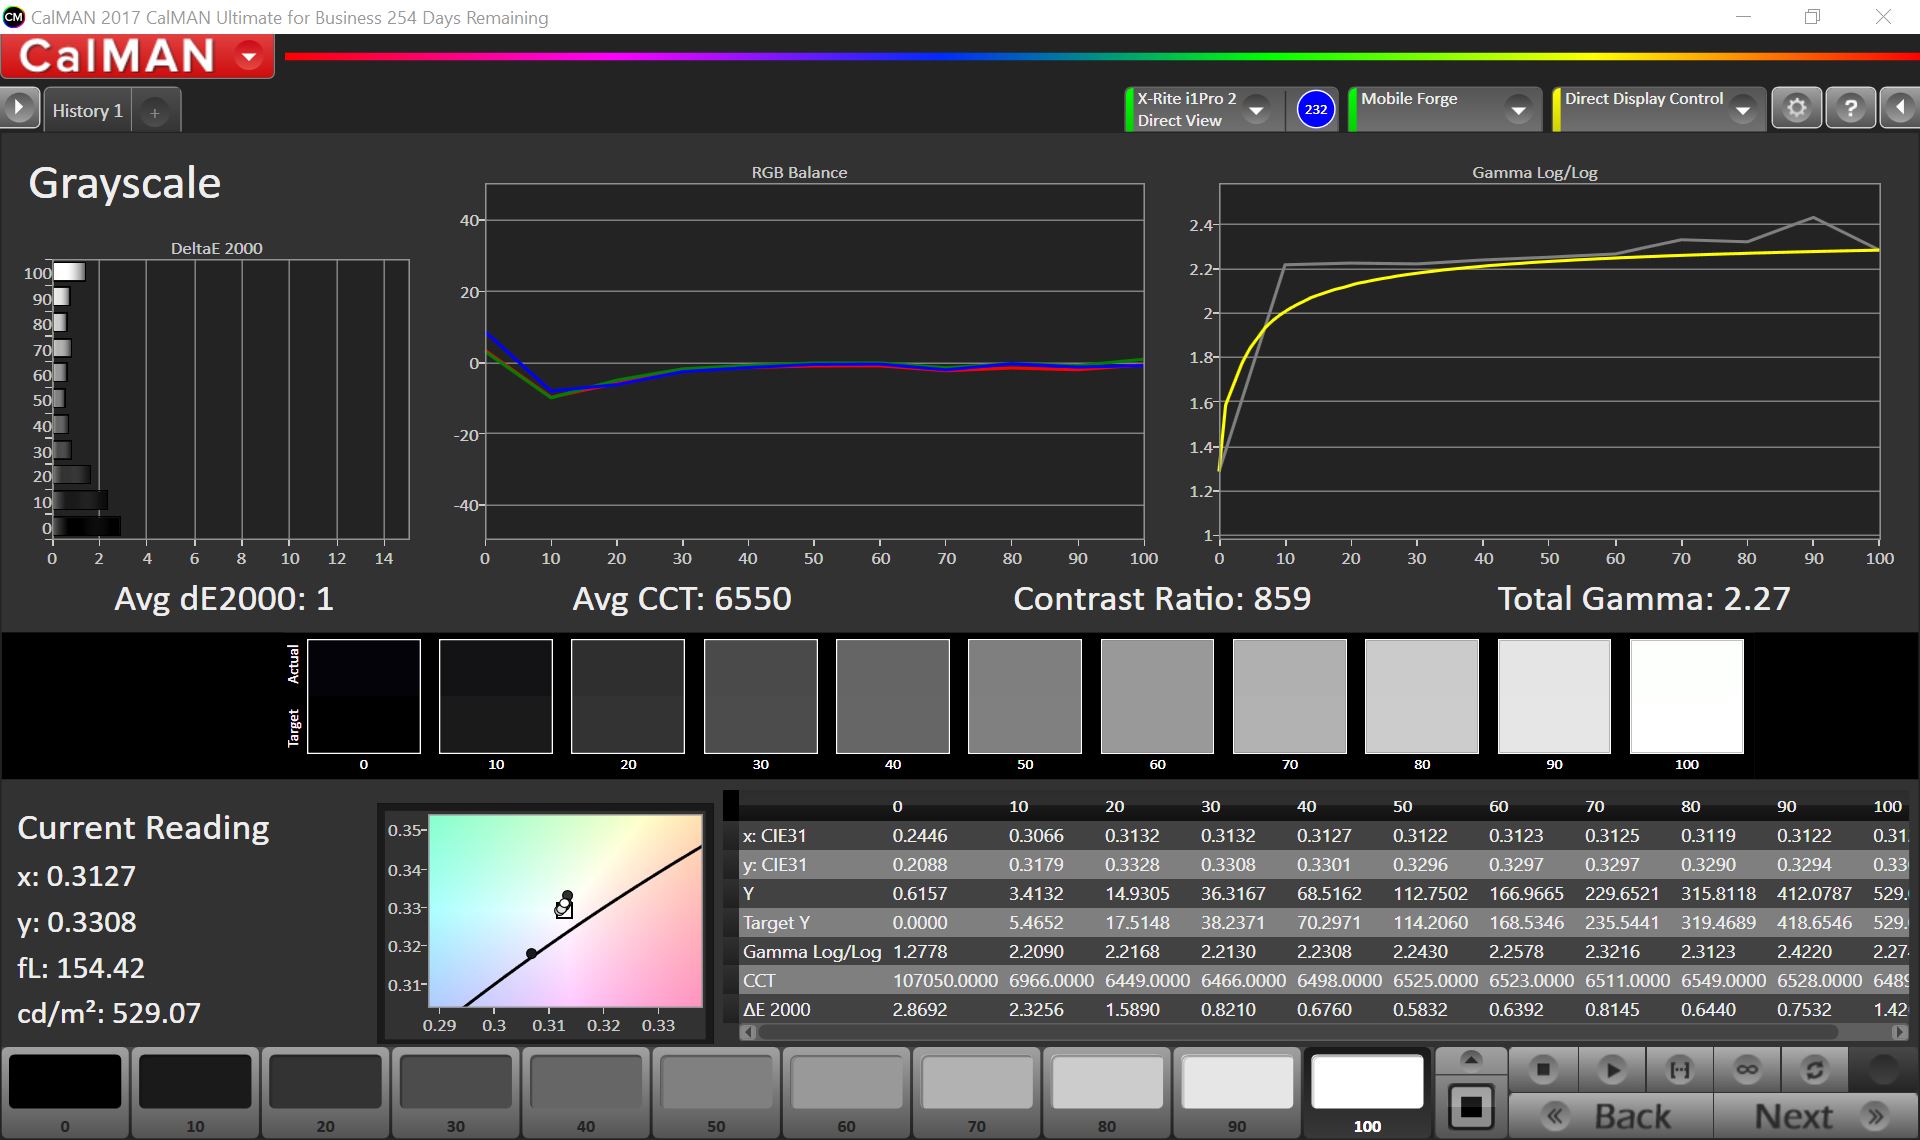
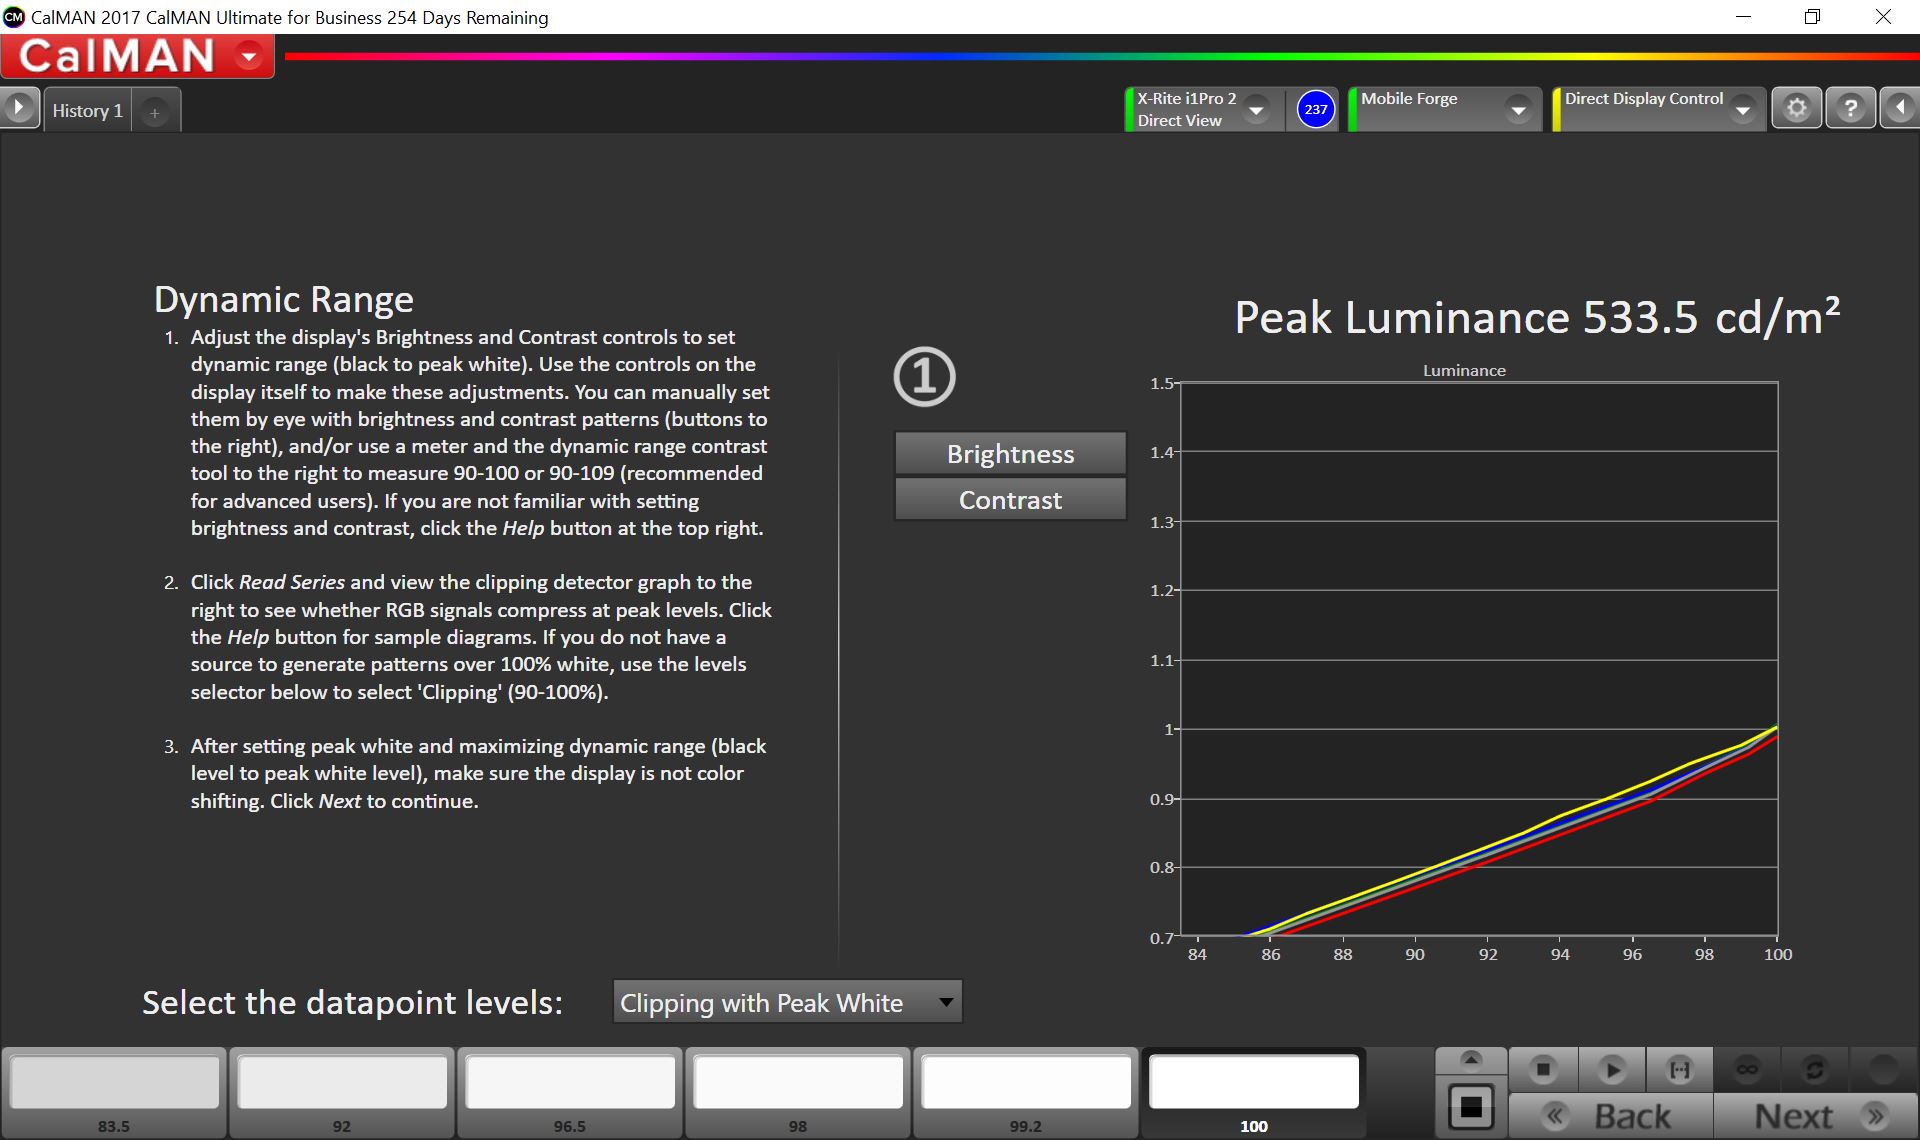
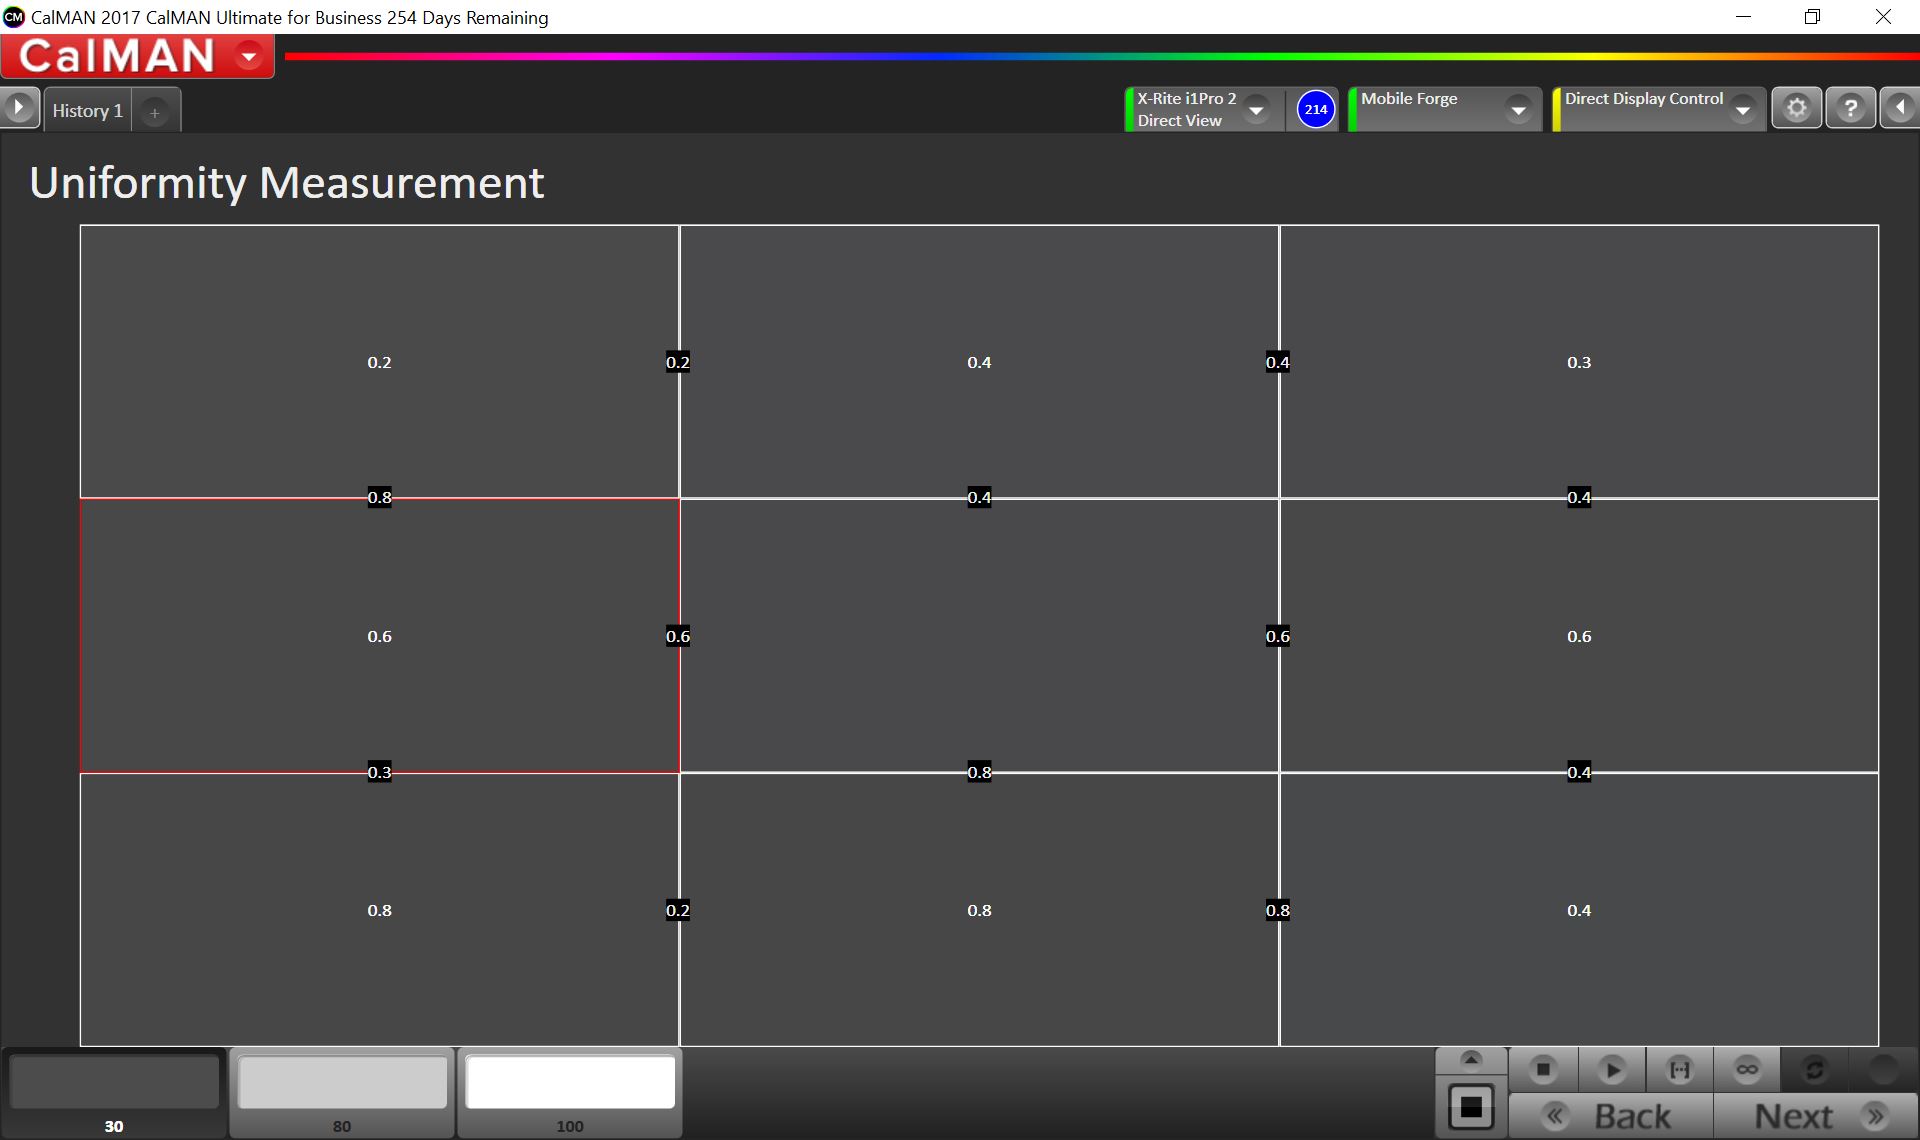
Our measurements show a small advantage for the 2018 iPad compared to the direct predecessor. Apple improved the luminance slightly and the grayscale performance is a little bit better as well. However, our test model has a slightly higher black value (0.61 cd/m²) than last year's iPad, which results in a lower contrast ratio of 869:1.
| |||||||||||||||||||||||||
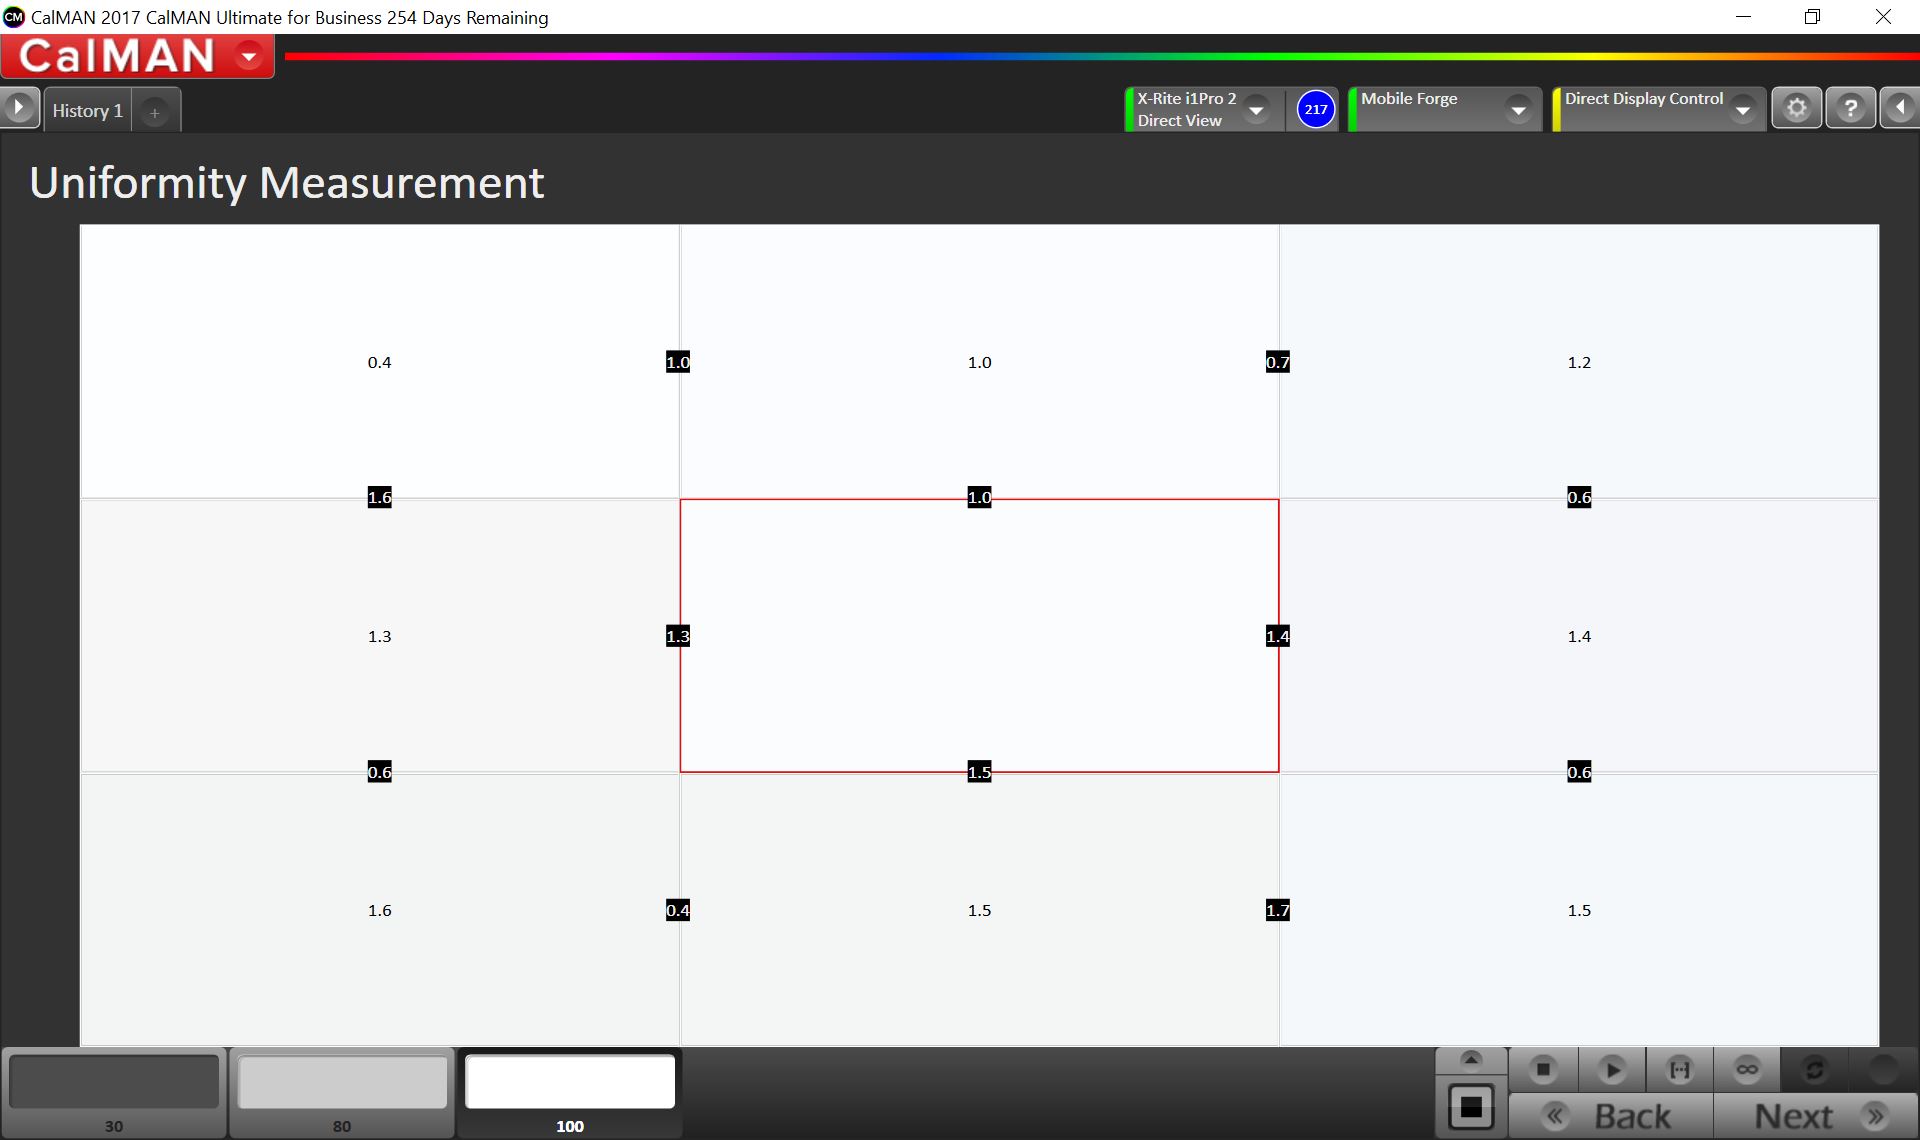
Brightness Distribution: 92 %
Center on Battery: 530 cd/m²
Contrast: 869:1 (Black: 0.61 cd/m²)
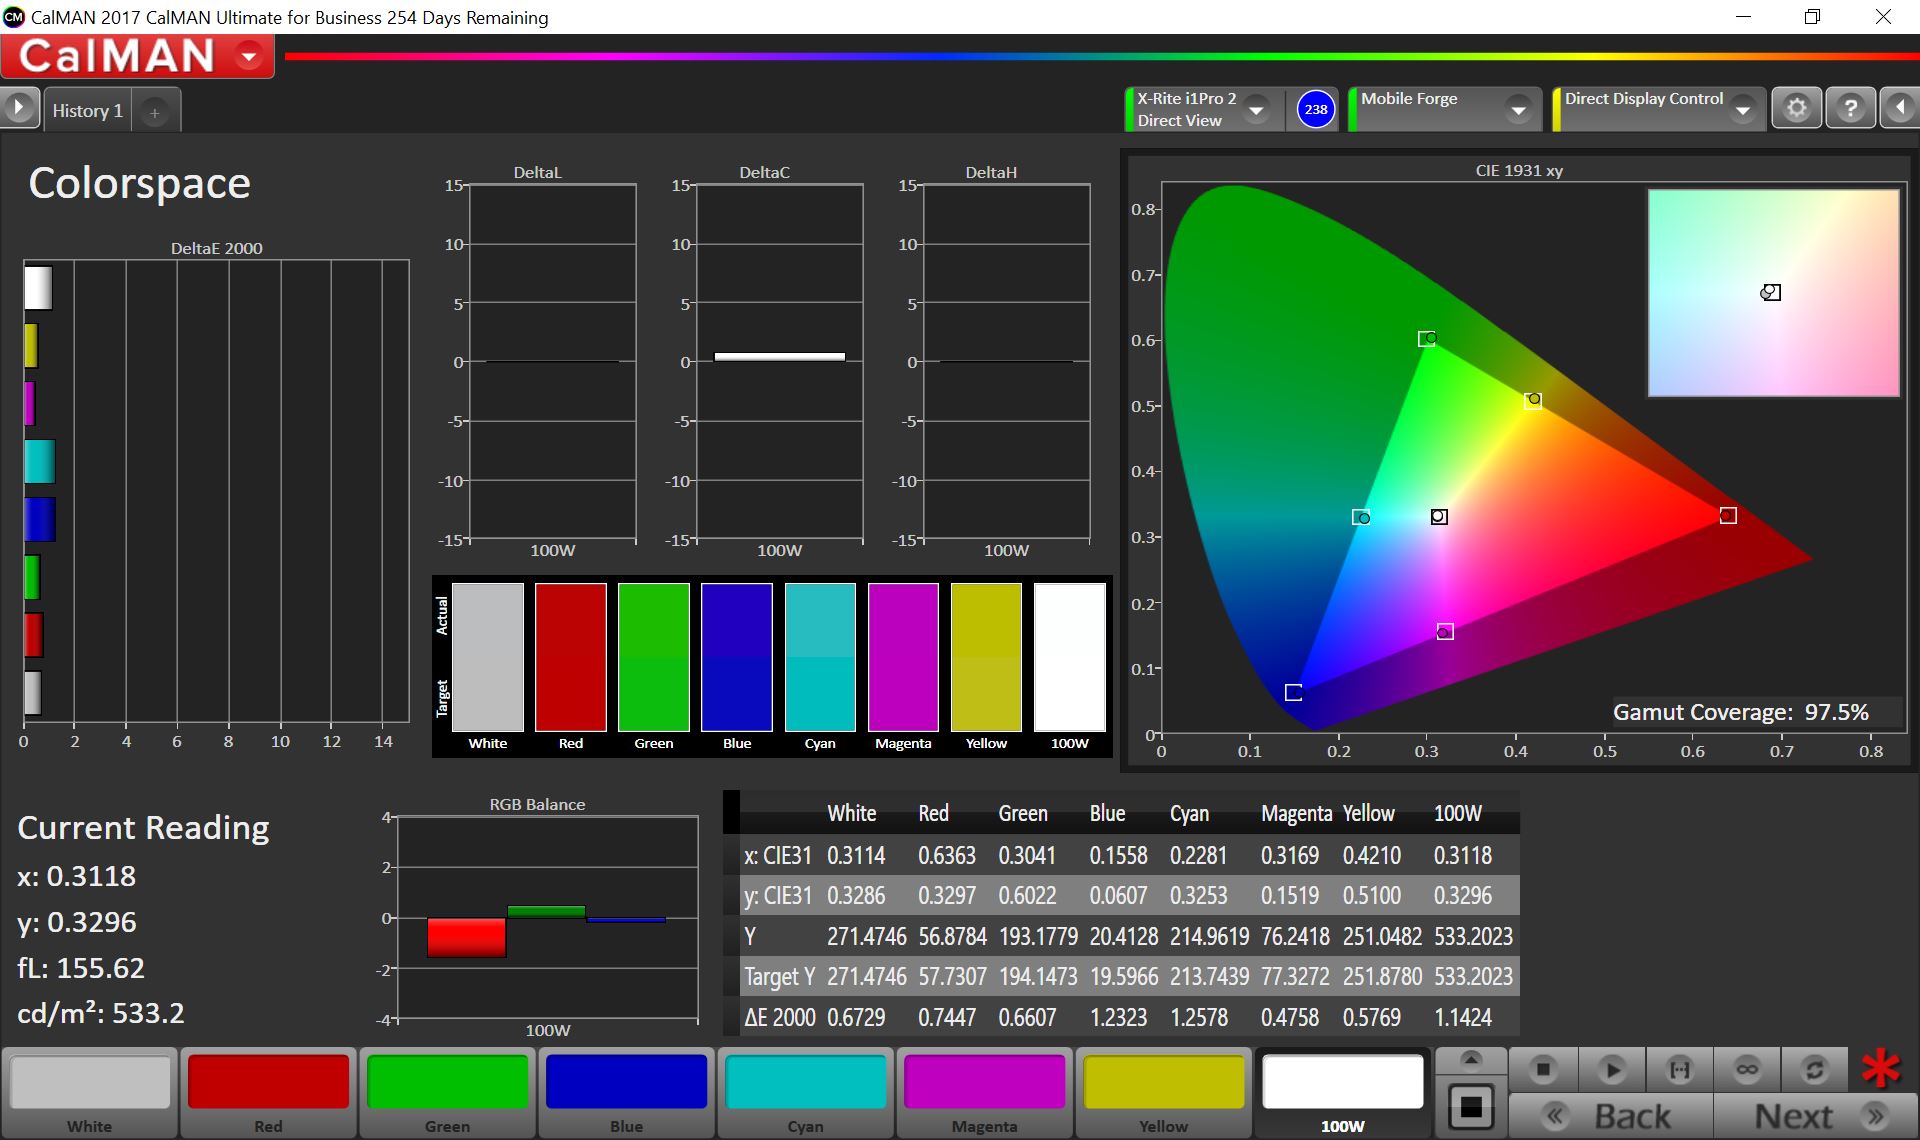
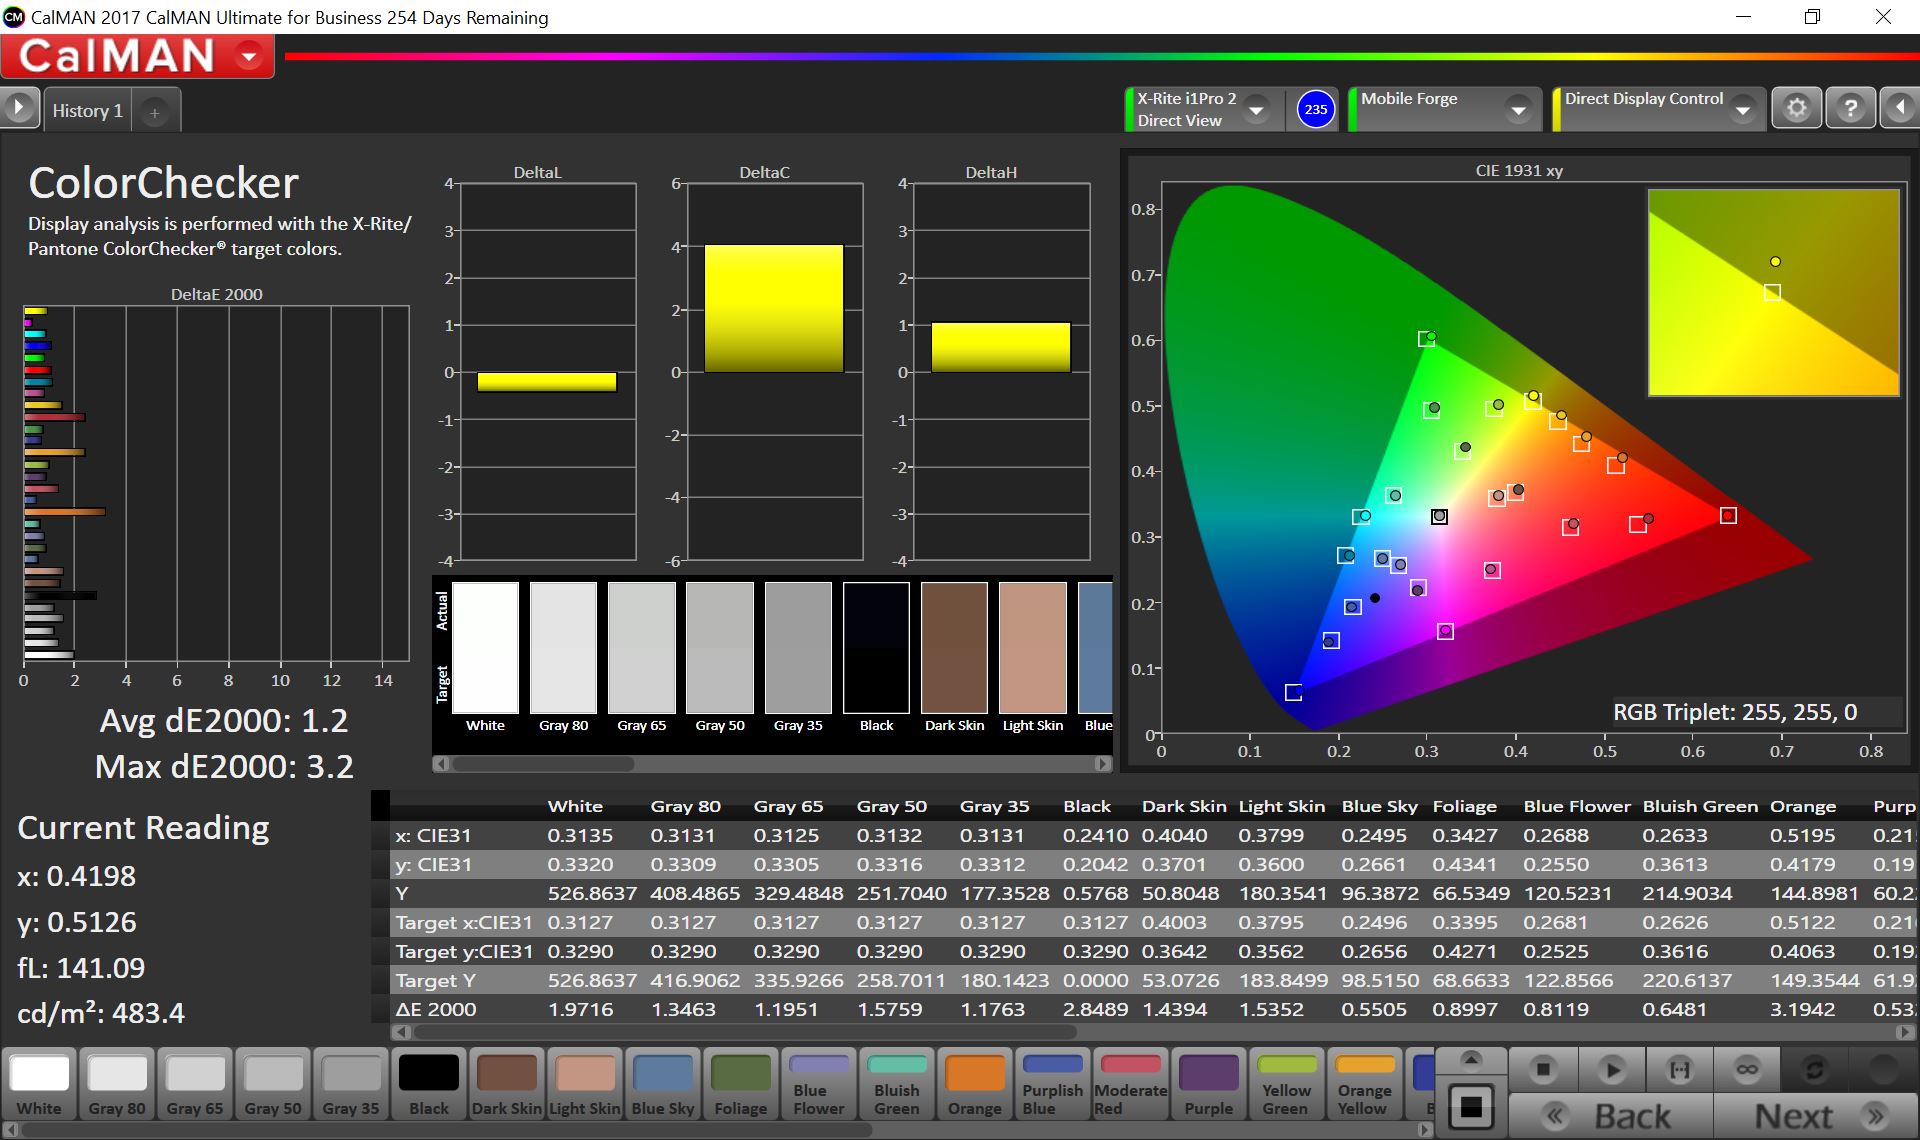
ΔE ColorChecker Calman: 1.2 | ∀{0.5-29.43 Ø4.73}
ΔE Greyscale Calman: 1 | ∀{0.09-98 Ø4.98}
97.5% sRGB (Calman 2D)
Gamma: 2.28
CCT: 6588 K
| Apple iPad 6 2018 IPS, 2048x1536, 9.7" | Apple iPad (2017) IPS, 2048x1536, 9.7" | Apple iPad Pro 10.5 2017 IPS, 2224x1668, 10.5" | Apple iPad Pro 12.9 2017 IPS, 2732x2048, 12.9" | Samsung Galaxy Tab S3 SM-T825 Super AMOLED, 2048x1526, 9.7" | Huawei MediaPad M5 10.8 IPS, 2560x1600, 10.8" | |
|---|---|---|---|---|---|---|
| Screen | -10% | -13% | 20% | -22% | -48% | |
| Brightness middle (cd/m²) | 530 | 514 -3% | 634 20% | 650 23% | 452 -15% | 382 -28% |
| Brightness (cd/m²) | 513 | 485 -5% | 625 22% | 614 20% | 468 -9% | 378 -26% |
| Brightness Distribution (%) | 92 | 88 -4% | 87 -5% | 90 -2% | 82 -11% | 92 0% |
| Black Level * (cd/m²) | 0.61 | 0.46 25% | 0.39 36% | 0.42 31% | 0.24 61% | |
| Contrast (:1) | 869 | 1117 29% | 1626 87% | 1548 78% | 1592 83% | |
| Colorchecker dE 2000 * | 1.2 | 1.4 -17% | 1.9 -58% | 1 17% | 1.8 -50% | 2.8 -133% |
| Colorchecker dE 2000 max. * | 3.2 | 2.9 9% | 3.9 -22% | 1.9 41% | 4 -25% | 6 -88% |
| Greyscale dE 2000 * | 1 | 2.1 -110% | 2.8 -180% | 1.5 -50% | 1.2 -20% | 3.5 -250% |
| Gamma | 2.28 96% | 2.22 99% | 2.26 97% | 2.25 98% | 2.11 104% | 2.33 94% |
| CCT | 6588 99% | 6647 98% | 7027 93% | 6734 97% | 6500 100% | 6903 94% |
| Color Space (Percent of AdobeRGB 1998) (%) | 82.32 | |||||
| Color Space (Percent of sRGB) (%) | 99.06 |
* ... smaller is better
We did not detect PWM regulation of the background illumination. However, the display flickered at a very high frequency of 23.4 kHz at the lowest luminance. This might also be caused by external factors during the measurement. Even sensitive users should not have any problems with the iPad.
Screen Flickering / PWM (Pulse-Width Modulation)
| Screen flickering / PWM not detected |  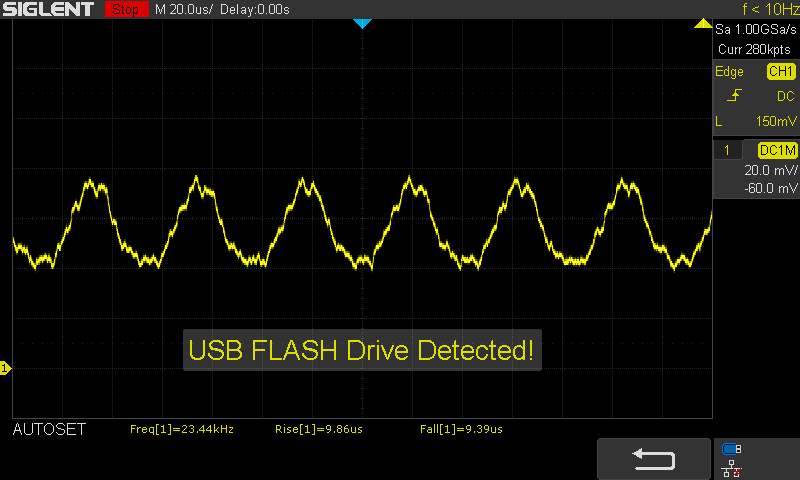 | ||
In comparison: 52 % of all tested devices do not use PWM to dim the display. If PWM was detected, an average of 7857 (minimum: 5 - maximum: 343500) Hz was measured. | |||
The new iPad shows slightly more accurate colors in the ColorChecker test, but the improvement is bigger for the grayscale. The DeltaE drops from 2.1 to 1.0 for the latest iPad model. However, this is not a visible advantage, because it is very hard to see any differences with the naked eye when the DeltaE value is below 3.0.

Display Response Times
| ↔ Response Time Black to White | ||
|---|---|---|
| 25.9 ms ... rise ↗ and fall ↘ combined | ↗ 14.4 ms rise | 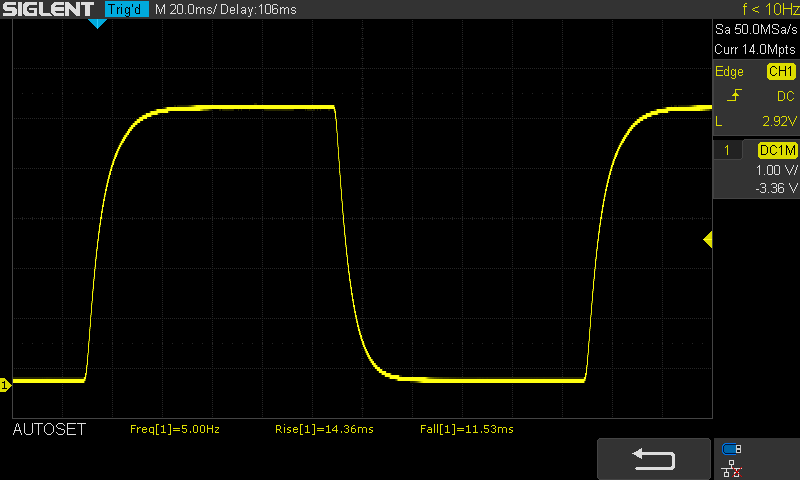 |
| ↘ 11.5 ms fall | ||
| The screen shows relatively slow response rates in our tests and may be too slow for gamers. In comparison, all tested devices range from 0.1 (minimum) to 240 (maximum) ms. » 62 % of all devices are better. This means that the measured response time is worse than the average of all tested devices (19.9 ms). | ||
| ↔ Response Time 50% Grey to 80% Grey | ||
| 26.4 ms ... rise ↗ and fall ↘ combined | ↗ 17.7 ms rise | 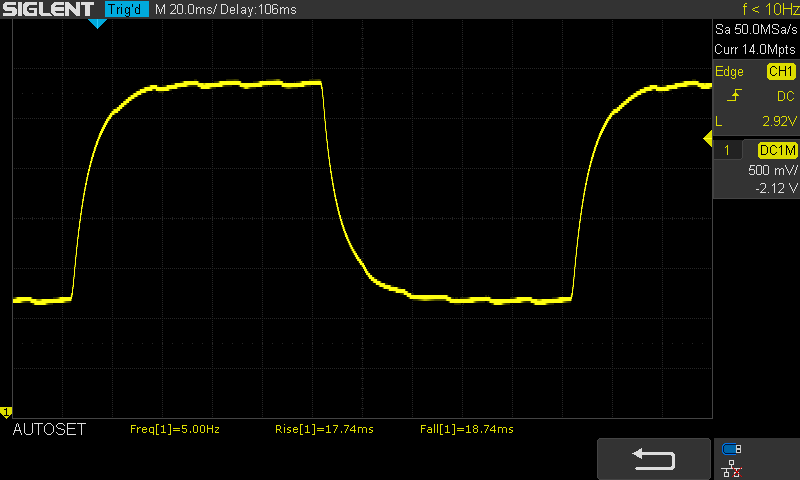 |
| ↘ 18.7 ms fall | ||
| The screen shows relatively slow response rates in our tests and may be too slow for gamers. In comparison, all tested devices range from 0.165 (minimum) to 636 (maximum) ms. » 36 % of all devices are better. This means that the measured response time is better than the average of all tested devices (31.2 ms). | ||
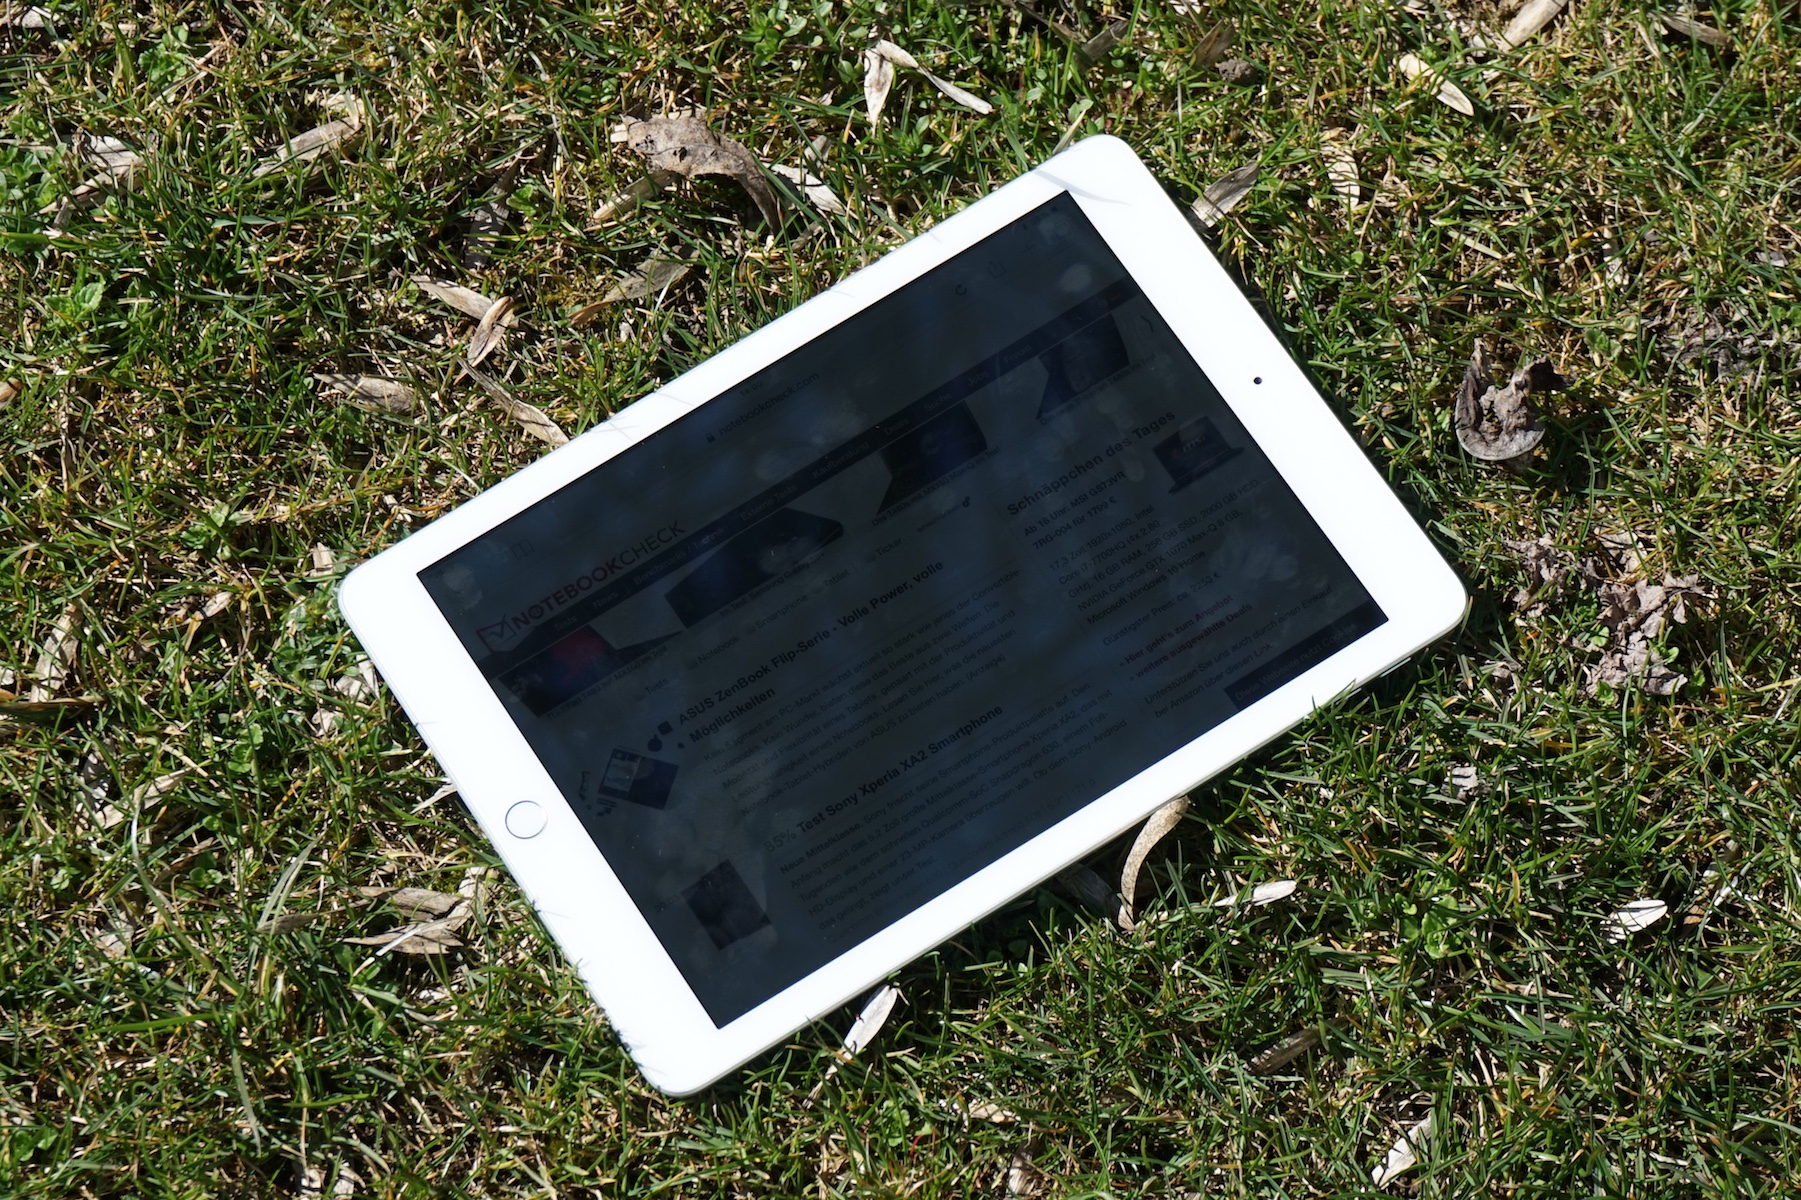
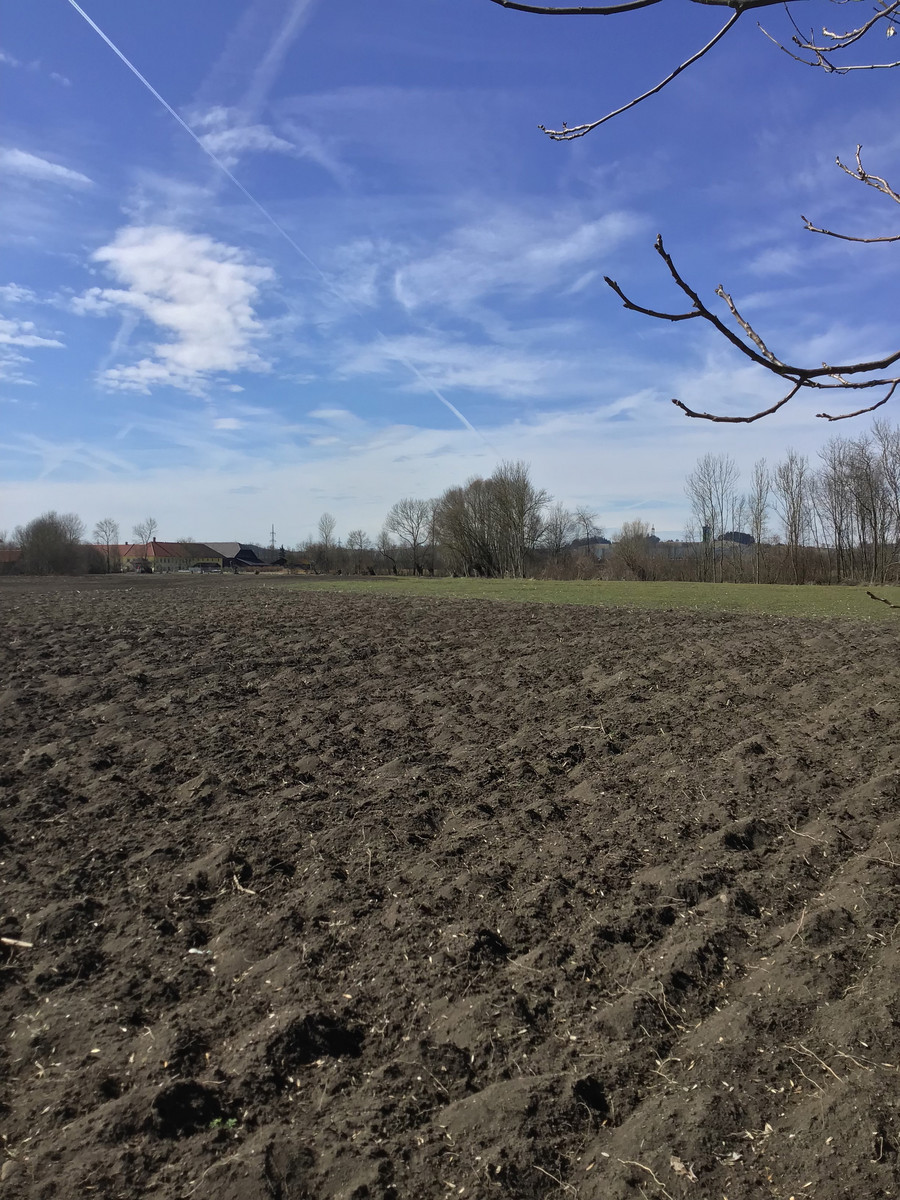
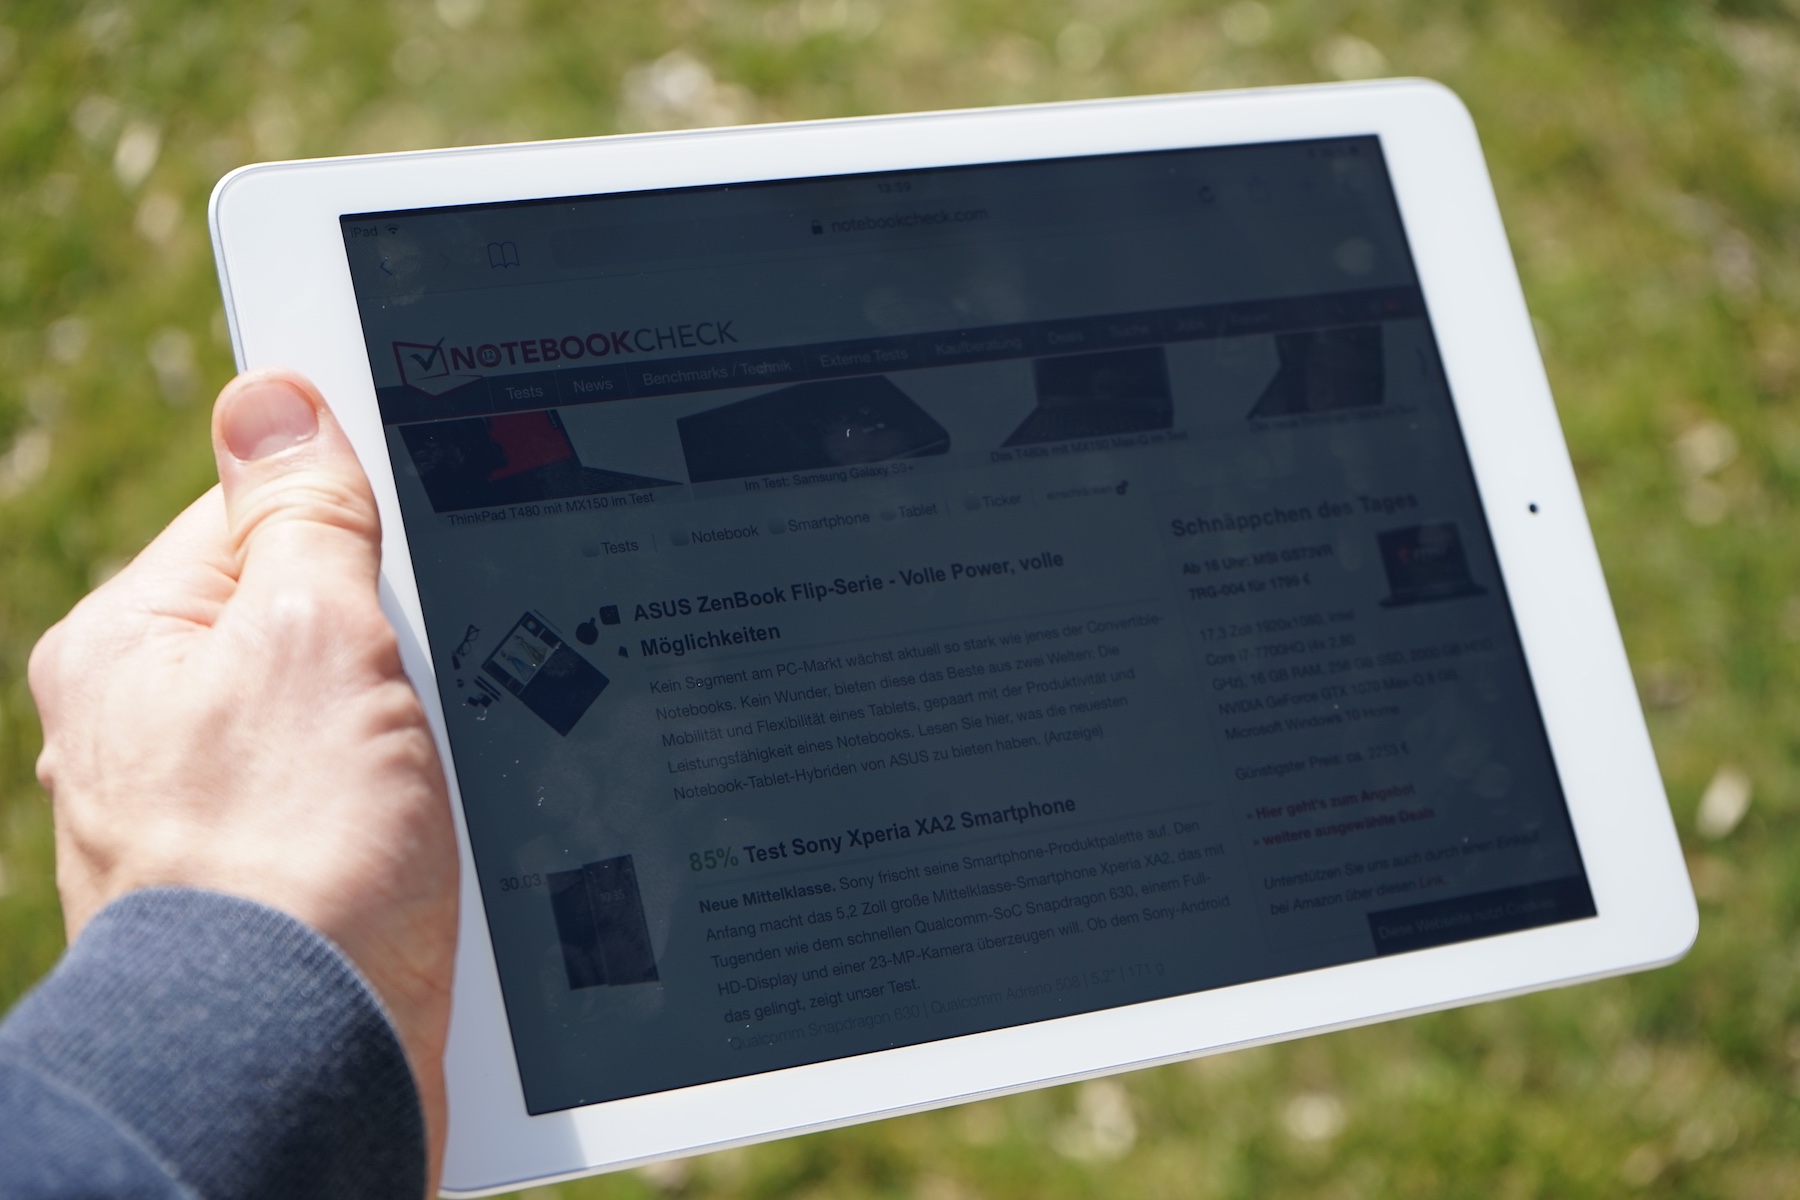
You can also see the display content very well under sunlight (in this case spring, clear sky) thanks to the high maximum luminance. The reflections can be annoying depending on the viewing angle, but you should not have any problems in the shade. Apple products used in the sun also have the problem with darker displays once the device gets too warm. We did not test it with the iPad but noticed it quite often with the iPhone 7 (same SoC) at the beach.
Performance - Improvement thanks to Apple A10 Fusion chip
We are finally in a section where we can talk about news, at least when it comes to the latest iPad. Apple removes the old Apple A9 SoC and uses a new chip for the current iPad. It is an Apple A10 Fusion, a quad-core SoC that debuted in the iPhone 7 and 7 Plus. But wait, they launched almost two years ago, so the iPad is still a recycling product for the chip.
Well, actually things aren't that bad, as is shown by our benchmarks. Apple scores good results across the board with the Apple A10 CPU. The single-core result in Geekbench 4.1/4.2 is 3499 points and therefore just 10% behind the Pro models with the A10X Fusion CPU. The difference is bigger in the multi-core test, where the Pro models are more than 50% faster. It seems the Apple A10 CPU cannot utilize all of its four cores in the current iPad; it can only use two. It is about 20 - 40% slower than the Pro models in the 3DMarks, and the Apple iPhone 7 with the same SoC is on a similar level in the benchmarks.
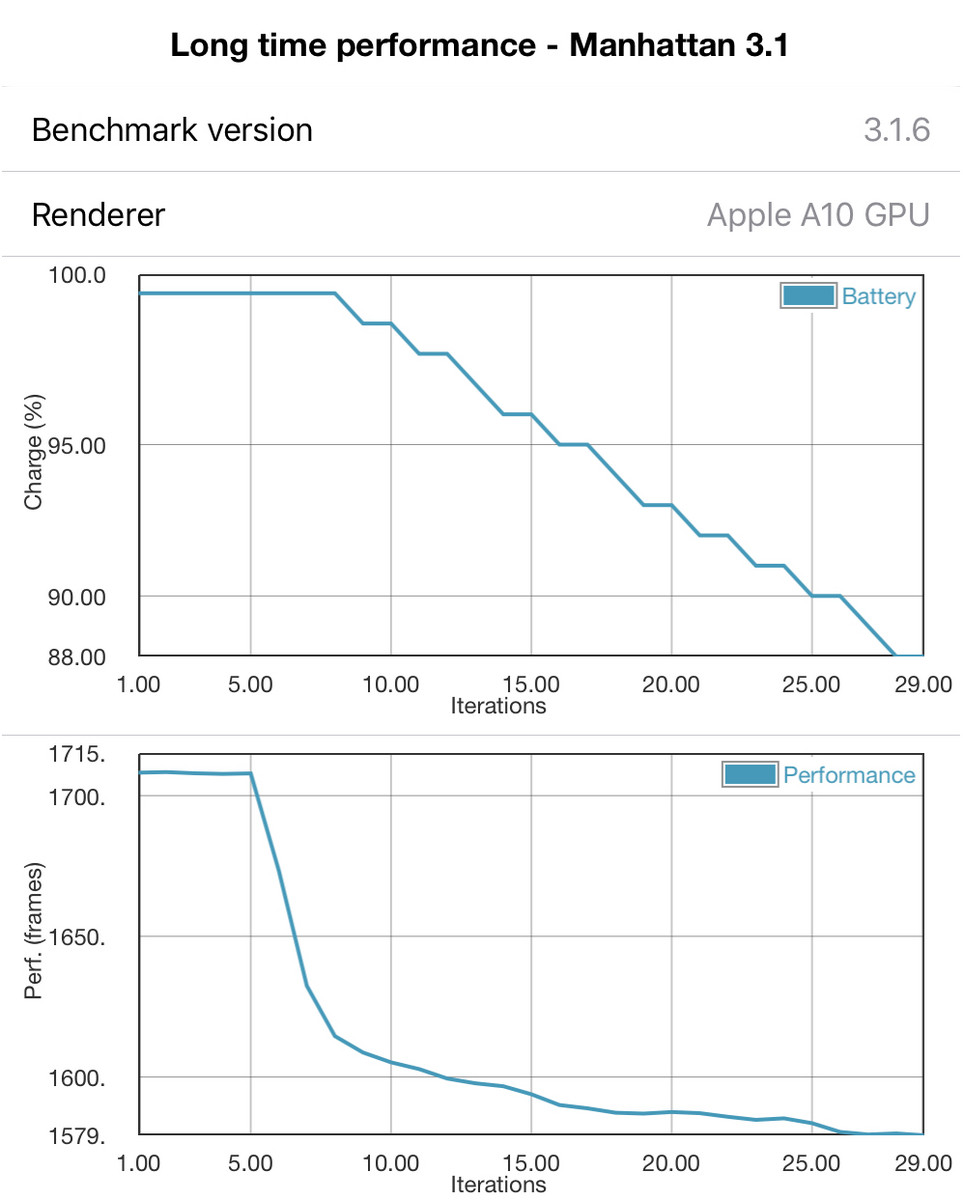
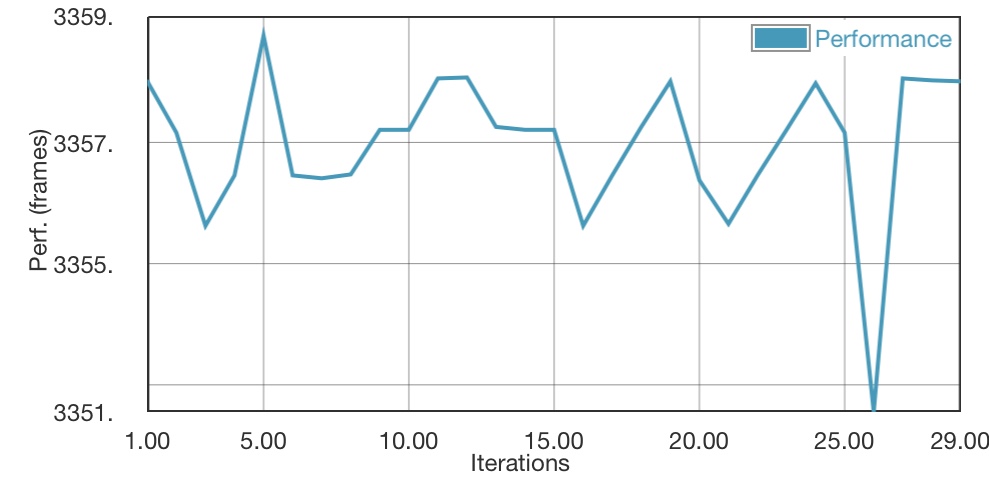
We can only see performance deficits caused by the passive cooling solution in demanding applications. The Manhattan 3.1 test results drop by about 8% over the course of 30 iterations with a big drop after the fifth run. The less challenging T-Rex test on the other hand does not lose any performance over 30 runs.
| Basemark X 1.1 | |
| Medium Quality | |
| Samsung Galaxy Tab S3 SM-T825 | |
| Samsung Galaxy Tab S3 SM-T825 | |
| High Quality | |
| Samsung Galaxy Tab S3 SM-T825 | |
| Basemark ES 3.1 / Metal - offscreen Overall Score | |
| Average of class Tablet (255 - 5784, n=7, last 2 years) | |
| Apple iPad 6 2018 | |
| Apple iPhone 7 | |
| Apple iPhone 7 | |
| Average Apple A10 Fusion (1059 - 1693, n=5) | |
| Apple iPad (2017) | |
| Samsung Galaxy Tab S3 SM-T825 | |
The iPad 6 is usually slightly ahead of the iPhone 7 in the browser benchmarks, but it is still significantly slower than the Pro models, even though the difference is smaller compared to the CPU and GPU benchmarks. The best devices in this ranking are Apple's latest iPhones with the new Apple A11 Bionic SoC.
| Octane V2 - Total Score | |
| Average of class Tablet (763 - 138481, n=75, last 2 years) | |
| Apple iPhone X (IOS 11.1.2) | |
| Apple iPhone 8 Plus | |
| Apple iPhone 8 | |
| Apple iPad Pro 12.9 2017 (Safari Mobile 10) | |
| Apple iPad Pro 10.5 2017 (Safari Mobile 10) | |
| Apple iPad 6 2018 (Safari Mobile 11.3) | |
| Average Apple A10 Fusion (19783 - 27967, n=5) | |
| Apple iPhone 7 (Safari Mobile 10.0) | |
| Apple iPad (2017) | |
| Apple iPad Mini 4 (Safari iOS 9) | |
| Samsung Galaxy Tab S3 SM-T825 (Samsung Browser 5.2) | |
| Huawei MediaPad M5 10.8 (Chrome 65) | |
| Samsung Galaxy Tab Active 2 | |
| Huawei MediaPad M2 10 inch (Chrome 49) | |
| WebXPRT 2015 - Overall | |
| Apple iPhone 8 Plus | |
| Apple iPhone 8 | |
| Apple iPhone X (Safari Mobile 11.0) | |
| Apple iPad Pro 10.5 2017 (Safari Mobile 10) | |
| Apple iPad Pro 12.9 2017 (Safari Mobile 10) | |
| Apple iPad (2017) | |
| Apple iPhone 7 (Safari Mobile 10.0) | |
| Average Apple A10 Fusion (200 - 204, n=3) | |
| Apple iPad 6 2018 (Safari Mobile 11.3) | |
| Apple iPad Mini 4 (Safari iOS 9) | |
| Samsung Galaxy Tab S3 SM-T825 (Samsung Browser 5.2) | |
| Huawei MediaPad M5 10.8 (Chrome 65) | |
| Huawei MediaPad M2 10 inch (Chrome 49) | |
| Samsung Galaxy Tab Active 2 | |
| JetStream 1.1 - 1.1 Total | |
| Apple iPhone X (IOS 11.1.1) | |
| Apple iPhone 8 Plus | |
| Apple iPhone 8 | |
| Apple iPad Pro 12.9 2017 (Safari Mobile 10) | |
| Apple iPad Pro 10.5 2017 (Safari Mobile 10) | |
| Average Apple A10 Fusion (165.9 - 172.6, n=4) | |
| Apple iPad 6 2018 (Safari Mobile 11.3) | |
| Apple iPhone 7 (Safari Mobile 10.0) | |
| Apple iPad (2017) | |
| Samsung Galaxy Tab S3 SM-T825 (Samsung Browser 5.2) | |
| Huawei MediaPad M5 10.8 (Chrome 65) | |
| Huawei MediaPad M2 10 inch (Chrome 49) | |
| Samsung Galaxy Tab Active 2 | |
| Mozilla Kraken 1.1 - Total | |
| Huawei MediaPad M2 10 inch (Chrome 49) | |
| Samsung Galaxy Tab Active 2 | |
| Huawei MediaPad M5 10.8 (Chrome 65) | |
| Apple iPad Mini 4 (Safari iOS 9) | |
| Average of class Tablet (243 - 27101, n=67, last 2 years) | |
| Samsung Galaxy Tab S3 SM-T825 (Samsung Browser 5.2) | |
| Apple iPad (2017) | |
| Average Apple A10 Fusion (1026 - 1531, n=5) | |
| Apple iPhone 7 (Safari Mobile 10.0) | |
| Apple iPad 6 2018 (Safari Mobile 11.3) | |
| Apple iPad Pro 10.5 2017 (Safari Mobile 10) | |
| Apple iPad Pro 12.9 2017 (Safari Mobile 10) | |
| Apple iPhone 8 | |
| Apple iPhone 8 Plus | |
| Apple iPhone X (IOS 11.1.2) | |
* ... smaller is better
Gaming – latest iPad also handles modern games
Modern games are no problem for the iPad, despite the slightly outdated SoC. Our tests with Gamebench showed that the current title Arena of Valor ran at a steady 60 FPS at the maximum settings in a 3-vs-3 multiplayer battle. World of Tanks Blitz also ran at 60 FPS with high settings. Only the demanding PUBG Mobile occasionally suffers from frame rate drops. The presentation is a bit jerky at 8x zoom. The iPhone X is much smoother in extreme situations, here. Still, the mobile version of the shooter is well playable with the iPad (tested with high details).
| low | med. | high | ultra | |
|---|---|---|---|---|
| Asphalt 8: Airborne (2013) | 29 | |||
| Asphalt 9: Legends (2013) | 29 | |||
| Battle Bay (2018) | 59 | |||
| World of Tanks Blitz (2018) | 59 | |||
| Arena of Valor (2018) | 59 | |||
| Shadow Fight 3 (2018) | 29 | |||
| PUBG Mobile (2018) | 29 | 29 | 29 |
Emissions
Temperature
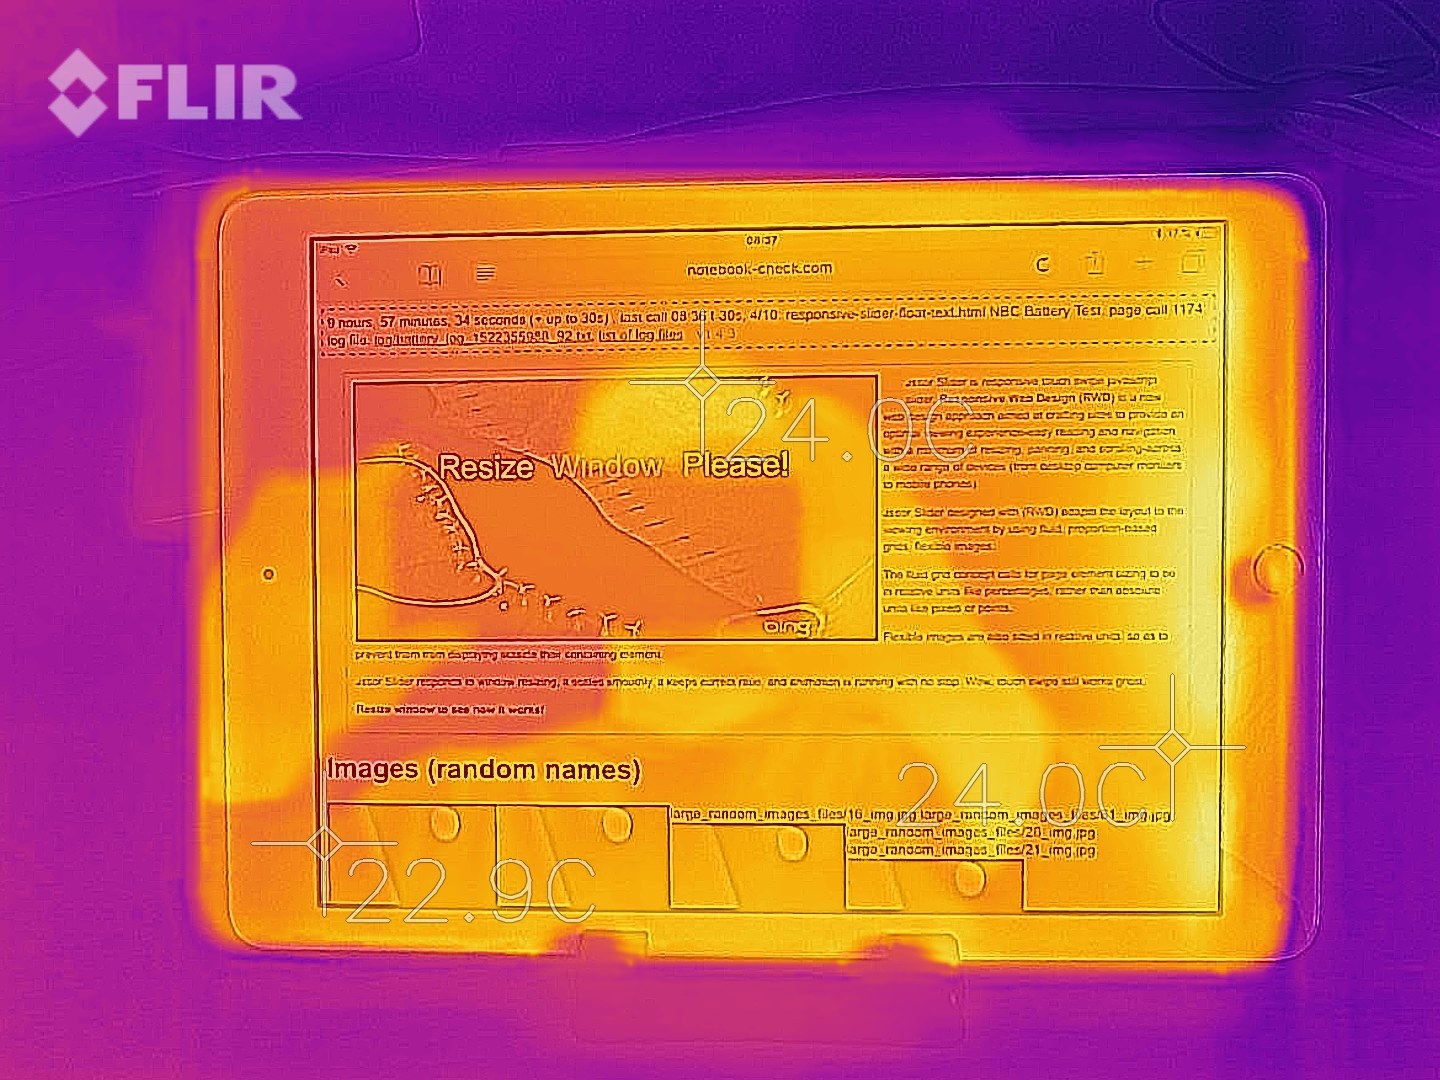
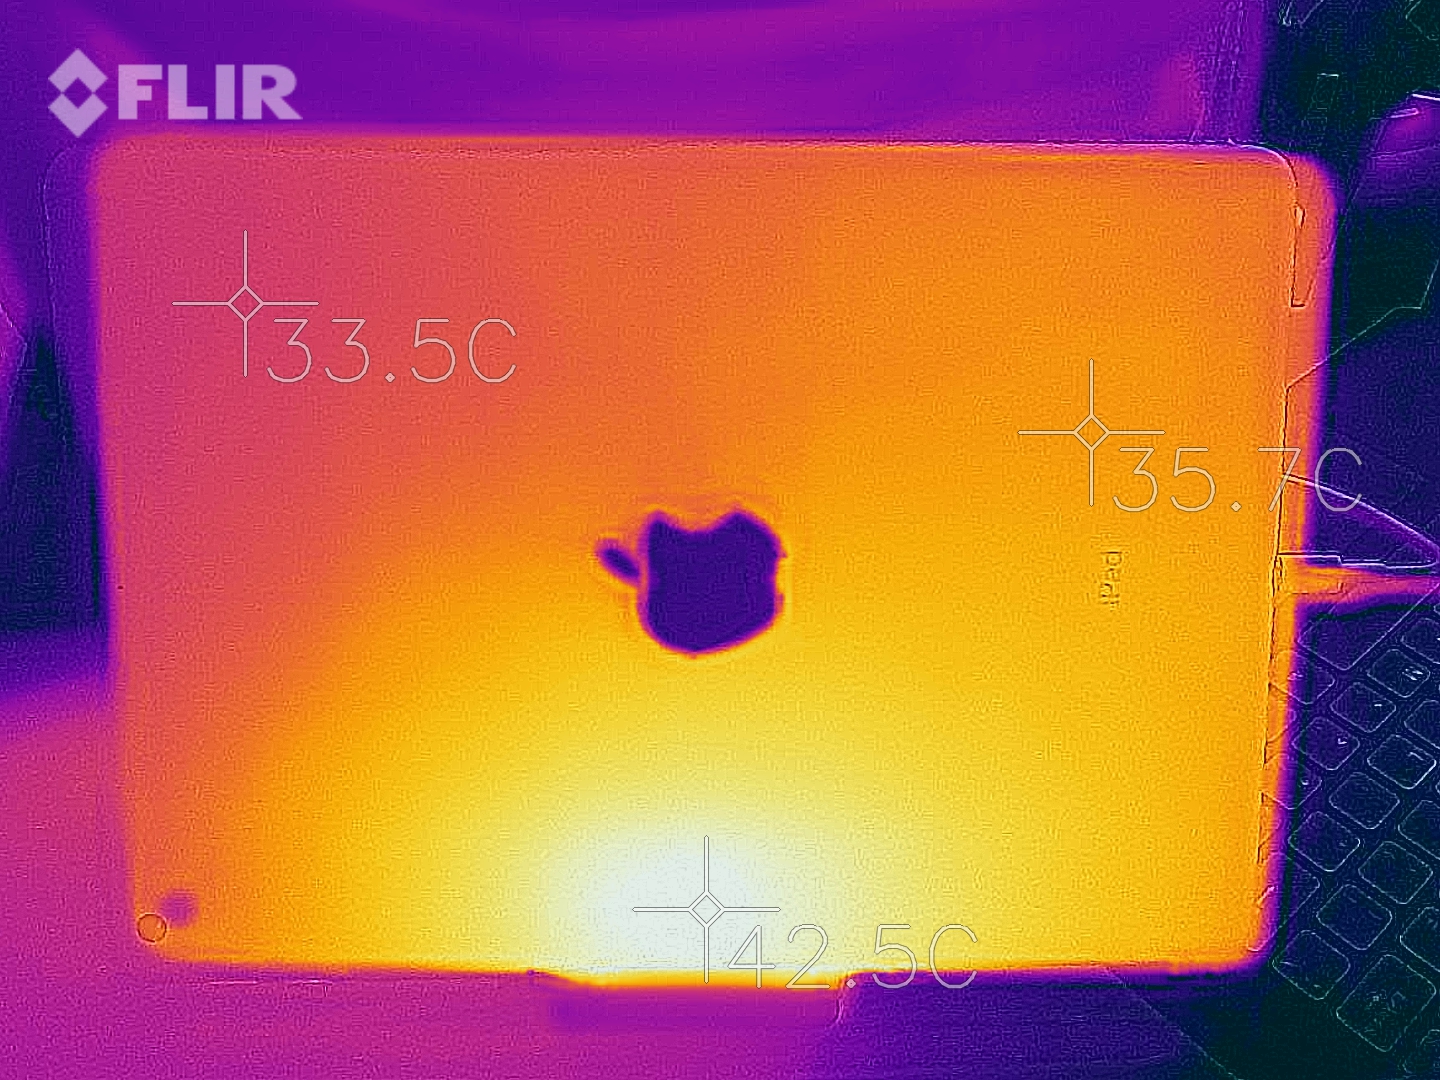
The temperature development of the 2018 iPad is moderate. We can measure up to 39 °C at a hot spot (upper right edge in portrait mode) after one hour of 3D load, which is warm but not critical. The rest of the chassis stays pretty cool at 33 - 34 °C.
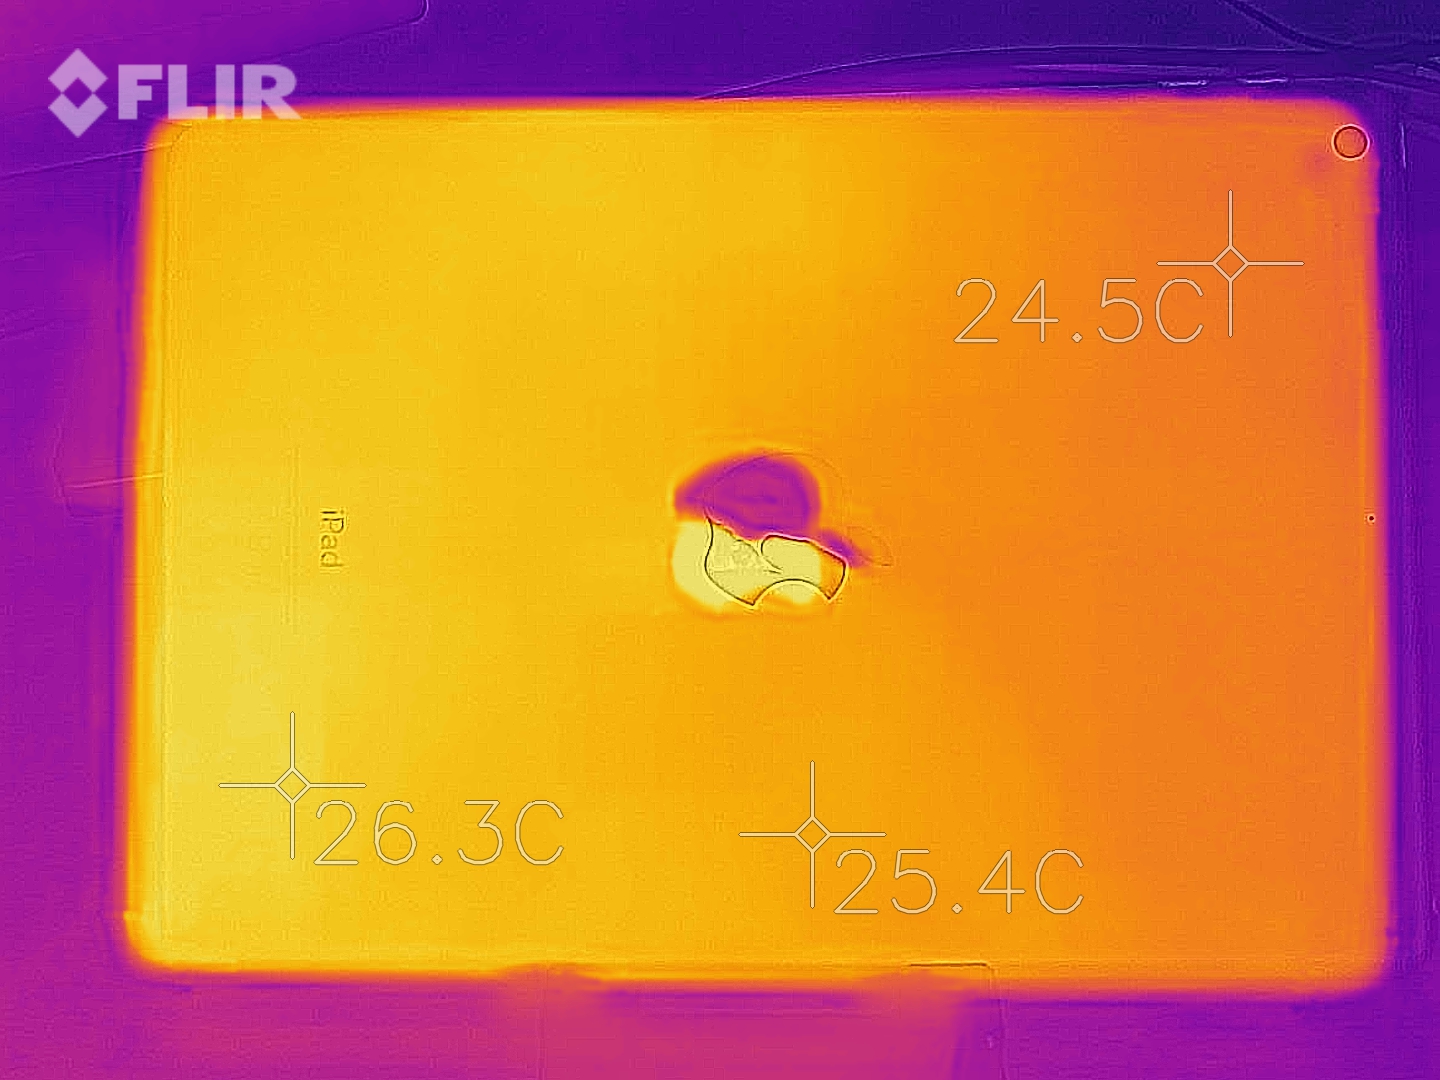
The temperatures were much lower during our WLAN test, where we just measured an uncritical 25 °C at the rear.
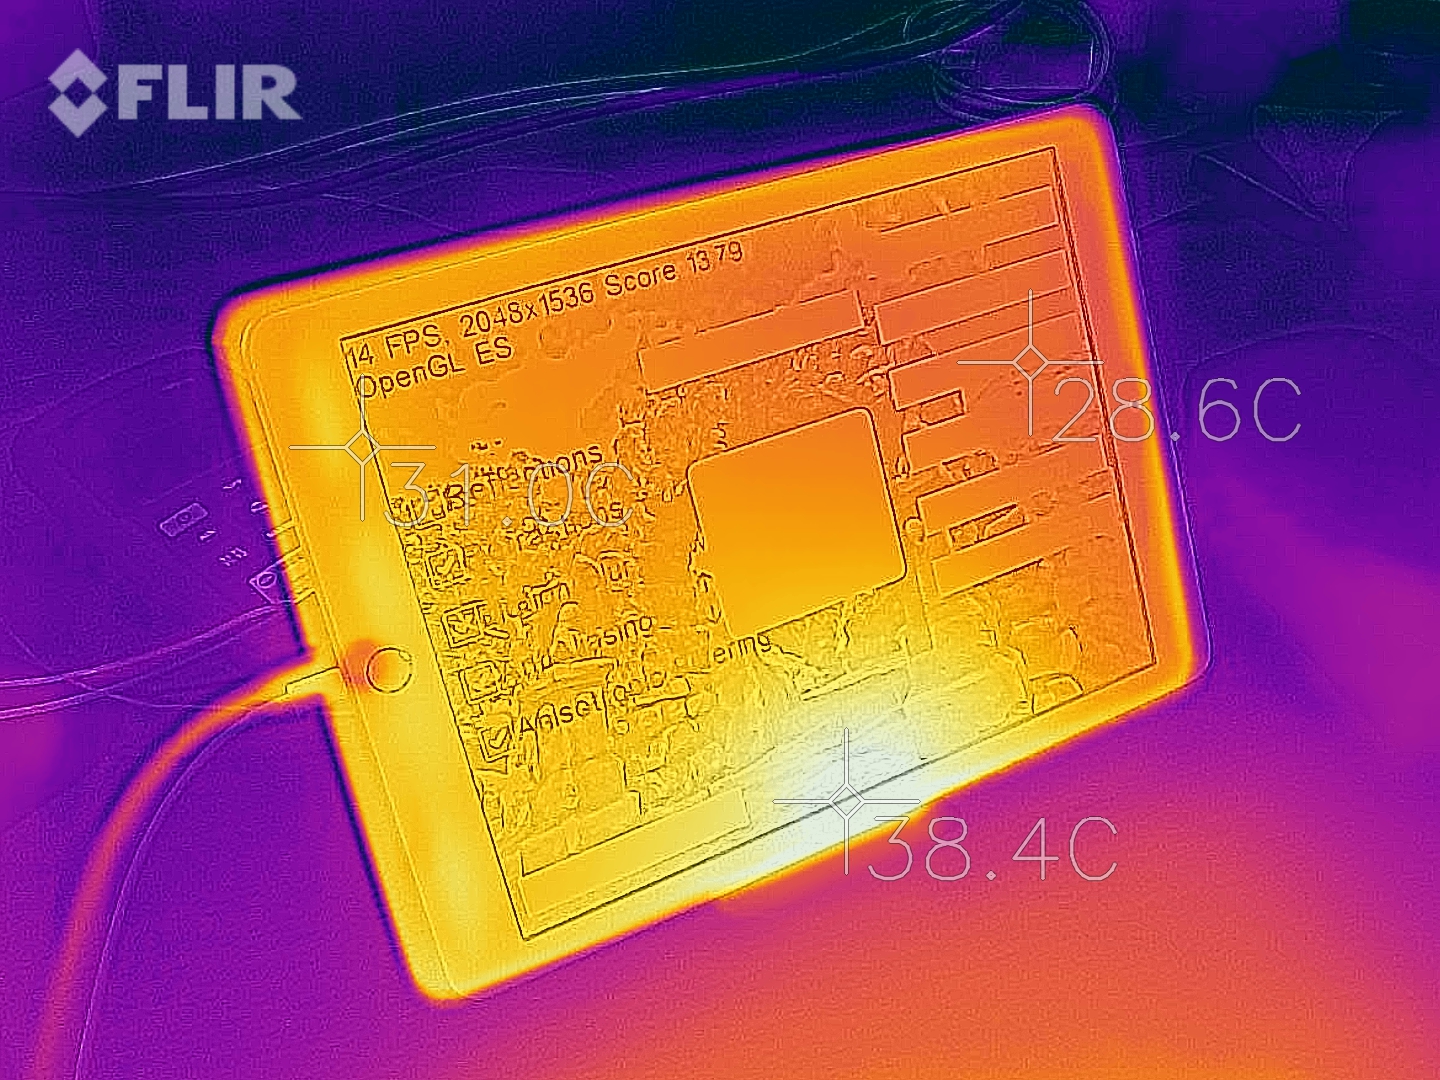
(+) The maximum temperature on the upper side is 38 °C / 100 F, compared to the average of 33.6 °C / 92 F, ranging from 20.7 to 53.2 °C for the class Tablet.
(+) The bottom heats up to a maximum of 39 °C / 102 F, compared to the average of 33.2 °C / 92 F
Speakers
The stereo speakers at the bottom of the tablet still provide a very linear sound, but they were much quieter than the 2017 iPad. The sound profile, however, is otherwise very similar. It is still comparatively easy to cover the speakers with the hand.
Apple iPad 6 2018 audio analysis
(±) | speaker loudness is average but good (75.7 dB)
Bass 100 - 315 Hz
(±) | reduced bass - on average 11.2% lower than median
(±) | linearity of bass is average (11.9% delta to prev. frequency)
Mids 400 - 2000 Hz
(+) | balanced mids - only 1.3% away from median
(+) | mids are linear (5.9% delta to prev. frequency)
Highs 2 - 16 kHz
(+) | balanced highs - only 3.3% away from median
(±) | linearity of highs is average (11% delta to prev. frequency)
Overall 100 - 16.000 Hz
(+) | overall sound is linear (13.3% difference to median)
Compared to same class
» 24% of all tested devices in this class were better, 5% similar, 71% worse
» The best had a delta of 7%, average was 20%, worst was 129%
Compared to all devices tested
» 14% of all tested devices were better, 3% similar, 84% worse
» The best had a delta of 4%, average was 24%, worst was 134%
Apple iPad Pro 10.5 2017 audio analysis
(+) | speakers can play relatively loud (84.6 dB)
Bass 100 - 315 Hz
(±) | reduced bass - on average 10.4% lower than median
(±) | linearity of bass is average (12.3% delta to prev. frequency)
Mids 400 - 2000 Hz
(±) | higher mids - on average 5.8% higher than median
(+) | mids are linear (4.3% delta to prev. frequency)
Highs 2 - 16 kHz
(±) | higher highs - on average 6.6% higher than median
(±) | linearity of highs is average (7% delta to prev. frequency)
Overall 100 - 16.000 Hz
(±) | linearity of overall sound is average (16.1% difference to median)
Compared to same class
» 36% of all tested devices in this class were better, 6% similar, 58% worse
» The best had a delta of 7%, average was 20%, worst was 129%
Compared to all devices tested
» 26% of all tested devices were better, 5% similar, 69% worse
» The best had a delta of 4%, average was 24%, worst was 134%
Apple iPad Pro 12.9 2017 audio analysis
(±) | speaker loudness is average but good (81.2 dB)
Bass 100 - 315 Hz
(±) | reduced bass - on average 5.7% lower than median
(±) | linearity of bass is average (10.7% delta to prev. frequency)
Mids 400 - 2000 Hz
(+) | balanced mids - only 1.6% away from median
(+) | mids are linear (5.1% delta to prev. frequency)
Highs 2 - 16 kHz
(+) | balanced highs - only 4.7% away from median
(+) | highs are linear (5.9% delta to prev. frequency)
Overall 100 - 16.000 Hz
(+) | overall sound is linear (8.9% difference to median)
Compared to same class
» 2% of all tested devices in this class were better, 2% similar, 96% worse
» The best had a delta of 7%, average was 20%, worst was 129%
Compared to all devices tested
» 3% of all tested devices were better, 1% similar, 97% worse
» The best had a delta of 4%, average was 24%, worst was 134%
Apple iPad (2017) audio analysis
(+) | speakers can play relatively loud (86.1 dB)
Bass 100 - 315 Hz
(-) | nearly no bass - on average 17.5% lower than median
(±) | linearity of bass is average (10.8% delta to prev. frequency)
Mids 400 - 2000 Hz
(+) | balanced mids - only 2.8% away from median
(+) | mids are linear (5.3% delta to prev. frequency)
Highs 2 - 16 kHz
(±) | higher highs - on average 8.5% higher than median
(+) | highs are linear (3.9% delta to prev. frequency)
Overall 100 - 16.000 Hz
(±) | linearity of overall sound is average (19% difference to median)
Compared to same class
» 52% of all tested devices in this class were better, 5% similar, 43% worse
» The best had a delta of 7%, average was 20%, worst was 129%
Compared to all devices tested
» 45% of all tested devices were better, 7% similar, 48% worse
» The best had a delta of 4%, average was 24%, worst was 134%
Huawei MediaPad M2 10 inch audio analysis
(+) | speakers can play relatively loud (91.2 dB)
Bass 100 - 315 Hz
(-) | nearly no bass - on average 25.1% lower than median
(±) | linearity of bass is average (11.9% delta to prev. frequency)
Mids 400 - 2000 Hz
(+) | balanced mids - only 1.6% away from median
(+) | mids are linear (3.1% delta to prev. frequency)
Highs 2 - 16 kHz
(+) | balanced highs - only 3.8% away from median
(+) | highs are linear (3.1% delta to prev. frequency)
Overall 100 - 16.000 Hz
(±) | linearity of overall sound is average (17.7% difference to median)
Compared to same class
» 44% of all tested devices in this class were better, 6% similar, 50% worse
» The best had a delta of 7%, average was 20%, worst was 129%
Compared to all devices tested
» 35% of all tested devices were better, 8% similar, 57% worse
» The best had a delta of 4%, average was 24%, worst was 134%
Energy Management - Apple A10 SoC in the new iPad consumes more power
Power Consumption
The entry-level iPad cannot score when it comes to power consumption. The measurements are higher, both in comparison to the class average and the other iPads. The provided 10-Watt power adapter is fully utilized under load, but the battery did not lose any capacity during a 10-minute test with maximum load.
| Off / Standby | |
| Idle | |
| Load |
|
Key:
min: | |
| Apple iPad 6 2018 mAh | Apple iPad Pro 10.5 2017 8134 mAh | Apple iPad Pro 12.9 2017 10875 mAh | Apple iPad (2017) 8.827 mAh | Apple iPhone 8 Plus 2691 mAh | Apple iPhone X 2716 mAh | Apple iPhone 8 1821 mAh | Apple iPad Mini 4 mAh | Samsung Galaxy Tab S3 SM-T825 6000 mAh | Huawei MediaPad M5 10.8 7500 mAh | Samsung Galaxy Tab Active 2 4450 mAh | Apple iPhone 7 1960 mAh | Huawei MediaPad M2 10 inch 6660 mAh | Average of class Tablet | |
|---|---|---|---|---|---|---|---|---|---|---|---|---|---|---|
| Power Consumption | 26% | 10% | 9% | 61% | 63% | 70% | 52% | 40% | 23% | 61% | 74% | 41% | 23% | |
| Idle Minimum * (Watt) | 2.2 | 1.44 35% | 1.55 30% | 2.06 6% | 0.72 67% | 1.03 53% | 0.54 75% | 0.8 64% | 2.08 5% | 2.01 9% | 0.89 60% | 0.54 75% | 1.6 27% | 2.1 ? 5% |
| Idle Average * (Watt) | 7.8 | 6.12 22% | 8.58 -10% | 7.42 5% | 2.45 69% | 2.4 69% | 1.63 79% | 3.6 54% | 3.5 55% | 5.4 31% | 3.13 60% | 1.51 81% | 4.13 47% | 4.14 ? 47% |
| Idle Maximum * (Watt) | 7.9 | 6.14 22% | 8.59 -9% | 7.47 5% | 2.52 68% | 2.6 67% | 1.67 79% | 3.9 51% | 3.58 55% | 5.44 31% | 3.36 57% | 1.54 81% | 4.22 47% | 4.46 ? 44% |
| Load Average * (Watt) | 12.6 | 8.55 32% | 10.09 20% | 9.45 25% | 3.84 70% | 2.96 77% | 2.74 78% | 6.1 52% | 6.97 45% | 8.55 32% | 3.93 69% | 3.75 70% | 6.57 48% | 9.45 ? 25% |
| Load Maximum * (Watt) | 12.8 | 10.62 17% | 10.61 17% | 12.31 4% | 9.02 30% | 6.6 48% | 7.78 39% | 8 37% | 7.4 42% | 11.53 10% | 5.45 57% | 5.01 61% | 8.32 35% | 13.8 ? -8% |
* ... smaller is better
Battery Runtime
The battery runtime in our web-browsing script via Wi-Fi at an adjusted luminance of 150 cd/m² is a bit shorter compared to the predecessor in a first attempt. Still, a runtime of almost 12 hours is pretty decent. Apple advertises a browsing time of 10 hours on its website for video and music playback, respectively. Also our results from the previous model are from our launch review with an older IOS version. Other reviews report similar run times with both devices running the same IOS version.
Our test model is also a bit worse under load compared to the previous model. We determine a little more than 3 hours with the app Relative Benchmark, and the GFXBench Manhattan 3.1 benchmark determines a comparable 196 minutes at the highest luminance.
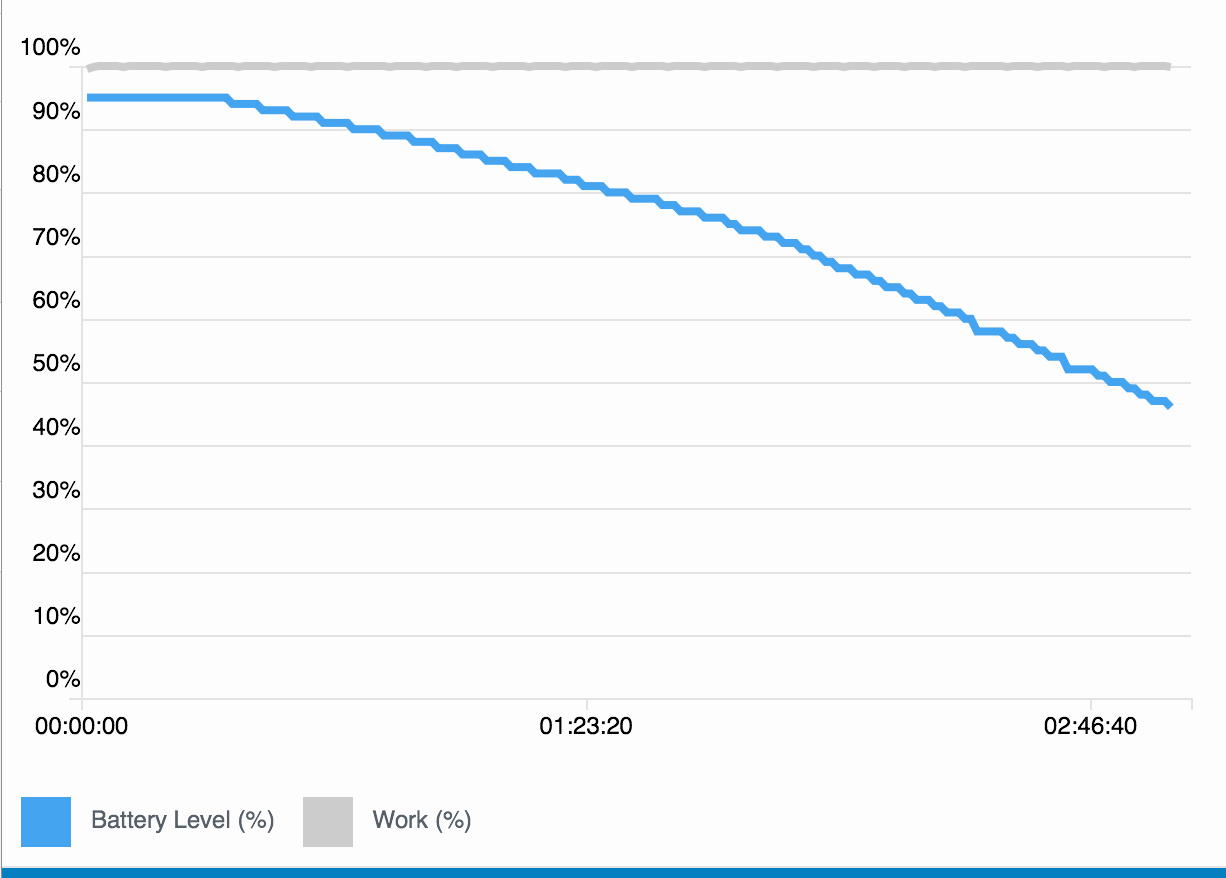
Charging the iPad takes quite a while. Our model had already been charging for 6 hours and had only reached 88% battery level while we used demanding benchmarks with the display turned on. To be fair, the device was occasionally off the charger, but it is still pretty far away from a quick-charge device.
| Apple iPad 6 2018 mAh | Apple iPad (2017) 8.827 mAh | Apple iPad Pro 10.5 2017 8134 mAh | Apple iPad Pro 12.9 2017 10875 mAh | Samsung Galaxy Tab S3 SM-T825 6000 mAh | Samsung Galaxy Tab Active 2 4450 mAh | Huawei MediaPad M2 10 inch 6660 mAh | |
|---|---|---|---|---|---|---|---|
| Battery runtime | 15% | 2% | 21% | 55% | 69% | 20% | |
| WiFi v1.3 (h) | 11.9 | 12.7 7% | 11.6 -3% | 12.3 3% | 12.7 7% | 14.9 25% | 11.6 -3% |
| Load (h) | 3.1 | 3.8 23% | 3.3 6% | 4.3 39% | 6.3 103% | 6.6 113% | 4.4 42% |
| Reader / Idle (h) | 24.9 | 33.9 | 48.7 | 31.7 | 22.6 | 16.5 | |
| H.264 (h) | 14.1 | 10.5 | 11.3 | 9.2 | 8.2 | 10 |
Pros
Cons
Verdict
The 2018 iPad (sixth-generation) is the small update the spec sheet promises. It is faster, but a still outdated SoC and Apple Pencil support are the most important new features. Both the battery runtime and the power consumption suffered due to these updates but are still good in general.
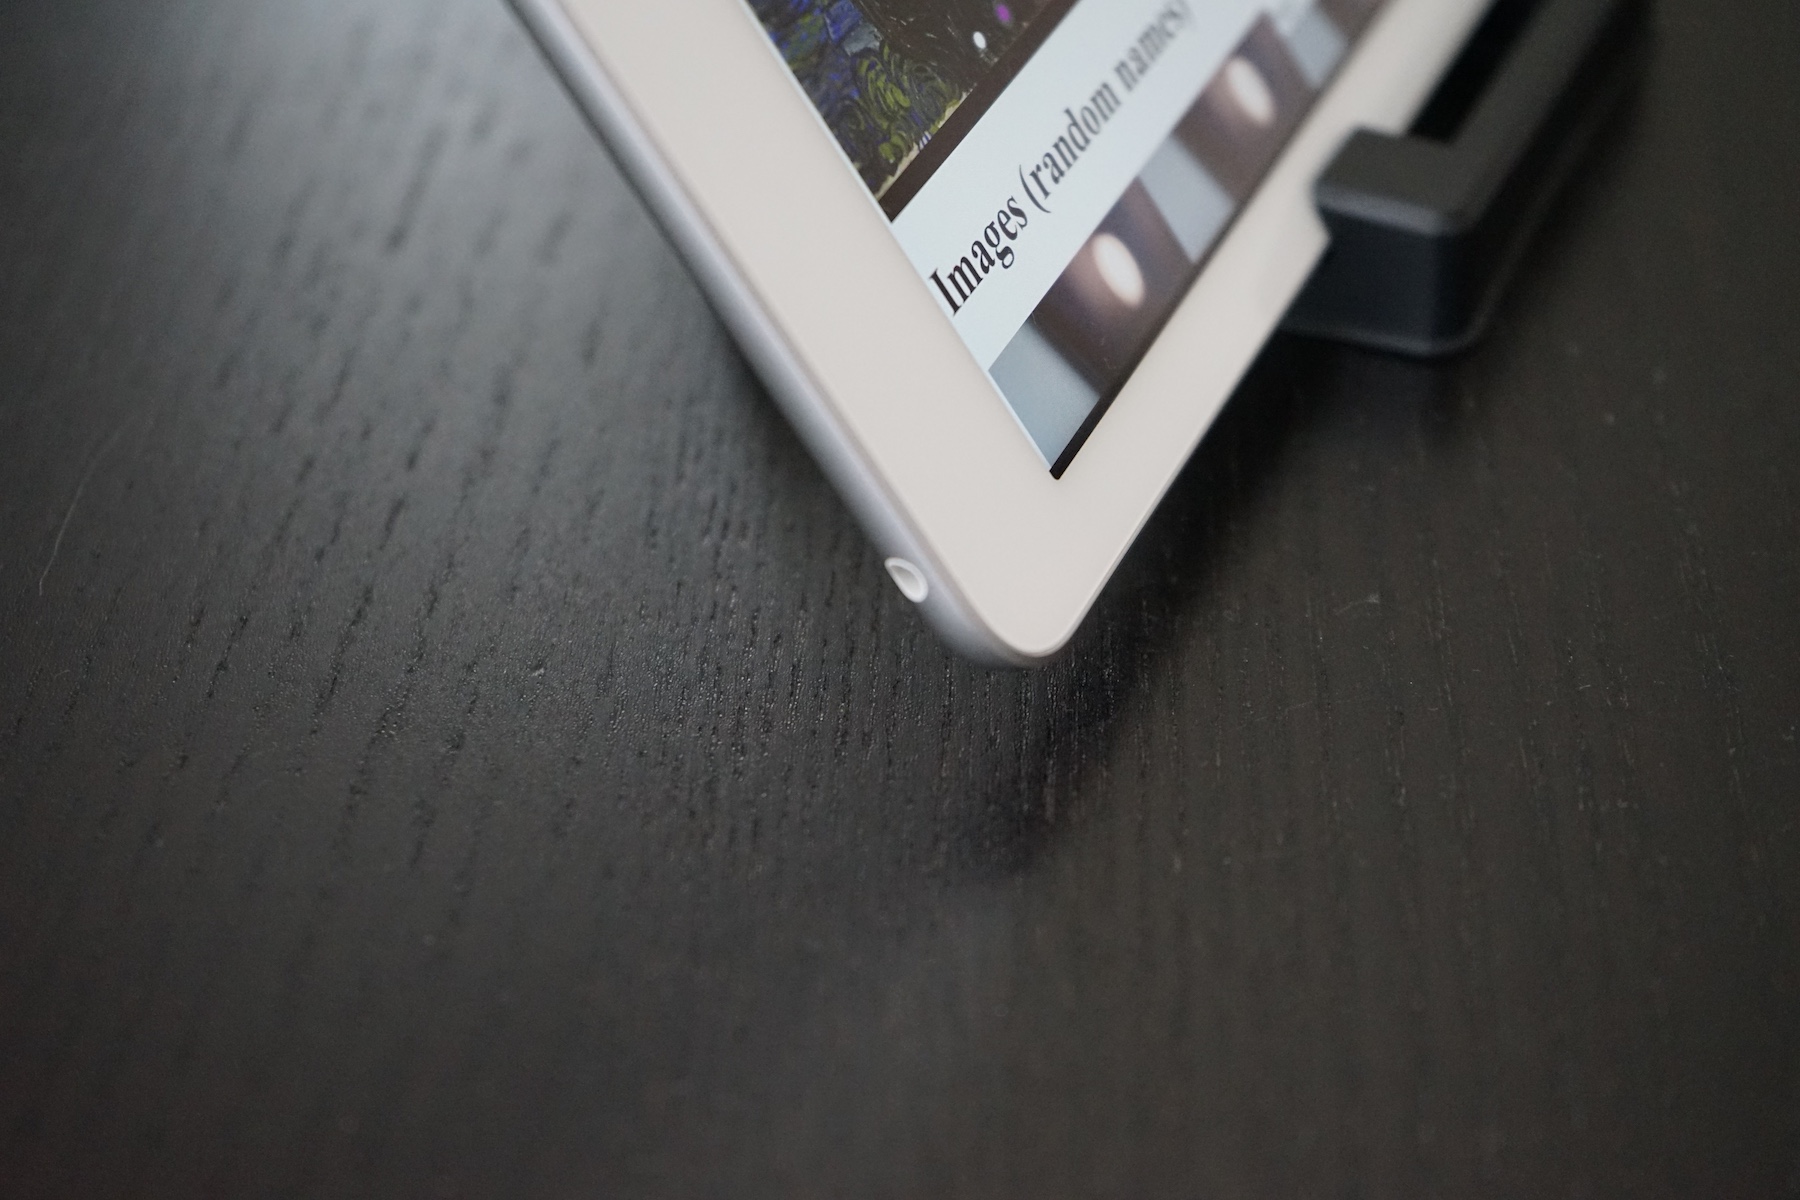
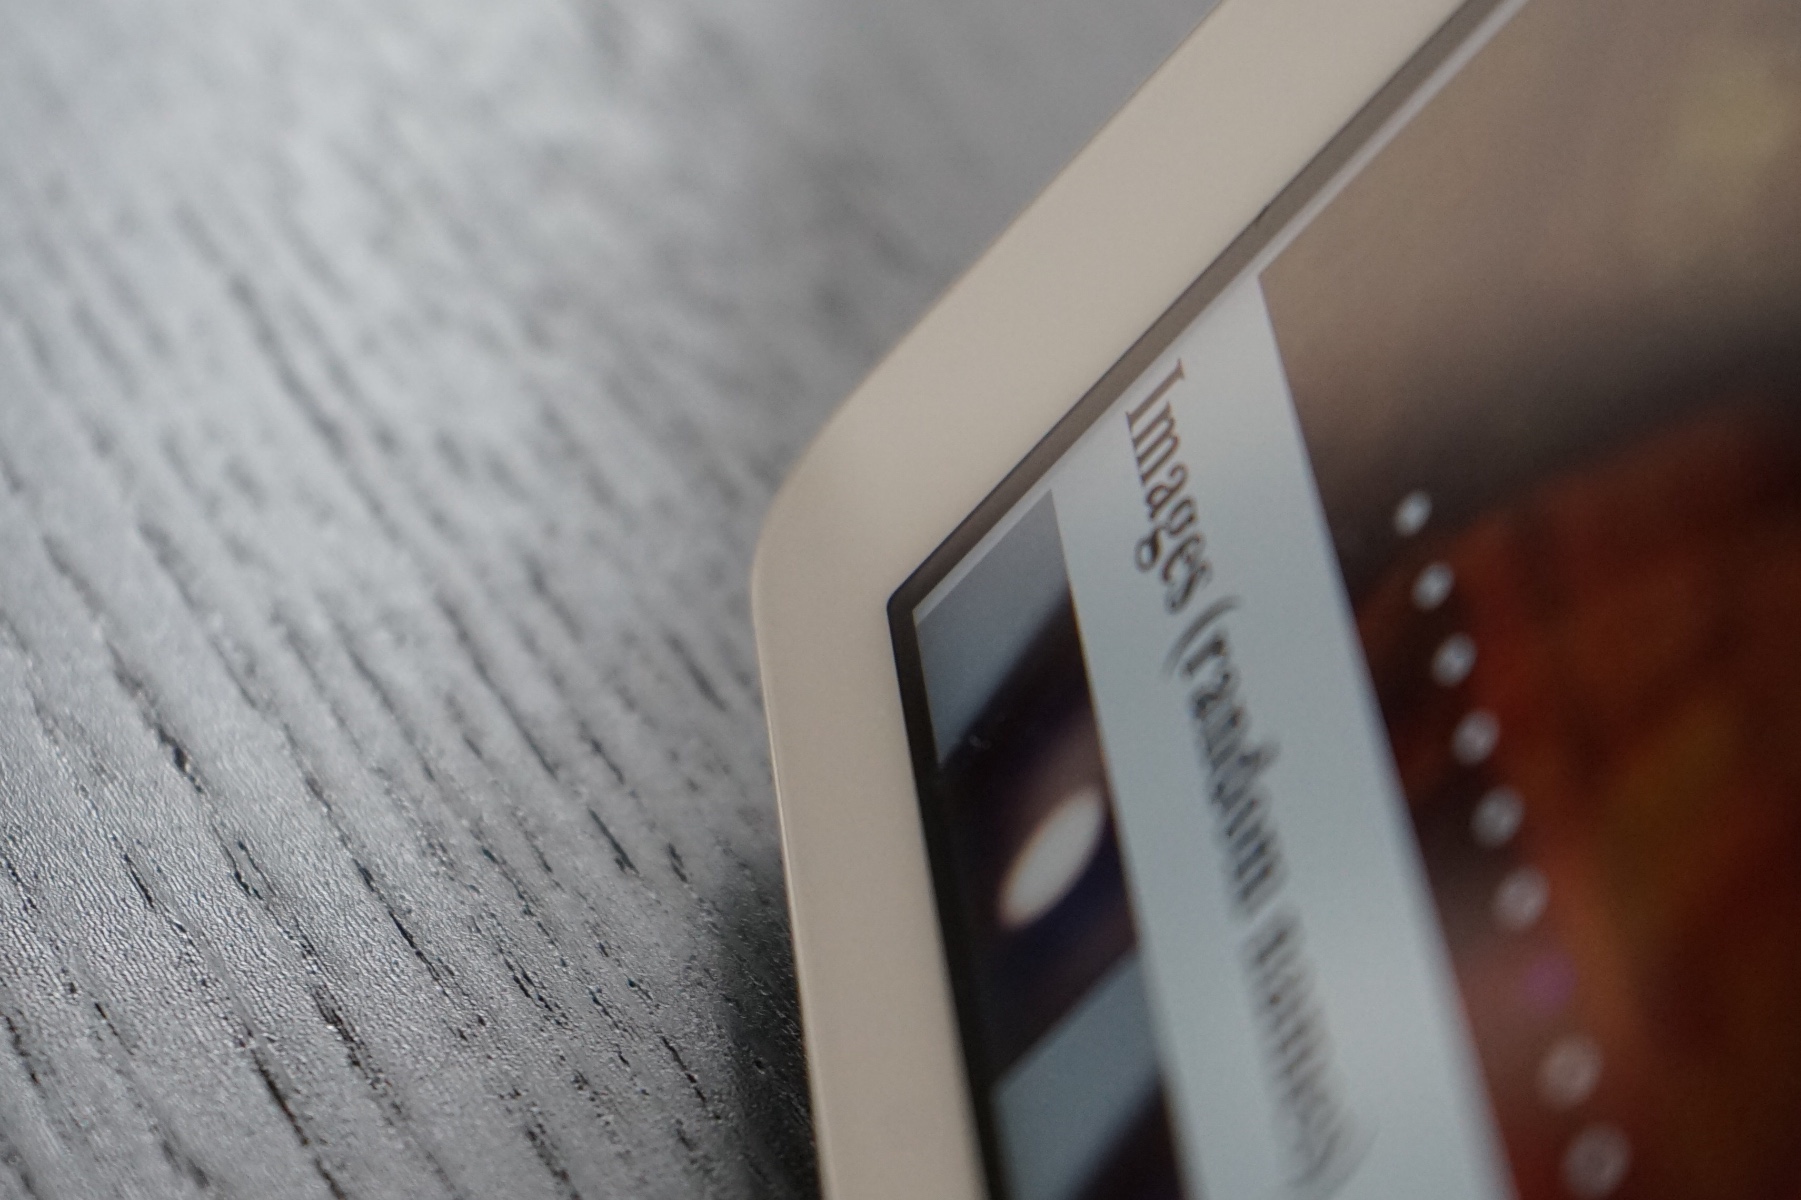
The temperature development does not worry us and the display is still very good. The gap between the front glass and the display panel is not perfect, but the device is easier to repair if the display is broken in return. Whether the iPad can rival Chromebooks in schools, however, is questionable. The price with the Pencil and keyboard is much higher. This means the software has to make the difference, and Apple can usually score with high-quality apps.
Is the new iPad affordable? The new iPad is about $80 less expensive than its smaller sibling iPad Mini, and the Pro models start at $649 in Apple's online store. Good Android tablets with comparable displays are already available for less than $350.
Apple iPad 6 2018
- 09/16/2019 v7 (old)
Klaus Hinum, J. Simon Leitner
Price comparison
