Notebookcheck Logo

AMD A6-4400M vs AMD A4-5150M

AMD A6-4400M

► remove from comparison AMD A6-4400M

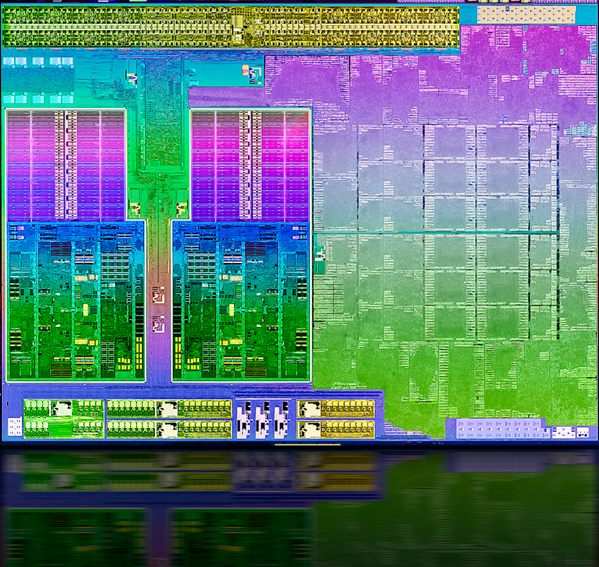
The AMD A6-4400M is a mobile dual-core processor based on the Trinity architecture. Officially introduced in Q2 2012, it is the direct successor to the Llano A-series of APUs (Accelerated Processing Unit). The processing unit is manufactured in 32nm SOI and integrates a 2.7 GHz CPU (up to 3.2 GHz w/ Turbo Core) with a Radeon HD 7520G GPU alongside a dual-channel memory controller, video de- and encoders and a northbridge.

The CPU cores are based on a reworked Bulldozer architecture, called Piledriver. Although marketed as a dual-core processor, the A6-4400M includes only one module with two integer-cores and one floating-point core. As a result, the CPU is not a true dual-core processor.

When compared to previous Bulldozer cores, AMD has managed to improve upon the IPC (instructions per clock) performance of Trinity cores while allowing for higher clock frequencies. However, when compared to its Llano predecessor, the multithreaded performance of Trinity has only been slightly improved. The enhanced Turbo Core 3.0 feature functions well in speeding up single threaded performance, although it is still not on the same level as Intel’s Turbo Boost equivalent. Regardless, AMD has managed to include other features as well, such as the AVX extension (including FMA) and support for AES encryption.

In terms of raw general performance, the A6-4400M performs similar to the Llano-based A4-3330MX. Single-threaded workloads can especially benefit from the new architecture and the updated Turbo Core functionality. If compared to Intels Pentium-series, the A6-4400M offers less performance in most cases. Nonetheless, CPU performance from the AMD processor should be sufficient for all daily workloads like Office and Internet browsing, but will reach its limits in more demanding applications.

The integrated DirectX 11-compatible Radeon HD 7520G offers only 192 shader cores of the Trinity chip (7660G: 384) and, thanks to Turbo Core, will operate anywhere between 497 to 686 MHz depending on the current application demand. On average, the performance of the HD 7520G GPU should be somewhere between the Llano-based Radeon HD 6620G and the HD Graphics 4000 as found in Intel’s Ivy Bridge.

The power consumption of the A6-4400M APU is rated at 35 Watt TDP and is therefore comparable to dual-core Ivy Bridge processors. Consequently, the A6-4400M is best suited for 14-inch notebooks or larger.

AMD A4-5150M

► remove from comparison AMD A4-5150M

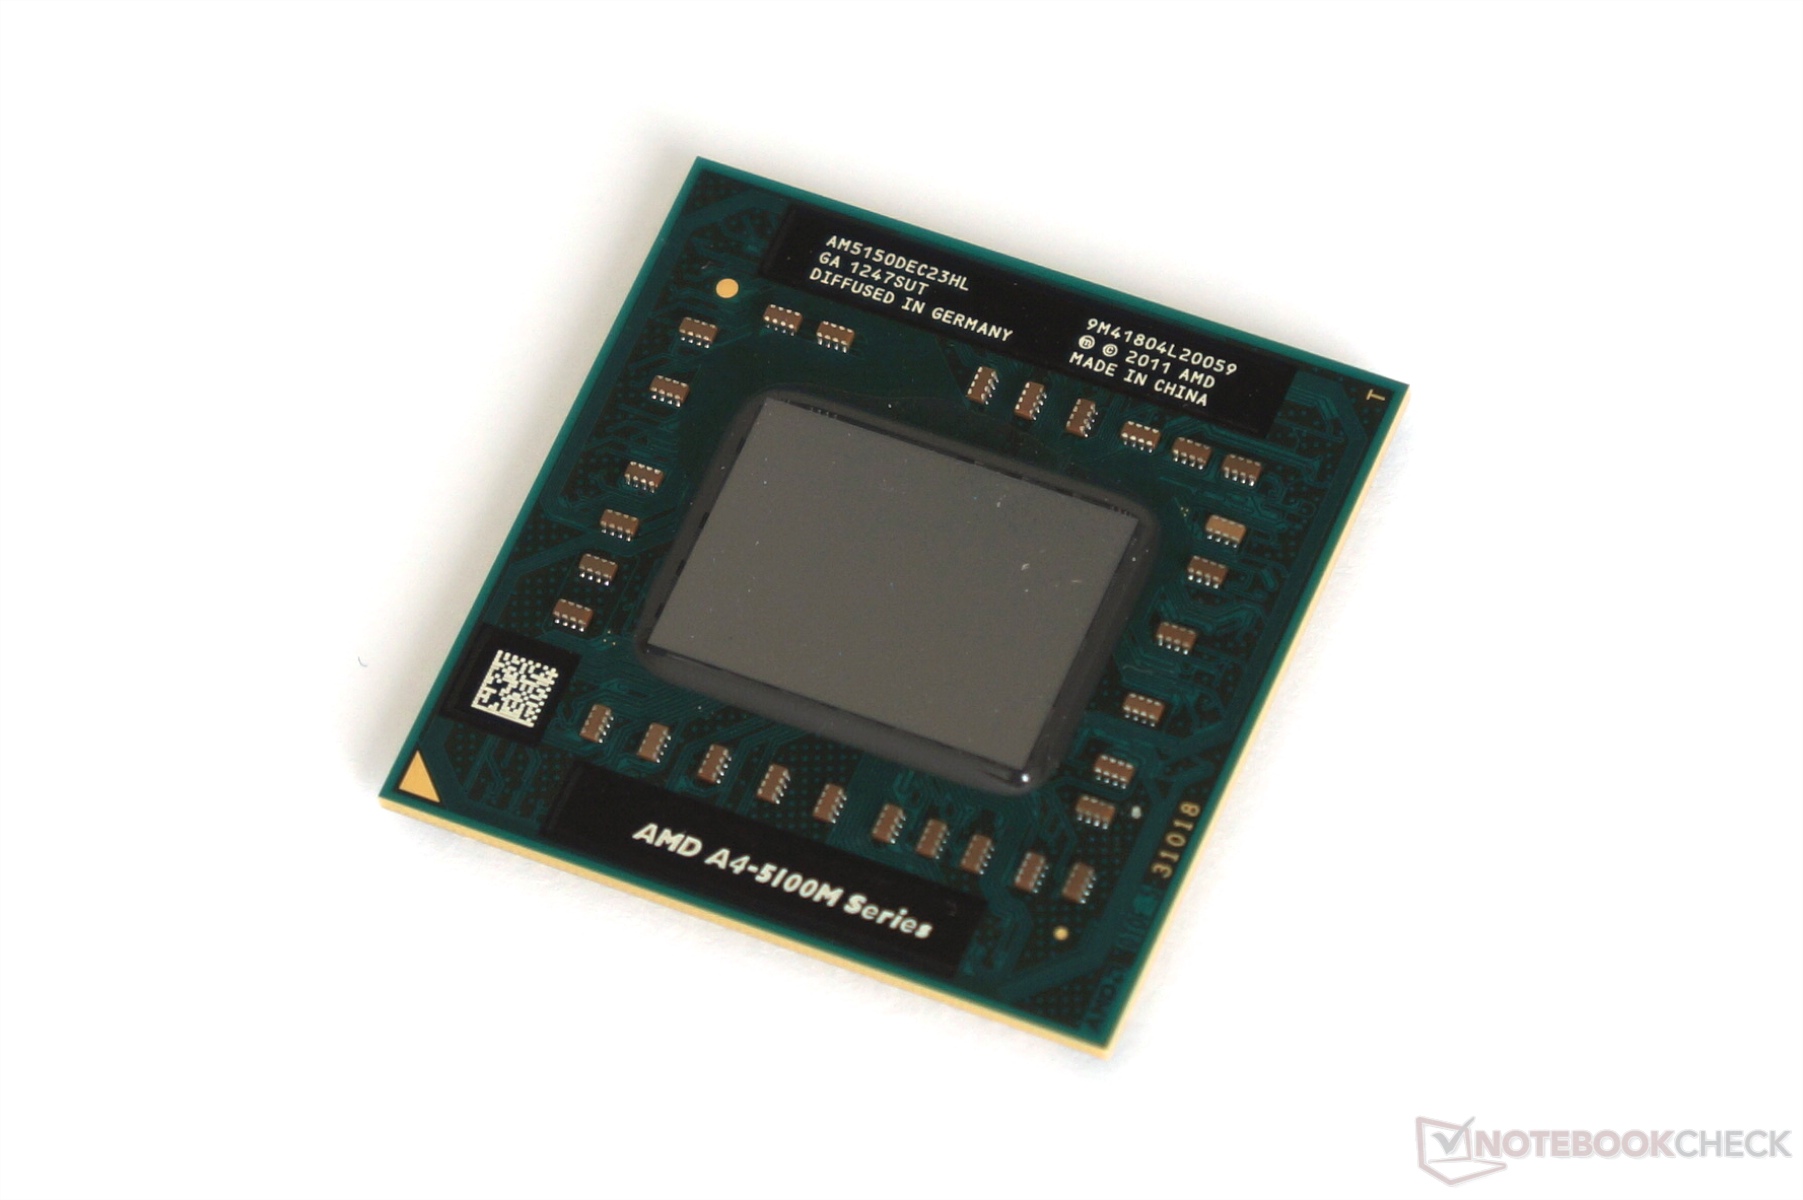
The AMD A4-5150M is a mobile dual-core processor based on the Richland-architecture. As successor to the A4-4300M, the A4-5150M has a slightly higher CPU and graphics performance and settles in the low end segment. The APU integrates 2 CPU cores, a DirectX 11 graphics unit and the Northbridge along with a DDR3 memory controller.

Compared to Trinity, Richland has been modified just slightly. Therefore, no changes in the feature set or the Pro-MHz performance can be reported. The design of the chip is still based on the Bulldozer architecture, which consists of so-called modules. Each module integrates 2 integer units, but only one FPU. Just like Trinity, Richland supports nearly all current techniques such as AVX (including FMA), AES or Turbo Core.

According to our benchmarks, the A4-5150M performs similar to the A6-4400M and just matches a Pentium P6000. Consequently, the performance in less demanding applications and games is sufficient.

The graphics unit called Radeon HD 8350G offers 128 shader units (VLIW4) and clocks slightly higher than the similar HD 7420G. With fast dual-channel memory, performance is somewhat below a dedicated Radeon HD 7450M.

The power consumption of the entire APU is rated at 35 watts, which is comparable to conventional middle-class models of competition. Thus, the APU is best suited for 14 inch notebooks or bigger.

ModelAMD A6-4400MAMD A4-5150M
SeriesAMD A-SeriesAMD A-Series
CodenameTrinityRichland
Series: A-Series Richland
AMD A10-4600M compare2.3 - 3.2 GHz4 / 4 cores
AMD A10-4657M compare2.3 - 3.2 GHz4 / 4 cores
AMD A10-4655M compare2 - 2.8 GHz4 / 4 cores
AMD A8-4500M compare1.9 - 2.8 GHz4 / 4 cores
AMD A8-4557M compare1.9 - 2.8 GHz4 / 4 cores
AMD A8-4555M compare1.6 - 2.4 GHz4 / 4 cores
AMD A6-4400M « 2.7 - 3.2 GHzcores
AMD A4-4300M compare2.5 - 3 GHzcores
AMD A6-4455M compare2.1 - 2.6 GHzcores
AMD A4-4355M compare1.9 - 2.4 GHzcores
AMD A10-5750M compare2.5 - 3.5 GHz4 / 4 cores
AMD A10-5757M compare2.5 - 3.5 GHz4 / 4 cores
AMD A10-5745M compare2.1 - 2.9 GHz4 / 4 cores
AMD A8-5550M compare2.1 - 3.1 GHz4 / 4 cores
AMD A8-5557M compare2.1 - 3.1 GHz4 / 4 cores
AMD A8-5545M compare1.7 - 2.7 GHz4 / 4 cores
AMD A6-5350M compare2.9 - 3.5 GHz2 / 2 cores
AMD A6-5357M compare2.9 - 3.5 GHz2 / 2 cores
AMD A4-5150M « 2.7 - 3.3 GHz2 / 2 cores
AMD A6-5345M compare2.2 - 2.8 GHz2 / 2 cores
AMD A4-5145M compare2 - 2.6 GHz2 / 2 cores
Clock2700 - 3200 MHz2700 - 3300 MHz
L2 Cache1 MB1 MB
Cores / Threads22 / 2
TDP35 Watt35 Watt
Transistors1303 Million1300 Million
32 nm32 nm, 0.925-
Die Size246 mm2246 mm2
FeaturesSSE (1, 2, 3, 3S, 4.1, 4.2, 4A), x86-64, AES, AVX, FMASSE (1, 2, 3, 3S, 4.1, 4.2, 4A), x86-64, AES, AVX, FMA (3, 4), DDR3-1600 Controller
iGPUAMD Radeon HD 7520G (496 - 685 MHz)AMD Radeon HD 8350G (514 - 720 MHz)
Architecturex86x86
Announced
L1 Cache96 KB
max. Temp.105 °C
SocketFS1r2
Manufacturerproducts.amd.com

Benchmarks

Performance Rating - CB R15 + R20 + 7-Zip + X265 + Blender + 3DM11 CPU - A4-5150M
14.4 pt (20%)
Cinebench R20 - Cinebench R20 CPU (Single Core)
144 Points (16%)
Cinebench R20 - Cinebench R20 CPU (Multi Core)
186 Points (0%)
Cinebench R15 - Cinebench R15 CPU Multi 64 Bit
min: 96.9     avg: 101     median: 101 (1%)     max: 105 Points
Cinebench R15 - Cinebench R15 CPU Single 64 Bit
min: 54     avg: 59.1     median: 59.1 (18%)     max: 64.2 Points
Cinebench R11.5 - Cinebench R11.5 CPU Multi 64 Bit
min: 0.98     avg: 1.1     median: 1.1 (1%)     max: 1.14 Points
1.2 Points (2%)
Cinebench R11.5 - Cinebench R11.5 CPU Single 64 Bit
0.8 Points (20%)
0.7 Points (17%)
Cinebench R10 - Cinebench R10 Rend. Single (32bit)
min: 1829     avg: 2225     median: 2292 (14%)     max: 2384 Points
2446 Points (15%)
Cinebench R10 - Cinebench R10 Rend. Multi (32bit)
min: 3096     avg: 3344     median: 3407 (2%)     max: 3413 Points
3589 Points (3%)
Cinebench R10 - Cinebench R10 Rend. Multi (64bit)
min: 4161     avg: 4482     median: 4589 (3%)     max: 4590 Points
Cinebench R10 - Cinebench R10 Rend. Single (64bit)
min: 2948     avg: 3063     median: 3069.5 (4%)     max: 3165 Points
wPrime 2.10 - wPrime 2.0 1024m *
min: 1399     avg: 1528     median: 1520.5 (18%)     max: 1673 s
1430 s (17%)
wPrime 2.10 - wPrime 2.0 32m *
min: 42     avg: 47.1     median: 46.8 (9%)     max: 52.9 s
43 s (9%)
WinRAR - WinRAR 4.0
min: 1070     avg: 1353     median: 1353 (2%)     max: 1636 Points
1167 Points (2%)
7-Zip 18.03 - 7-Zip 18.03 Multli Thread 4 runs
min: 3740     avg: 3769     median: 3768.5 (2%)     max: 3797 MIPS
7-Zip 18.03 - 7-Zip 18.03 Single Thread 4 runs
min: 2616     avg: 2620     median: 2620 (31%)     max: 2624 MIPS
X264 HD Benchmark 4.0 - x264 Pass 2
7.6 fps (3%)
8 fps (3%)
X264 HD Benchmark 4.0 - x264 Pass 1
38.8 fps (9%)
42 fps (10%)
HWBOT x265 Benchmark v2.2 - HWBOT x265 4k Preset
min: 0.51     avg: 0.6     median: 0.6 (1%)     max: 0.62 fps
TrueCrypt - TrueCrypt Serpent
min: 0.072     avg: 0.1     median: 0.1 (0%)     max: 0.0778 GB/s
min: 0.083     avg: 0.1     median: 0.1 (0%)     max: 0.086 GB/s
TrueCrypt - TrueCrypt Twofish
min: 0.128     avg: 0.1     median: 0.1 (2%)     max: 0.135 GB/s
min: 0.15     avg: 0.2     median: 0.2 (3%)     max: 0.154 GB/s
TrueCrypt - TrueCrypt AES
min: 0.63     avg: 0.7     median: 0.7 (2%)     max: 0.689 GB/s
min: 0.739     avg: 0.8     median: 0.8 (2%)     max: 0.766 GB/s
Blender - Blender 2.79 BMW27 CPU *
min: 5364     avg: 5507     median: 5506.5 (39%)     max: 5649 Seconds
R Benchmark 2.5 - R Benchmark 2.5 *
1.8 sec (38%)
3DMark 06 - CPU - 3DMark 06 - CPU
min: 1781     avg: 1800     median: 1804 (4%)     max: 1811 Points
1881 Points (4%)
Super Pi mod 1.5 XS 1M - Super Pi mod 1.5 XS 1M *
min: 31     avg: 32.7     median: 31.6 (7%)     max: 36.48 s
30.3 s (7%)
Super Pi mod 1.5 XS 2M - Super Pi mod 1.5 XS 2M *
min: 70     avg: 73.3     median: 70.9 (3%)     max: 81.3 s
67.2 s (3%)
Super Pi Mod 1.5 XS 32M - Super Pi mod 1.5 XS 32M *
min: 1798     avg: 1848     median: 1806.5 (8%)     max: 1980 s
SiSoft Sandra Dhrystone (MIPS) - SiSoft Sandra Dhrystone (MIPS)
18210 MIPS (9%)
SiSoft Sandra Whetstone (MFLOPS) - SiSoft Sandra Whetstone (MFLOPS)
12380 MFLOPS (9%)
Windows 7 Experience Index - Win7 CPU
min: 5.5     avg: 5.6     median: 5.6 (72%)     max: 5.6 Points
3DMark Vantage - 3DM Vant. Perf. CPU no Physx
min: 3183     avg: 3308     median: 3304 (3%)     max: 3451 Points
3732 Points (3%)
3DMark 11 - 3DM11 Performance Physics
min: 1193     avg: 1380     median: 1403 (4%)     max: 1512 Points
1531 Points (4%)
3DMark - 3DMark Ice Storm Physics
13531 Points (11%)
8366 Points (7%)
3DMark - 3DMark Ice Storm Unlimited Physics
9004 Points (8%)
3DMark - 3DMark Cloud Gate Physics
1004 Points (3%)
844 Points (2%)
3DMark - 3DMark Fire Strike Standard Physics
722 Points (1%)
Geekbench 5.5 - Geekbench 5.1 - 5.4 64 Bit Single-Core
454 Points (19%)
Geekbench 5.5 - Geekbench 5.1 - 5.4 64 Bit Multi-Core
633 Points (1%)
Geekbench 5.0 - Geekbench 5.0 64 Bit Single-Core
454 Points (2%)
Geekbench 5.0 - Geekbench 5.0 64 Bit Multi-Core
639 Points (2%)
Geekbench 4.4 - Geekbench 4.1 - 4.4 64 Bit Single-Core
min: 2048     avg: 2050     median: 2050 (20%)     max: 2052 Points
Geekbench 4.4 - Geekbench 4.1 - 4.4 64 Bit Multi-Core
min: 2711     avg: 2872     median: 2871.5 (3%)     max: 3032 Points
Geekbench 4.0 - Geekbench 4.0 64 Bit Single-Core
1971 Points (27%)
Geekbench 4.0 - Geekbench 4.0 64 Bit Multi-Core
2896 Points (7%)
Geekbench 3 - Geekbench 3 32 Bit Multi-Core
2528 Points (4%)
Geekbench 3 - Geekbench 3 32 Bit Single-Core
1739 Points (34%)
Geekbench 3 - Geekbench 3 64 Bit Multi-Core
2747 Points (4%)
Geekbench 3 - Geekbench 3 64 Bit Single-Core
1927 Points (29%)
Geekbench 2 - 32 Bit - Geekbench Stream
3968 Points (32%)
Geekbench 2 - 32 Bit - Geekbench Memory
3616 Points (33%)
Geekbench 2 - 32 Bit - Geekbench Floating Point
2993 Points (6%)
Geekbench 2 - 32 Bit - Geekbench Integer
3438 Points (7%)
Geekbench 2 - 32 Bit - Geekbench Total Score
3370 Points (9%)
Sunspider - Sunspider 1.0 Total Score *
274 ms (3%)
Sunspider - Sunspider 0.9.1 Total Score *
288 ms (3%)
Octane V2 - Octane V2 Total Score
min: 13144     avg: 13186     median: 13185.5 (12%)     max: 13227 Points

Average Benchmarks AMD A6-4400M → 100% n=19

Average Benchmarks AMD A4-5150M → 101% n=19

- Range of benchmark values for this graphics card
- Average benchmark values for this graphics card
* Smaller numbers mean a higher performance
1 This benchmark is not used for the average calculation

Add one or more devices and compare

In the following list you can select (and also search for) devices that should be added to the comparison. You can select more than one device.

restrict list:

show all (including archived), 2024, 2023
v1.26
log 19. 09:47:54

#0 checking url part for id 3101 +0s ... 0s

#1 checking url part for id 3781 +0s ... 0s

#2 not redirecting to Ajax server +0s ... 0s

#3 did not recreate cache, as it is less than 5 days old! Created at Sun, 19 May 2024 05:35:32 +0200 +0.001s ... 0.001s

#4 composed specs +0.037s ... 0.039s

#5 did output specs +0s ... 0.039s

#6 getting avg benchmarks for device 3101 +0.003s ... 0.041s

#7 got single benchmarks 3101 +0.023s ... 0.065s

#8 getting avg benchmarks for device 3781 +0.017s ... 0.082s

#9 got single benchmarks 3781 +0.01s ... 0.091s

#10 got avg benchmarks for devices +0s ... 0.091s

#11 min, max, avg, median took s +0.23s ... 0.321s

#12 return log +0.04s ... 0.361s

Please share our article, every link counts!
> Expert Reviews and News on Laptops, Smartphones and Tech Innovations > Benchmarks / Tech > Processor Comparison - Head 2 Head
Redaktion, 2017-09- 8 (Update: 2023-07- 1)