

AMD A10-5745M vs Intel Core i5-4300Y vs AMD A8-5550M
AMD A10-5745M
► remove from comparison
The AMD A10-5745M is a mobile low-voltage quad-core processor based on the Richland architecture. The APU integrates two modules with 2.1 to 2.9 GHz, a Radeon HD 8610G graphics card and a DDR3(L)-1333 memory controller.
Compared to Trinity, Richland has been modified just slightly. Therefore, no changes in the feature set or the Pro-MHz performance can be reported. The design of the chip is still based on the Bulldozer architecture, which consists of so-called modules. Each of the two modules integrates 2 integer units, but only one FPU. Just like Trinity, Richland supports nearly all current techniques such as AVX (including FMA), AES or Turbo Core.
The CPU performance of the A10-5745M should be similar to a Core i3-2310M. Thus, the APU is sufficiently for most modern applications and many games.
The graphics unit called Radeon HD 8610G offers all 384 shader units (VLIW4) and is slightly faster than the HD 7660G. The core is clocked at 533-626 MHz (turbo).
The power consumption of the entire APU is rated at 25 watts, which is slightly below common middle-class CPUs. Therefore, the APU is suitable for slim 13-inch notebooks or bigger.
Intel Core i5-4300Y
► remove from comparison
The Intel Core i5-4300Y is an ULV (ultra low voltage) dual-core processor for ultrabooks and tablets which has been presented in Q3/2013. It is based on the Haswell architecture and manufactured in 22nm. Due to Hyperthreading, the two cores can handle up to four threads in parallel, leading to better utilization of the CPU. Each core offers a base speed of 1.6 GHz, but can dynamically increase clock rates with Turbo Boost up to 2.3 GHz.
Haswell is the successor to the Ivy Bridge architecture with improvements on both GPU and CPU performance. The CPUs are produced in 22nm and offer an optimized branch prediction as well as additional execution ports, improving the performance per clock by almost 10 percent. Furthermore, new features like AVX2 and FMA should increase the performance in future applications even more.
The performance of the Core i5-4300Y is similar to the Core i3-4158U with a slightly higher TDP, assuming the Turbo Boost is working optimally. Thus, the CPU has sufficient power for office and multimedia purposes as well as most applications.
The integrated HD Graphics 4200 offers 20 Execution Units (EUs) clocked at 200 - 850 MHz with Turbo Boost, making it somewhat faster than the former HD Graphics 4000 at similar clock speeds. However, the HD 4200 is significantly slower than the HD 4400 found on other ULV models with higher clocks and TDP.
The i5-4300Y is rated at a TDP of 11.5 W (SDP 6 W) including the graphics card, memory controller, VRMs and the integrated chipset. Therefore, the CPU is suited for very small ultrabooks or tablets.
AMD A8-5550M
► remove from comparison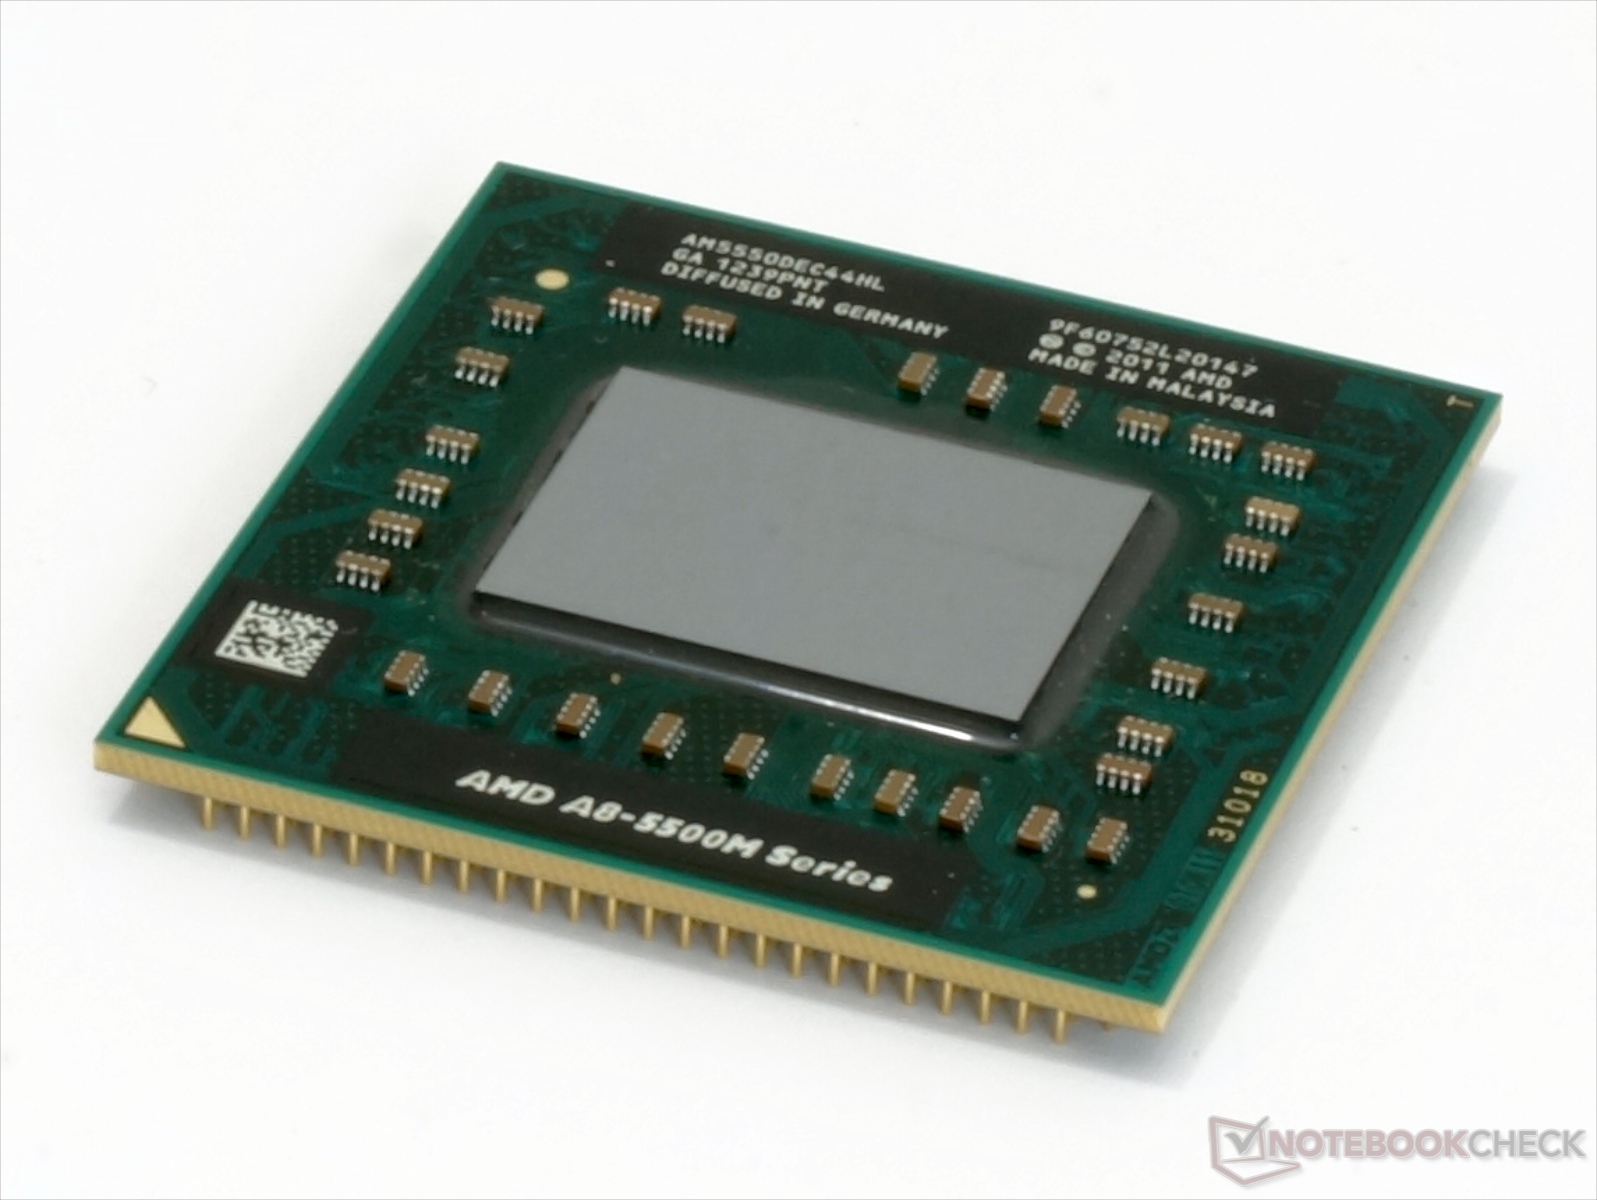
The AMD A8-5550M is a mobile quad-core processor based on the Richland-architecture. As successor to the A8-4500M, the A8-5550M has a slightly higher CPU and graphics performance and settles in the lower middle class. The APU integrates 4 CPU cores, a DirectX 11 graphics unit and the Northbridge along with a DDR3 memory controller.
Compared to Trinity, Richland has been modified just slightly. Therefore, no changes in the feature set or the Pro-MHz performance can be reported. The design of the chip is still based on the Bulldozer architecture, which consists of so-called modules. Each of the two modules integrates 2 integer units, but only one FPU. Just like Trinity, Richland supports nearly all current techniques such as AVX (including FMA), AES or Turbo Core.
According to the clock rates of 2.1 to 3.1 GHz, the A8-5550M performs about 15 percent slower than the A10-5750M and similar to a Core i3-2310M. Consequently, the performance in current applications and games is sufficient.
The graphics unit called Radeon HD 8550G offers 256 shader units (VLIW4) and clocks slightly higher than the HD 7640G. With fast dual-channel memory, performance matches a dedicated Radeon HD 7570M.
The power consumption of the entire APU is rated at 35 watts, which is comparable to conventional middle-class models of competition. Thus, the APU is best suited for 14 inch notebooks or bigger.
| Model | AMD A10-5745M | Intel Core i5-4300Y | AMD A8-5550M | ||||||||||||||||||||||||||||||||||||||||||||||||||||||||||||||||||||||||||||||||||||||||||||||||||||||||||||||||||||||||||||||||||||||||||||||||||||||||||||||||||||||||||||||||||||||||||||||||||||||||
| Codename | Richland | Haswell | Richland | ||||||||||||||||||||||||||||||||||||||||||||||||||||||||||||||||||||||||||||||||||||||||||||||||||||||||||||||||||||||||||||||||||||||||||||||||||||||||||||||||||||||||||||||||||||||||||||||||||||||||
| Series | AMD AMD A-Series | Intel Core i5 | AMD AMD A-Series | ||||||||||||||||||||||||||||||||||||||||||||||||||||||||||||||||||||||||||||||||||||||||||||||||||||||||||||||||||||||||||||||||||||||||||||||||||||||||||||||||||||||||||||||||||||||||||||||||||||||||
| Series: AMD A-Series Richland |
|
|
| ||||||||||||||||||||||||||||||||||||||||||||||||||||||||||||||||||||||||||||||||||||||||||||||||||||||||||||||||||||||||||||||||||||||||||||||||||||||||||||||||||||||||||||||||||||||||||||||||||||||||
| Clock | 2100 - 2900 MHz | 1600 - 2300 MHz | 2100 - 3100 MHz | ||||||||||||||||||||||||||||||||||||||||||||||||||||||||||||||||||||||||||||||||||||||||||||||||||||||||||||||||||||||||||||||||||||||||||||||||||||||||||||||||||||||||||||||||||||||||||||||||||||||||
| L2 Cache | 4 MB | 512 KB | 4 MB | ||||||||||||||||||||||||||||||||||||||||||||||||||||||||||||||||||||||||||||||||||||||||||||||||||||||||||||||||||||||||||||||||||||||||||||||||||||||||||||||||||||||||||||||||||||||||||||||||||||||||
| Cores / Threads | 4 / 4 | 2 / 4 | 4 / 4 | ||||||||||||||||||||||||||||||||||||||||||||||||||||||||||||||||||||||||||||||||||||||||||||||||||||||||||||||||||||||||||||||||||||||||||||||||||||||||||||||||||||||||||||||||||||||||||||||||||||||||
| TDP | 25 Watt | 11.5 Watt | 35 Watt | ||||||||||||||||||||||||||||||||||||||||||||||||||||||||||||||||||||||||||||||||||||||||||||||||||||||||||||||||||||||||||||||||||||||||||||||||||||||||||||||||||||||||||||||||||||||||||||||||||||||||
| Technology | 32 nm | 22 nm | 32 nm | ||||||||||||||||||||||||||||||||||||||||||||||||||||||||||||||||||||||||||||||||||||||||||||||||||||||||||||||||||||||||||||||||||||||||||||||||||||||||||||||||||||||||||||||||||||||||||||||||||||||||
| Features | SSE (1, 2, 3, 3S, 4.1, 4.2, 4A), x86-64, AES, AVX, FMA, DDR3-1333 Controller | HD Graphics 4200 (200 - 850 MHz), DDR3(L)-1600 Memory Controller, HyperThreading, AVX, AVX2, Quick Sync, Virtualization, AES-NI, vPro | SSE (1, 2, 3, 3S, 4.1, 4.2, 4A), x86-64, AES, AVX, FMA, DDR3-1600 Controller | ||||||||||||||||||||||||||||||||||||||||||||||||||||||||||||||||||||||||||||||||||||||||||||||||||||||||||||||||||||||||||||||||||||||||||||||||||||||||||||||||||||||||||||||||||||||||||||||||||||||||
| iGPU | AMD Radeon HD 8610G (533 - 626 MHz) | Intel HD Graphics 4200 (200 - 850 MHz) | AMD Radeon HD 8550G (515 - 720 MHz) | ||||||||||||||||||||||||||||||||||||||||||||||||||||||||||||||||||||||||||||||||||||||||||||||||||||||||||||||||||||||||||||||||||||||||||||||||||||||||||||||||||||||||||||||||||||||||||||||||||||||||
| Architecture | x86 | x86 | x86 | ||||||||||||||||||||||||||||||||||||||||||||||||||||||||||||||||||||||||||||||||||||||||||||||||||||||||||||||||||||||||||||||||||||||||||||||||||||||||||||||||||||||||||||||||||||||||||||||||||||||||
| Announced | |||||||||||||||||||||||||||||||||||||||||||||||||||||||||||||||||||||||||||||||||||||||||||||||||||||||||||||||||||||||||||||||||||||||||||||||||||||||||||||||||||||||||||||||||||||||||||||||||||||||||||
| L1 Cache | 128 KB | ||||||||||||||||||||||||||||||||||||||||||||||||||||||||||||||||||||||||||||||||||||||||||||||||||||||||||||||||||||||||||||||||||||||||||||||||||||||||||||||||||||||||||||||||||||||||||||||||||||||||||
| L3 Cache | 3 MB | ||||||||||||||||||||||||||||||||||||||||||||||||||||||||||||||||||||||||||||||||||||||||||||||||||||||||||||||||||||||||||||||||||||||||||||||||||||||||||||||||||||||||||||||||||||||||||||||||||||||||||
| max. Temp. | 100 °C | ||||||||||||||||||||||||||||||||||||||||||||||||||||||||||||||||||||||||||||||||||||||||||||||||||||||||||||||||||||||||||||||||||||||||||||||||||||||||||||||||||||||||||||||||||||||||||||||||||||||||||
| Socket | FCBGA1168 | ||||||||||||||||||||||||||||||||||||||||||||||||||||||||||||||||||||||||||||||||||||||||||||||||||||||||||||||||||||||||||||||||||||||||||||||||||||||||||||||||||||||||||||||||||||||||||||||||||||||||||
| $281 U.S. | |||||||||||||||||||||||||||||||||||||||||||||||||||||||||||||||||||||||||||||||||||||||||||||||||||||||||||||||||||||||||||||||||||||||||||||||||||||||||||||||||||||||||||||||||||||||||||||||||||||||||||
| Manufacturer | ark.intel.com |

Benchmarks

Average Benchmarks AMD A10-5745M → 100% n=31
Average Benchmarks Intel Core i5-4300Y → 114% n=31
Average Benchmarks AMD A8-5550M → 115% n=31
* Smaller numbers mean a higher performance
1 This benchmark is not used for the average calculation