Notebookcheck Logo

Zotac ZBOX Magnus mini PC with GeForce RTX 2080 in review

Small powerhouse! As a barebone system, Zotac is following the same path with the ZBOX as Intel did with its Ghost Canyon NUC. We took a closer look at the ZBOX Magnus with the GeForce RTX 2080 GPU and were positively surprised. You can find out what the mini PC is capable of in our detailed review.

The ZBOX from Zotac has been around for a long time and the basic concept isn't new. With the latest version, the manufacturer pairs Intel's 9th generation of Core processors with the Turing architecture of Nvidia graphics cards. This configuration is based on components that are otherwise only found in laptops in order to keep the power consumption and the resulting heat development in check. After all, everything has to fit into the mini system, which has a footprint of only 21 x 20.3 centimeters. The height is also quite low at 6.22 centimeters.

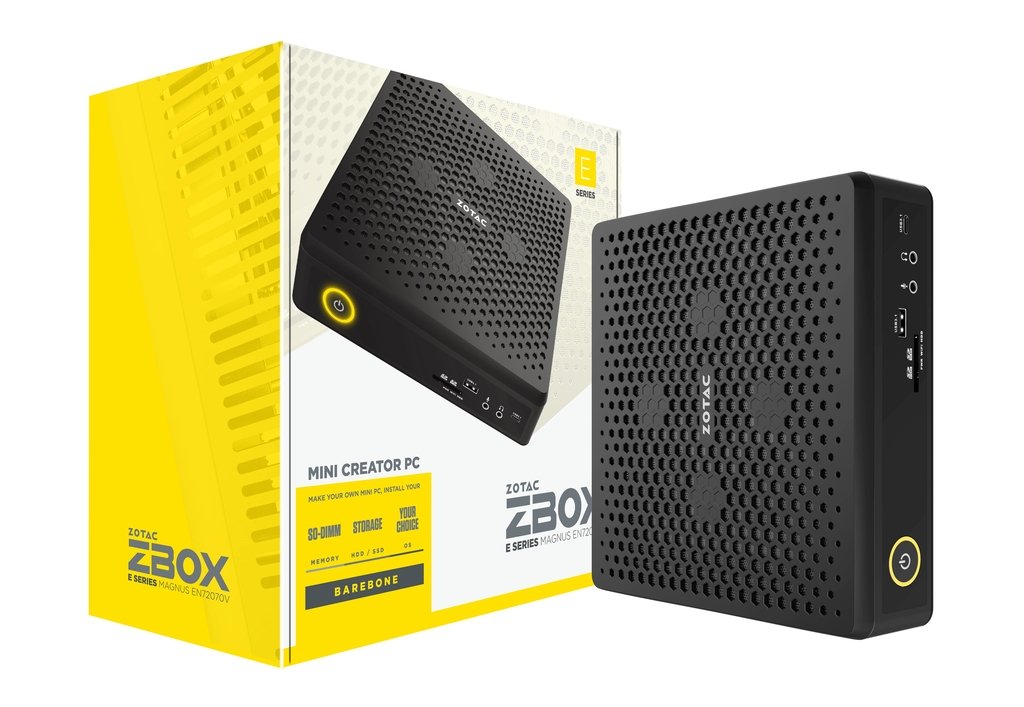
The compact case looks very high-quality and stable, and it's completely black. Lighting elements were deliberately omitted from the barebone PC. Those who like a lot of bling can take a look at the Zotac MEK MINI review. The ZBOX Magnus is equipped with an Intel Core i7-9750H, which delivers a solid performance in modern games. Together with the built-in GeForce RTX 2080 (mobile), even very demanding games can be played on the system. More about this can be found in the respective section further down in this review.

Since this is a barebone system, as mentioned before, the ZBOX is delivered without RAM and a storage drive. Here, the buyer can decide what to install and is, therefore, not dependent on a preconfigured system.

At the time of testing, the Zotac ZBOX Magnus EN72080V costs just under 1,700 Euros (~$2,004).

Zotac ZBOX Magnus
Zotac ZBOX Magnus
Zotac ZBOX Magnus
Zotac ZBOX Magnus
Zotac ZBOX Magnus
Zotac ZBOX Magnus

Zotac ZBOX Magnus in detail

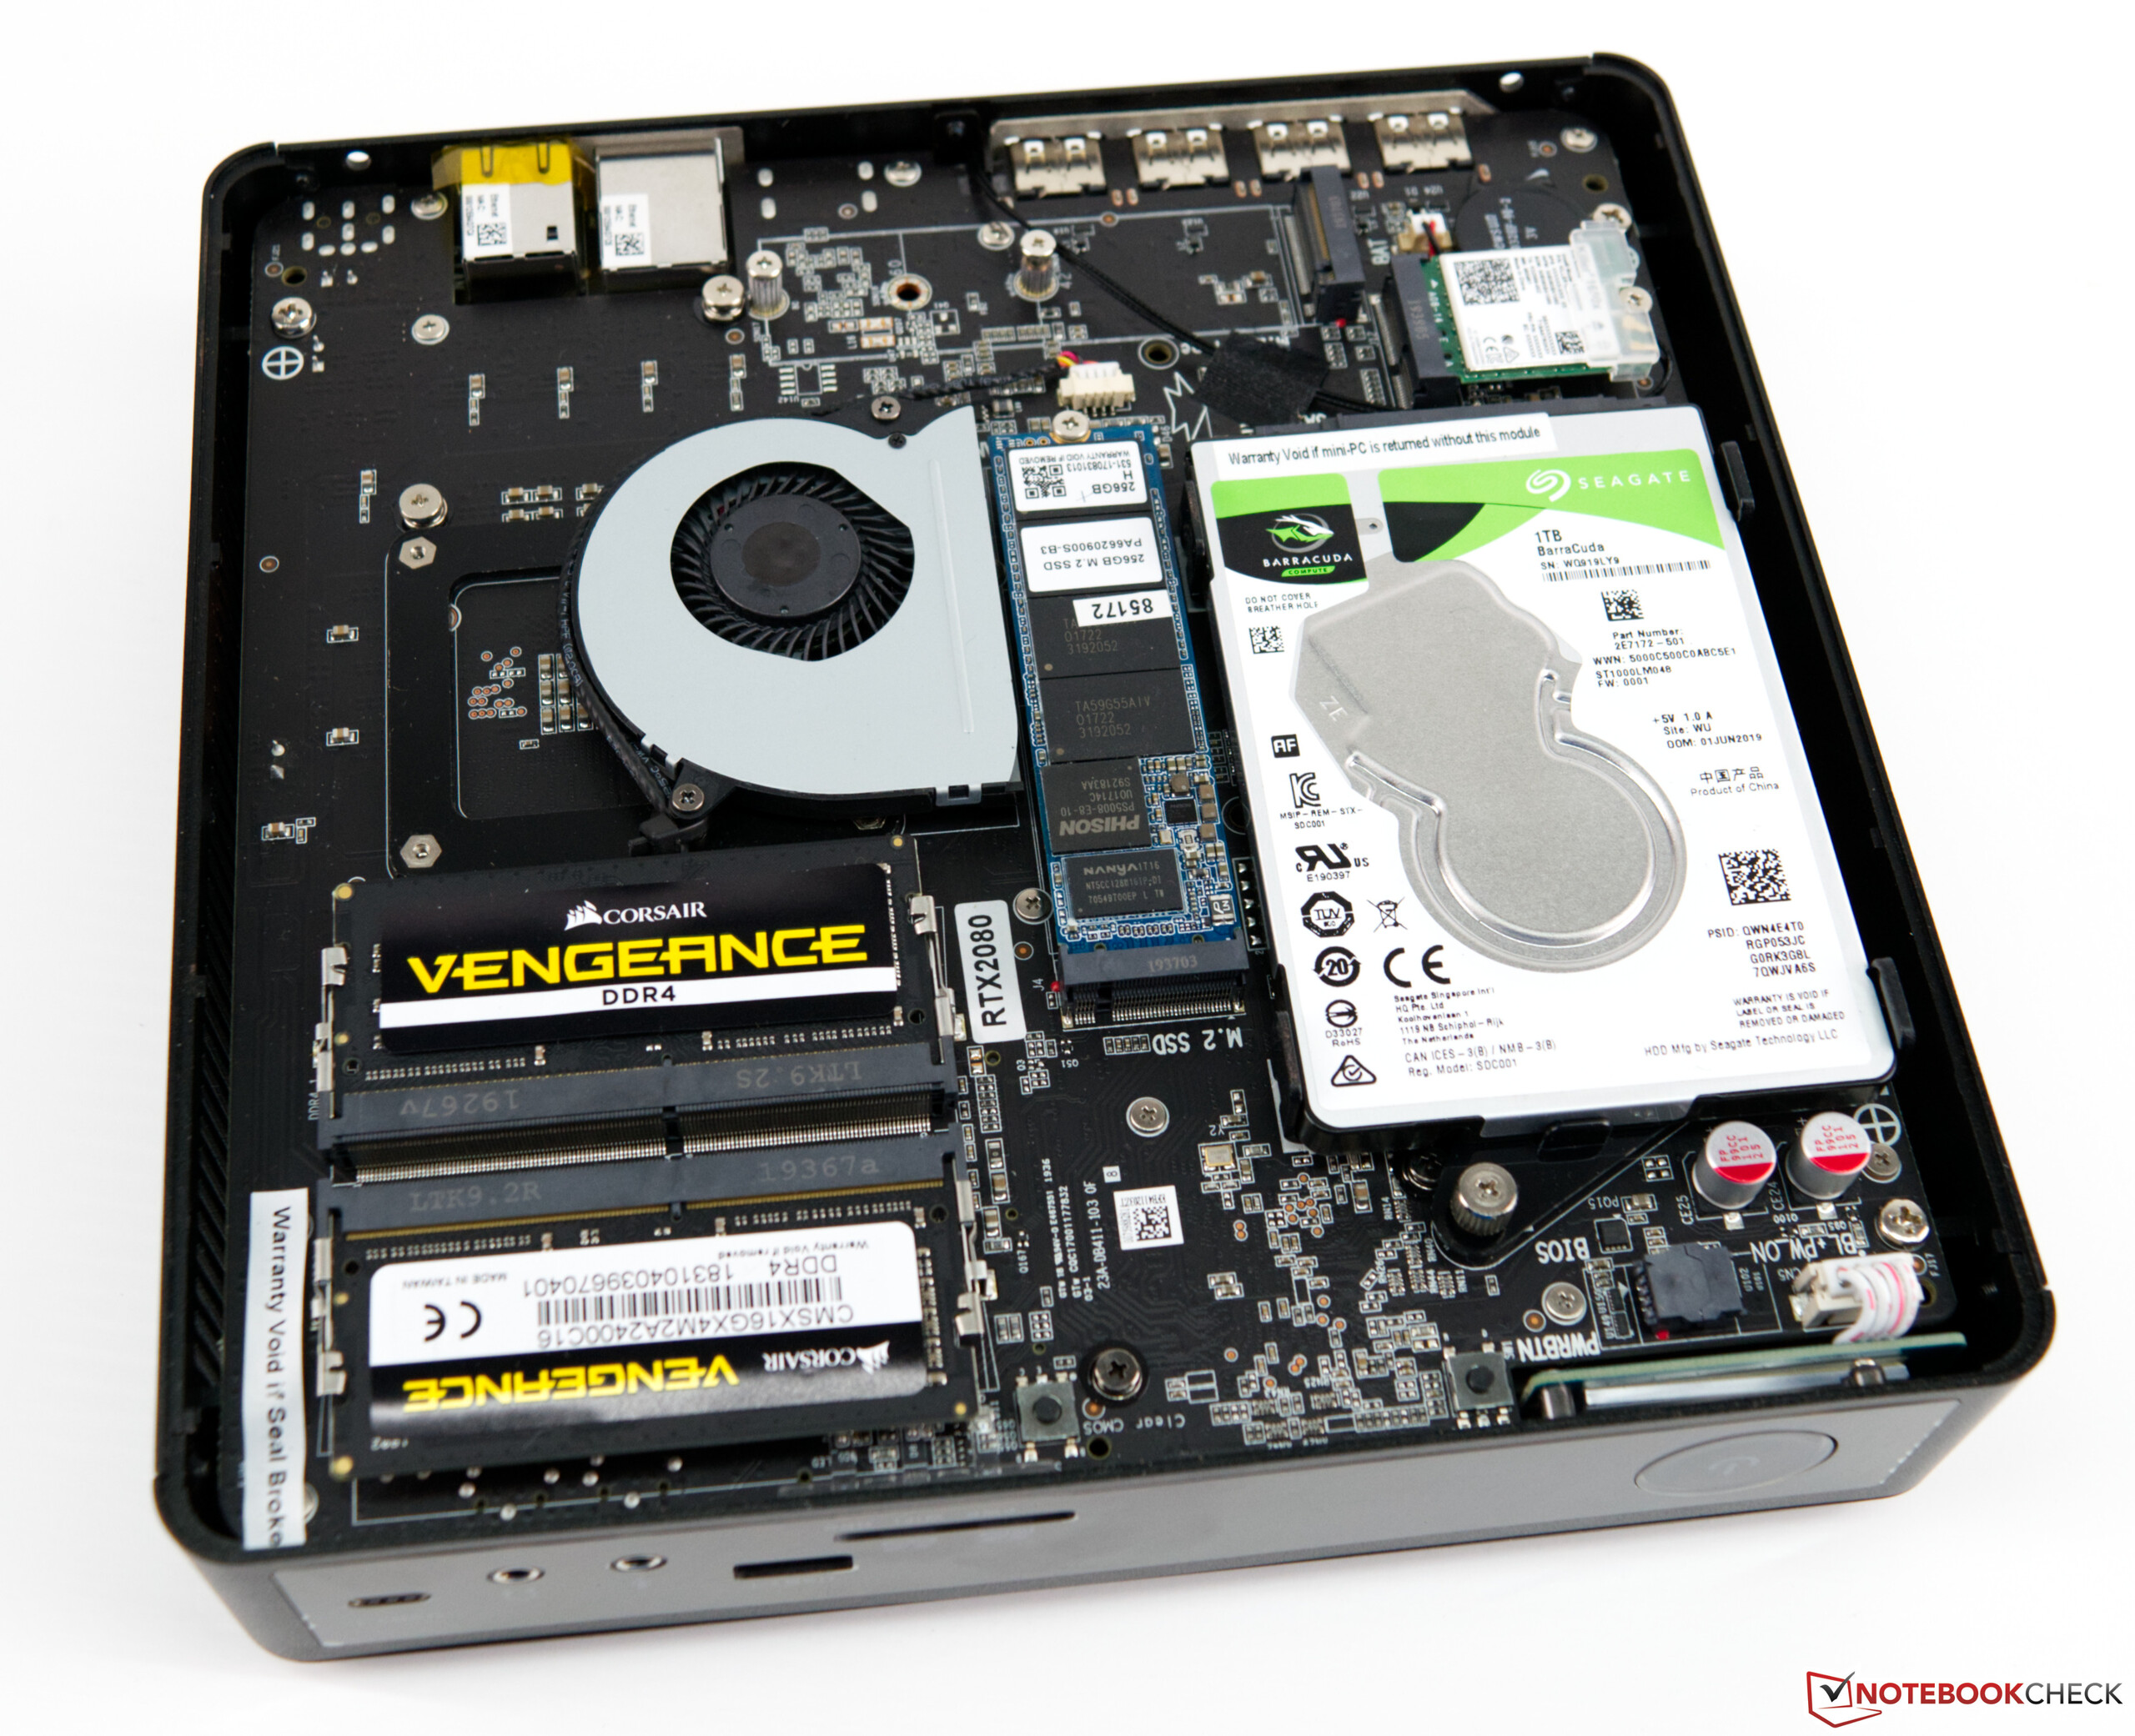
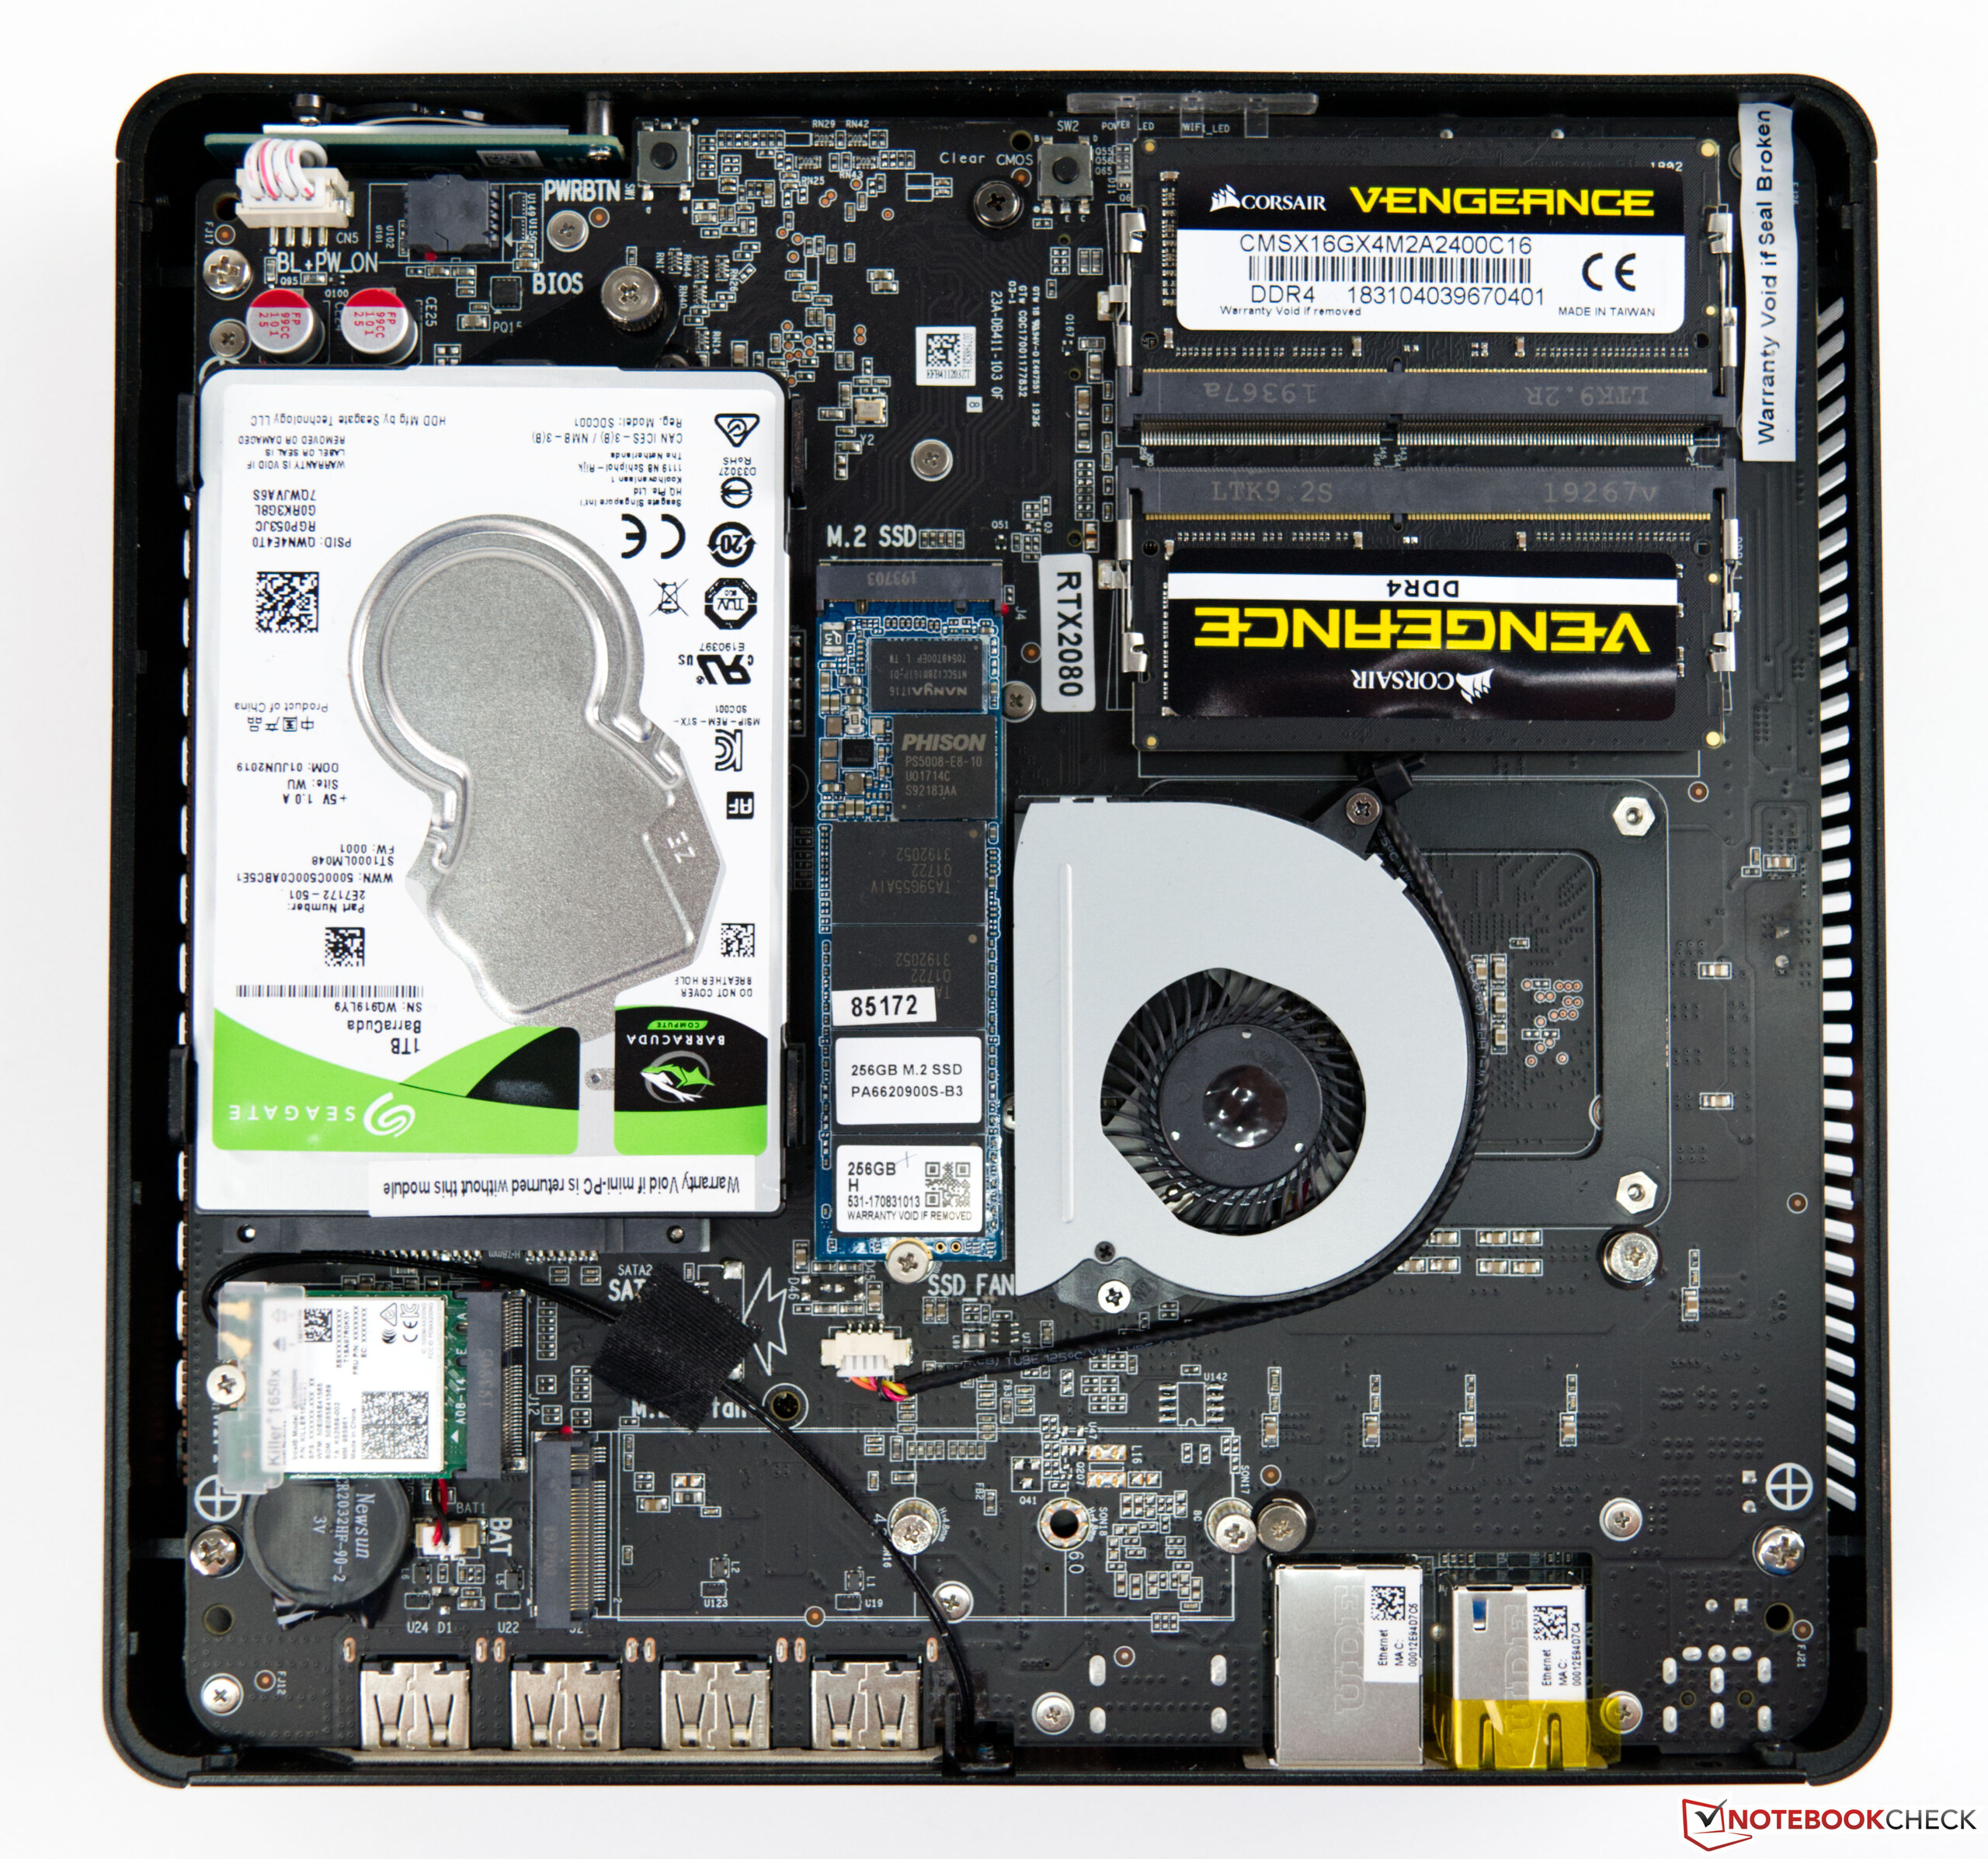
As mentioned at the beginning, the Zotac ZBOX Magnus is a barebone system. This means that it is up to the user to decide which storage device and which memory to install. The PC already comes with everything else. In our version, the Intel Core i7-9750H is installed together with the GeForce RTX 2080. In addition, many IO ports are located on the back and also on the front. Moreover, fast WLAN (Wi-Fi 6) and a dual-LAN port provide the necessary network connections.

For our review, Zotac has already equipped the device with an M.2 SSD and a hard drive. The same applies to the RAM. This can be expanded up to 32 GB if necessary.

Processor benchmarks

The Intel Core i7-9750H is a fast hexa-core processor that is primarily used in laptops. The manufacturer chose this processor because of its compactness and low power consumption. The ZBOX Magnus could deliver a good result in the test with its Core i7-9750H. The good cooling unit ensures that the SoC's performance is above the average of other Core i7-9750H processors that we've already tested. However, the ZBOX isn't able to beat Intel's Ghost Canyon NUC, which is due to the two missing cores, since Intel's NUC is equipped with a Core i9-9980HK.

CPU-Z
CPU-Z
CPU-Z
CPU-Z
CPU-Z
CPU-Z
CPU-Z
XTU
XTU (benchmark)
Cinebench R15
CPU Single 64Bit
Intel Core i9-10900K, NVIDIA Titan RTX
i9-10900K, 3700 MHz
224 Points +16%
Intel Core i9-9980HK, NVIDIA GeForce RTX 2070 (Desktop)
i9-9980HK, 2400 MHz
215 Points +11%
Intel Core i5-10600K, NVIDIA Titan RTX
i5-10600K, 4100 MHz
205 Points +6%
Average Intel Core i9-9980HK
  (181 - 215, n=13)
198.8 Points +3%
Intel Core i7-9750H, NVIDIA GeForce RTX 2080 Mobile
i7-9750H, 2600 MHz
193 Points
Average Intel Core i7-9750H
  (170 - 194, n=82)
183.7 Points -5%
Intel Core i5-9400F, NVIDIA Titan RTX
i5-9400F, 2900 MHz
173 Points -10%
Average Intel Core i5-9300H
  (169 - 176, n=11)
172.6 Points -11%
CPU Multi 64Bit
Intel Core i9-10900K, NVIDIA Titan RTX
i9-10900K, 3700 MHz
2620 Points +122%
Average Intel Core i9-9980HK
  (1327 - 1930, n=14)
1656 Points +40%
Intel Core i9-9980HK, NVIDIA GeForce RTX 2070 (Desktop)
i9-9980HK, 2400 MHz
1607 Points +36%
Intel Core i5-10600K, NVIDIA Titan RTX
i5-10600K, 4100 MHz
1452 Points +23%
Average Intel Core i7-9750H
  (952 - 1306, n=85)
1182 Points 0%
Intel Core i7-9750H, NVIDIA GeForce RTX 2080 Mobile
i7-9750H, 2600 MHz
1180 Points
Intel Core i5-9400F, NVIDIA Titan RTX
i5-9400F, 2900 MHz
984 Points -17%
Average Intel Core i5-9300H
  (717 - 850, n=11)
784 Points -34%
Cinebench R20
CPU (Single Core)
Intel Core i9-10900K, NVIDIA Titan RTX
i9-10900K, 3700 MHz
532 Points +9%
Intel Core i9-9980HK, NVIDIA GeForce RTX 2070 (Desktop)
i9-9980HK, 2400 MHz
504 Points +4%
Intel Core i7-9750H, NVIDIA GeForce RTX 2080 Mobile
i7-9750H, 2600 MHz
486 Points
Average Intel Core i9-9980HK
  (431 - 505, n=10)
471 Points -3%
Intel Core i5-10600K, NVIDIA Titan RTX
i5-10600K, 4100 MHz
464 Points -5%
Average Intel Core i7-9750H
  (416 - 486, n=55)
443 Points -9%
Intel Core i5-9400F, NVIDIA Titan RTX
i5-9400F, 2900 MHz
416 Points -14%
Average Intel Core i5-9300H
  (398 - 427, n=9)
415 Points -15%
CPU (Multi Core)
Intel Core i9-10900K, NVIDIA Titan RTX
i9-10900K, 3700 MHz
6381 Points +138%
Average Intel Core i9-9980HK
  (2974 - 4150, n=10)
3530 Points +32%
Intel Core i5-10600K, NVIDIA Titan RTX
i5-10600K, 4100 MHz
3443 Points +29%
Intel Core i9-9980HK, NVIDIA GeForce RTX 2070 (Desktop)
i9-9980HK, 2400 MHz
3357 Points +25%
Intel Core i7-9750H, NVIDIA GeForce RTX 2080 Mobile
i7-9750H, 2600 MHz
2679 Points
Average Intel Core i7-9750H
  (2017 - 3133, n=55)
2564 Points -4%
Intel Core i5-9400F, NVIDIA Titan RTX
i5-9400F, 2900 MHz
2378 Points -11%
Average Intel Core i5-9300H
  (1530 - 1877, n=9)
1727 Points -36%
Cinebench R11.5
CPU Single 64Bit
Intel Core i9-10900K, NVIDIA Titan RTX
i9-10900K, 3700 MHz
2.56 Points +17%
Intel Core i9-9980HK, NVIDIA GeForce RTX 2070 (Desktop)
i9-9980HK, 2400 MHz
2.4 Points +10%
Average Intel Core i9-9980HK
  (2.25 - 2.4, n=3)
2.31 Points +5%
Intel Core i5-10600K, NVIDIA Titan RTX
i5-10600K, 4100 MHz
2.19 Points 0%
Intel Core i7-9750H, NVIDIA GeForce RTX 2080 Mobile
i7-9750H, 2600 MHz
2.19 Points
Average Intel Core i7-9750H
  (1.96 - 2.19, n=10)
2.1 Points -4%
Intel Core i5-9400F, NVIDIA Titan RTX
i5-9400F, 2900 MHz
1.95 Points -11%
CPU Multi 64Bit
Intel Core i9-10900K, NVIDIA Titan RTX
i9-10900K, 3700 MHz
29.03 Points +124%
Intel Core i9-9980HK, NVIDIA GeForce RTX 2070 (Desktop)
i9-9980HK, 2400 MHz
18.04 Points +39%
Average Intel Core i9-9980HK
  (14.8 - 18, n=3)
16.7 Points +29%
Intel Core i5-10600K, NVIDIA Titan RTX
i5-10600K, 4100 MHz
15.76 Points +22%
Average Intel Core i7-9750H
  (11.3 - 14.1, n=10)
13 Points 0%
Intel Core i7-9750H, NVIDIA GeForce RTX 2080 Mobile
i7-9750H, 2600 MHz
12.96 Points
Intel Core i5-9400F, NVIDIA Titan RTX
i5-9400F, 2900 MHz
11.27 Points -13%
Cinebench R10
Rendering Single CPUs 64Bit
Intel Core i9-10900K, NVIDIA Titan RTX
i9-10900K, 3700 MHz
10625 Points +14%
Intel Core i9-9980HK, NVIDIA GeForce RTX 2070 (Desktop)
i9-9980HK, 2400 MHz
10359 Points +11%
Average Intel Core i9-9980HK
  ()
10359 Points +11%
Intel Core i5-10600K, NVIDIA Titan RTX
i5-10600K, 4100 MHz
9594 Points +3%
Intel Core i7-9750H, NVIDIA GeForce RTX 2080 Mobile
i7-9750H, 2600 MHz
9346 Points
Average Intel Core i7-9750H
  (9069 - 9346, n=3)
9165 Points -2%
Intel Core i5-9400F, NVIDIA Titan RTX
i5-9400F, 2900 MHz
8182 Points -12%
Rendering Multiple CPUs 64Bit
Intel Core i9-10900K, NVIDIA Titan RTX
i9-10900K, 3700 MHz
80495 Points +82%
Intel Core i9-9980HK, NVIDIA GeForce RTX 2070 (Desktop)
i9-9980HK, 2400 MHz
55742 Points +26%
Average Intel Core i9-9980HK
  ()
55742 Points +26%
Intel Core i5-10600K, NVIDIA Titan RTX
i5-10600K, 4100 MHz
51816 Points +17%
Intel Core i7-9750H, NVIDIA GeForce RTX 2080 Mobile
i7-9750H, 2600 MHz
44238 Points
Average Intel Core i7-9750H
  (37188 - 44238, n=3)
40129 Points -9%
Intel Core i5-9400F, NVIDIA Titan RTX
i5-9400F, 2900 MHz
40065 Points -9%
Blender - v2.79 BMW27 CPU
Average Intel Core i5-9300H
  (588 - 643, n=3)
611 Seconds * -49%
Intel Core i5-9400F, NVIDIA Titan RTX
i5-9400F, 2900 MHz
468.5 Seconds * -14%
Average Intel Core i7-9750H
  (342 - 495, n=21)
433 Seconds * -6%
Intel Core i7-9750H, NVIDIA GeForce RTX 2080 Mobile
i7-9750H, 2600 MHz
409.6 Seconds *
Average Intel Core i9-9980HK
  (317 - 527, n=3)
398 Seconds * +3%
Intel Core i9-9980HK, NVIDIA GeForce RTX 2070 (Desktop)
i9-9980HK, 2400 MHz
317.4 Seconds * +23%
Intel Core i5-10600K, NVIDIA Titan RTX
i5-10600K, 4100 MHz
302.4 Seconds * +26%
Intel Core i9-10900K, NVIDIA Titan RTX
i9-10900K, 3700 MHz
167.3 Seconds * +59%
wPrime 2.10
32m
Intel Core i5-9400F, NVIDIA Titan RTX
i5-9400F, 2900 MHz
6.757 s * -37%
Intel Core i7-9750H, NVIDIA GeForce RTX 2080 Mobile
i7-9750H, 2600 MHz
4.932 s *
Average Intel Core i7-9750H
  ()
4.93 s * -0%
Intel Core i5-10600K, NVIDIA Titan RTX
i5-10600K, 4100 MHz
4.648 s * +6%
Average Intel Core i9-9980HK
  (3.79 - 4.94, n=2)
4.36 s * +12%
Intel Core i9-9980HK, NVIDIA GeForce RTX 2070 (Desktop)
i9-9980HK, 2400 MHz
3.788 s * +23%
Intel Core i9-10900K, NVIDIA Titan RTX
i9-10900K, 3700 MHz
3.582 s * +27%
1024m
Intel Core i5-9400F, NVIDIA Titan RTX
i5-9400F, 2900 MHz
198.7 s * -29%
Intel Core i7-9750H, NVIDIA GeForce RTX 2080 Mobile
i7-9750H, 2600 MHz
154.4 s *
Average Intel Core i7-9750H
  ()
154.4 s * -0%
Intel Core i9-9980HK, NVIDIA GeForce RTX 2070 (Desktop)
i9-9980HK, 2400 MHz
120.2 s * +22%
Average Intel Core i9-9980HK
  (110.4 - 120.2, n=2)
115.3 s * +25%
Intel Core i5-10600K, NVIDIA Titan RTX
i5-10600K, 4100 MHz
113.2 s * +27%
Intel Core i9-10900K, NVIDIA Titan RTX
i9-10900K, 3700 MHz
66.3 s * +57%
X264 HD Benchmark 4.0
Pass 1
Intel Core i9-10900K, NVIDIA Titan RTX
i9-10900K, 3700 MHz
289.5 (289min - 291max) fps +37%
Intel Core i5-10600K, NVIDIA Titan RTX
i5-10600K, 4100 MHz
251.5 (250min - 253max) fps +19%
Average Intel Core i9-9980HK
  (238 - 239, n=2)
238 fps +13%
Intel Core i9-9980HK, NVIDIA GeForce RTX 2070 (Desktop)
i9-9980HK, 2400 MHz
237.5 (236min - 239max) fps +13%
Intel Core i5-9400F, NVIDIA Titan RTX
i5-9400F, 2900 MHz
234 (233min - 234max) fps +11%
Average Intel Core i7-9750H
  (211 - 219, n=2)
215 fps +2%
Intel Core i7-9750H, NVIDIA GeForce RTX 2080 Mobile
i7-9750H, 2600 MHz
211 (208min - 214max) fps
Average Intel Core i5-9300H
  ()
193.7 fps -8%
Pass 2
Intel Core i9-10900K, NVIDIA Titan RTX
i9-10900K, 3700 MHz
149 (149min - 149max) fps +110%
Average Intel Core i9-9980HK
  (92.8 - 94.8, n=2)
93.8 fps +32%
Intel Core i9-9980HK, NVIDIA GeForce RTX 2070 (Desktop)
i9-9980HK, 2400 MHz
92.8 (89.1min - 100max) fps +31%
Intel Core i5-10600K, NVIDIA Titan RTX
i5-10600K, 4100 MHz
88.2 (88min - 88.2max) fps +24%
Intel Core i7-9750H, NVIDIA GeForce RTX 2080 Mobile
i7-9750H, 2600 MHz
70.9 (70min - 71.6max) fps
Average Intel Core i7-9750H
  (69.6 - 70.9, n=2)
70.3 fps -1%
Intel Core i5-9400F, NVIDIA Titan RTX
i5-9400F, 2900 MHz
64 (63.9min - 64.1max) fps -10%
Average Intel Core i5-9300H
  ()
49.4 fps -30%
WinRAR - Result
Intel Core i9-10900K, NVIDIA Titan RTX
i9-10900K, 3700 MHz
9739 KB/s +58%
Average Intel Core i9-9980HK
  (7266 - 7436, n=2)
7351 KB/s +19%
Intel Core i9-9980HK, NVIDIA GeForce RTX 2070 (Desktop)
i9-9980HK, 2400 MHz
7266 KB/s +18%
Intel Core i5-10600K, NVIDIA Titan RTX
i5-10600K, 4100 MHz
6536 KB/s +6%
Average Intel Core i7-9750H
  (6160 - 6631, n=2)
6396 KB/s +4%
Intel Core i7-9750H, NVIDIA GeForce RTX 2080 Mobile
i7-9750H, 2600 MHz
6160 KB/s
Intel Core i5-9400F, NVIDIA Titan RTX
i5-9400F, 2900 MHz
5794 KB/s -6%
Average Intel Core i5-9300H
  ()
5663 KB/s -8%
TrueCrypt
AES Mean 100MB
Intel Core i9-10900K, NVIDIA Titan RTX
i9-10900K, 3700 MHz
14.6 GB/s +97%
Average Intel Core i9-9980HK
  (10.1 - 10.3, n=2)
10.2 GB/s +38%
Intel Core i9-9980HK, NVIDIA GeForce RTX 2070 (Desktop)
i9-9980HK, 2400 MHz
10.1 GB/s +36%
Intel Core i5-10600K, NVIDIA Titan RTX
i5-10600K, 4100 MHz
8 GB/s +8%
Intel Core i7-9750H, NVIDIA GeForce RTX 2080 Mobile
i7-9750H, 2600 MHz
7.4 GB/s
Average Intel Core i7-9750H
  (7.3 - 7.4, n=2)
7.35 GB/s -1%
Intel Core i5-9400F, NVIDIA Titan RTX
i5-9400F, 2900 MHz
5.2 GB/s -30%
Average Intel Core i5-9300H
  ()
4.7 GB/s -36%
Twofish Mean 100MB
Intel Core i9-10900K, NVIDIA Titan RTX
i9-10900K, 3700 MHz
2.6 GB/s +117%
Intel Core i9-9980HK, NVIDIA GeForce RTX 2070 (Desktop)
i9-9980HK, 2400 MHz
1.7 GB/s +42%
Average Intel Core i9-9980HK
  (1.7 - 1.7, n=2)
1.7 GB/s +42%
Intel Core i5-10600K, NVIDIA Titan RTX
i5-10600K, 4100 MHz
1.4 GB/s +17%
Average Intel Core i7-9750H
  (1.2 - 1.3, n=2)
1.25 GB/s +4%
Intel Core i7-9750H, NVIDIA GeForce RTX 2080 Mobile
i7-9750H, 2600 MHz
1.2 GB/s
Intel Core i5-9400F, NVIDIA Titan RTX
i5-9400F, 2900 MHz
0.86 GB/s -28%
Average Intel Core i5-9300H
  ()
0.84 GB/s -30%
Serpent Mean 100MB
Intel Core i9-10900K, NVIDIA Titan RTX
i9-10900K, 3700 MHz
1.5 GB/s +114%
Intel Core i9-9980HK, NVIDIA GeForce RTX 2070 (Desktop)
i9-9980HK, 2400 MHz
1 GB/s +43%
Average Intel Core i9-9980HK
  (1 - 1, n=2)
1 GB/s +43%
Intel Core i5-10600K, NVIDIA Titan RTX
i5-10600K, 4100 MHz
0.82 GB/s +17%
Average Intel Core i7-9750H
  (0.7 - 0.75, n=2)
0.725 GB/s +4%
Intel Core i7-9750H, NVIDIA GeForce RTX 2080 Mobile
i7-9750H, 2600 MHz
0.7 GB/s
Intel Core i5-9400F, NVIDIA Titan RTX
i5-9400F, 2900 MHz
0.51 GB/s -27%
Average Intel Core i5-9300H
  ()
0.5 GB/s -29%
Geekbench 5.5
Multi-Core
Intel Core i9-10900K, NVIDIA Titan RTX
i9-10900K, 3700 MHz
11414 Points +94%
Intel Core i9-9980HK, NVIDIA GeForce RTX 2070 (Desktop)
i9-9980HK, 2400 MHz
7568 Points +28%
Average Intel Core i9-9980HK
  (6945 - 7703, n=3)
7405 Points +26%
Intel Core i5-10600K, NVIDIA Titan RTX
i5-10600K, 4100 MHz
7248 Points +23%
Intel Core i7-9750H, NVIDIA GeForce RTX 2080 Mobile
i7-9750H, 2600 MHz
5894 Points
Intel Core i5-9400F, NVIDIA Titan RTX
i5-9400F, 2900 MHz
5715 Points -3%
Average Intel Core i7-9750H
  (4859 - 6262, n=13)
5597 Points -5%
Single-Core
Intel Core i9-10900K, NVIDIA Titan RTX
i9-10900K, 3700 MHz
1449 Points +18%
Intel Core i9-9980HK, NVIDIA GeForce RTX 2070 (Desktop)
i9-9980HK, 2400 MHz
1378 Points +12%
Average Intel Core i9-9980HK
  (1314 - 1378, n=2)
1346 Points +10%
Intel Core i5-10600K, NVIDIA Titan RTX
i5-10600K, 4100 MHz
1286 Points +5%
Intel Core i7-9750H, NVIDIA GeForce RTX 2080 Mobile
i7-9750H, 2600 MHz
1225 Points
Average Intel Core i7-9750H
  (1117 - 1251, n=13)
1190 Points -3%
Intel Core i5-9400F, NVIDIA Titan RTX
i5-9400F, 2900 MHz
1139 Points -7%
Geekbench 5.0
5.0 Multi-Core
Intel Core i9-10900K, NVIDIA Titan RTX
i9-10900K, 3700 MHz
11407 Points +94%
Intel Core i9-9980HK, NVIDIA GeForce RTX 2070 (Desktop)
i9-9980HK, 2400 MHz
7540 Points +28%
Average Intel Core i9-9980HK
  (7072 - 7805, n=4)
7421 Points +26%
Intel Core i5-10600K, NVIDIA Titan RTX
i5-10600K, 4100 MHz
7237 Points +23%
Intel Core i7-9750H, NVIDIA GeForce RTX 2080 Mobile
i7-9750H, 2600 MHz
5885 Points
Intel Core i5-9400F, NVIDIA Titan RTX
i5-9400F, 2900 MHz
5698 Points -3%
Average Intel Core i7-9750H
  (4812 - 6230, n=15)
5575 Points -5%
Average Intel Core i5-9300H
  (3697 - 4200, n=3)
4014 Points -32%
5.0 Single-Core
Intel Core i9-10900K, NVIDIA Titan RTX
i9-10900K, 3700 MHz
1440 Points +18%
Intel Core i9-9980HK, NVIDIA GeForce RTX 2070 (Desktop)
i9-9980HK, 2400 MHz
1355 Points +11%
Intel Core i5-10600K, NVIDIA Titan RTX
i5-10600K, 4100 MHz
1281 Points +5%
Average Intel Core i9-9980HK
  (1171 - 1355, n=4)
1273 Points +4%
Intel Core i7-9750H, NVIDIA GeForce RTX 2080 Mobile
i7-9750H, 2600 MHz
1219 Points
Average Intel Core i7-9750H
  (1105 - 1248, n=15)
1179 Points -3%
Intel Core i5-9400F, NVIDIA Titan RTX
i5-9400F, 2900 MHz
1132 Points -7%
Average Intel Core i5-9300H
  (1095 - 1137, n=3)
1118 Points -8%
Geekbench 4.4
64 Bit Single-Core Score
Intel Core i9-10900K, NVIDIA Titan RTX
i9-10900K, 3700 MHz
6348 Points +18%
Intel Core i9-9980HK, NVIDIA GeForce RTX 2070 (Desktop)
i9-9980HK, 2400 MHz
5969 Points +11%
Average Intel Core i9-9980HK
  (5617 - 5972, n=3)
5853 Points +8%
Intel Core i5-10600K, NVIDIA Titan RTX
i5-10600K, 4100 MHz
5821 Points +8%
Intel Core i7-9750H, NVIDIA GeForce RTX 2080 Mobile
i7-9750H, 2600 MHz
5401 Points
Intel Core i5-9400F, NVIDIA Titan RTX
i5-9400F, 2900 MHz
5347 Points -1%
Average Intel Core i7-9750H
  (4440 - 5511, n=27)
5238 Points -3%
Average Intel Core i5-9300H
  (4704 - 5089, n=7)
4898 Points -9%
64 Bit Multi-Core Score
Intel Core i9-10900K, NVIDIA Titan RTX
i9-10900K, 3700 MHz
43058 Points +87%
Average Intel Core i9-9980HK
  (28625 - 30849, n=3)
29620 Points +29%
Intel Core i9-9980HK, NVIDIA GeForce RTX 2070 (Desktop)
i9-9980HK, 2400 MHz
29385 Points +28%
Intel Core i5-10600K, NVIDIA Titan RTX
i5-10600K, 4100 MHz
28391 Points +23%
Intel Core i7-9750H, NVIDIA GeForce RTX 2080 Mobile
i7-9750H, 2600 MHz
23000 Points
Average Intel Core i7-9750H
  (17054 - 25043, n=27)
22076 Points -4%
Intel Core i5-9400F, NVIDIA Titan RTX
i5-9400F, 2900 MHz
21830 Points -5%
Average Intel Core i5-9300H
  (14853 - 17684, n=7)
16246 Points -29%
3DMark 11 - 1280x720 Performance Physics
Intel Core i9-10900K, NVIDIA Titan RTX
i9-10900K, 3700 MHz
22140 Points +71%
Intel Core i9-9980HK, NVIDIA GeForce RTX 2070 (Desktop)
i9-9980HK, 2400 MHz
16422 Points +27%
Intel Core i5-10600K, NVIDIA Titan RTX
i5-10600K, 4100 MHz
15961 Points +23%
Average Intel Core i9-9980HK
  (9056 - 18260, n=12)
15688 Points +21%
Intel Core i7-9750H, NVIDIA GeForce RTX 2080 Mobile
i7-9750H, 2600 MHz
12967 Points
Average Intel Core i7-9750H
  (9704 - 14337, n=80)
12766 Points -2%
Intel Core i5-9400F, NVIDIA Titan RTX
i5-9400F, 2900 MHz
11185 Points -14%
Average Intel Core i5-9300H
  (7499 - 10557, n=12)
8987 Points -31%
7-Zip 18.03
7z b 4
Intel Core i9-10900K, NVIDIA Titan RTX
i9-10900K, 3700 MHz
70968 MIPS +111%
Intel Core i9-9980HK, NVIDIA GeForce RTX 2070 (Desktop)
i9-9980HK, 2400 MHz
44081 MIPS +31%
Average Intel Core i9-9980HK
  (39566 - 44081, n=4)
41756 MIPS +24%
Intel Core i5-10600K, NVIDIA Titan RTX
i5-10600K, 4100 MHz
40379 MIPS +20%
Intel Core i7-9750H, NVIDIA GeForce RTX 2080 Mobile
i7-9750H, 2600 MHz
33556 MIPS
Average Intel Core i7-9750H
  (28512 - 35174, n=21)
32357 MIPS -4%
Intel Core i5-9400F, NVIDIA Titan RTX
i5-9400F, 2900 MHz
25639 MIPS -24%
Average Intel Core i5-9300H
  (20736 - 23155, n=3)
22008 MIPS -34%
7z b 4 -mmt1
Intel Core i9-10900K, NVIDIA Titan RTX
i9-10900K, 3700 MHz
5954 MIPS +17%
Intel Core i9-9980HK, NVIDIA GeForce RTX 2070 (Desktop)
i9-9980HK, 2400 MHz
5642 MIPS +11%
Average Intel Core i9-9980HK
  (5283 - 5642, n=4)
5426 MIPS +7%
Intel Core i5-10600K, NVIDIA Titan RTX
i5-10600K, 4100 MHz
5289 MIPS +4%
Intel Core i7-9750H, NVIDIA GeForce RTX 2080 Mobile
i7-9750H, 2600 MHz
5090 MIPS
Average Intel Core i7-9750H
  (4580 - 5090, n=21)
4846 MIPS -5%
Intel Core i5-9400F, NVIDIA Titan RTX
i5-9400F, 2900 MHz
4678 MIPS -8%
Average Intel Core i5-9300H
  (4542 - 4626, n=3)
4592 MIPS -10%
HWBOT x265 Benchmark v2.2 - 4k Preset
Intel Core i9-10900K, NVIDIA Titan RTX
i9-10900K, 3700 MHz
21 fps +134%
Intel Core i5-10600K, NVIDIA Titan RTX
i5-10600K, 4100 MHz
12.2 fps +36%
Average Intel Core i9-9980HK
  (10.8 - 12.4, n=3)
11.5 fps +28%
Intel Core i9-9980HK, NVIDIA GeForce RTX 2070 (Desktop)
i9-9980HK, 2400 MHz
11.4 fps +27%
Intel Core i5-9400F, NVIDIA Titan RTX
i5-9400F, 2900 MHz
9.07 fps +1%
Intel Core i7-9750H, NVIDIA GeForce RTX 2080 Mobile
i7-9750H, 2600 MHz
8.99 fps
Average Intel Core i7-9750H
  (7.1 - 10.7, n=21)
8.72 fps -3%
Average Intel Core i5-9300H
  (5.7 - 6.5, n=3)
6.07 fps -32%
R Benchmark 2.5 - Overall mean
Intel Core i5-9400F, NVIDIA Titan RTX
i5-9400F, 2900 MHz
0.667 sec * -10%
Average Intel Core i7-9750H
  (0.608 - 0.695, n=14)
0.643 sec * -6%
Intel Core i7-9750H, NVIDIA GeForce RTX 2080 Mobile
i7-9750H, 2600 MHz
0.608 sec *
Intel Core i5-10600K, NVIDIA Titan RTX
i5-10600K, 4100 MHz
0.593 sec * +2%
Intel Core i9-9980HK, NVIDIA GeForce RTX 2070 (Desktop)
i9-9980HK, 2400 MHz
0.541 sec * +11%
Average Intel Core i9-9980HK
  ()
0.541 sec * +11%
Intel Core i9-10900K, NVIDIA Titan RTX
i9-10900K, 3700 MHz
0.528 sec * +13%
LibreOffice - 20 Documents To PDF
Intel Core i9-10900K, NVIDIA Titan RTX
i9-10900K, 3700 MHz
76 s * -31%
Average Intel Core i7-9750H
  (54.5 - 64.7, n=9)
59 s * -2%
Intel Core i5-9400F, NVIDIA Titan RTX
i5-9400F, 2900 MHz
58.9 s * -2%
Intel Core i7-9750H, NVIDIA GeForce RTX 2080 Mobile
i7-9750H, 2600 MHz
57.8 s *
Average Intel Core i9-9980HK
  (45.2 - 57.5, n=2)
51.4 s * +11%
Intel Core i5-10600K, NVIDIA Titan RTX
i5-10600K, 4100 MHz
46.06 s * +20%
Intel Core i9-9980HK, NVIDIA GeForce RTX 2070 (Desktop)
i9-9980HK, 2400 MHz
45.23 s * +22%
WebXPRT 3 - Overall
Intel Core i9-10900K, NVIDIA Titan RTX
i9-10900K, 3700 MHz
255 Points +20%
Intel Core i5-10600K, NVIDIA Titan RTX
i5-10600K, 4100 MHz
239 Points +12%
Intel Core i9-9980HK, NVIDIA GeForce RTX 2070 (Desktop)
i9-9980HK, 2400 MHz
233 Points +9%
Average Intel Core i9-9980HK
  ()
233 Points +9%
Average Intel Core i5-9300H
  ()
222 Points +4%
Intel Core i7-9750H, NVIDIA GeForce RTX 2080 Mobile
i7-9750H, 2600 MHz
213 Points
Intel Core i5-9400F, NVIDIA Titan RTX
i5-9400F, 2900 MHz
211 Points -1%
Average Intel Core i7-9750H
  (199 - 231, n=10)
211 Points -1%
Mozilla Kraken 1.1 - Total
Average Intel Core i5-9300H
  (1079 - 1349, n=8)
1138 ms * -35%
Average Intel Core i7-9750H
  (845 - 1713, n=54)
1048 ms * -24%
Average Intel Core i9-9980HK
  (705 - 999, n=9)
878 ms * -4%
Intel Core i5-9400F, NVIDIA Titan RTX
i5-9400F, 2900 MHz
867 ms * -3%
Intel Core i7-9750H, NVIDIA GeForce RTX 2080 Mobile
i7-9750H, 2600 MHz
845 ms *
Intel Core i5-10600K, NVIDIA Titan RTX
i5-10600K, 4100 MHz
760 ms * +10%
Intel Core i9-9980HK, NVIDIA GeForce RTX 2070 (Desktop)
i9-9980HK, 2400 MHz
754 ms * +11%
Intel Core i9-10900K, NVIDIA Titan RTX
i9-10900K, 3700 MHz
709 ms * +16%
3DMark
3840x2160 Fire Strike Ultra Physics
Intel Core i9-10900K, NVIDIA Titan RTX
i9-10900K, 3700 MHz
29374 Points +67%
Intel Core i9-9980HK, NVIDIA GeForce RTX 2070 (Desktop)
i9-9980HK, 2400 MHz
21864 Points +24%
Average Intel Core i9-9980HK
  (19832 - 22568, n=8)
21323 Points +21%
Intel Core i5-10600K, NVIDIA Titan RTX
i5-10600K, 4100 MHz
19942 Points +13%
Intel Core i7-9750H, NVIDIA GeForce RTX 2080 Mobile
i7-9750H, 2600 MHz
17597 Points
Average Intel Core i7-9750H
  (12628 - 17820, n=51)
16437 Points -7%
Intel Core i5-9400F, NVIDIA Titan RTX
i5-9400F, 2900 MHz
12651 Points -28%
Average Intel Core i5-9300H
  (9749 - 12343, n=6)
11357 Points -35%
1920x1080 Fire Strike Physics
Intel Core i9-10900K, NVIDIA Titan RTX
i9-10900K, 3700 MHz
29805 Points +71%
Intel Core i9-9980HK, NVIDIA GeForce RTX 2070 (Desktop)
i9-9980HK, 2400 MHz
21706 Points +25%
Intel Core i5-10600K, NVIDIA Titan RTX
i5-10600K, 4100 MHz
20040 Points +15%
Average Intel Core i9-9980HK
  (11758 - 22463, n=11)
19893 Points +14%
Intel Core i7-9750H, NVIDIA GeForce RTX 2080 Mobile
i7-9750H, 2600 MHz
17416 Points
Average Intel Core i7-9750H
  (12438 - 17788, n=76)
16332 Points -6%
Intel Core i5-9400F, NVIDIA Titan RTX
i5-9400F, 2900 MHz
12616 Points -28%
Average Intel Core i5-9300H
  (9387 - 12349, n=12)
11376 Points -35%
2560x1440 Time Spy CPU
Intel Core i9-10900K, NVIDIA Titan RTX
i9-10900K, 3700 MHz
14326 Points +132%
Intel Core i9-9980HK, NVIDIA GeForce RTX 2070 (Desktop)
i9-9980HK, 2400 MHz
9417 Points +53%
Average Intel Core i9-9980HK
  (5540 - 10162, n=12)
8487 Points +38%
Intel Core i5-10600K, NVIDIA Titan RTX
i5-10600K, 4100 MHz
8290 Points +34%
Average Intel Core i7-9750H
  (4620 - 7171, n=70)
6334 Points +3%
Intel Core i7-9750H, NVIDIA GeForce RTX 2080 Mobile
i7-9750H, 2600 MHz
6167 Points
Intel Core i5-9400F, NVIDIA Titan RTX
i5-9400F, 2900 MHz
5777 Points -6%
Average Intel Core i5-9300H
  (3165 - 4861, n=10)
4074 Points -34%

* ... smaller is better

The Zotac ZBOX Magnus in the Cinebench R15 multi-loop

The compact design requires a cleverly devised and effective cooling system. This is exactly what Zotac's ZBOX Magnus offers, because the Cinebench R15 continuous loop doesn't show any serious performance loss even under sustained load. 

10801130118012301280133013801430148015301580Tooltip
Zotac ZBOX Magnus EN72070V Intel Core i7-9750H, Intel Core i7-9750H: Ø1107 (1097.27-1166.52)
Intel Ghost Canyon NUC (RTX 2070) Intel Core i9-9980HK, Intel Core i9-9980HK: Ø1463 (1410.79-1593.44)
Average Intel Core i7-9750H  : Ø1095 (1080-1184)

Application performance

The Zotac ZBOX Magnus passes the application benchmarks without any issues and delivers a good result. Compared to conventional desktop PCs, however, the mini PC gets the short end of the stick. Nevertheless, the performance difference in everyday work isn't noteworthy. The GeForce RTX 2080 Mobile fell somewhat behind in the graphics tests. But even the desktop version of the GeForce RTX 2070 couldn't deliver significantly better results in the Ghost Canyon NUC.

PCMark 10 - Score
AMD Ryzen 9 3950X, AMD Ryzen 9 3950X
NVIDIA Titan RTX
7869 Points +28%
Intel Core i9-10900K, Intel Core i9-10900K
NVIDIA Titan RTX
7641 Points +24%
Corsair One i160, Intel Core i9-9900K
NVIDIA GeForce RTX 2080 Ti (Desktop)
7329 Points +19%
Intel Core i5-10600K, Intel Core i5-10600K
NVIDIA Titan RTX
7279 Points +18%
Intel Ghost Canyon NUC (RTX 2070), Intel Core i9-9980HK
NVIDIA GeForce RTX 2070 (Desktop)
6939 Points +13%
Zotac ZBOX Magnus EN72070V, Intel Core i7-9750H
NVIDIA GeForce RTX 2080 Mobile
6159 Points
Average Intel Core i7-9750H
  (4395 - 6453, n=72)
5533 Points -10%
PCMark 8
Work Score Accelerated v2
Average Intel Core i7-9750H
  (4241 - 6593, n=57)
5461 Points +11%
AMD Ryzen 9 3950X, AMD Ryzen 9 3950X
NVIDIA Titan RTX
5388 Points +9%
Corsair One i160, Intel Core i9-9900K
NVIDIA GeForce RTX 2080 Ti (Desktop)
5296 Points +7%
Intel Core i5-10600K, Intel Core i5-10600K
NVIDIA Titan RTX
5148 Points +4%
Intel Core i9-10900K, Intel Core i9-10900K
NVIDIA Titan RTX
5115 Points +4%
Intel Ghost Canyon NUC (RTX 2070), Intel Core i9-9980HK
NVIDIA GeForce RTX 2070 (Desktop)
5066 Points +3%
Zotac ZBOX Magnus EN72070V, Intel Core i7-9750H
NVIDIA GeForce RTX 2080 Mobile
4927 Points
Creative Score Accelerated v2
Corsair One i160, Intel Core i9-9900K
NVIDIA GeForce RTX 2080 Ti (Desktop)
10550 Points +21%
AMD Ryzen 9 3950X, AMD Ryzen 9 3950X
NVIDIA Titan RTX
10402 Points +19%
Intel Core i5-10600K, Intel Core i5-10600K
NVIDIA Titan RTX
10349 Points +19%
Intel Core i9-10900K, Intel Core i9-10900K
NVIDIA Titan RTX
10245 Points +17%
Intel Ghost Canyon NUC (RTX 2070), Intel Core i9-9980HK
NVIDIA GeForce RTX 2070 (Desktop)
8969 Points +3%
Zotac ZBOX Magnus EN72070V, Intel Core i7-9750H
NVIDIA GeForce RTX 2080 Mobile
8733 Points
Average Intel Core i7-9750H
  (3753 - 8733, n=22)
6192 Points -29%
Home Score Accelerated v2
Corsair One i160, Intel Core i9-9900K
NVIDIA GeForce RTX 2080 Ti (Desktop)
5418 Points +8%
AMD Ryzen 9 3950X, AMD Ryzen 9 3950X
NVIDIA Titan RTX
5404 Points +8%
Intel Ghost Canyon NUC (RTX 2070), Intel Core i9-9980HK
NVIDIA GeForce RTX 2070 (Desktop)
5247 Points +5%
Intel Core i5-10600K, Intel Core i5-10600K
NVIDIA Titan RTX
5212 Points +4%
Intel Core i9-10900K, Intel Core i9-10900K
NVIDIA Titan RTX
5185 Points +4%
Zotac ZBOX Magnus EN72070V, Intel Core i7-9750H
NVIDIA GeForce RTX 2080 Mobile
5009 Points
Average Intel Core i7-9750H
  (3417 - 5661, n=56)
4424 Points -12%
SPECviewperf 12
1900x1060 Solidworks (sw-03)
Intel Core i9-10900K, Intel Core i9-10900K
NVIDIA Titan RTX
172.2 fps +163%
Intel Core i5-10600K, Intel Core i5-10600K
NVIDIA Titan RTX
158.2 fps +142%
AMD Ryzen 9 3950X, AMD Ryzen 9 3950X
NVIDIA Titan RTX
157.6 fps +141%
Average Intel Core i7-9750H
  (44.7 - 149.1, n=15)
95.8 fps +46%
Corsair One i160, Intel Core i9-9900K
NVIDIA GeForce RTX 2080 Ti (Desktop)
83.7 fps +28%
Zotac ZBOX Magnus EN72070V, Intel Core i7-9750H
NVIDIA GeForce RTX 2080 Mobile
65.5 fps
Intel Ghost Canyon NUC (RTX 2070), Intel Core i9-9980HK
NVIDIA GeForce RTX 2070 (Desktop)
59.2 fps -10%
1900x1060 Siemens NX (snx-02)
Intel Core i9-10900K, Intel Core i9-10900K
NVIDIA Titan RTX
263.3 fps +2137%
Intel Core i5-10600K, Intel Core i5-10600K
NVIDIA Titan RTX
259.1 fps +2101%
AMD Ryzen 9 3950X, AMD Ryzen 9 3950X
NVIDIA Titan RTX
254.8 fps +2065%
Average Intel Core i7-9750H
  (7.7 - 186, n=15)
87.5 fps +643%
Corsair One i160, Intel Core i9-9900K
NVIDIA GeForce RTX 2080 Ti (Desktop)
12.72 fps +8%
Zotac ZBOX Magnus EN72070V, Intel Core i7-9750H
NVIDIA GeForce RTX 2080 Mobile
11.77 fps
Intel Ghost Canyon NUC (RTX 2070), Intel Core i9-9980HK
NVIDIA GeForce RTX 2070 (Desktop)
9.08 fps -23%
1900x1060 Showcase (showcase-01)
Intel Core i5-10600K, Intel Core i5-10600K
NVIDIA Titan RTX
196.1 fps +60%
Intel Core i9-10900K, Intel Core i9-10900K
NVIDIA Titan RTX
192.4 fps +57%
AMD Ryzen 9 3950X, AMD Ryzen 9 3950X
NVIDIA Titan RTX
188.3 fps +54%
Corsair One i160, Intel Core i9-9900K
NVIDIA GeForce RTX 2080 Ti (Desktop)
182.3 fps +49%
Zotac ZBOX Magnus EN72070V, Intel Core i7-9750H
NVIDIA GeForce RTX 2080 Mobile
122.4 fps
Intel Ghost Canyon NUC (RTX 2070), Intel Core i9-9980HK
NVIDIA GeForce RTX 2070 (Desktop)
118.5 fps -3%
Average Intel Core i7-9750H
  (25.2 - 122.4, n=15)
79.3 fps -35%
1900x1060 Medical (medical-01)
Intel Core i5-10600K, Intel Core i5-10600K
NVIDIA Titan RTX
94.6 fps +151%
Intel Core i9-10900K, Intel Core i9-10900K
NVIDIA Titan RTX
94.5 fps +151%
AMD Ryzen 9 3950X, AMD Ryzen 9 3950X
NVIDIA Titan RTX
88.1 fps +134%
Corsair One i160, Intel Core i9-9900K
NVIDIA GeForce RTX 2080 Ti (Desktop)
56.6 fps +50%
Average Intel Core i7-9750H
  (14.7 - 65, n=12)
44.9 fps +19%
Intel Ghost Canyon NUC (RTX 2070), Intel Core i9-9980HK
NVIDIA GeForce RTX 2070 (Desktop)
40.14 fps +6%
Zotac ZBOX Magnus EN72070V, Intel Core i7-9750H
NVIDIA GeForce RTX 2080 Mobile
37.71 fps
1900x1060 Maya (maya-04)
Corsair One i160, Intel Core i9-9900K
NVIDIA GeForce RTX 2080 Ti (Desktop)
190.9 fps +19%
Intel Core i9-10900K, Intel Core i9-10900K
NVIDIA Titan RTX
188.7 fps +17%
AMD Ryzen 9 3950X, AMD Ryzen 9 3950X
NVIDIA Titan RTX
172.2 fps +7%
Intel Ghost Canyon NUC (RTX 2070), Intel Core i9-9980HK
NVIDIA GeForce RTX 2070 (Desktop)
171 fps +6%
Intel Core i5-10600K, Intel Core i5-10600K
NVIDIA Titan RTX
169.4 fps +5%
Zotac ZBOX Magnus EN72070V, Intel Core i7-9750H
NVIDIA GeForce RTX 2080 Mobile
160.6 fps
Average Intel Core i7-9750H
  (40.7 - 160.6, n=15)
88.7 fps -45%
1900x1060 Energy (energy-01)
Intel Core i5-10600K, Intel Core i5-10600K
NVIDIA Titan RTX
28.77 fps +148%
Intel Core i9-10900K, Intel Core i9-10900K
NVIDIA Titan RTX
28.72 fps +147%
AMD Ryzen 9 3950X, AMD Ryzen 9 3950X
NVIDIA Titan RTX
28.18 fps +143%
Corsair One i160, Intel Core i9-9900K
NVIDIA GeForce RTX 2080 Ti (Desktop)
16.72 fps +44%
Zotac ZBOX Magnus EN72070V, Intel Core i7-9750H
NVIDIA GeForce RTX 2080 Mobile
11.61 fps
Intel Ghost Canyon NUC (RTX 2070), Intel Core i9-9980HK
NVIDIA GeForce RTX 2070 (Desktop)
11.49 fps -1%
Average Intel Core i7-9750H
  (3.93 - 16.1, n=12)
10.9 fps -6%
1900x1060 Creo (creo-01)
Intel Core i9-10900K, Intel Core i9-10900K
NVIDIA Titan RTX
157.2 fps +173%
Intel Core i5-10600K, Intel Core i5-10600K
NVIDIA Titan RTX
142.7 fps +148%
AMD Ryzen 9 3950X, AMD Ryzen 9 3950X
NVIDIA Titan RTX
134.8 fps +134%
Average Intel Core i7-9750H
  (38.4 - 140.7, n=15)
90.2 fps +57%
Corsair One i160, Intel Core i9-9900K
NVIDIA GeForce RTX 2080 Ti (Desktop)
72.2 fps +26%
Zotac ZBOX Magnus EN72070V, Intel Core i7-9750H
NVIDIA GeForce RTX 2080 Mobile
57.5 fps
Intel Ghost Canyon NUC (RTX 2070), Intel Core i9-9980HK
NVIDIA GeForce RTX 2070 (Desktop)
52.2 fps -9%
1900x1060 Catia (catia-04)
Intel Core i9-10900K, Intel Core i9-10900K
NVIDIA Titan RTX
225.2 fps +126%
AMD Ryzen 9 3950X, AMD Ryzen 9 3950X
NVIDIA Titan RTX
218.4 fps +119%
Intel Core i5-10600K, Intel Core i5-10600K
NVIDIA Titan RTX
215.5 fps +116%
Corsair One i160, Intel Core i9-9900K
NVIDIA GeForce RTX 2080 Ti (Desktop)
120.8 fps +21%
Average Intel Core i7-9750H
  (54.2 - 161.9, n=15)
100.6 fps +1%
Zotac ZBOX Magnus EN72070V, Intel Core i7-9750H
NVIDIA GeForce RTX 2080 Mobile
99.8 fps
Intel Ghost Canyon NUC (RTX 2070), Intel Core i9-9980HK
NVIDIA GeForce RTX 2070 (Desktop)
78.3 fps -22%
1900x1060 3ds Max (3dsmax-05)
Intel Core i9-10900K, Intel Core i9-10900K
NVIDIA Titan RTX
297.4 fps +44%
Intel Core i5-10600K, Intel Core i5-10600K
NVIDIA Titan RTX
296.9 fps +43%
AMD Ryzen 9 3950X, AMD Ryzen 9 3950X
NVIDIA Titan RTX
274.5 fps +32%
Corsair One i160, Intel Core i9-9900K
NVIDIA GeForce RTX 2080 Ti (Desktop)
271.8 fps +31%
Zotac ZBOX Magnus EN72070V, Intel Core i7-9750H
NVIDIA GeForce RTX 2080 Mobile
207.2 fps
Intel Ghost Canyon NUC (RTX 2070), Intel Core i9-9980HK
NVIDIA GeForce RTX 2070 (Desktop)
180.8 fps -13%
Average Intel Core i7-9750H
  (57.5 - 207, n=11)
156 fps -25%
SPECviewperf 13
Solidworks (sw-04)
Intel Core i9-10900K, Intel Core i9-10900K
NVIDIA Titan RTX
166.2 fps +77%
Intel Core i5-10600K, Intel Core i5-10600K
NVIDIA Titan RTX
153.9 fps +64%
AMD Ryzen 9 3950X, AMD Ryzen 9 3950X
NVIDIA Titan RTX
153.2 fps +63%
Corsair One i160, Intel Core i9-9900K
NVIDIA GeForce RTX 2080 Ti (Desktop)
116.3 fps +24%
Average Intel Core i7-9750H
  (64.8 - 125.4, n=15)
101.2 fps +8%
Zotac ZBOX Magnus EN72070V, Intel Core i7-9750H
NVIDIA GeForce RTX 2080 Mobile
93.9 fps
Intel Ghost Canyon NUC (RTX 2070), Intel Core i9-9980HK
NVIDIA GeForce RTX 2070 (Desktop)
85.4 fps -9%
Siemens NX (snx-03)
Intel Core i9-10900K, Intel Core i9-10900K
NVIDIA Titan RTX
472.9 fps +2135%
Intel Core i5-10600K, Intel Core i5-10600K
NVIDIA Titan RTX
469.1 fps +2117%
AMD Ryzen 9 3950X, AMD Ryzen 9 3950X
NVIDIA Titan RTX
460 fps +2074%
Average Intel Core i7-9750H
  (13.9 - 306, n=15)
158.8 fps +650%
Corsair One i160, Intel Core i9-9900K
NVIDIA GeForce RTX 2080 Ti (Desktop)
23.03 fps +9%
Zotac ZBOX Magnus EN72070V, Intel Core i7-9750H
NVIDIA GeForce RTX 2080 Mobile
21.16 fps
Intel Ghost Canyon NUC (RTX 2070), Intel Core i9-9980HK
NVIDIA GeForce RTX 2070 (Desktop)
16.33 fps -23%
Showcase (showcase-02)
Intel Core i5-10600K, Intel Core i5-10600K
NVIDIA Titan RTX
195.1 fps +60%
Intel Core i9-10900K, Intel Core i9-10900K
NVIDIA Titan RTX
194.1 fps +60%
AMD Ryzen 9 3950X, AMD Ryzen 9 3950X
NVIDIA Titan RTX
186.8 fps +54%
Corsair One i160, Intel Core i9-9900K
NVIDIA GeForce RTX 2080 Ti (Desktop)
182.6 fps +50%
Zotac ZBOX Magnus EN72070V, Intel Core i7-9750H
NVIDIA GeForce RTX 2080 Mobile
121.6 fps
Intel Ghost Canyon NUC (RTX 2070), Intel Core i9-9980HK
NVIDIA GeForce RTX 2070 (Desktop)
118.5 fps -3%
Average Intel Core i7-9750H
  (25.2 - 121.6, n=15)
77.4 fps -36%
Medical (medical-02)
AMD Ryzen 9 3950X, AMD Ryzen 9 3950X
NVIDIA Titan RTX
90.3 fps +46%
Intel Core i5-10600K, Intel Core i5-10600K
NVIDIA Titan RTX
89.7 fps +45%
Intel Core i9-10900K, Intel Core i9-10900K
NVIDIA Titan RTX
88.7 fps +44%
Corsair One i160, Intel Core i9-9900K
NVIDIA GeForce RTX 2080 Ti (Desktop)
85 fps +38%
Zotac ZBOX Magnus EN72070V, Intel Core i7-9750H
NVIDIA GeForce RTX 2080 Mobile
61.8 fps
Average Intel Core i7-9750H
  (13.1 - 88.9, n=12)
58.5 fps -5%
Intel Ghost Canyon NUC (RTX 2070), Intel Core i9-9980HK
NVIDIA GeForce RTX 2070 (Desktop)
56.4 fps -9%
Maya (maya-05)
Intel Core i9-10900K, Intel Core i9-10900K
NVIDIA Titan RTX
405.9 fps +38%
Corsair One i160, Intel Core i9-9900K
NVIDIA GeForce RTX 2080 Ti (Desktop)
402 fps +36%
AMD Ryzen 9 3950X, AMD Ryzen 9 3950X
NVIDIA Titan RTX
394.9 fps +34%
Intel Core i5-10600K, Intel Core i5-10600K
NVIDIA Titan RTX
387.5 fps +31%
Zotac ZBOX Magnus EN72070V, Intel Core i7-9750H
NVIDIA GeForce RTX 2080 Mobile
294.9 fps
Intel Ghost Canyon NUC (RTX 2070), Intel Core i9-9980HK
NVIDIA GeForce RTX 2070 (Desktop)
281 fps -5%
Average Intel Core i7-9750H
  (68.8 - 295, n=15)
173.8 fps -41%
Energy (energy-02)
Intel Core i5-10600K, Intel Core i5-10600K
NVIDIA Titan RTX
53.3 fps +146%
Intel Core i9-10900K, Intel Core i9-10900K
NVIDIA Titan RTX
53.2 fps +145%
AMD Ryzen 9 3950X, AMD Ryzen 9 3950X
NVIDIA Titan RTX
52.4 fps +141%
Corsair One i160, Intel Core i9-9900K
NVIDIA GeForce RTX 2080 Ti (Desktop)
31.93 fps +47%
Average Intel Core i7-9750H
  (7.29 - 38, n=12)
24.1 fps +11%
Intel Ghost Canyon NUC (RTX 2070), Intel Core i9-9980HK
NVIDIA GeForce RTX 2070 (Desktop)
21.83 fps +1%
Zotac ZBOX Magnus EN72070V, Intel Core i7-9750H
NVIDIA GeForce RTX 2080 Mobile
21.71 fps
Creo (creo-02)
Intel Core i9-10900K, Intel Core i9-10900K
NVIDIA Titan RTX
336.3 fps +65%
Intel Core i5-10600K, Intel Core i5-10600K
NVIDIA Titan RTX
331.7 fps +62%
AMD Ryzen 9 3950X, AMD Ryzen 9 3950X
NVIDIA Titan RTX
328.8 fps +61%
Corsair One i160, Intel Core i9-9900K
NVIDIA GeForce RTX 2080 Ti (Desktop)
286.1 fps +40%
Zotac ZBOX Magnus EN72070V, Intel Core i7-9750H
NVIDIA GeForce RTX 2080 Mobile
204.3 fps
Intel Ghost Canyon NUC (RTX 2070), Intel Core i9-9980HK
NVIDIA GeForce RTX 2070 (Desktop)
183.8 fps -10%
Average Intel Core i7-9750H
  (67.7 - 218, n=15)
160.3 fps -22%
Catia (catia-05)
Intel Core i9-10900K, Intel Core i9-10900K
NVIDIA Titan RTX
362.1 fps +148%
AMD Ryzen 9 3950X, AMD Ryzen 9 3950X
NVIDIA Titan RTX
355.2 fps +143%
Intel Core i5-10600K, Intel Core i5-10600K
NVIDIA Titan RTX
341.7 fps +134%
Corsair One i160, Intel Core i9-9900K
NVIDIA GeForce RTX 2080 Ti (Desktop)
177.3 fps +21%
Average Intel Core i7-9750H
  (77.1 - 215, n=15)
154.8 fps +6%
Zotac ZBOX Magnus EN72070V, Intel Core i7-9750H
NVIDIA GeForce RTX 2080 Mobile
146.1 fps
Intel Ghost Canyon NUC (RTX 2070), Intel Core i9-9980HK
NVIDIA GeForce RTX 2070 (Desktop)
113.7 fps -22%
3ds Max (3dsmax-06)
Intel Core i5-10600K, Intel Core i5-10600K
NVIDIA Titan RTX
294.4 fps +45%
Intel Core i9-10900K, Intel Core i9-10900K
NVIDIA Titan RTX
292.5 fps +44%
AMD Ryzen 9 3950X, AMD Ryzen 9 3950X
NVIDIA Titan RTX
274.5 fps +35%
Corsair One i160, Intel Core i9-9900K
NVIDIA GeForce RTX 2080 Ti (Desktop)
265.9 fps +31%
Zotac ZBOX Magnus EN72070V, Intel Core i7-9750H
NVIDIA GeForce RTX 2080 Mobile
203 fps
Intel Ghost Canyon NUC (RTX 2070), Intel Core i9-9980HK
NVIDIA GeForce RTX 2070 (Desktop)
178.6 fps -12%
Average Intel Core i7-9750H
  (56.7 - 203, n=15)
145.1 fps -29%

3D and gaming performance

The built-in graphics card is of decisive importance for 3D performance. In our case, the ZBOX Magnus offers a very good choice with the GeForce RTX 2080, which also provides some future-proofing. The mobile version of the RTX 2080 loses in direct comparison with the GeForce RTX 2070 desktop version. Nonetheless, all games can be played smoothly in 1080p with maximum details. The Zotac ZBOX Magnus can even handle a higher resolution of 1440p. Only from 2160p does the GeForce RTX 2080 Mobile no longer manage to generate smooth frame rates in every game. The same fate befalls the Nvidia GeForce RTX 2070 in the Intel Ghost Canyon NUC.

Borderlands 3
1280x720 Very Low Overall Quality (DX11)
Intel Ghost Canyon NUC (RTX 2070)
GeForce RTX 2070 (Desktop), i9-9980HK, Kingston KC2500 1 TB SKC2500M81000G
152 fps +19%
Average NVIDIA GeForce RTX 2080 Mobile
  (128 - 150, n=2)
139 fps +9%
Zotac ZBOX Magnus EN72070V
GeForce RTX 2080 Mobile, i7-9750H
128 fps
1920x1080 Badass Overall Quality (DX11)
Zotac ZBOX Magnus EN72070V
GeForce RTX 2080 Mobile, i7-9750H
84.3 fps
Average NVIDIA GeForce RTX 2080 Mobile
  (79.4 - 89.4, n=4)
83.8 fps -1%
Intel Ghost Canyon NUC (RTX 2070)
GeForce RTX 2070 (Desktop), i9-9980HK, Kingston KC2500 1 TB SKC2500M81000G
70.9 fps -16%
Metro Exodus
1280x720 Low Quality AF:4x
Intel Ghost Canyon NUC (RTX 2070)
GeForce RTX 2070 (Desktop), i9-9980HK, Kingston KC2500 1 TB SKC2500M81000G
181 (100.48min - 268.67max) fps +21%
Average NVIDIA GeForce RTX 2080 Mobile
  (149 - 165, n=2)
157 fps +5%
Zotac ZBOX Magnus EN72070V
GeForce RTX 2080 Mobile, i7-9750H
149 (77.18min - 225.38max) fps
1920x1080 Ultra Quality AF:16x
Average NVIDIA GeForce RTX 2080 Mobile
  (67.7 - 77.4, n=5)
71.8 fps +3%
Zotac ZBOX Magnus EN72070V
GeForce RTX 2080 Mobile, i7-9750H
69.5 (33.32min - 121.08max) fps
Intel Ghost Canyon NUC (RTX 2070)
GeForce RTX 2070 (Desktop), i9-9980HK, Kingston KC2500 1 TB SKC2500M81000G
60.9 (33.61min - 92.62max) fps -12%
Far Cry New Dawn
1280x720 Low Preset
Intel Ghost Canyon NUC (RTX 2070)
GeForce RTX 2070 (Desktop), i9-9980HK, Kingston KC2500 1 TB SKC2500M81000G
128 (92min - 190max) fps +9%
Zotac ZBOX Magnus EN72070V
GeForce RTX 2080 Mobile, i7-9750H
117 (83min - 171max) fps
Average NVIDIA GeForce RTX 2080 Mobile
  (109 - 117, n=2)
113 fps -3%
1920x1080 Ultra Preset
Average NVIDIA GeForce RTX 2080 Mobile
  (82 - 108, n=5)
93 fps +6%
Zotac ZBOX Magnus EN72070V
GeForce RTX 2080 Mobile, i7-9750H
88 (63min - 134max) fps
Intel Ghost Canyon NUC (RTX 2070)
GeForce RTX 2070 (Desktop), i9-9980HK, Kingston KC2500 1 TB SKC2500M81000G
79 (61min - 99max) fps -10%
Forza Horizon 4
1280x720 Very Low Preset
Intel Ghost Canyon NUC (RTX 2070)
GeForce RTX 2070 (Desktop), i9-9980HK, Kingston KC2500 1 TB SKC2500M81000G
198 fps +17%
Zotac ZBOX Magnus EN72070V
GeForce RTX 2080 Mobile, i7-9750H
169 fps
Average NVIDIA GeForce RTX 2080 Mobile
  ()
169 fps 0%
1920x1080 Ultra Preset AA:2xMS
Zotac ZBOX Magnus EN72070V
GeForce RTX 2080 Mobile, i7-9750H
139 fps
Average NVIDIA GeForce RTX 2080 Mobile
  ()
139 fps 0%
Intel Ghost Canyon NUC (RTX 2070)
GeForce RTX 2070 (Desktop), i9-9980HK, Kingston KC2500 1 TB SKC2500M81000G
106 fps -24%
Far Cry 5
1280x720 Low Preset AA:T
Intel Ghost Canyon NUC (RTX 2070)
GeForce RTX 2070 (Desktop), i9-9980HK, Kingston KC2500 1 TB SKC2500M81000G
147 (119min - 193max) fps +20%
Zotac ZBOX Magnus EN72070V
GeForce RTX 2080 Mobile, i7-9750H
123 (94min - 156max) fps
Average NVIDIA GeForce RTX 2080 Mobile
  (123 - 123, n=2)
123 fps 0%
1920x1080 Ultra Preset AA:T
Average NVIDIA GeForce RTX 2080 Mobile
  (73 - 115, n=3)
94.7 fps +30%
Intel Ghost Canyon NUC (RTX 2070)
GeForce RTX 2070 (Desktop), i9-9980HK, Kingston KC2500 1 TB SKC2500M81000G
86 (68min - 111max) fps +18%
Zotac ZBOX Magnus EN72070V
GeForce RTX 2080 Mobile, i7-9750H
73 (59min - 94max) fps
X-Plane 11.11
1280x720 low (fps_test=1)
Intel Ghost Canyon NUC (RTX 2070)
GeForce RTX 2070 (Desktop), i9-9980HK, Kingston KC2500 1 TB SKC2500M81000G
127 fps +11%
Zotac ZBOX Magnus EN72070V
GeForce RTX 2080 Mobile, i7-9750H
114 fps
Average NVIDIA GeForce RTX 2080 Mobile
  (98.2 - 114, n=3)
104.7 fps -8%
1920x1080 high (fps_test=3)
Intel Ghost Canyon NUC (RTX 2070)
GeForce RTX 2070 (Desktop), i9-9980HK, Kingston KC2500 1 TB SKC2500M81000G
92.7 fps +9%
Zotac ZBOX Magnus EN72070V
GeForce RTX 2080 Mobile, i7-9750H
84.7 fps
Average NVIDIA GeForce RTX 2080 Mobile
  (73.1 - 84.7, n=3)
77.6 fps -8%
Final Fantasy XV Benchmark
1280x720 Lite Quality
Intel Ghost Canyon NUC (RTX 2070)
GeForce RTX 2070 (Desktop), i9-9980HK, Kingston KC2500 1 TB SKC2500M81000G
193 (94min - 237max) fps +29%
Zotac ZBOX Magnus EN72070V
GeForce RTX 2080 Mobile, i7-9750H
150 fps
Average NVIDIA GeForce RTX 2080 Mobile
  ()
150 fps 0%
1920x1080 High Quality
Average NVIDIA GeForce RTX 2080 Mobile
  (90.6 - 108, n=3)
99.2 fps +9%
Intel Ghost Canyon NUC (RTX 2070)
GeForce RTX 2070 (Desktop), i9-9980HK, Kingston KC2500 1 TB SKC2500M81000G
90.6 (56min - 138max) fps 0%
Zotac ZBOX Magnus EN72070V
GeForce RTX 2080 Mobile, i7-9750H
90.6 fps
Dota 2 Reborn
1280x720 min (0/3) fastest
Intel Ghost Canyon NUC (RTX 2070)
GeForce RTX 2070 (Desktop), i9-9980HK, Kingston KC2500 1 TB SKC2500M81000G
155.6 (135.2min) fps +7%
Zotac ZBOX Magnus EN72070V
GeForce RTX 2080 Mobile, i7-9750H
145.2 (127.2min) fps
Average NVIDIA GeForce RTX 2080 Mobile
  (134.8 - 152.8, n=3)
144.3 fps -1%
1920x1080 ultra (3/3) best looking
Intel Ghost Canyon NUC (RTX 2070)
GeForce RTX 2070 (Desktop), i9-9980HK, Kingston KC2500 1 TB SKC2500M81000G
130.3 (114.9min) fps +5%
Zotac ZBOX Magnus EN72070V
GeForce RTX 2080 Mobile, i7-9750H
124.6 (108.1min) fps
Average NVIDIA GeForce RTX 2080 Mobile
  (103.9 - 133.8, n=3)
120.8 fps -3%
The Witcher 3
1024x768 Low Graphics & Postprocessing
Zotac ZBOX Magnus EN72070V
GeForce RTX 2080 Mobile, i7-9750H
338 (303min - 379max) fps
Average NVIDIA GeForce RTX 2080 Mobile
  (195.8 - 414, n=9)
322 fps -5%
Intel Ghost Canyon NUC (RTX 2070)
GeForce RTX 2070 (Desktop), i9-9980HK, Kingston KC2500 1 TB SKC2500M81000G
286 (243min - 334max) fps -15%
1920x1080 Ultra Graphics & Postprocessing (HBAO+)
Zotac ZBOX Magnus EN72070V
GeForce RTX 2080 Mobile, i7-9750H
95.9 (87min - 106max) fps
Average NVIDIA GeForce RTX 2080 Mobile
  (82.2 - 105, n=16)
95.6 fps 0%
Intel Ghost Canyon NUC (RTX 2070)
GeForce RTX 2070 (Desktop), i9-9980HK, Kingston KC2500 1 TB SKC2500M81000G
83.1 (72min - 93max) fps -13%
3DMark
Fire Strike Extreme Graphics
Average NVIDIA GeForce RTX 2080 Mobile
  (11133 - 12514, n=2)
11824 Points +6%
Zotac ZBOX Magnus EN72070V
GeForce RTX 2080 Mobile, i7-9750H
11133 Points
Intel Ghost Canyon NUC (RTX 2070)
GeForce RTX 2070 (Desktop), i9-9980HK, Kingston KC2500 1 TB SKC2500M81000G
9979 Points -10%
1920x1080 Fire Strike Graphics
Average NVIDIA GeForce RTX 2080 Mobile
  (22504 - 27319, n=16)
25211 Points +12%
Zotac ZBOX Magnus EN72070V
GeForce RTX 2080 Mobile, i7-9750H
22504 Points
Intel Ghost Canyon NUC (RTX 2070)
GeForce RTX 2070 (Desktop), i9-9980HK, Kingston KC2500 1 TB SKC2500M81000G
20775 Points -8%
2560x1440 Time Spy Graphics
Average NVIDIA GeForce RTX 2080 Mobile
  (9411 - 10992, n=15)
10046 Points +7%
Zotac ZBOX Magnus EN72070V
GeForce RTX 2080 Mobile, i7-9750H
9411 Points
Intel Ghost Canyon NUC (RTX 2070)
GeForce RTX 2070 (Desktop), i9-9980HK, Kingston KC2500 1 TB SKC2500M81000G
8631 Points -8%
3DMark 11
1280x720 Performance GPU
Average NVIDIA GeForce RTX 2080 Mobile
  (31826 - 38809, n=17)
35286 Points +11%
Zotac ZBOX Magnus EN72070V
GeForce RTX 2080 Mobile, i7-9750H
31877 Points
Intel Ghost Canyon NUC (RTX 2070)
GeForce RTX 2070 (Desktop), i9-9980HK, Kingston KC2500 1 TB SKC2500M81000G
28828 Points -10%
1280x720 Performance
Average NVIDIA GeForce RTX 2080 Mobile
  (20224 - 29759, n=19)
26032 Points +12%
Intel Ghost Canyon NUC (RTX 2070)
GeForce RTX 2070 (Desktop), i9-9980HK, Kingston KC2500 1 TB SKC2500M81000G
24131 Points +4%
Zotac ZBOX Magnus EN72070V
GeForce RTX 2080 Mobile, i7-9750H
23165 Points
low med. high ultraQHD4K
The Witcher 3 (2015) 338 279 175 95.9 63.9
Dota 2 Reborn (2015) 145.2 135.5 130.5 124.6 119
Final Fantasy XV Benchmark (2018) 150 117 90.6 67.7 39.5
X-Plane 11.11 (2018) 114 102 84.7 73
Far Cry 5 (2018) 123 72 84 73 67 52
Forza Horizon 4 (2018) 169 147 145 139 122 82
Far Cry New Dawn (2019) 117 102 97 88 82 54
Metro Exodus (2019) 149 112 88.1 69.5 54.8 35.1
Borderlands 3 (2019) 128 117 93.4 84.3 61.4 33.2

Energy consumption and heat development in the ZBOX Magnus

Zotac ZBOX Magnus in the stress test

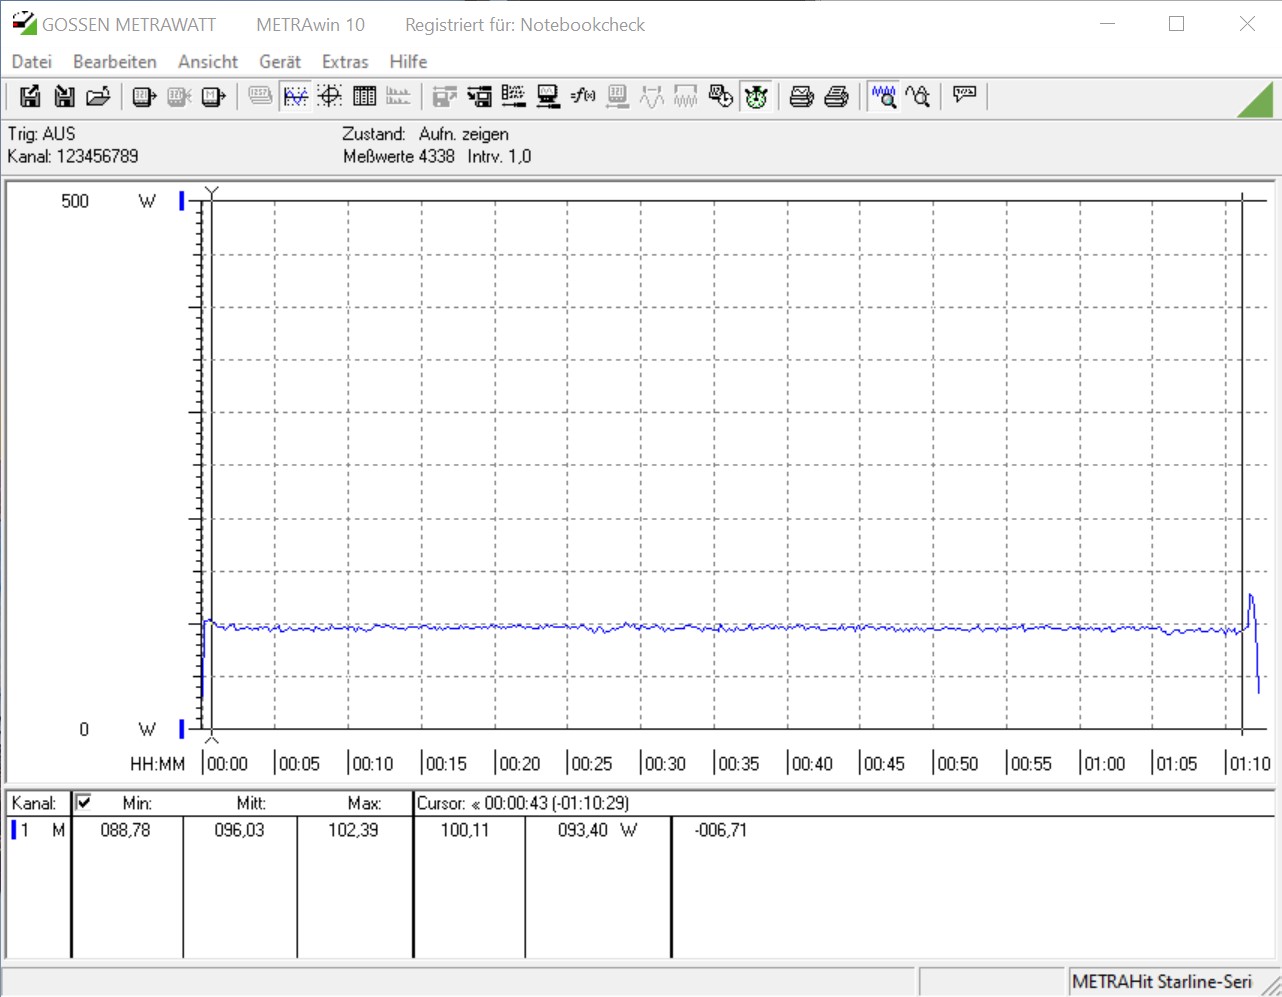
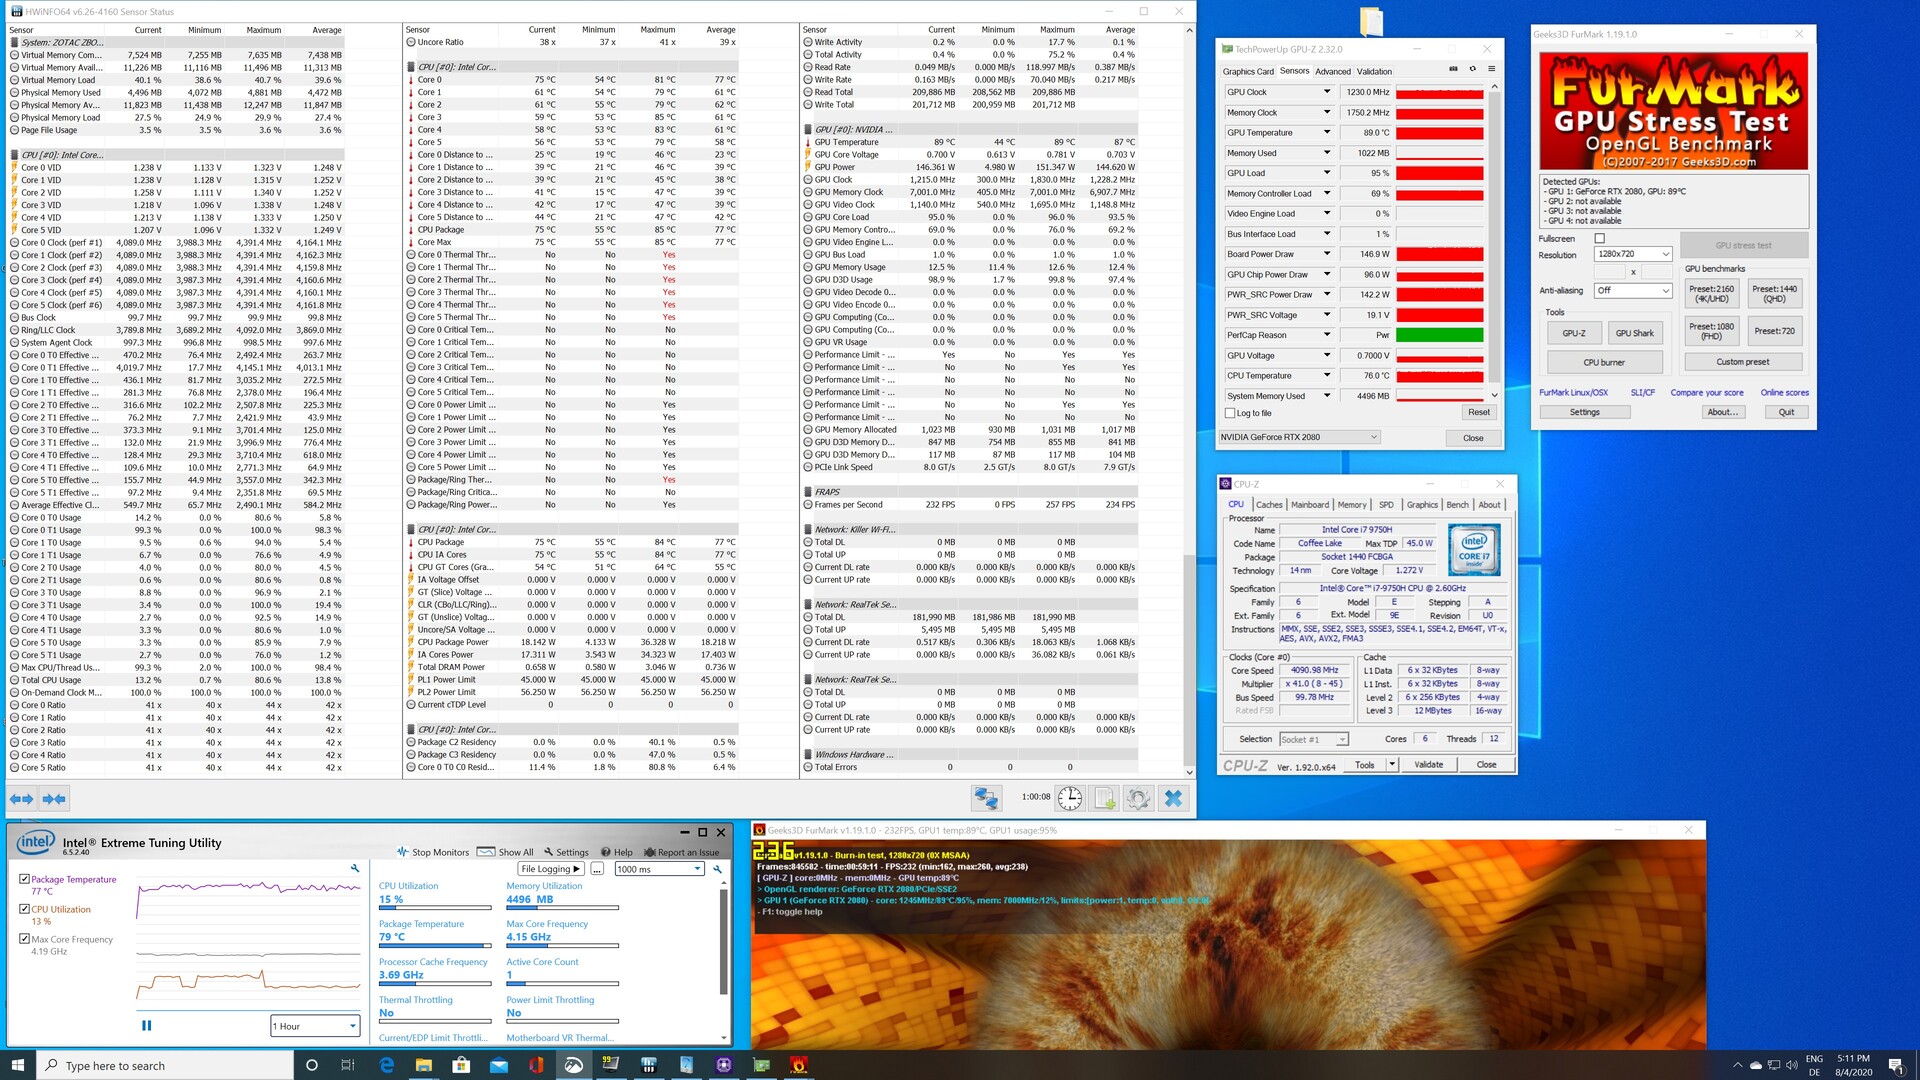
The ZBOX Magnus from Zotac has a cleverly devised cooling system that cools the components effectively and reliably. Most of the heat is conducted out of the case through the sides and the back. We liked the noise level under load very much, because the mini PC was audible but not disturbing at 38.6 dB(A). Thanks to the fan noise not being high-frequency, the mini PC doesn't generate an annoying operating noise under full load either. When playing games, the background noise was even a bit quieter at 37.2 dB(A). Despite the good cooling, the processor and graphics card heat up to almost 90 °C (~194 °F) in our stress test. This is still within the intended specifications.

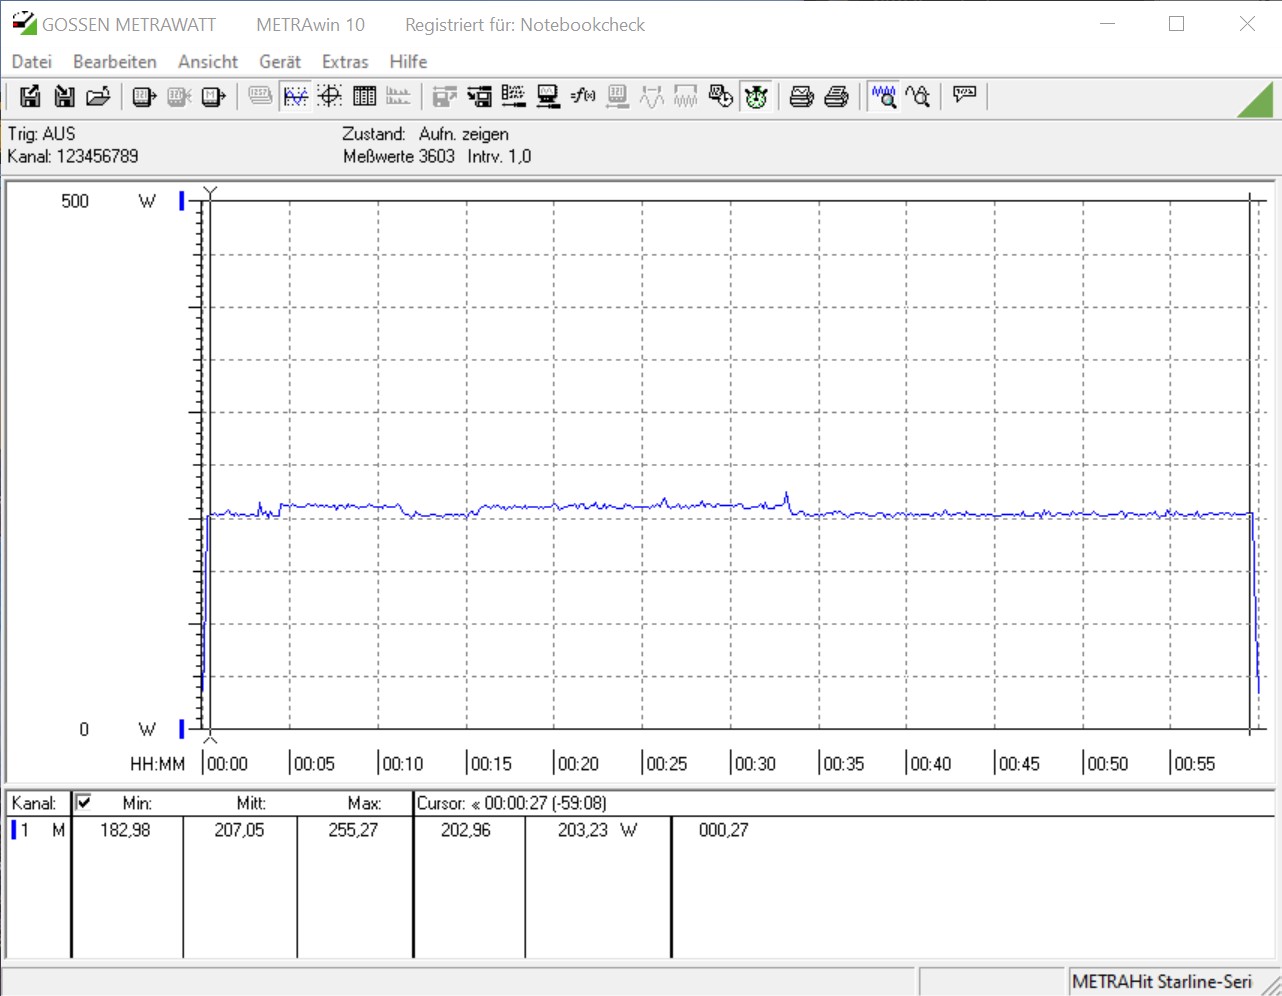
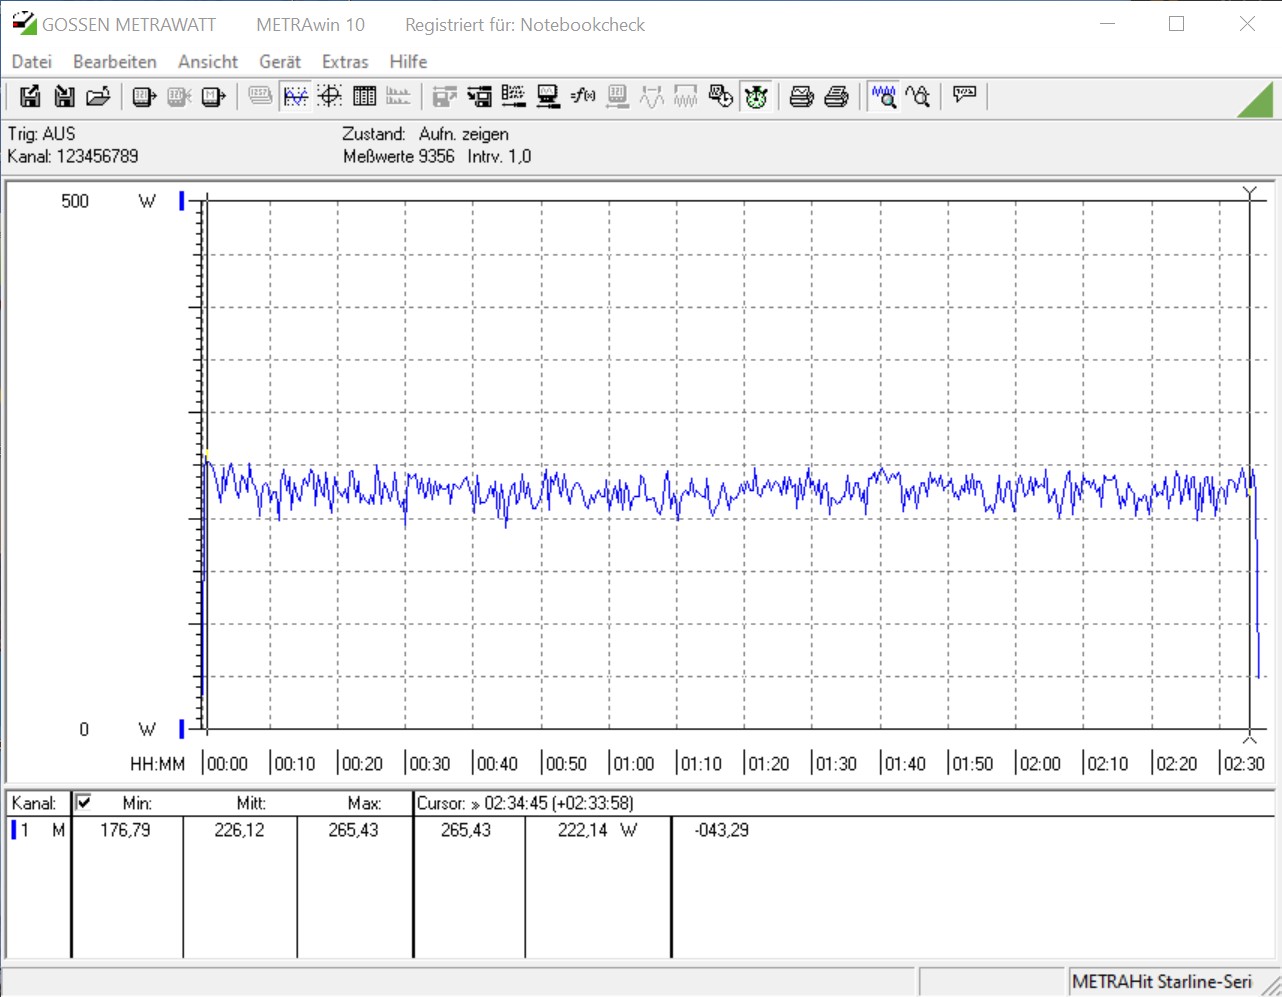
The real strength of the ZBOX lies in its energy efficiency, because our test sample is very economical compared to a conventional desktop PC. The ZBOX Magnus was also able to hold its own against the Ghost Canyon NUC with lower energy consumption. We measured a maximum of 236 watts while playing games, since the CPU and GPU are under extreme load here. The 330-watt power adapter has no problems with this value.

Power Consumption
1920x1080 The Witcher 3 ultra (external Monitor)
AMD Ryzen 9 3950X
NVIDIA Titan RTX, R9 3950X, Intel Optane 905P 480GB 2.5 (Idle: 95 W)
423.6 (400min - 442max) Watt * -106%
Intel Core i9-10900K
NVIDIA Titan RTX, i9-10900K, WDC PC SN720 SDAQNTW-512G (Idle: 52.3 W)
396.2 (380min - 475max) Watt * -93%
Intel Core i5-10600K
NVIDIA Titan RTX, i5-10600K (Idle: 52.2 W)
386.9 (380min - 404max) Watt * -88%
Intel Core i5 9400F
NVIDIA Titan RTX, i5-9400F (Idle: 57 W)
379.5 (292min - 402max) Watt * -85%
Intel Ghost Canyon NUC (RTX 2070)
GeForce RTX 2070 (Desktop), i9-9980HK, Kingston KC2500 1 TB SKC2500M81000G (Idle: 33.1 W)
237.1 (227min - 263max) Watt * -15%
Zotac ZBOX Magnus EN72070V
GeForce RTX 2080 Mobile, i7-9750H (Idle: 25.7 W)
205.3 (76min - 236max) Watt *
Prime95 V2810 Stress (external Monitor)
Intel Core i9-10900K
NVIDIA Titan RTX, i9-10900K, WDC PC SN720 SDAQNTW-512G (Idle: 52.3 W)
275.7 (254min - 385max) Watt * -187%
Intel Core i5-10600K
NVIDIA Titan RTX, i5-10600K (Idle: 52.2 W)
204.4 (191min - 261max) Watt * -113%
AMD Ryzen 9 3950X
NVIDIA Titan RTX, R9 3950X, Intel Optane 905P 480GB 2.5 (Idle: 95 W)
198.8 (185min - 240max) Watt * -107%
Intel Core i5 9400F
NVIDIA Titan RTX, i5-9400F (Idle: 57 W)
131.6 (122min - 187max) Watt * -37%
Intel Ghost Canyon NUC (RTX 2070)
GeForce RTX 2070 (Desktop), i9-9980HK, Kingston KC2500 1 TB SKC2500M81000G (Idle: 33.1 W)
109.4 (107min - 151max) Watt * -14%
Zotac ZBOX Magnus EN72070V
GeForce RTX 2080 Mobile, i7-9750H (Idle: 25.7 W)
96 (89min - 102max) Watt *
Cinebench R15 Multi (external Monitor)
Intel Core i9-10900K
NVIDIA Titan RTX, i9-10900K, WDC PC SN720 SDAQNTW-512G (Idle: 52.3 W)
268.5 (265min - 270max) Watt * -181%
AMD Ryzen 9 3950X
NVIDIA Titan RTX, R9 3950X, Intel Optane 905P 480GB 2.5 (Idle: 95 W)
219.5 (218min - 225max) Watt * -130%
Intel Core i5-10600K
NVIDIA Titan RTX, i5-10600K (Idle: 52.2 W)
172.5 (170min - 176max) Watt * -81%
Intel Core i5 9400F
NVIDIA Titan RTX, i5-9400F (Idle: 57 W)
122.5 (121min - 125max) Watt * -28%
Zotac ZBOX Magnus EN72070V
GeForce RTX 2080 Mobile, i7-9750H (Idle: 25.7 W)
95.4 (93min - 108max) Watt *
Temperatures - CPU Temperature Prime95
Intel Core i9-10900K
NVIDIA Titan RTX, i9-10900K, WDC PC SN720 SDAQNTW-512G
88 °C +2%
Zotac ZBOX Magnus EN72070V
GeForce RTX 2080 Mobile, i7-9750H
86 °C
AMD Ryzen 9 3950X
NVIDIA Titan RTX, R9 3950X, Intel Optane 905P 480GB 2.5
83.8 °C -3%
Intel Core i5-10600K
NVIDIA Titan RTX, i5-10600K
70 °C -19%
Intel Core i5 9400F
NVIDIA Titan RTX, i5-9400F
61 °C -29%

* ... smaller is better

Zotac ZBOX Magnus - Idle power consumption
Zotac ZBOX Magnus - Prime95 power consumption
Zotac ZBOX Magnus - FurMark power consumption
Zotac ZBOX Magnus - Prime95 and FurMark power consumption
Zotac ZBOX Magnus - Cinebench R15 Multi power consumption
Zotac ZBOX Magnus - The Witcher 3 power consumption (Ultra preset)
Zotac ZBOX Magnus - Stress test Prime95 only
Zotac ZBOX Magnus - Stress test FurMark only
Zotac ZBOX Magnus - Stress test Prime95 and FurMark


Pros

+ very compact
+ manufactured with high quality
+ suitable for gaming
+ relatively quiet under load
+ many connections
+ good system performance
+ 3 storage devices can be installed (2x M.2 2280, 1x 2.5")
+ Wi-Fi 6

Cons

- high price
- not ready for operation out of the box (barebone)
- few upgrade options (CPU and GPU are firmly installed)

Verdict - Powerful and quiet ZBOX Magnus

Zotac ZBOX Magnus. Provided by Zotac Germany

The Zotac ZBOX Magnus is not just any pre-built PC, but as a barebone system, it offers the user the possibility to complete the device according to his needs. You can choose the storage devices and type of memory freely. Unfortunately, users are limited when it comes to the processor and the graphics card, because upgrading these components later isn't possible.

We tested the ZBOX Magnus with the Intel Core i7-9750H in combination with the Nvidia GeForce RTX 2080 Mobile. In terms of pure performance, you can run all modern games smoothly with the small PC without having to sacrifice details. However, the WQHD resolution is required. The ZBOX also masters many titles in UHD, although you often have to reduce the details here. Conversely, the GeForce RTX 2080 Mobile delivers about the same performance as the GeForce RTX 2070 Desktop.

The Zotac ZBOX Magnus is a powerful gaming PC in the mini format. However, before buying it, you should familiarize yourself with the peculiarities of a barebone system.

The system delivers a big advantage in terms of volume. Very compact devices are often very loud and suffer from strong heat development. On the whole, Zotac has a very good grip on the heat problem, and the noise level under load is also alright at just under 39 dB(A).

Those who want to invest 1,700 Euros (~$2,004) in the barebone system now know the advantages and disadvantages that the ZBOX Magnus offers. In terms of price, both Intel with the Ghost Canyon NUC and Zotac with the ZBOX Magnus don't give in easily. However, one must consider that the Ghost Canyon NUC doesn't include a dedicated graphics card in the purchase price. Consequently, this point clearly goes to Zotac.

Read all 2 comments / answer
static version load dynamic
Loading comments
Comment on this article
Please share our article, every link counts!
> Expert Reviews and News on Laptops, Smartphones and Tech Innovations > Reviews > Zotac ZBOX Magnus mini PC with GeForce RTX 2080 in review
Sebastian Bade, 2020-08-10 (Update: 2021-03-12)