

Lenovo ThinkBook 16p in laptop review: A crowd-pleaser if you're ready for some compromises
Users who thought the ThinkBook 15p was still a bit too old-fashioned might want to take a look at the new ThinkBook 16p now. It's 16:10 instead of 16:9, it has a high screen-to-body ratio instead of generous bezels, and it also comes with a potentially powerful graphics card as well as a strong processor. Lenovo squeezes one of the increasingly popular 16-inch displays into a 15-inch case and increases the vertical pixel count. And instead of an NVIDIA GeForce GTX 1650 Ti Max-Q, you get an NVIDIA GeForce RTX 3060 laptop GPU and a strong AMD Ryzen 9 5900HX on top. This gives the ThinkBook an immense performance boost and propels it into the gaming segment.
The competitors of the "powerful creativity tool" (Lenovo) include gaming and multimedia laptops like the Dell Inspiron 16 Plus 7610 with the RTX 3050, and the Razer Blade 15 Base Model, but also dedicated gaming devices like the Alienware m15 R5 or the Schenker XMG Core 15. We also use the virtual predecessor, the Lenovo ThinkBook 15p, for comparison.
Possible contenders in comparison
Rating | Date | Model | Weight | Height | Size | Resolution | Price |
|---|---|---|---|---|---|---|---|
| 87 % v7 (old) | 09 / 2021 | Lenovo ThinkBook 16p G2 ACH R9 5900HX, GeForce RTX 3060 Laptop GPU | 2 kg | 19.5 mm | 16.00" | 2560x1600 | |
| 86.4 % v7 (old) | 03 / 2021 | Lenovo ThinkBook 15p Gen1 4K i7-10750H, GeForce GTX 1650 Ti Max-Q | 2 kg | 19.9 mm | 15.60" | 3840x2160 | |
| 86.7 % v7 (old) | 08 / 2021 | Dell Inspiron 16 Plus 7610 i7-11800H, GeForce RTX 3050 4GB Laptop GPU | 2 kg | 18.99 mm | 16.00" | 3072x1920 | |
| 85.5 % v7 (old) | 03 / 2021 | Razer Blade 15 Base Edition 2021, i7-10750H RTX 3060 i7-10750H, GeForce RTX 3060 Laptop GPU | 2.1 kg | 19.9 mm | 15.60" | 1920x1080 | |
| 84.7 % v7 (old) | 06 / 2021 | Alienware m15 R5 Ryzen Edition R7 5800H, GeForce RTX 3060 Laptop GPU | 2.5 kg | 22.85 mm | 15.60" | 1920x1080 | |
| 84.9 % v7 (old) | 03 / 2021 | Schenker XMG Core 15 Ampere R7 4800H, GeForce RTX 3060 Laptop GPU | 2 kg | 22.9 mm | 15.60" | 2560x1440 |
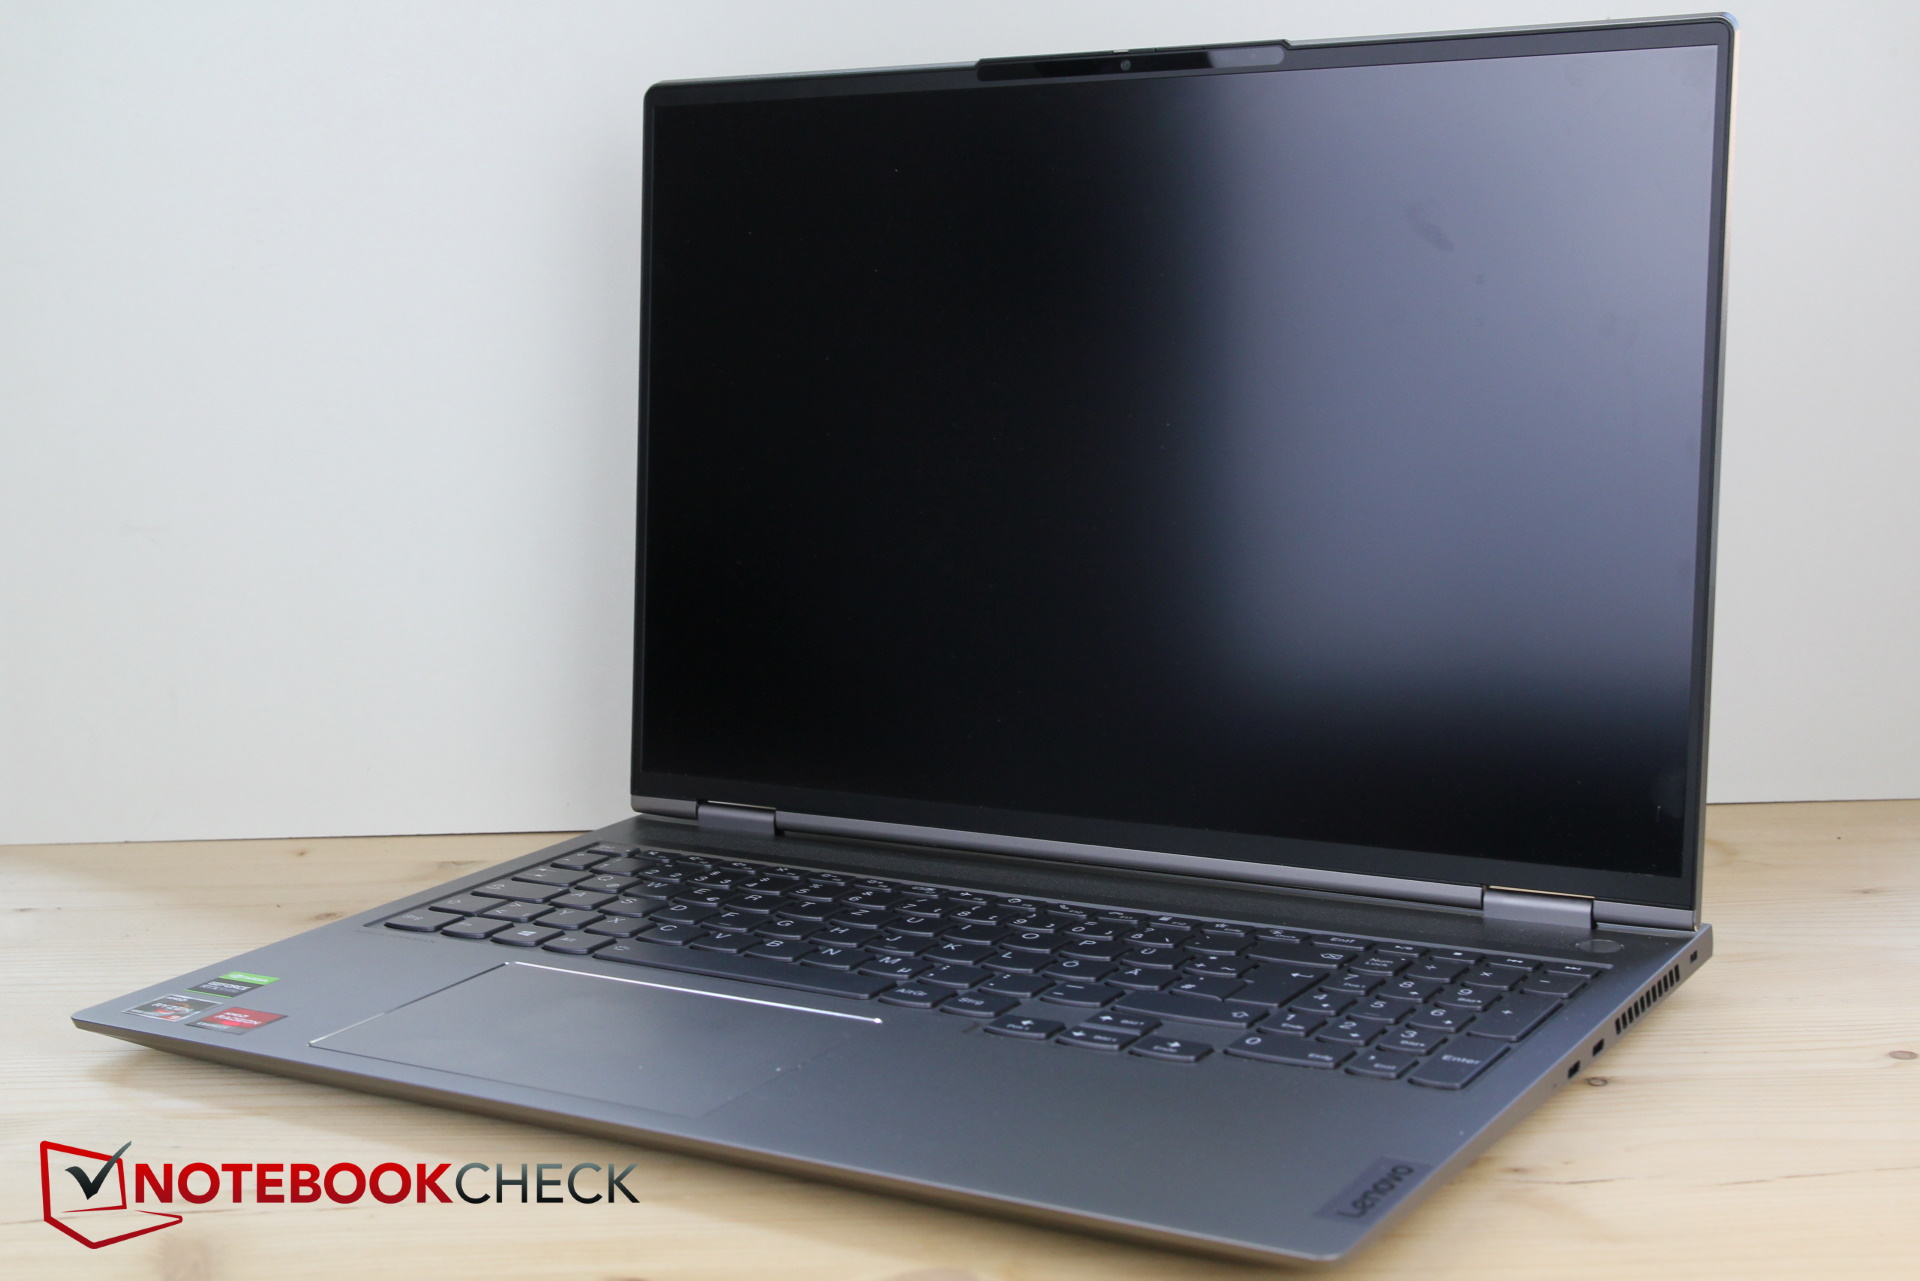
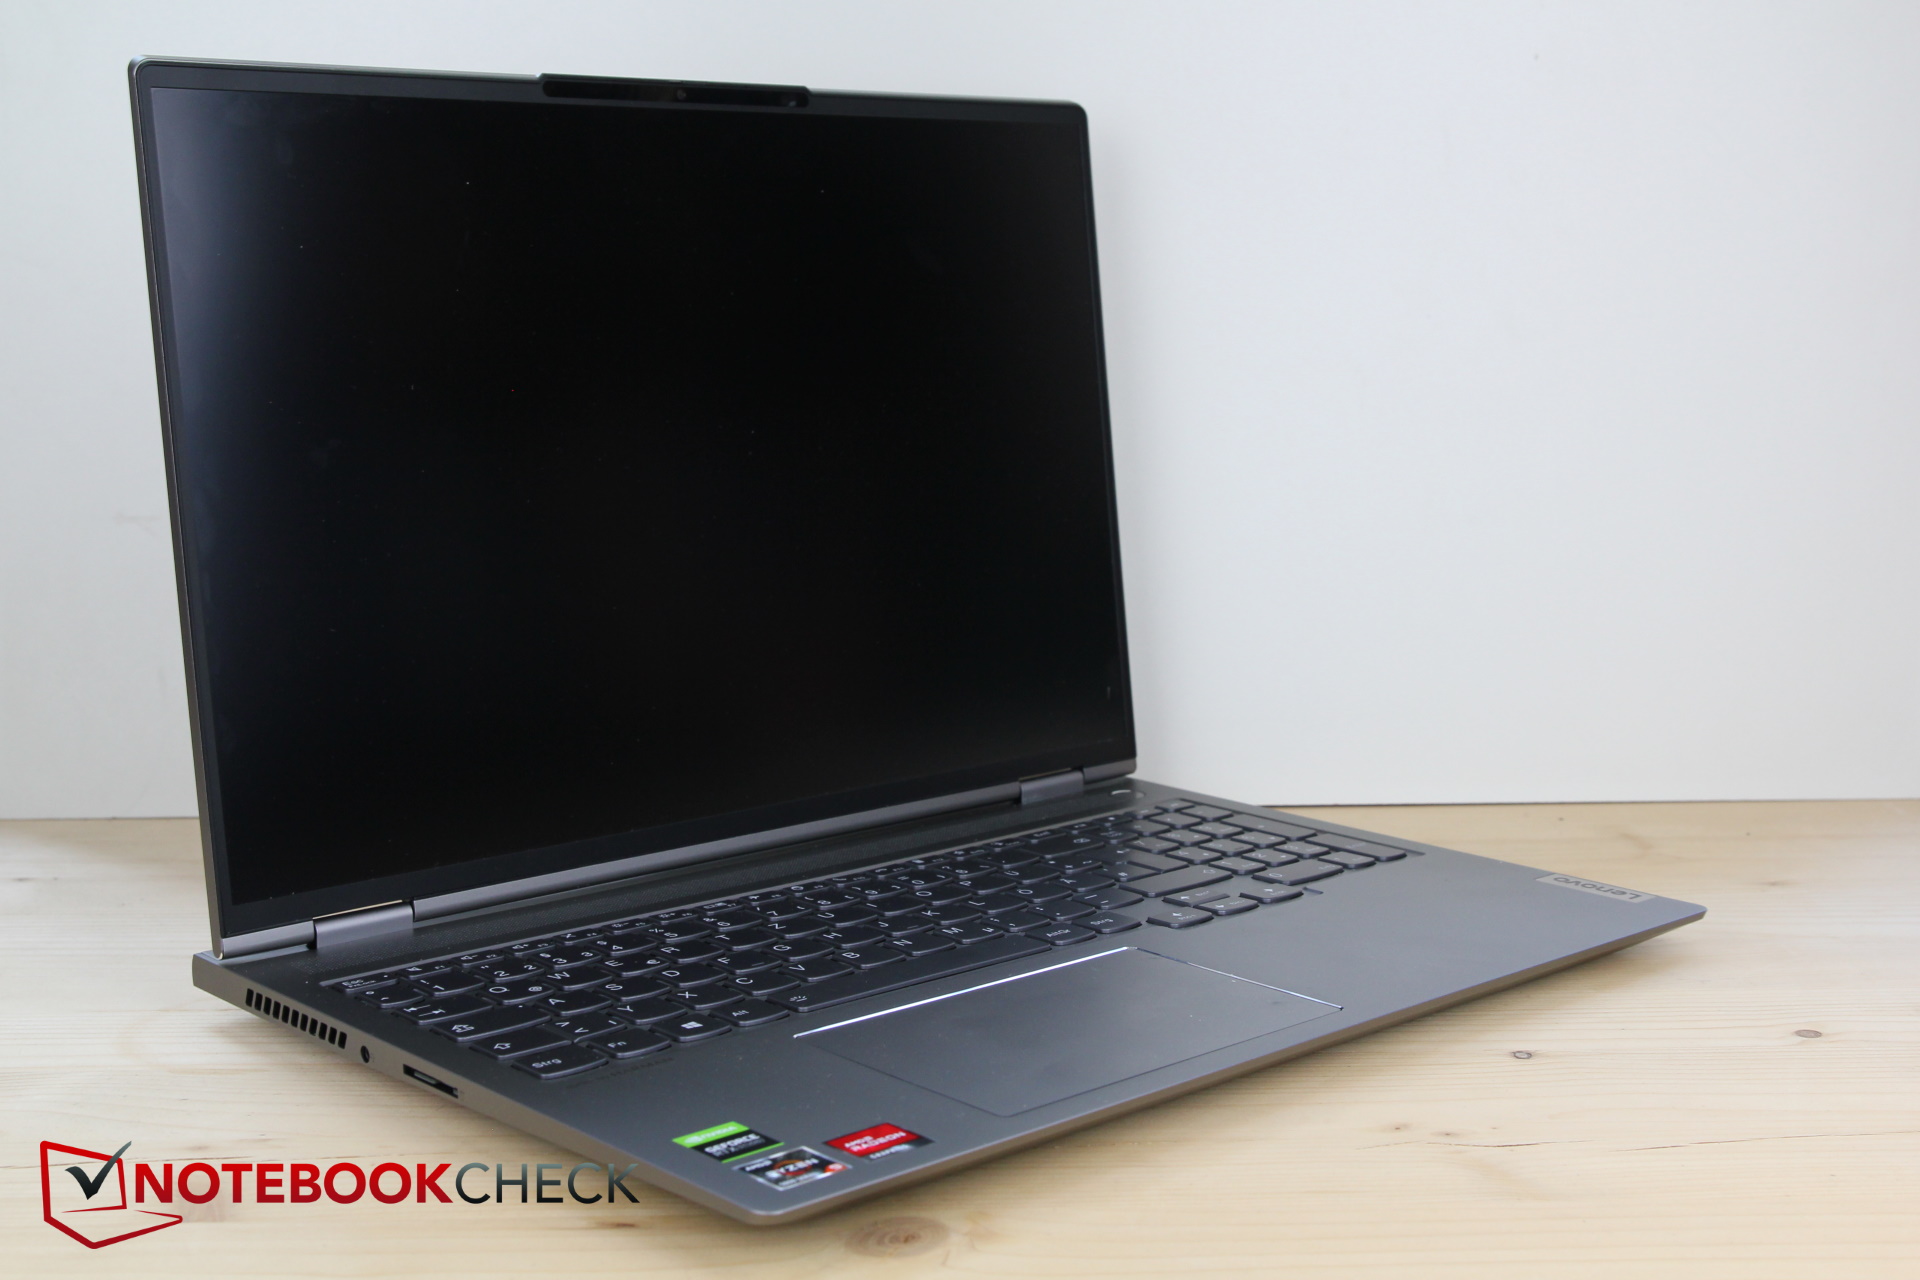
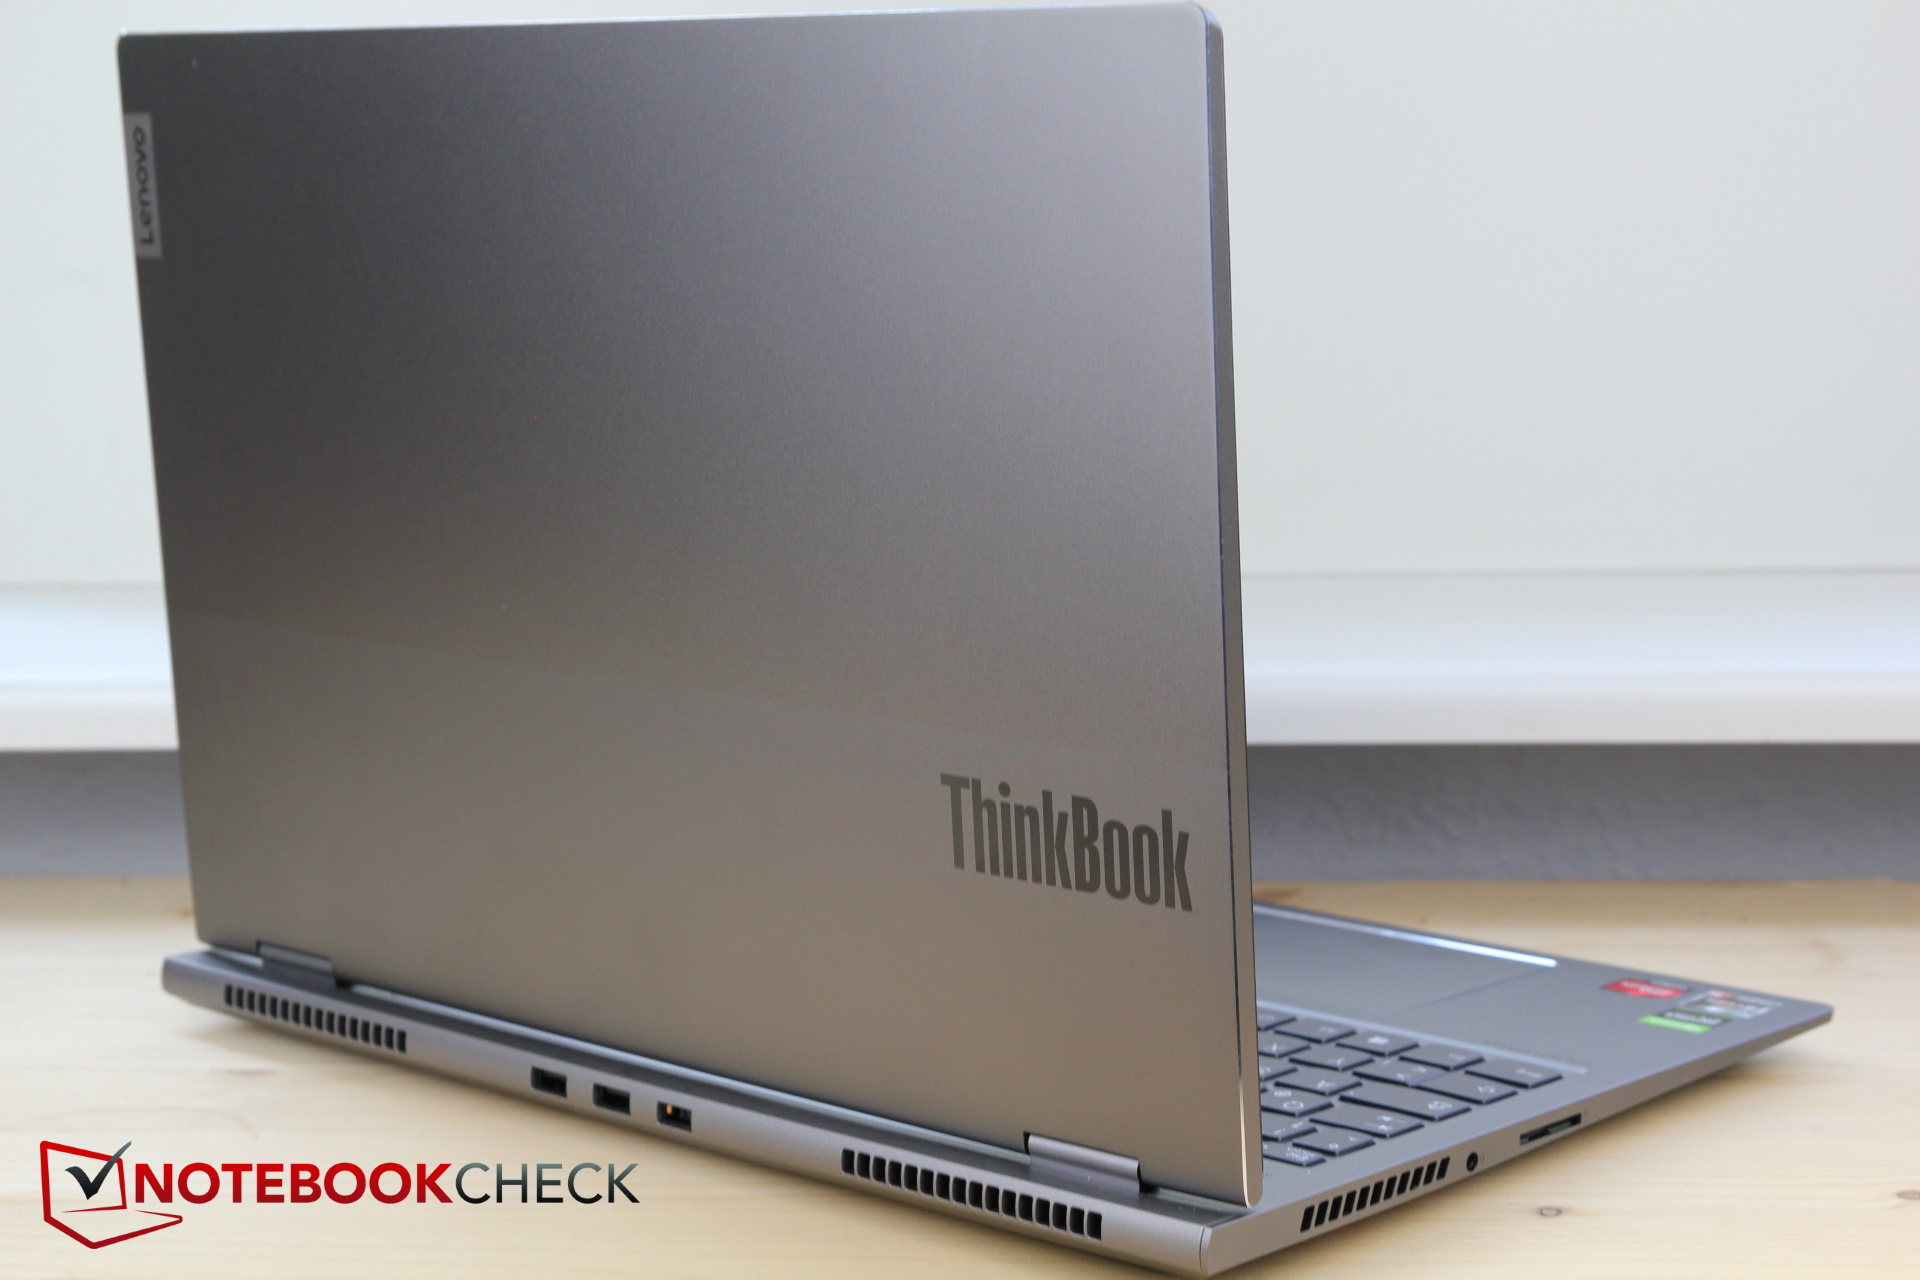
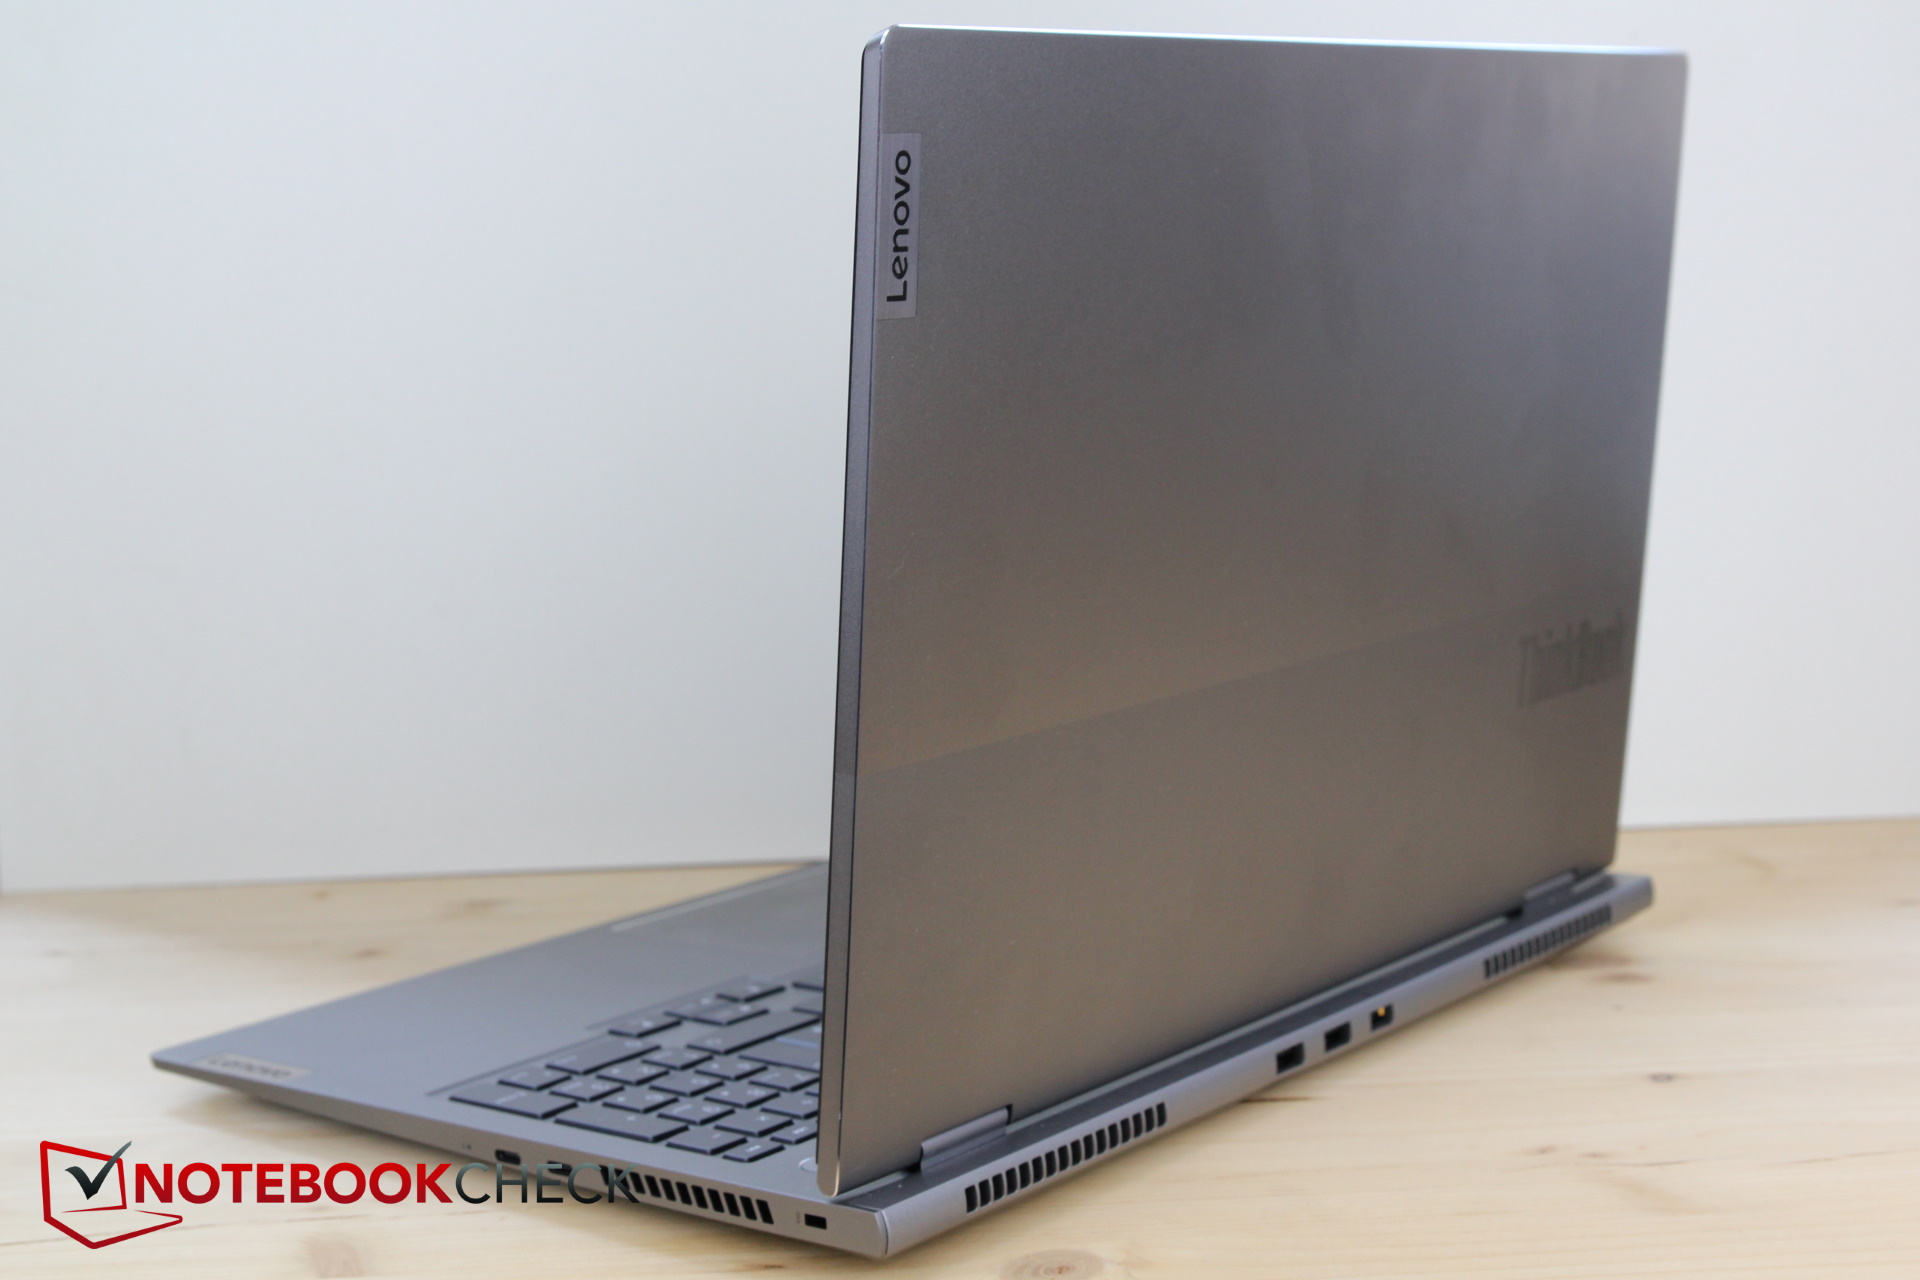
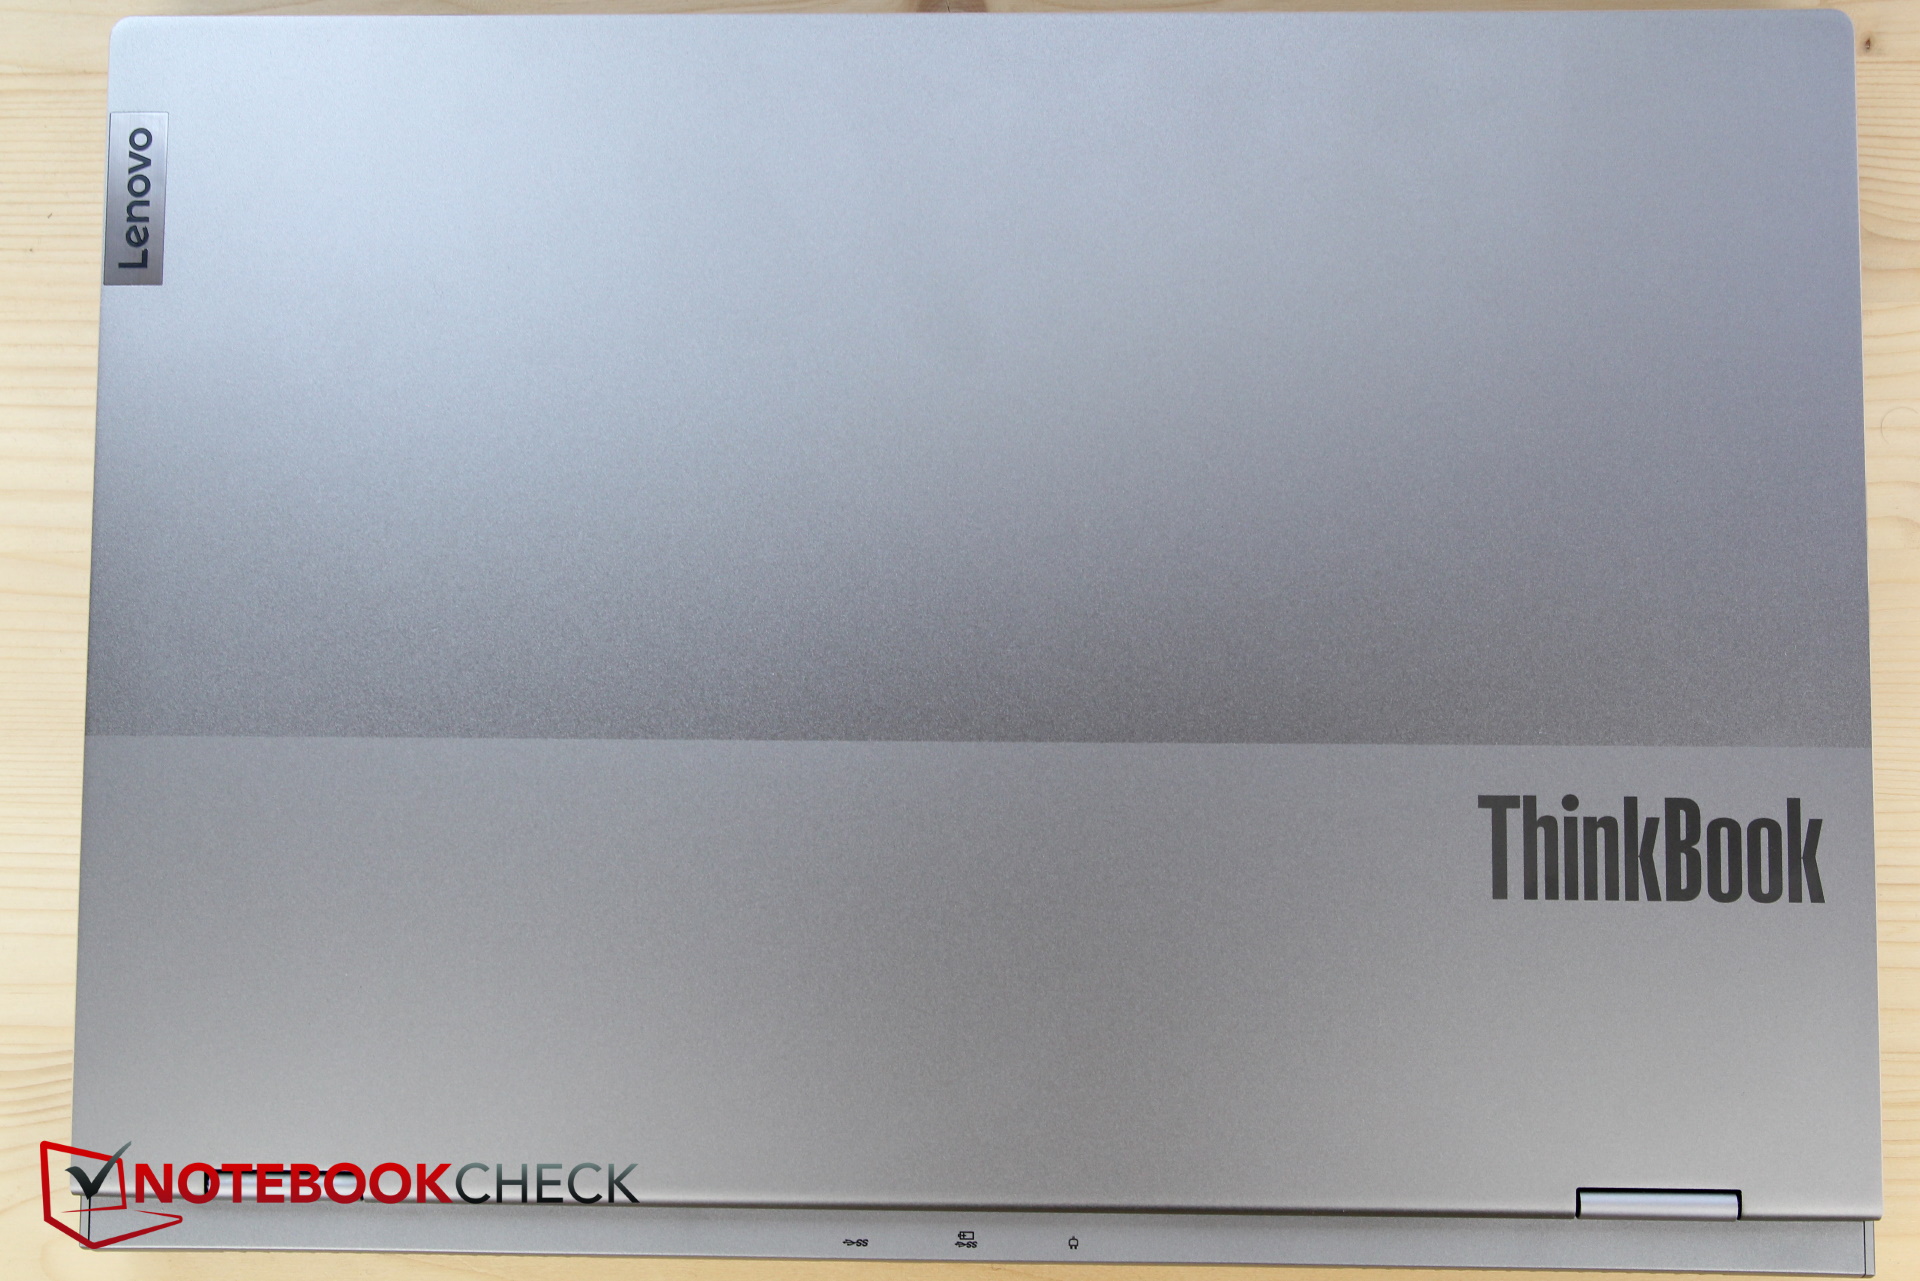
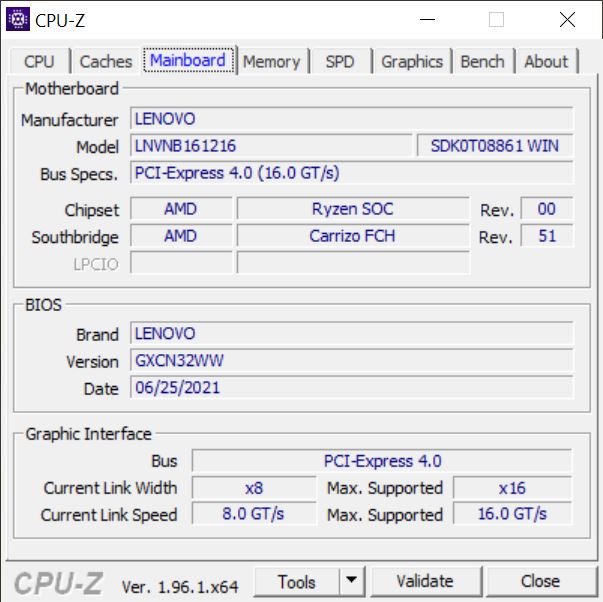
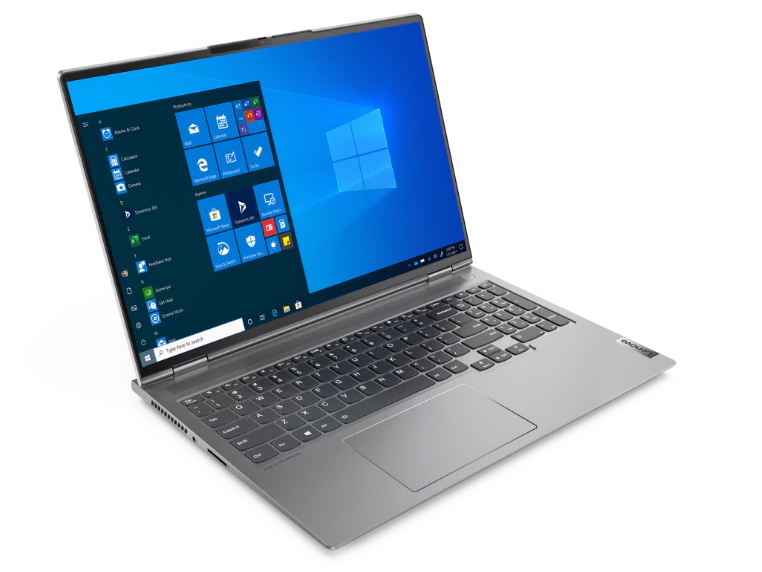
Case - Metal unibody with gaps
The case is not that different from that of the Lenovo ThinkBook 15p. It's almost completely made of aluminum, which makes the display and the keyboard base in particular comparatively sturdy. The silver-gray metal case is decorated by a Lenovo logo on the base unit as well as a ThinkBook logo on the lid.
The two hinges have a good grip on the display, but the laptop can still be opened easily with one hand. At least one spot at the bottom showed uneven gaps, but apart from that, the build quality appears to be at a good level, and we hardly noticed any creaking noises.
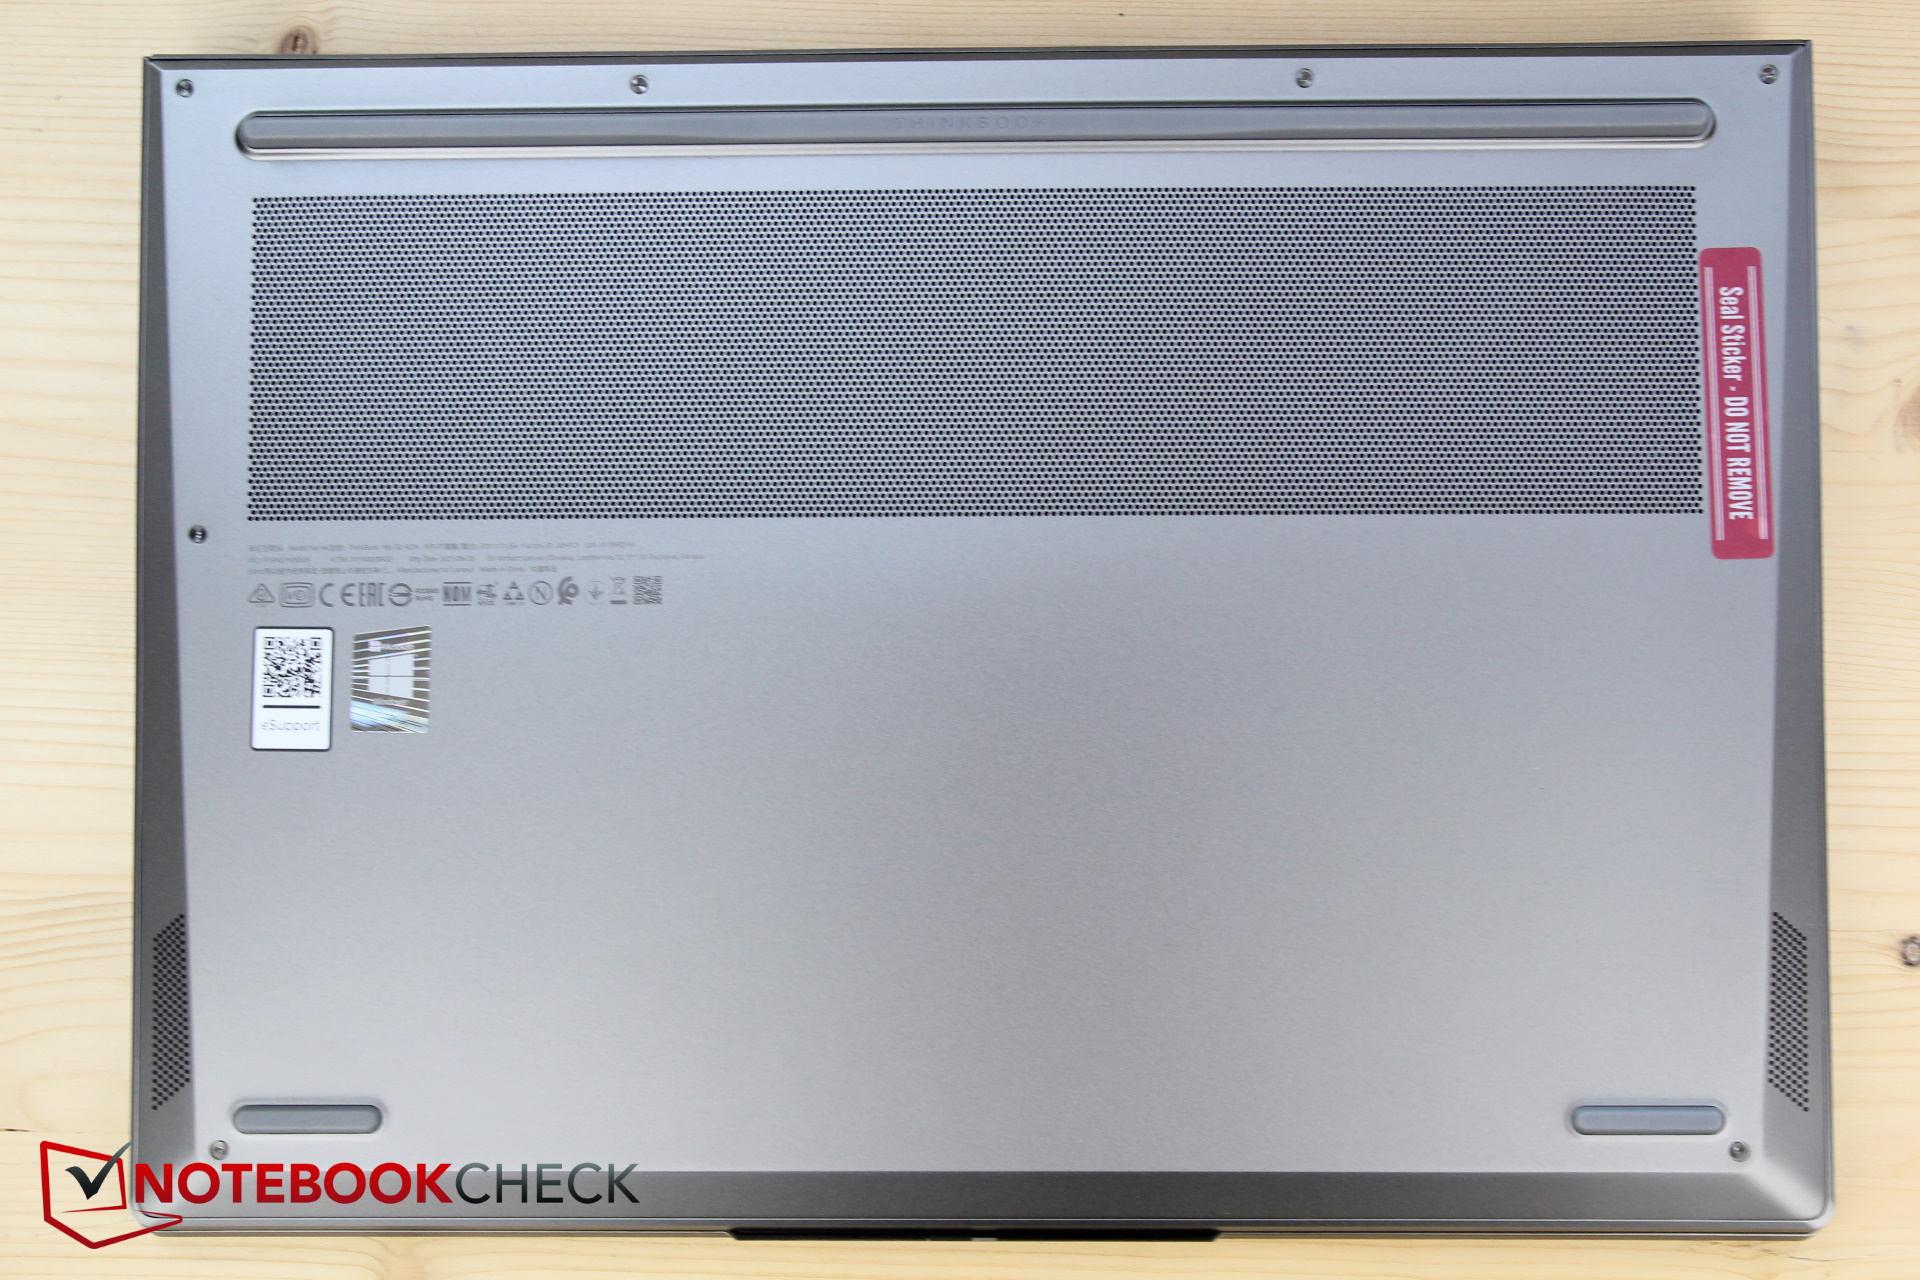
Fresh air is sucked in from the bottom, and waste heat is dissipated towards the back and sides through two ventilation slots on the left and right, respectively.
The Dell Inspiron 16 Plus 7610 is half a millimeter thinner than the ThinkBook, but overall very similar in terms of dimensions and weight. Otherwise, the ThinkBook's weight of 2 kg hardly differentiates it from the competition; only the Alienware is almost 500 g heavier. And despite the 16-inch display in a 16:10 aspect ratio, the ThinkBook 16p is barely bigger than the 15-inch competition, among which only some models measure a few millimeters less in depth.
Connectivity - Super spartan ThinkBook 16p
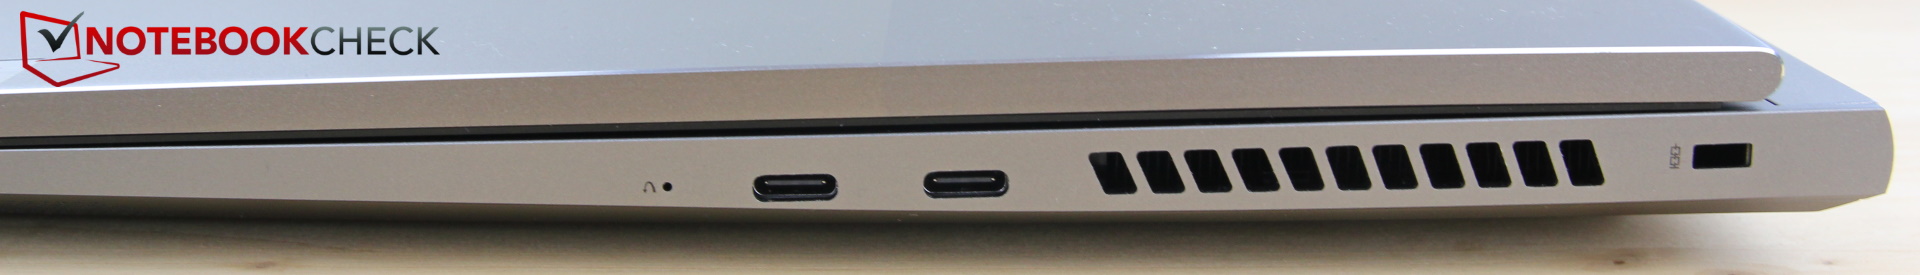
We had already criticized the ThinkBook 15p's connectivity, and the 16p doesn't do any better. There is no dedicated HDMI or DisplayPort input, which means that you have to use an adapter for one of the two USB-C connections that support DisplayPort 1.4, which is not included by Lenovo. Therefore, you have to buy an adapter or hub before connecting an external monitor. Thunderbolt is also missing due to the use of the AMD platform.
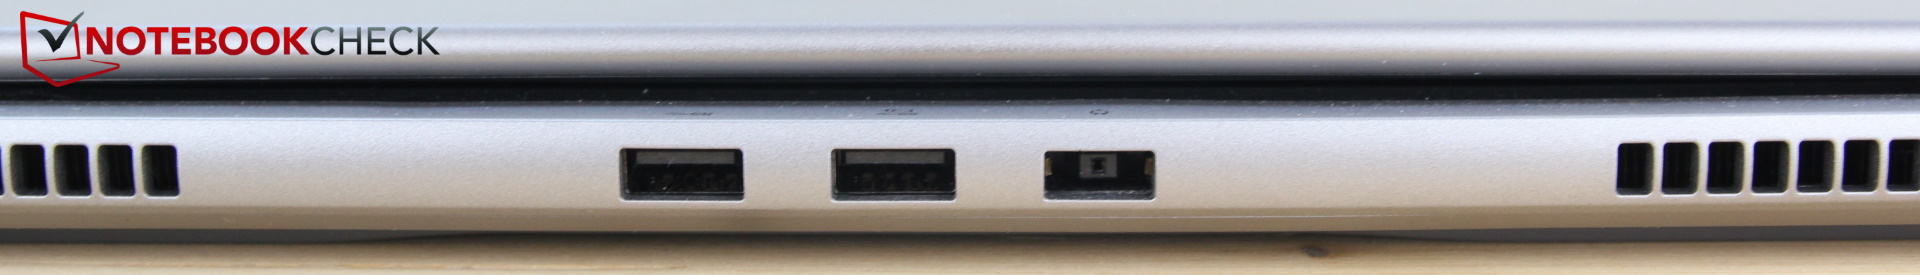
Additionally, a LAN port is missing; whether the lack of a high-speed wired Internet connection is appropriate for a "high-performance creativity tool" is questionable. At least there's a full-fledged SD reader, something that's no longer a given. Overall, there are only four USB ports and one headset port, which is not much!
The USB-C ports are on the right side. Since adapters or even hubs with long cables will be used here almost unavoidably, their placement might not be ideal. The two USB-A ports are located at the back along with the power supply. We found it a bit annoying to have to reach back over the display every time we wanted to insert a simple USB-A stick. The reader and the headset port are located on the left.
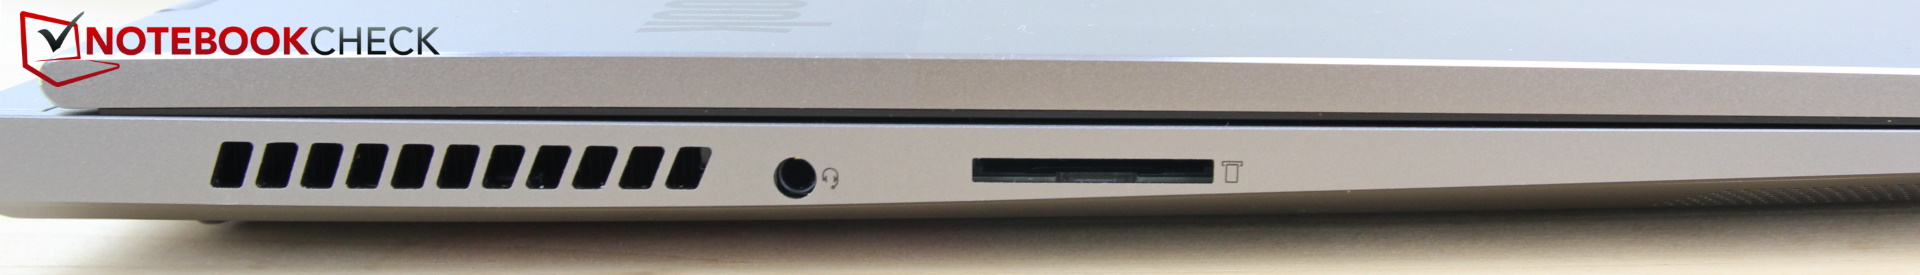
SD card reader
SD cards can be pushed in without a locking mechanism, and about half of the card protrudes out of the slot. The card reader's speed is a step forward compared to the predecessor and now ranks within the class average. Copying 1 GB of images from our 128 GB AV PRO V60 microSD reference memory card to the desktop takes about 13 seconds.
| SD Card Reader | |
| average JPG Copy Test (av. of 3 runs) | |
| Average of class Multimedia (21.1 - 198, n=42, last 2 years) | |
| Schenker XMG Core 15 Ampere (Toshiba Exceria Pro SDXC 64 GB UHS-II) | |
| Lenovo ThinkBook 16p G2 ACH | |
| Lenovo ThinkBook 15p Gen1 4K (AV Pro V60) | |
| Dell Inspiron 16 Plus 7610 (AV PRO microSD 128 GB V60) | |
| maximum AS SSD Seq Read Test (1GB) | |
| Average of class Multimedia (27.4 - 262, n=42, last 2 years) | |
| Schenker XMG Core 15 Ampere (Toshiba Exceria Pro SDXC 64 GB UHS-II) | |
| Lenovo ThinkBook 16p G2 ACH | |
| Lenovo ThinkBook 15p Gen1 4K (AV Pro V60) | |
| Dell Inspiron 16 Plus 7610 (AV PRO microSD 128 GB V60) | |
Communication
Due to the lack of a LAN adapter and port, only wireless communication options like Wi-Fi and Bluetooth 5 are available. The Intel AX200 WLAN module performs somewhat below average in our measurements.
Webcam
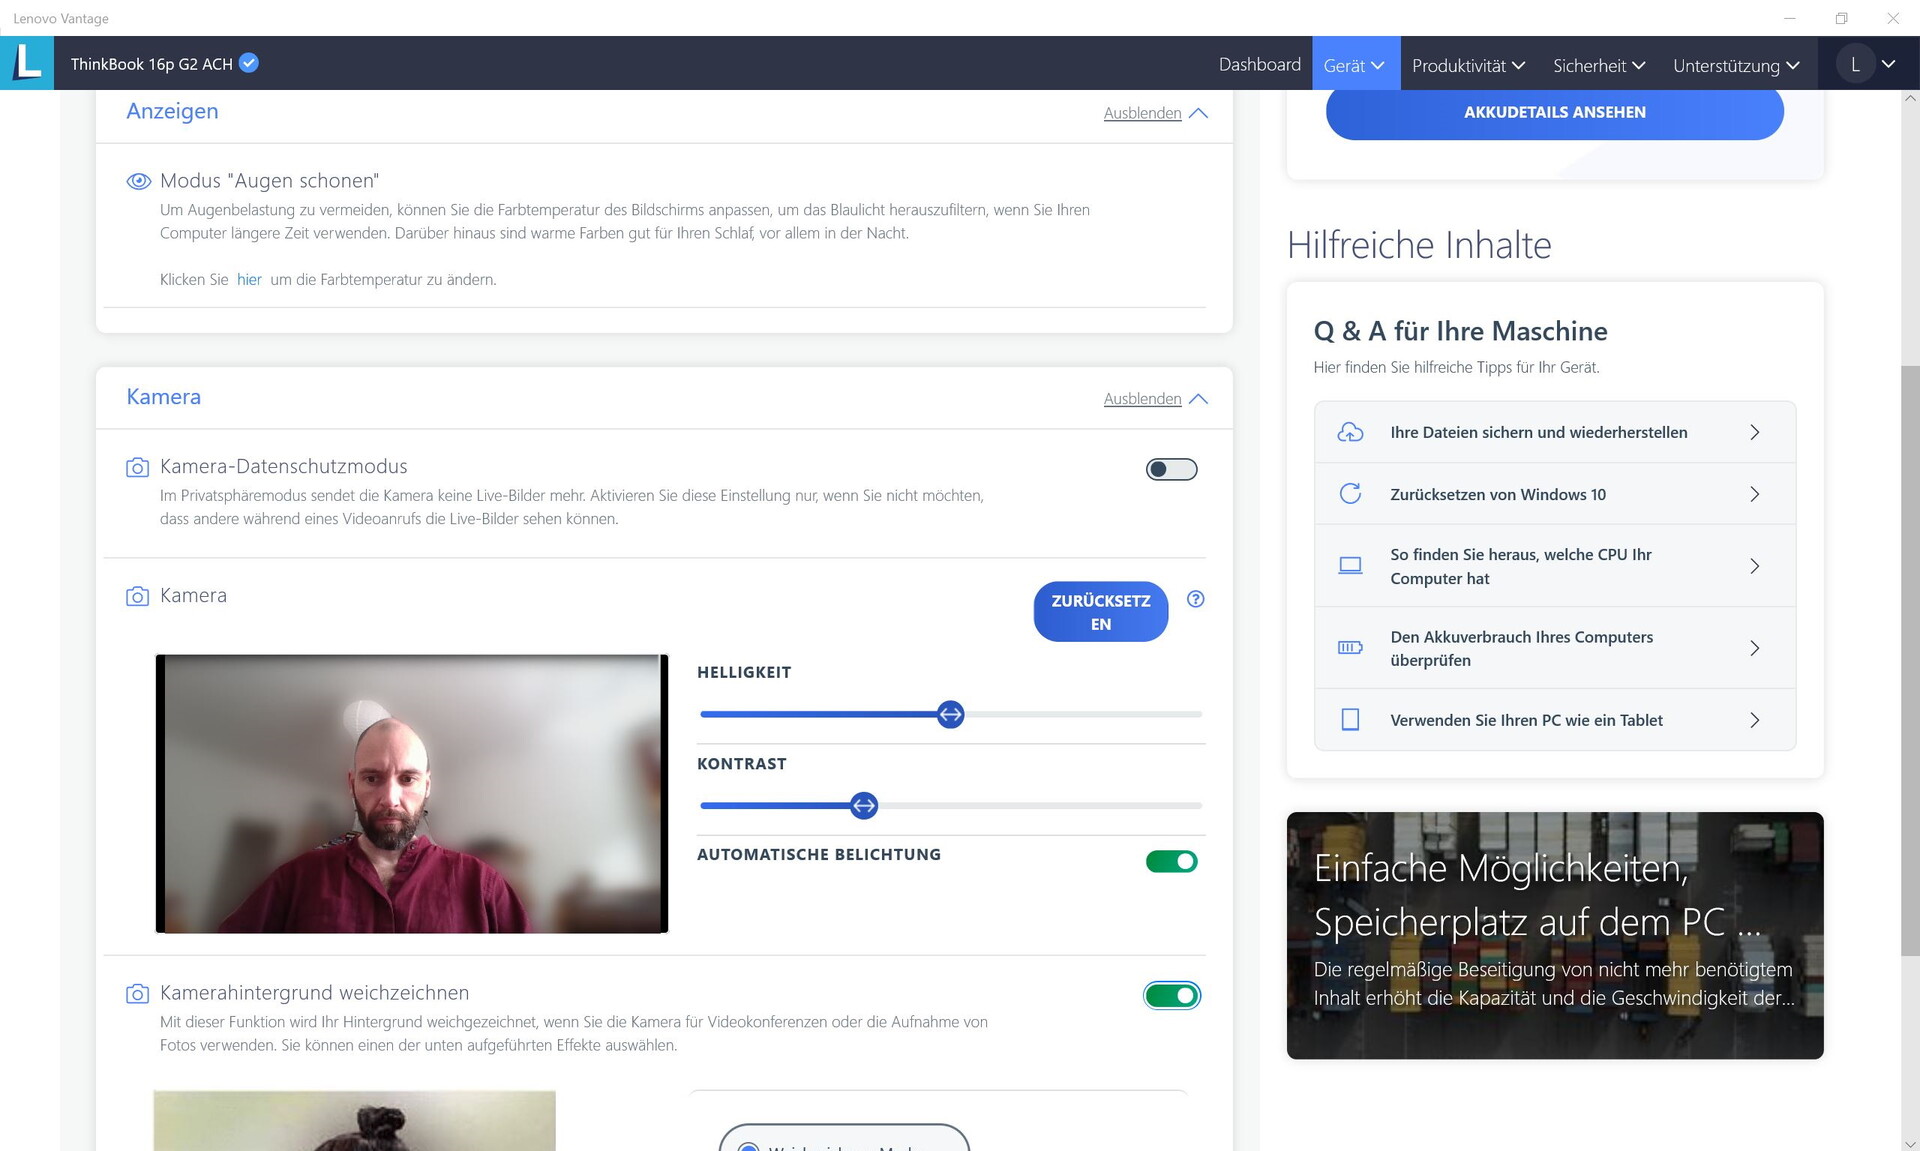
You would think that the results here are wonderful, since Lenovo has replaced the usual standard 720p camera with a Full HD model. However, the built-in module is not really a selling point because the color deviations are quite large, and the image looks grainy and washed out despite the Full HD resolution. On the other hand, it's a positive thing that there's a manual shutter, which prevents the camera from capturing unauthorized pictures.
The AI control used to separate the person from the background fails constantly.


Security
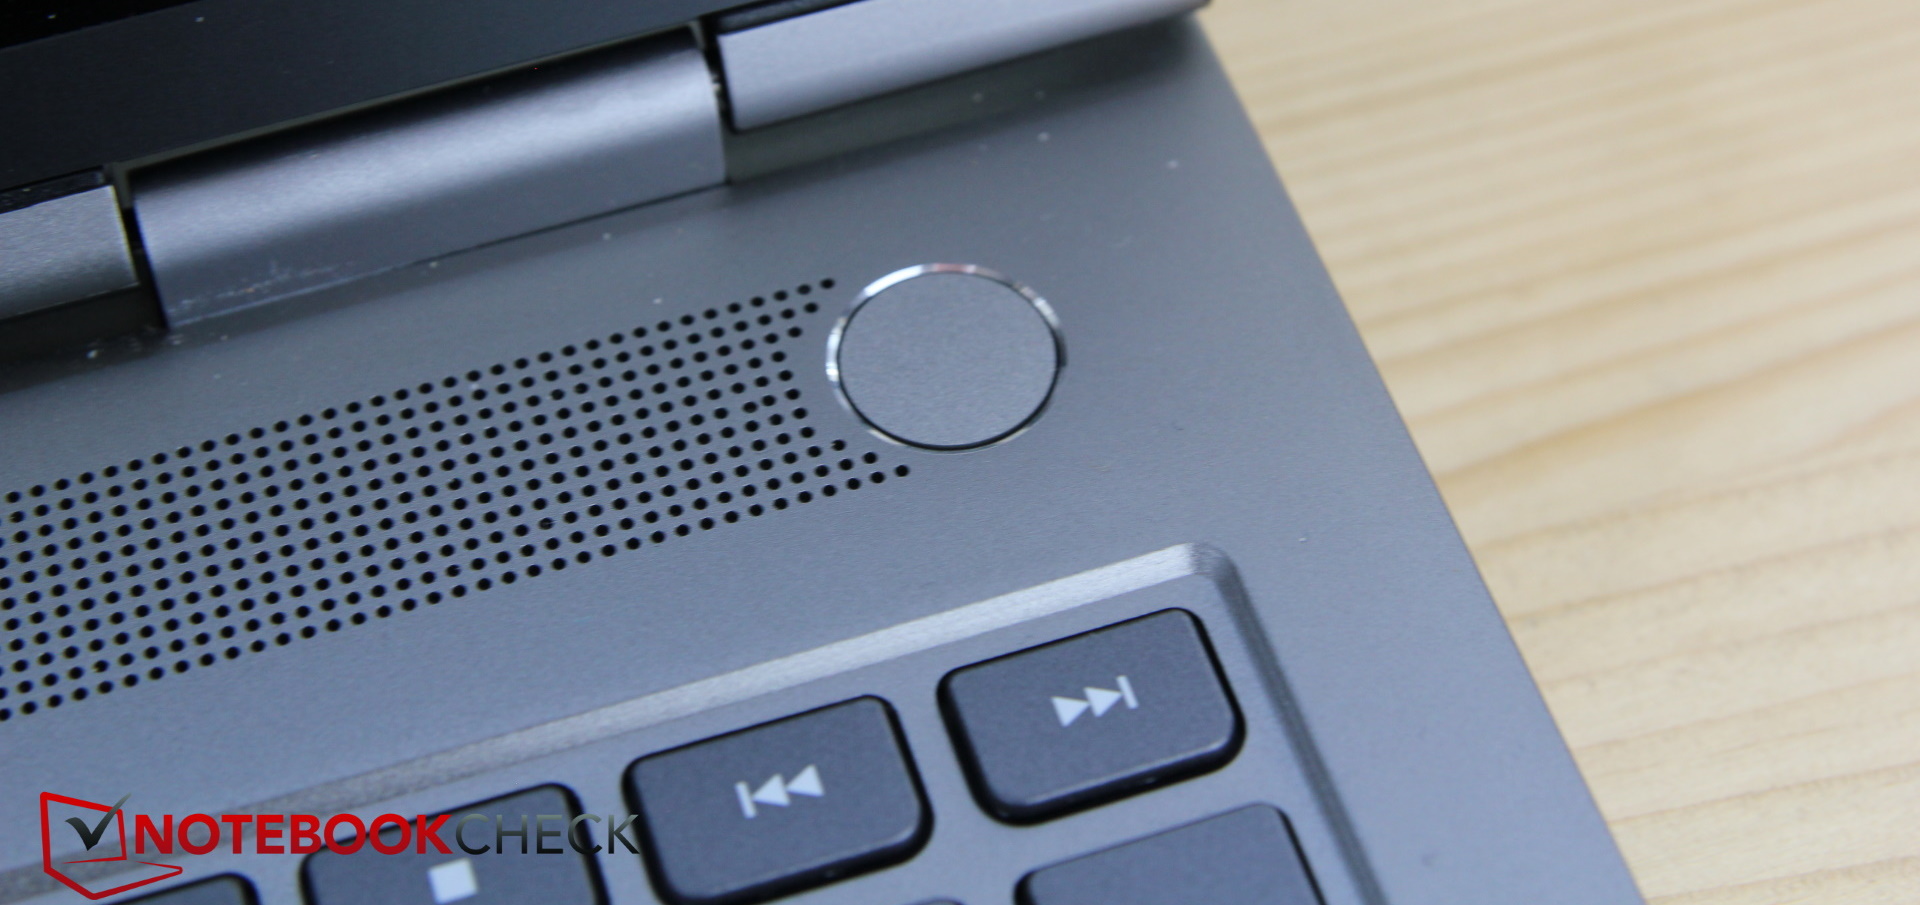
The ThinkBook 16p has a Kensington slot, TPM 2.0, and a fingerprint sensor that is integrated into the power button.
Accessories
Lenovo doesn't include any accessories; the inclusion of a USB-C adapter for LAN and/or HDMI or DisplayPort would have been ideal.
Maintenance
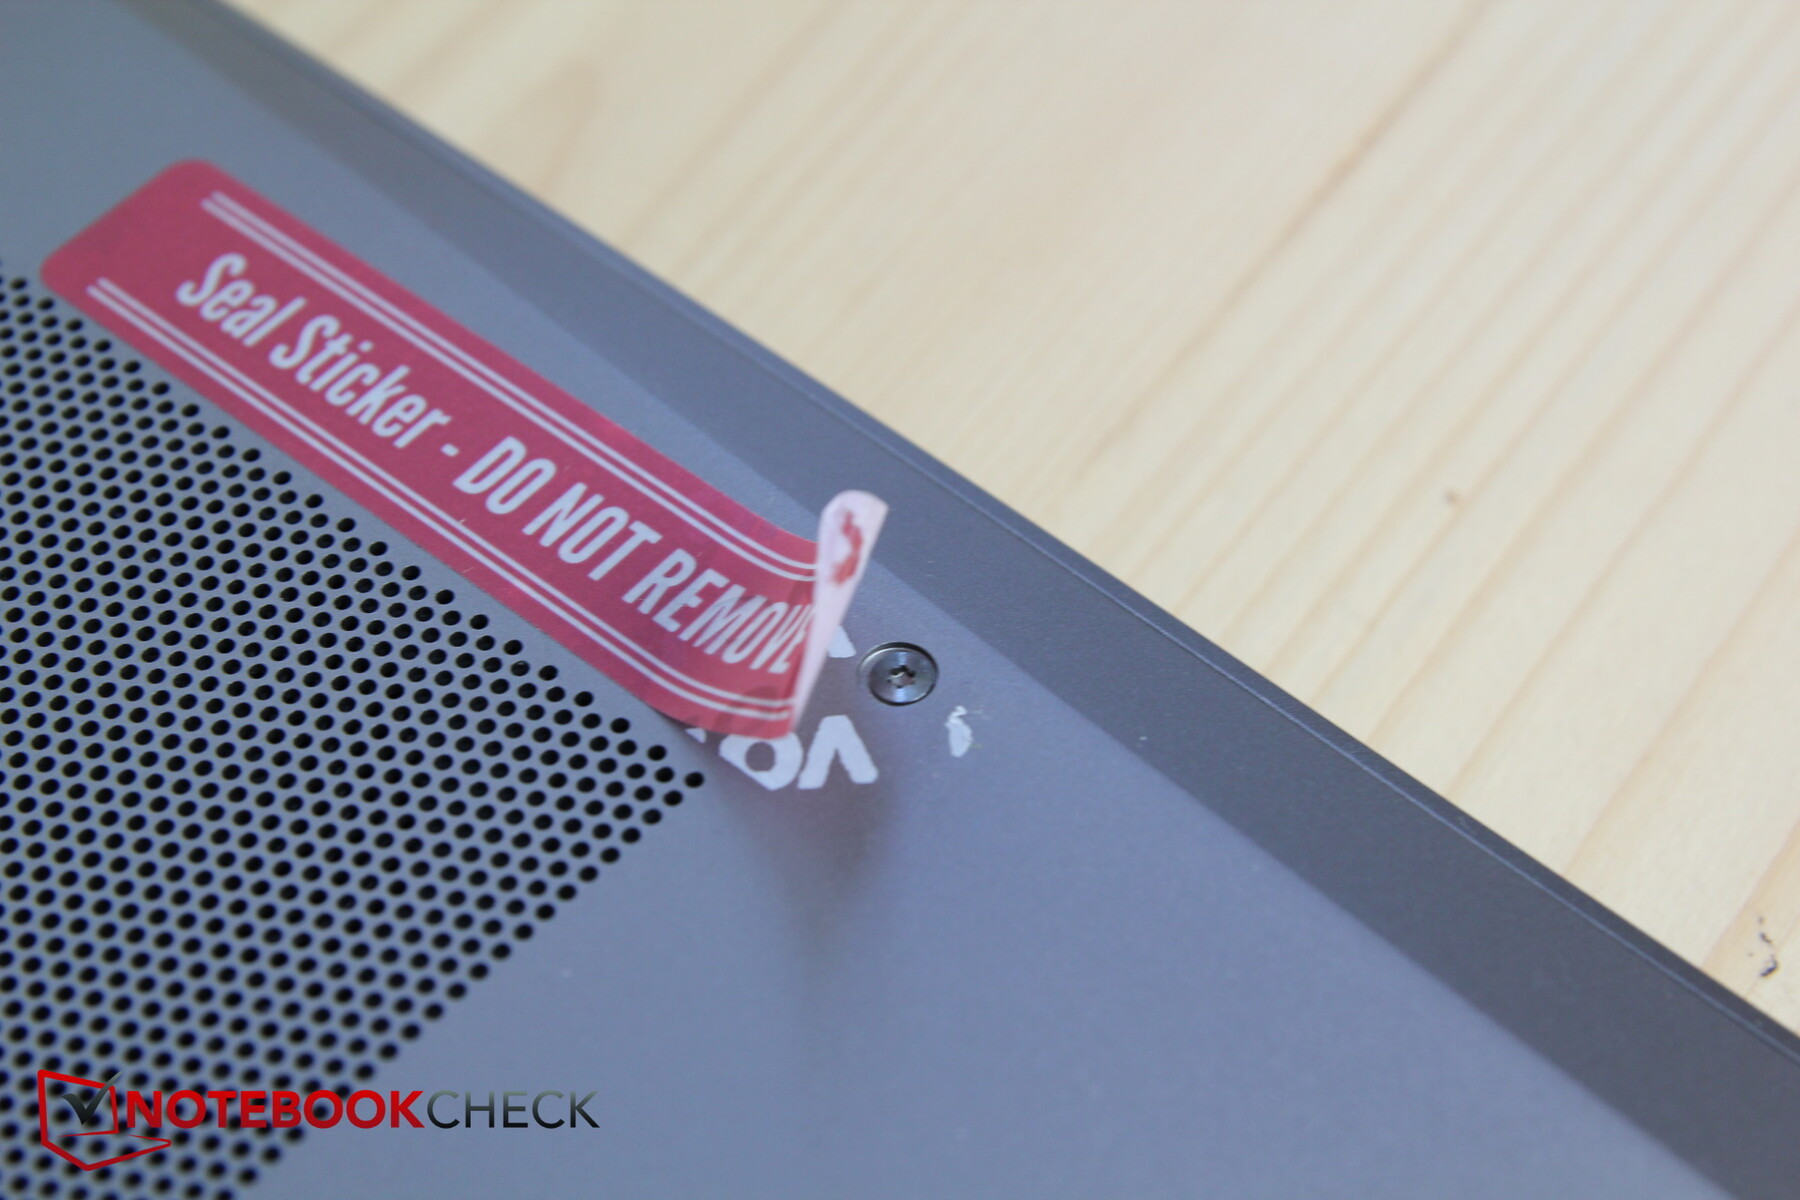
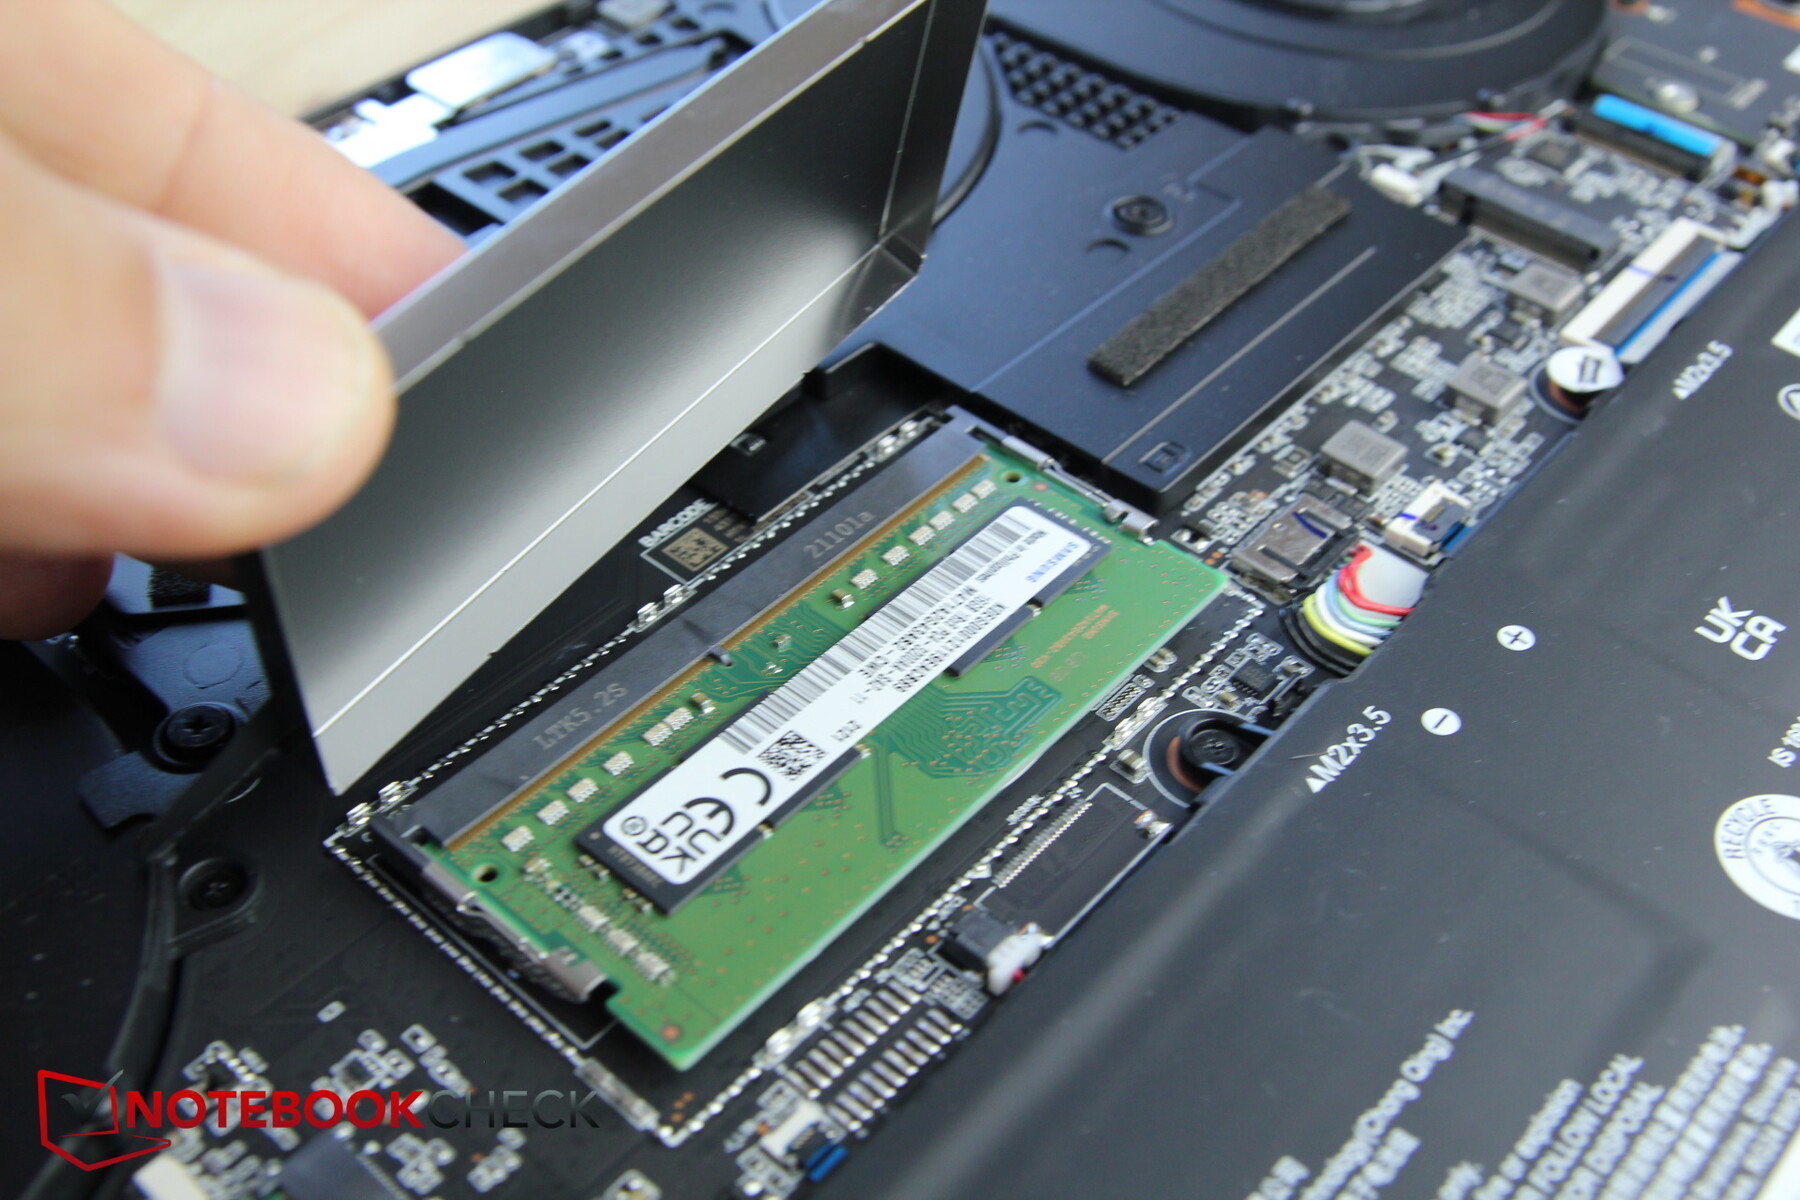
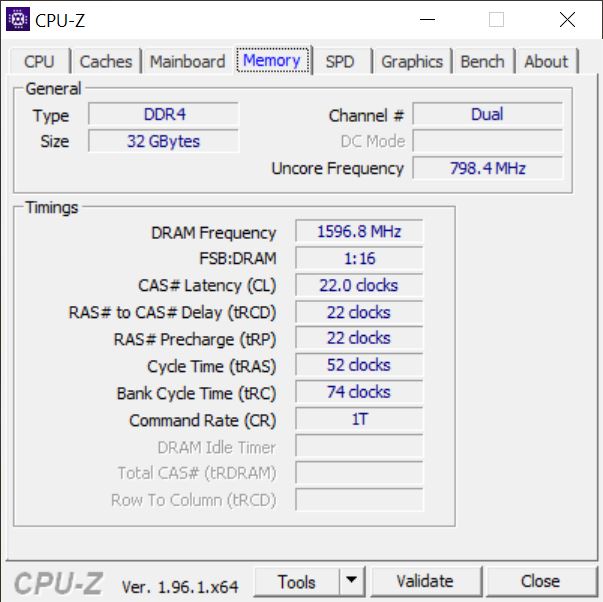
Maintenance is difficult for users, because a factory, red seal sticker conceals one of the 8 Torx screws located on the underside. Removing it might result in a warranty void. There's no maintenance hatch to compensate for this. Furthermore, the 16 GB of RAM is soldered, while the content of the other RAM slot can be replaced.
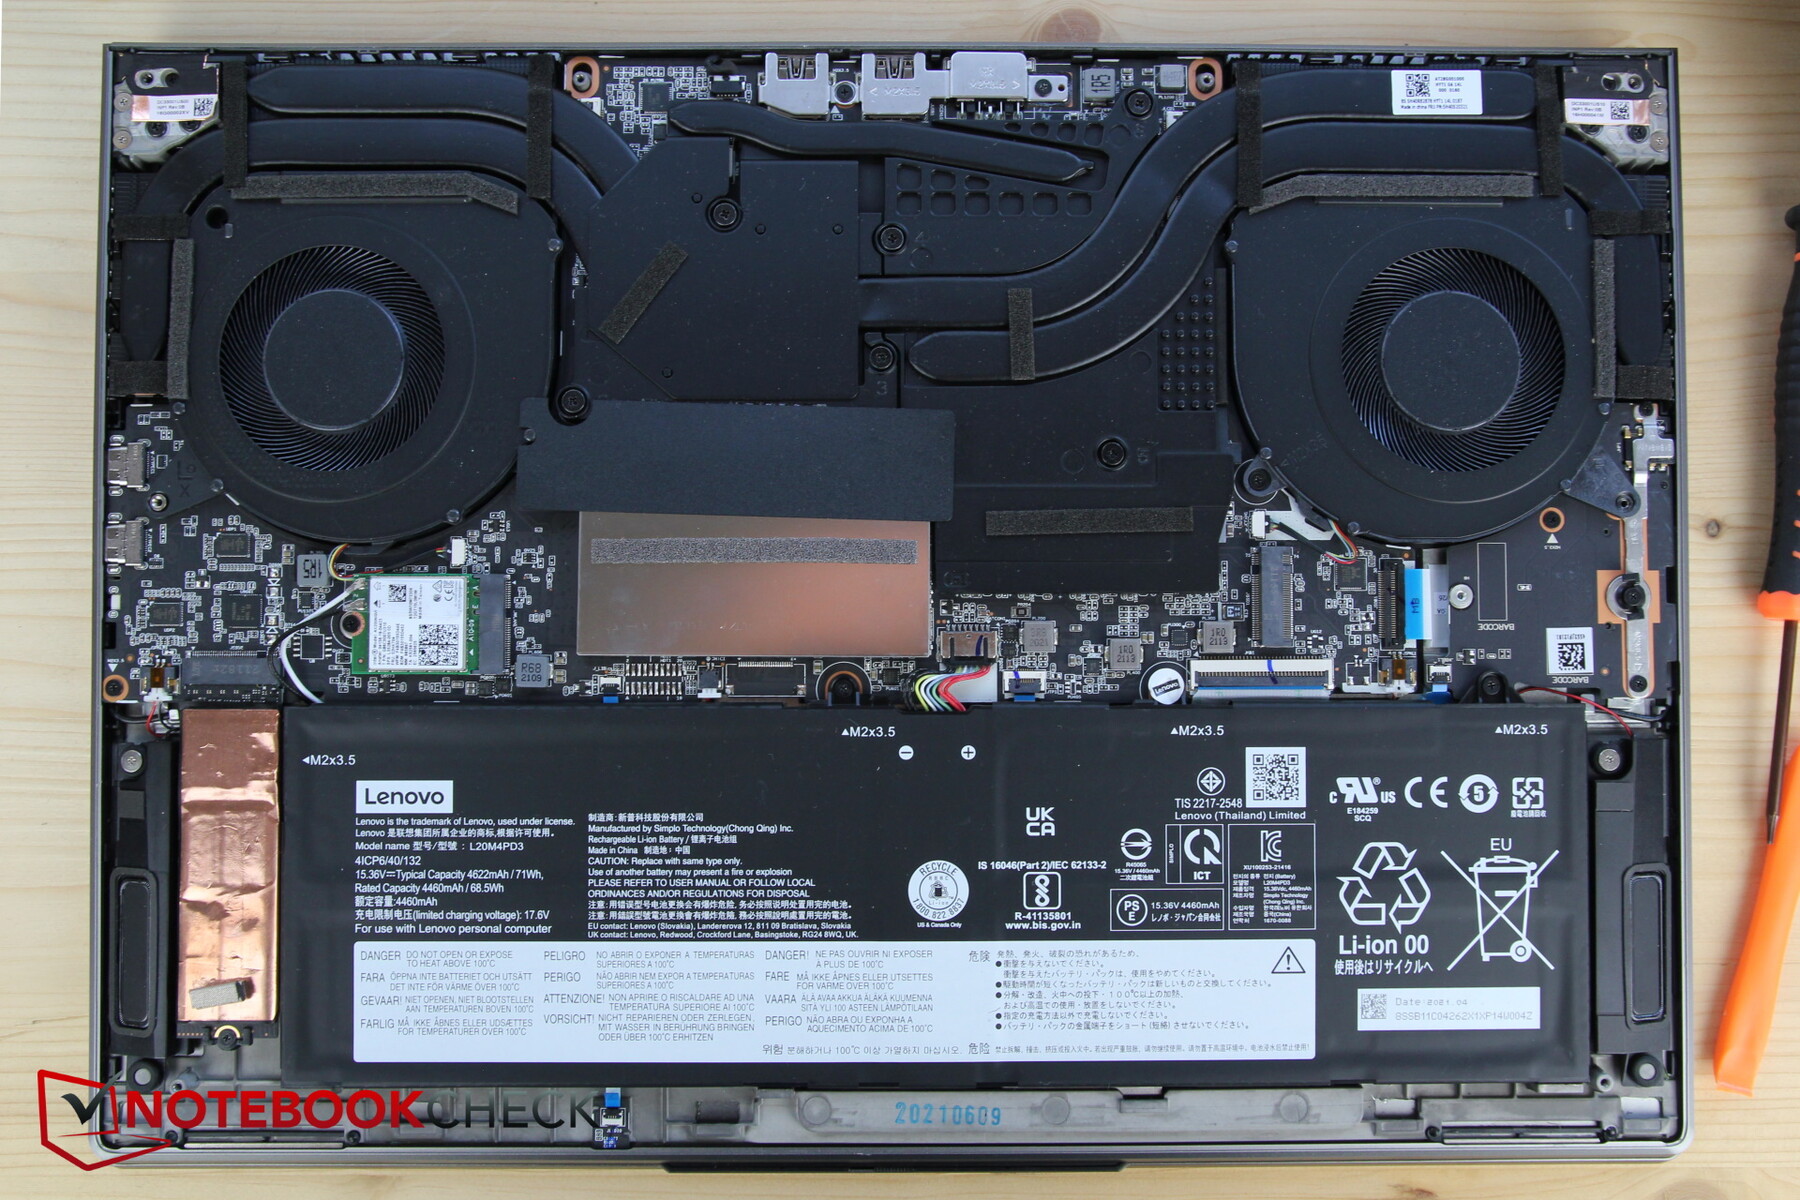
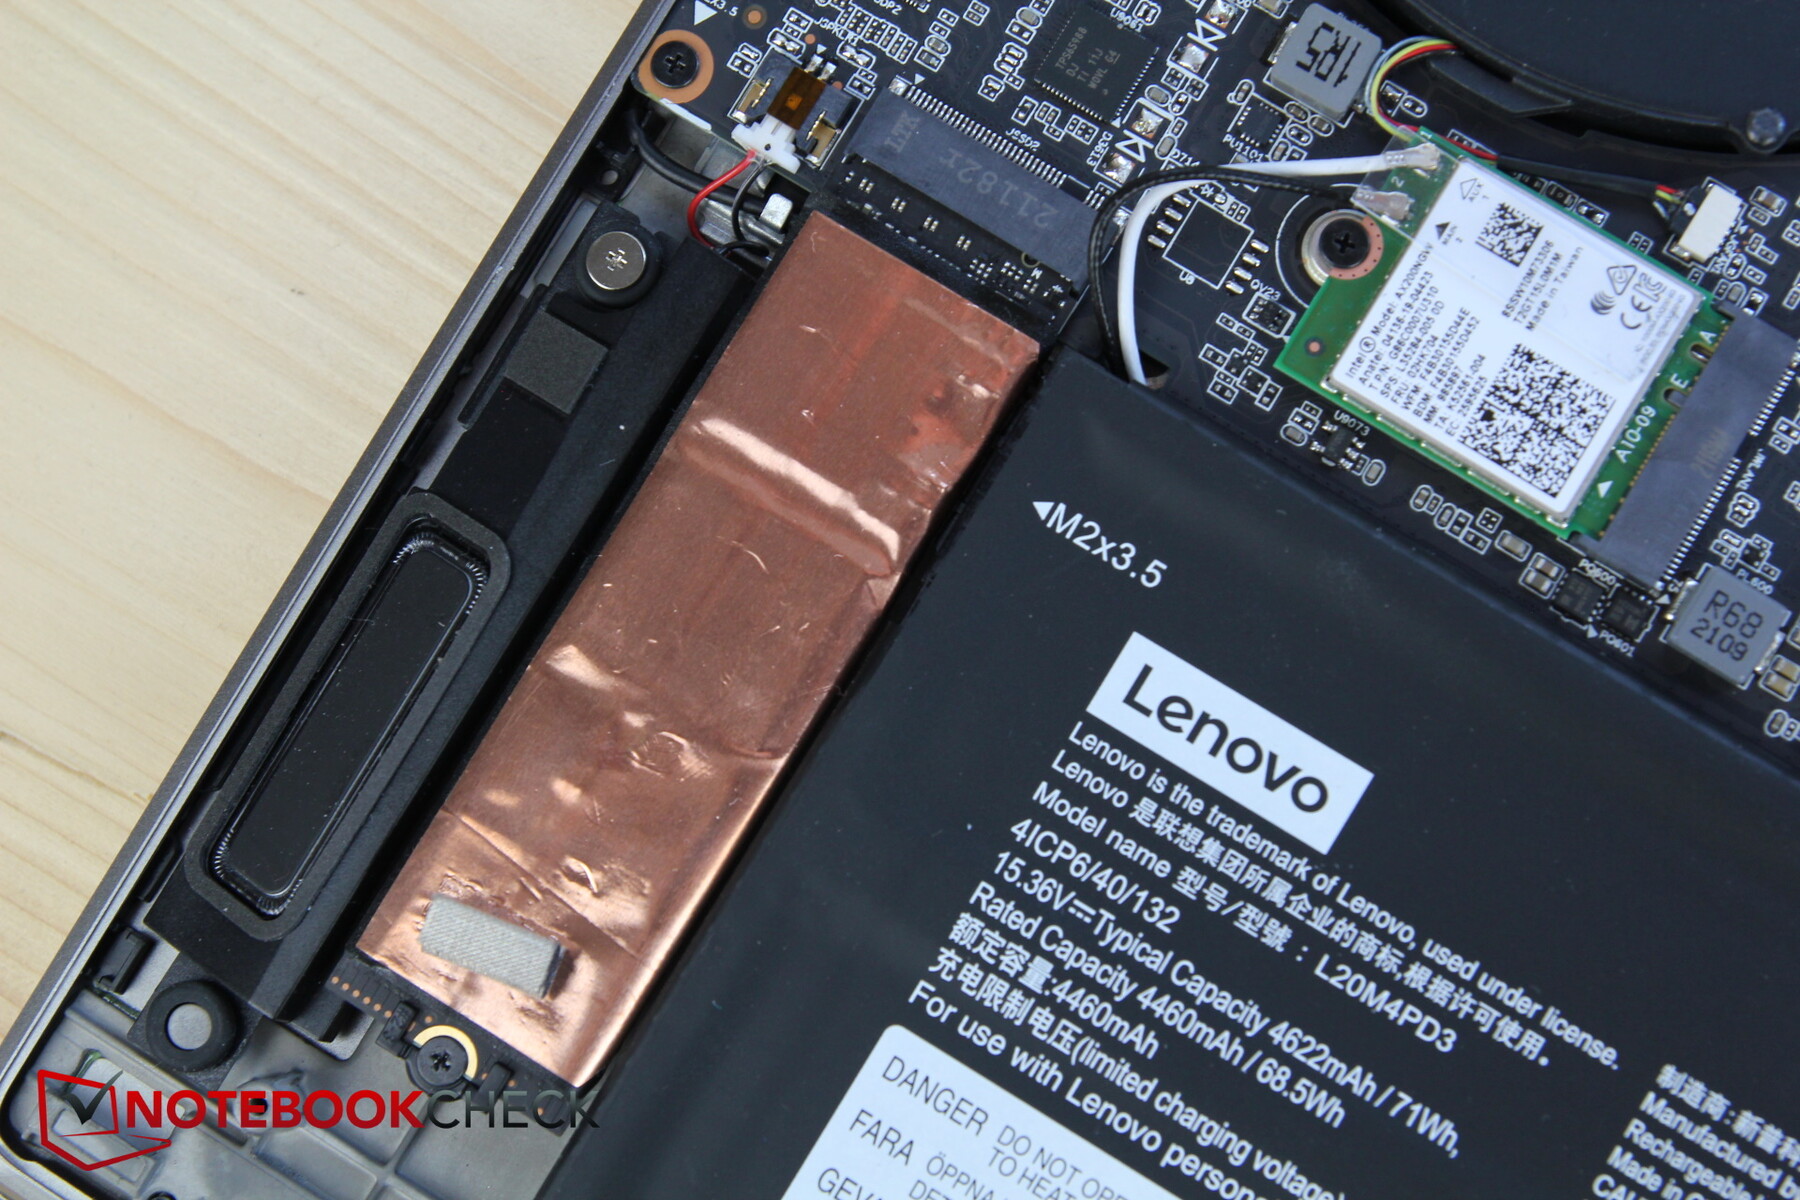
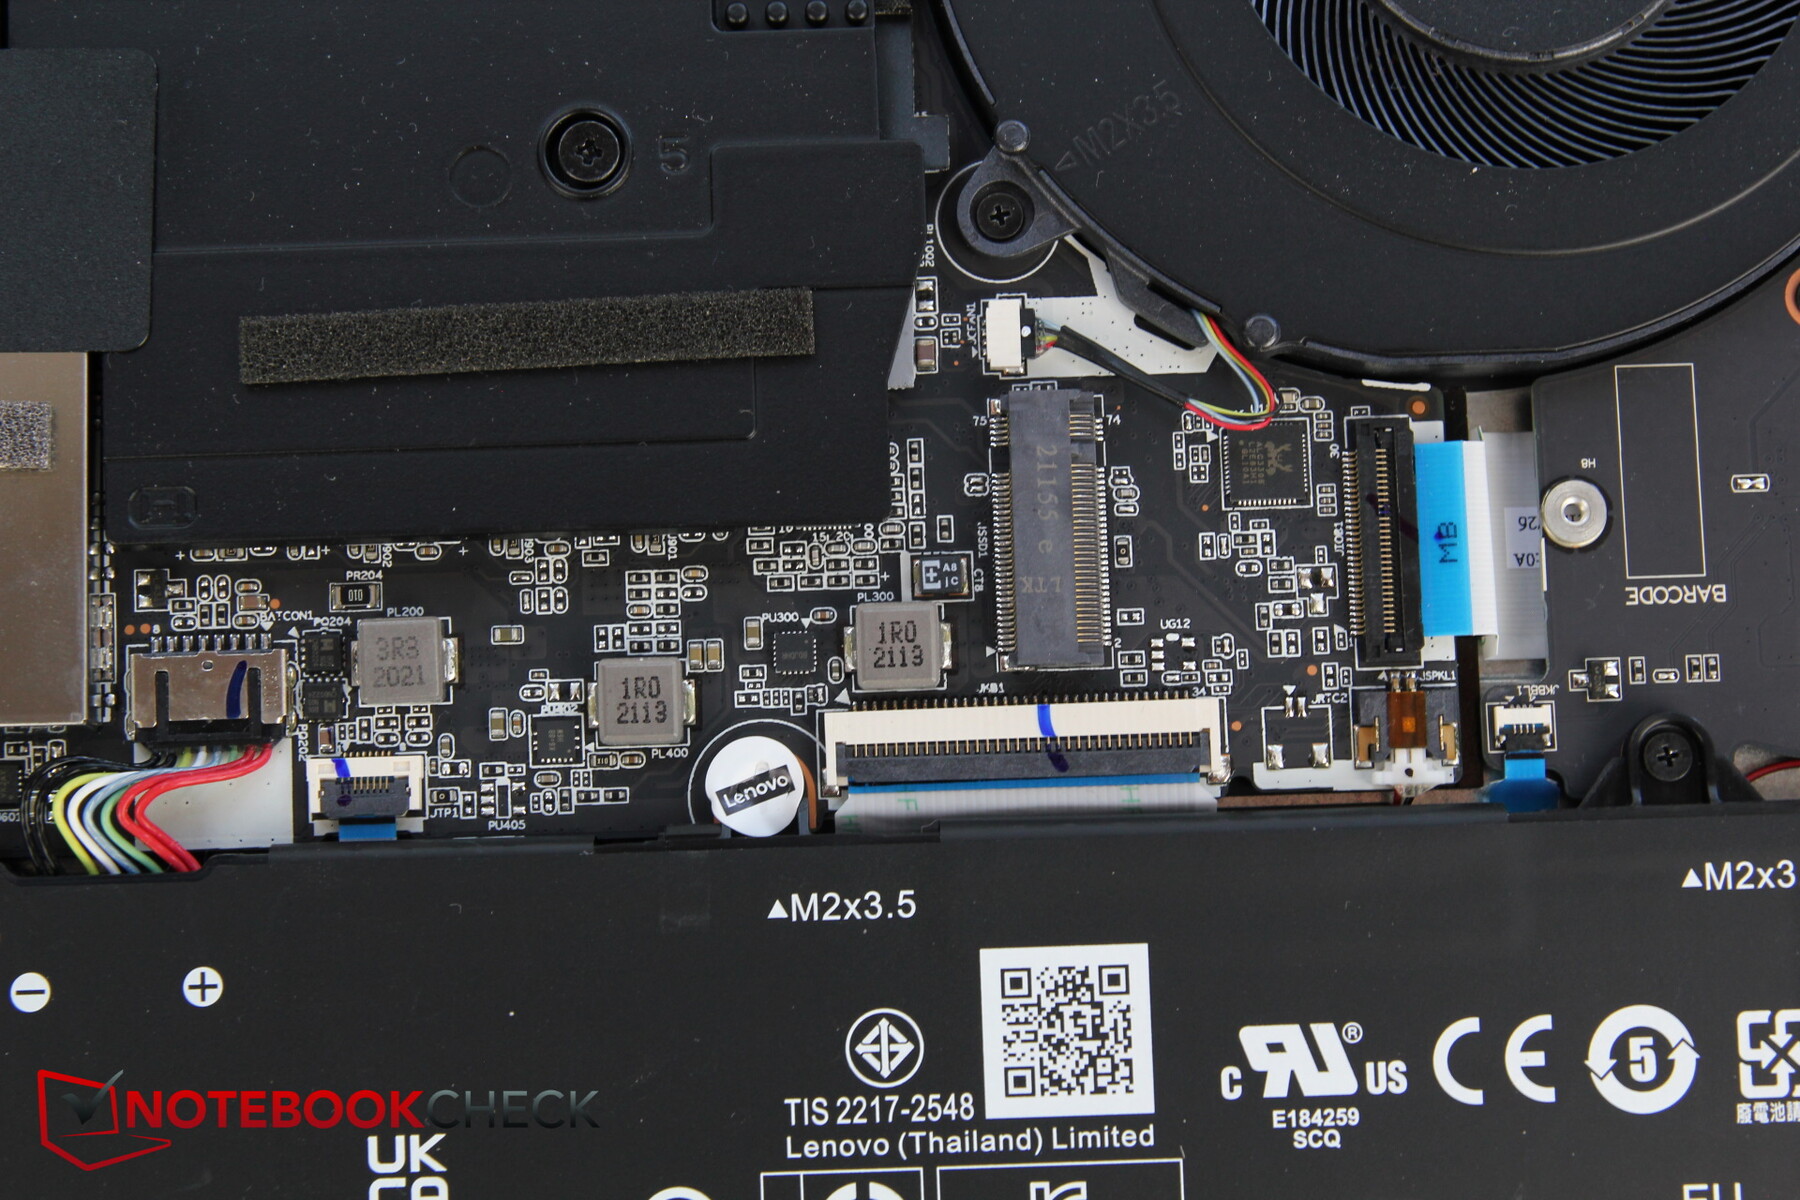
After loosening the screws, the bottom cover still sits very firmly in place, and it has to be pried open with a suitable tool. After that, you can access the fans, the WLAN module, the RAM slot, and the SSD. However, the last two are also concealed behind protective covers that are often overlaid with plastic or metal plates. For example, there's a plastic strip on top of the SSD and a copper strip on top of that to dissipate heat. Overall, the components aren't very easy to access due to the excess of covers.
There seems to be another SSD slot ("SSD1"), but its location is obstructed or covered by some of the other plastic layers.
Warranty
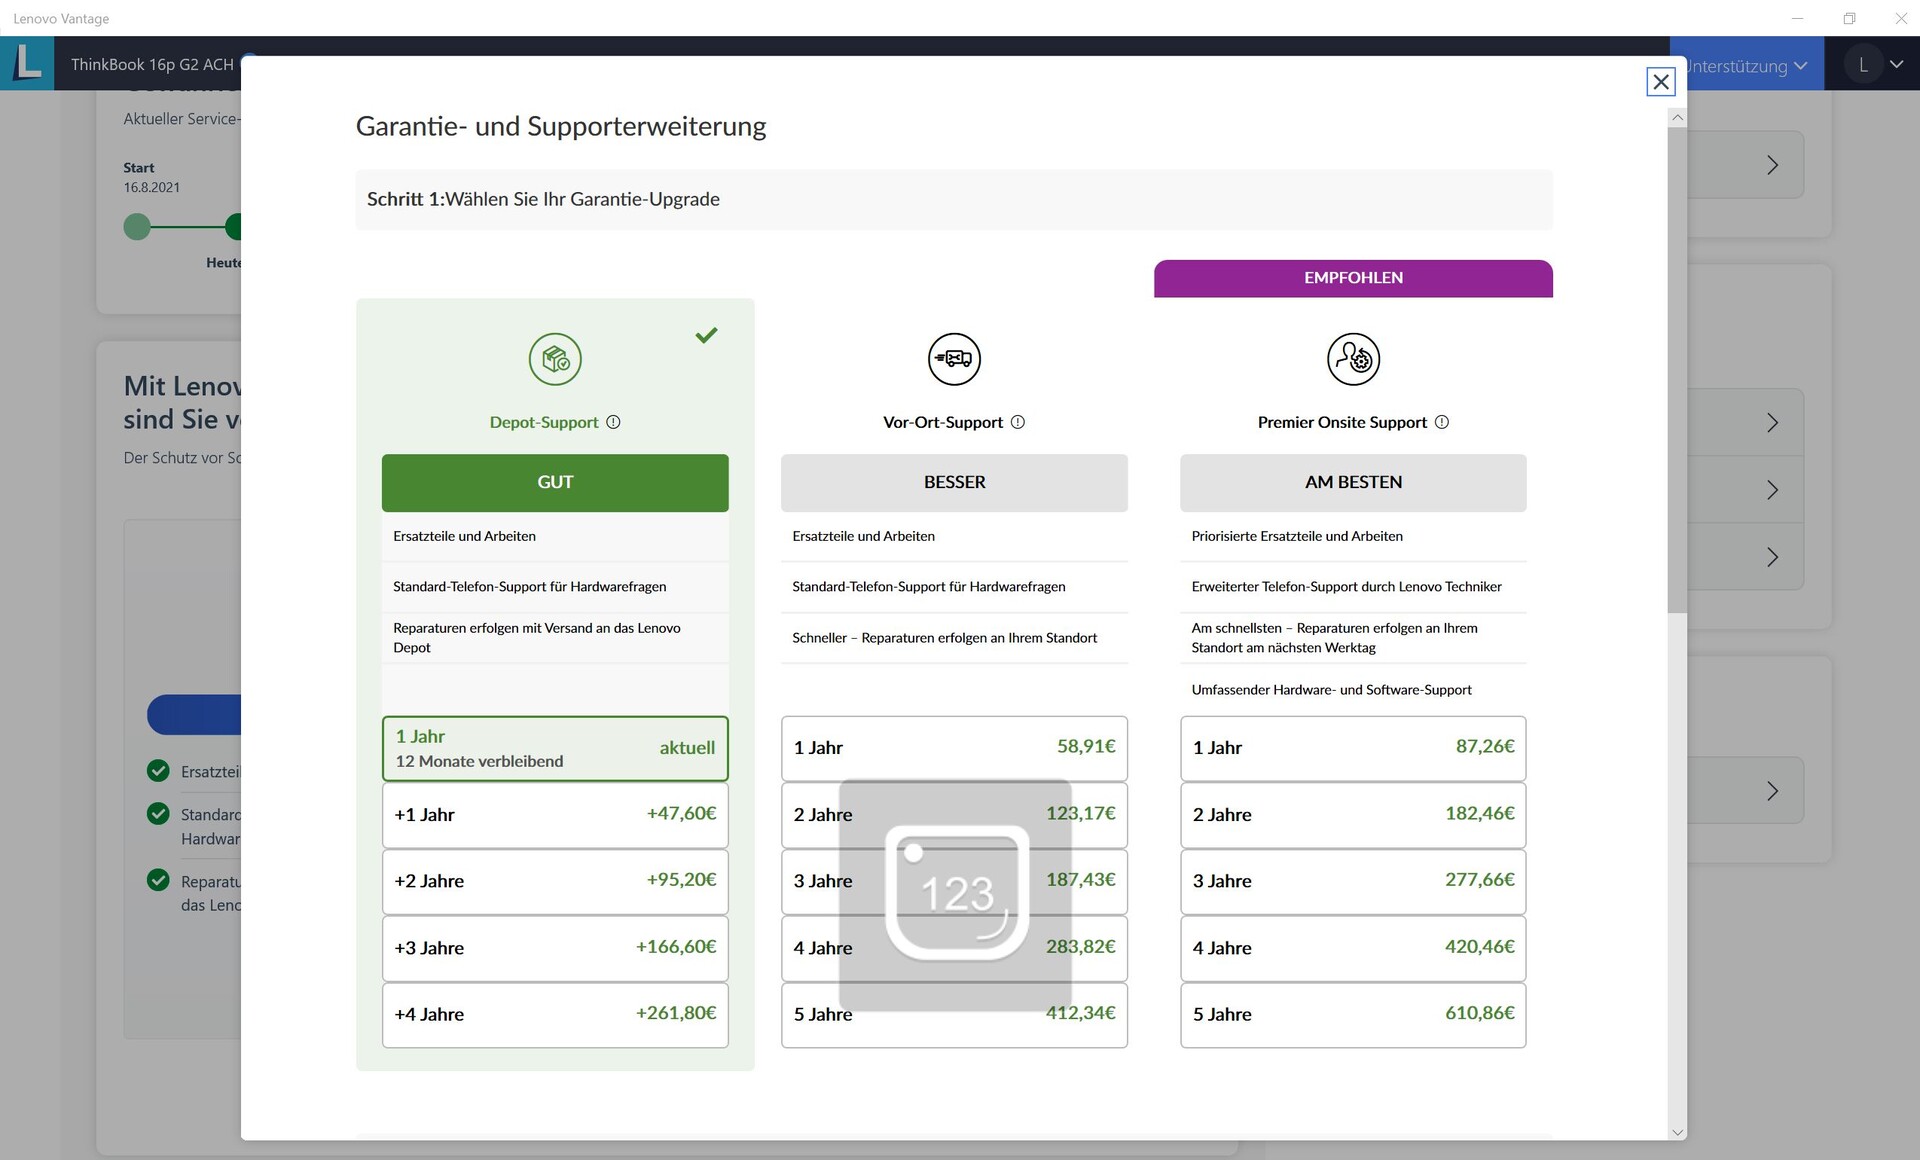
Lenovo only provides a 12-month warranty. The manufacturer charges extra for an extension or on-site service within the warranty period. The numerous options are displayed in the screenshot on the right.
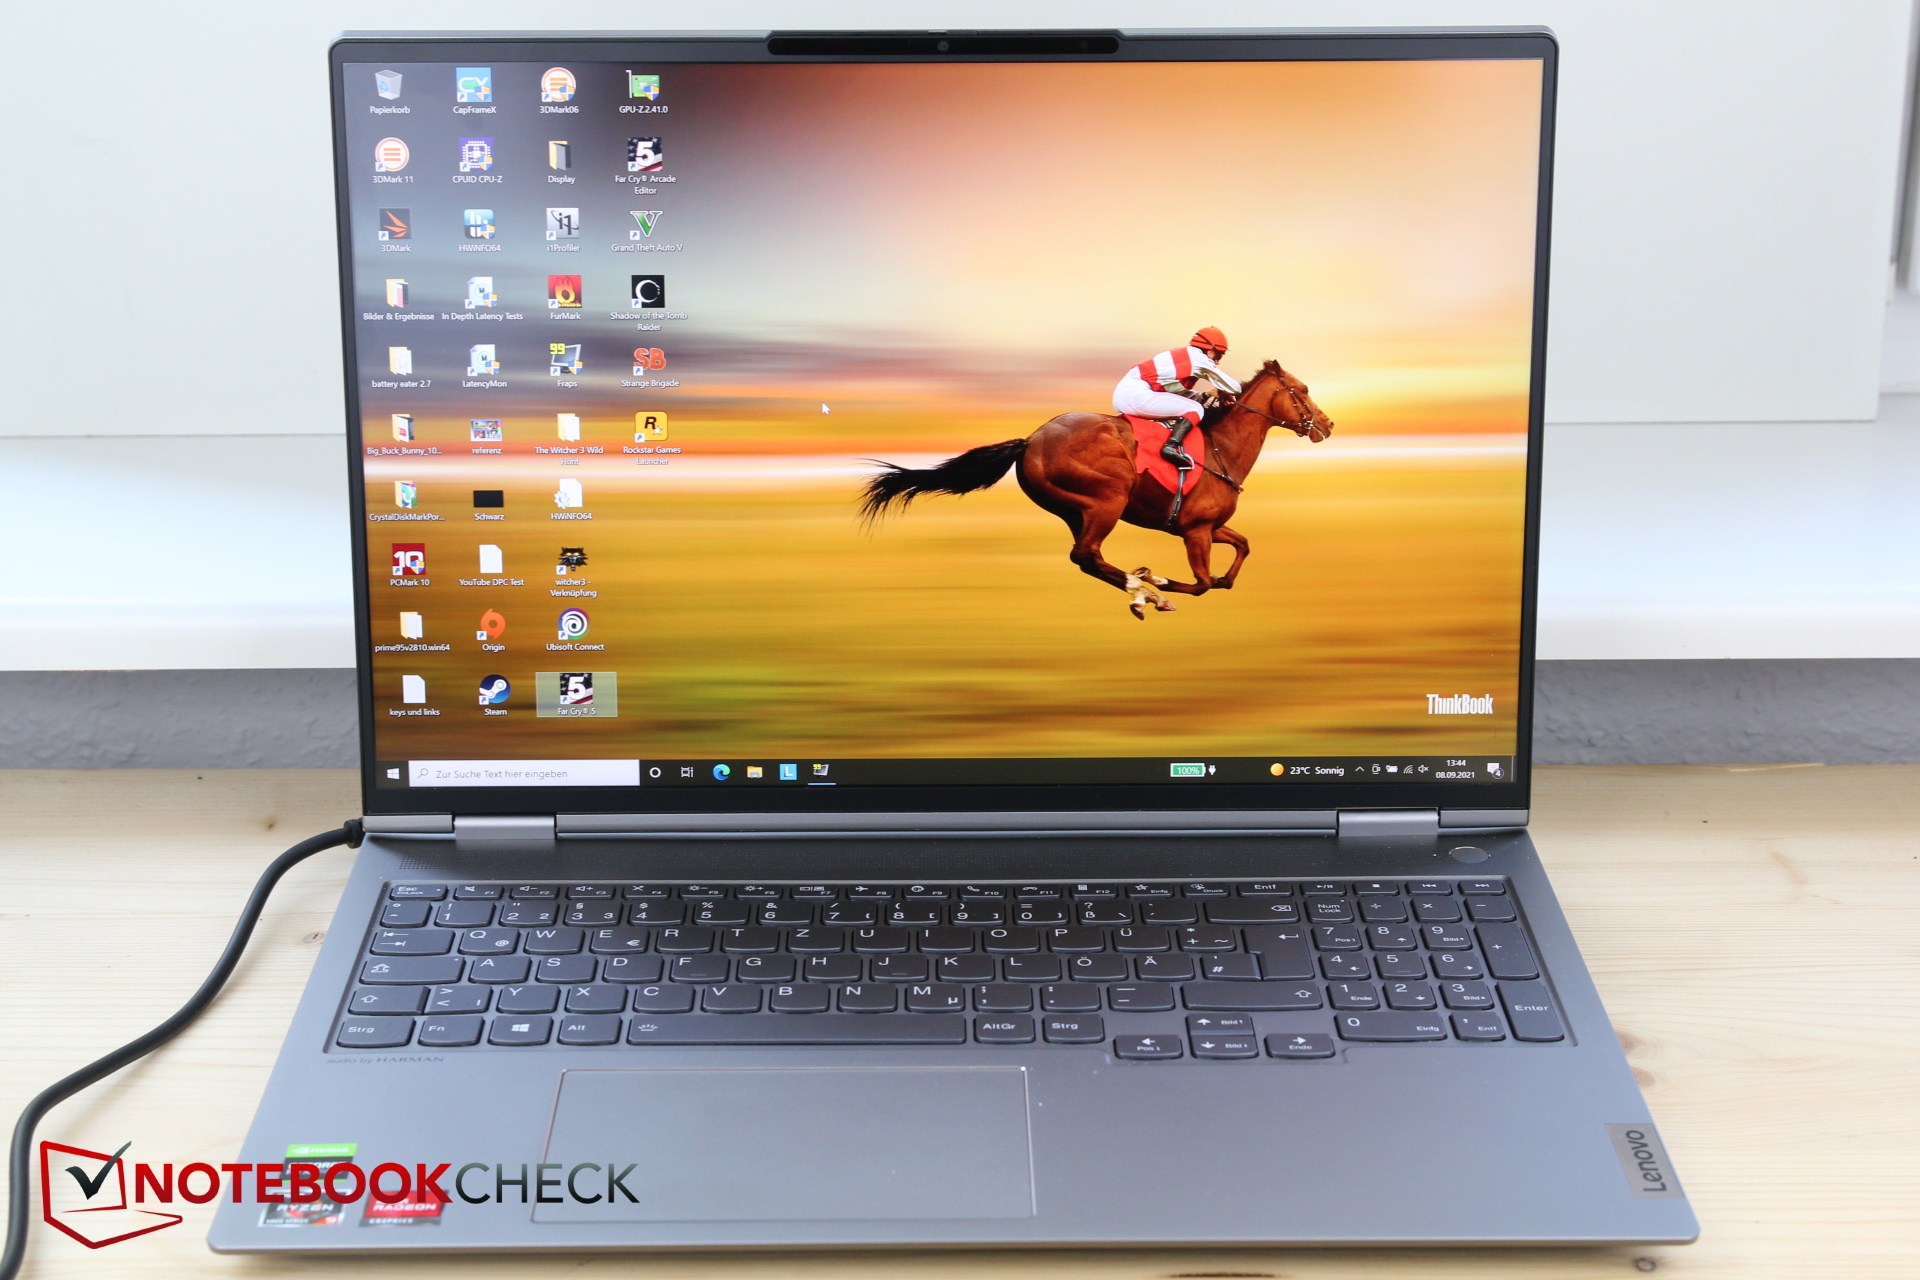
Input devices - No ThinkPad, but okay
Keyboard
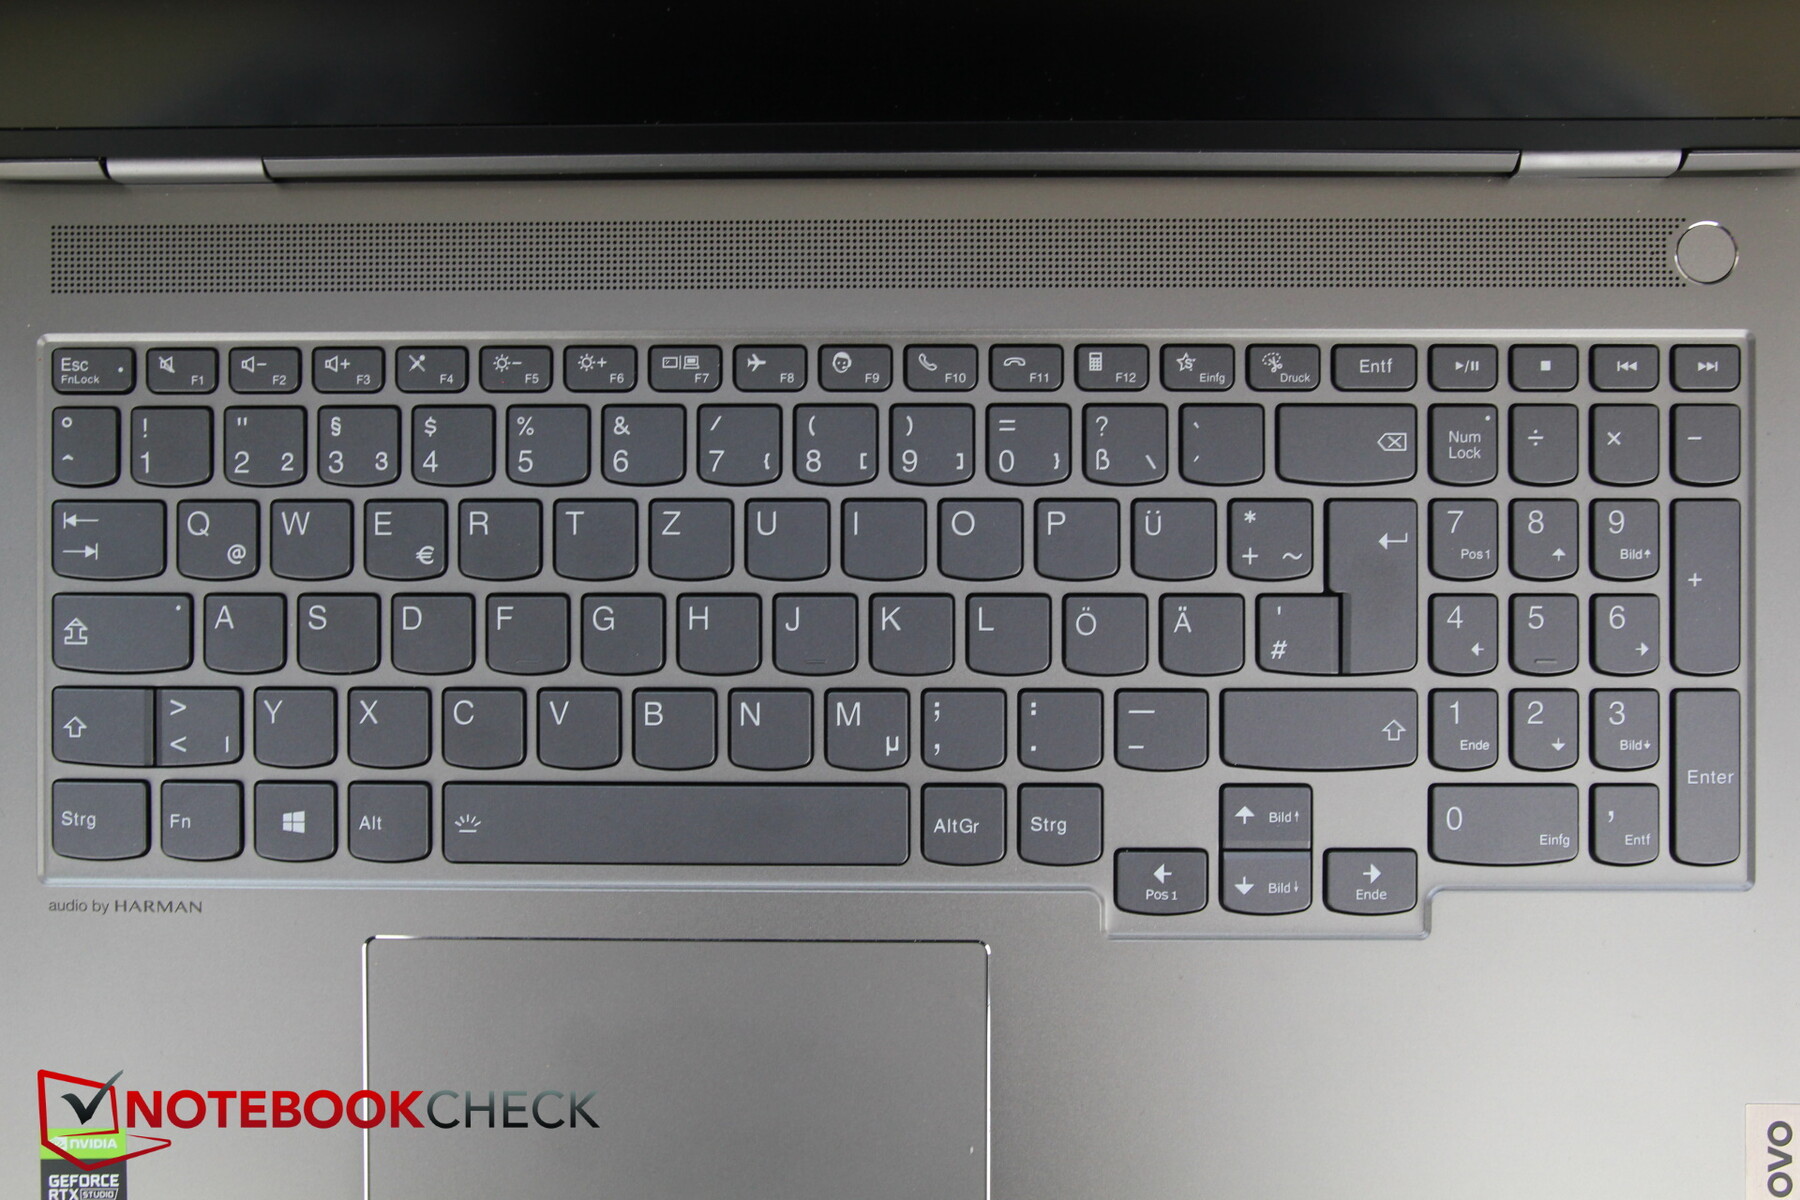
The key layout is slightly different from the 15p. In the area of the arrow keys, the keyboard base now has a protrusion towards the bottom, so that the arrow keys are now normal sized and also better separated from the neighboring keys.
The keys are about 1.5 cm in size and rounded towards the bottom, which leaves a clutter-free impression. Apart from the usual special functions, there's a button that automatically opens the Lenovo support website.
The travel is relatively short, but still just sufficient, and the feedback is a bit soft. Nevertheless, typing is quite fast, and the typing noise is moderate.
The two-stage, white backlight is nice to have in poor ambient light.
Touchpad
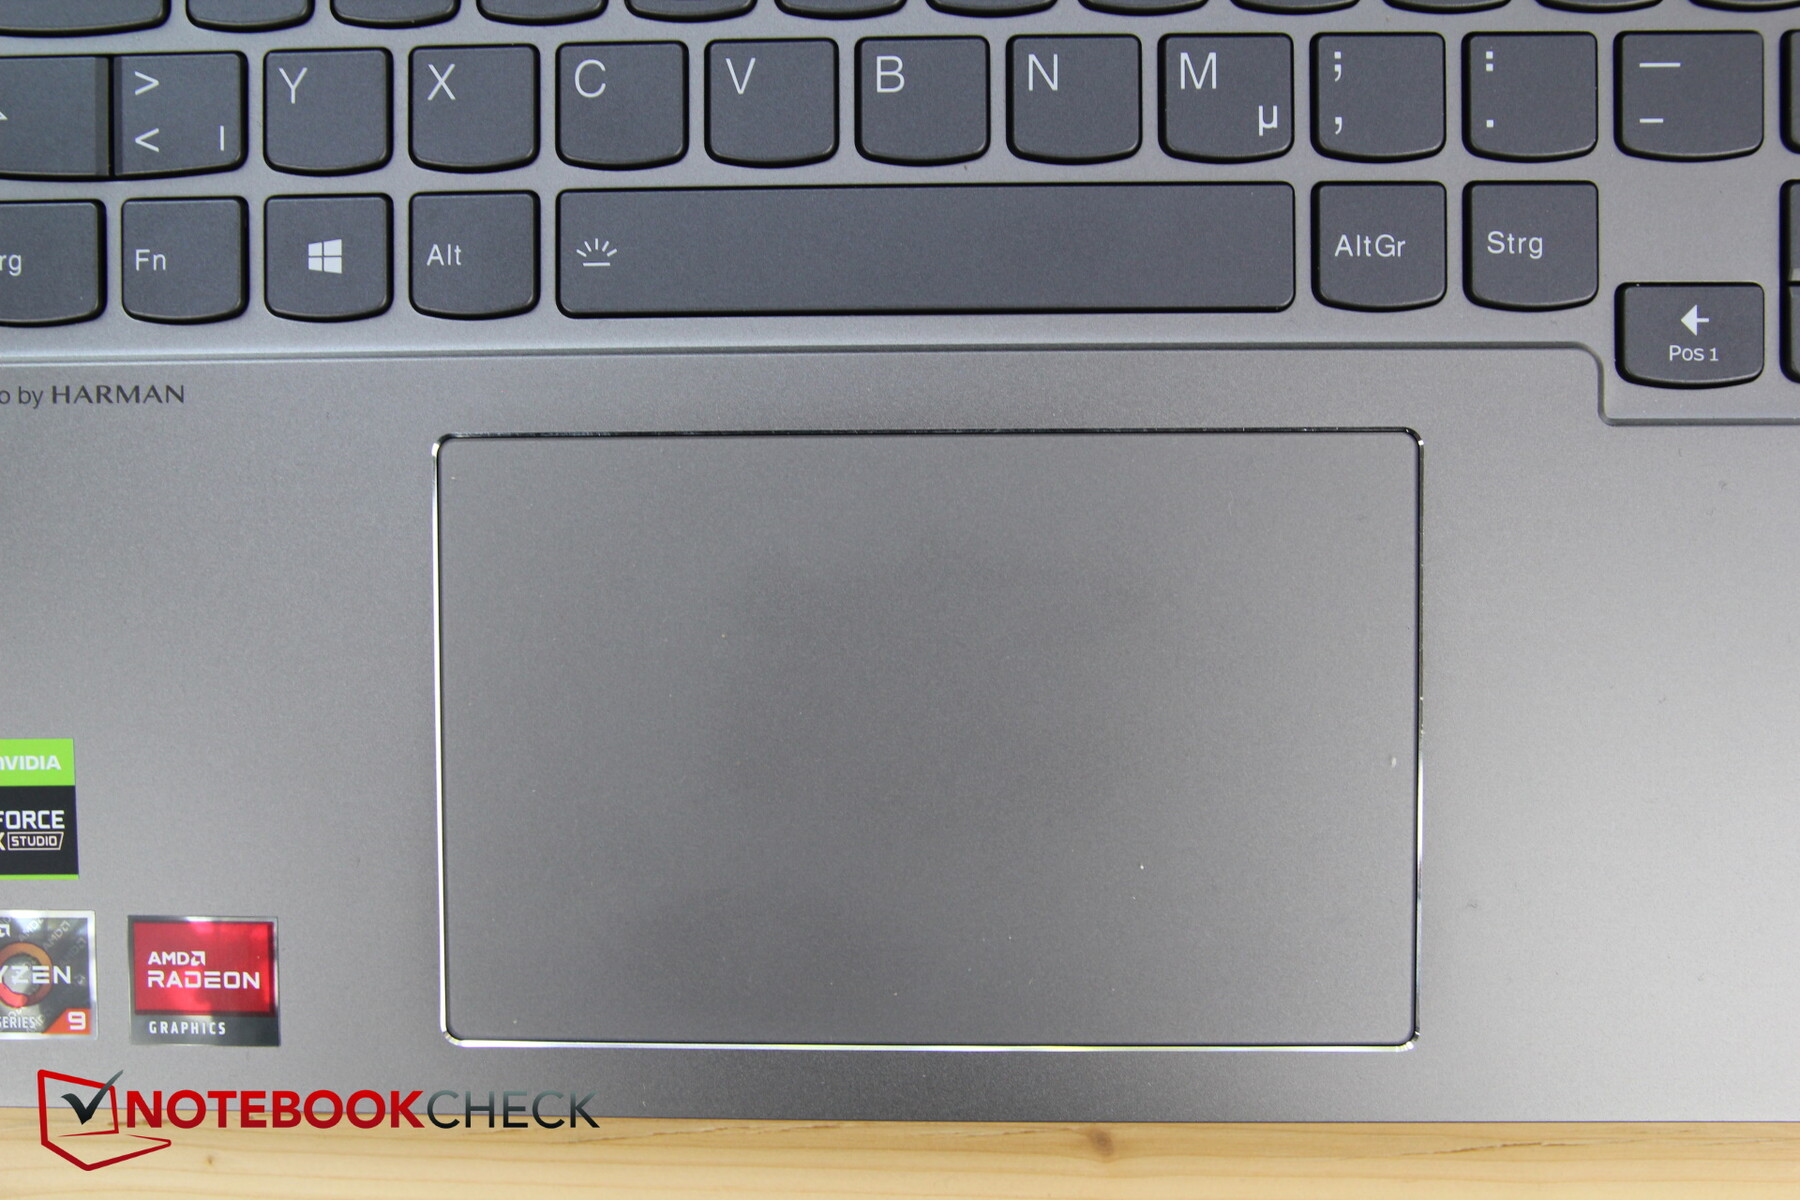
The touchpad measures about 12 x 7.5 cm and is consequently of a good size. The gliding capabilities are still very good even during slow movements, and there are only shortcomings in the outer corners.
There are no dedicated mouse buttons; the buttons integrated into the pad surface trigger reliably, and the click noises are passable.
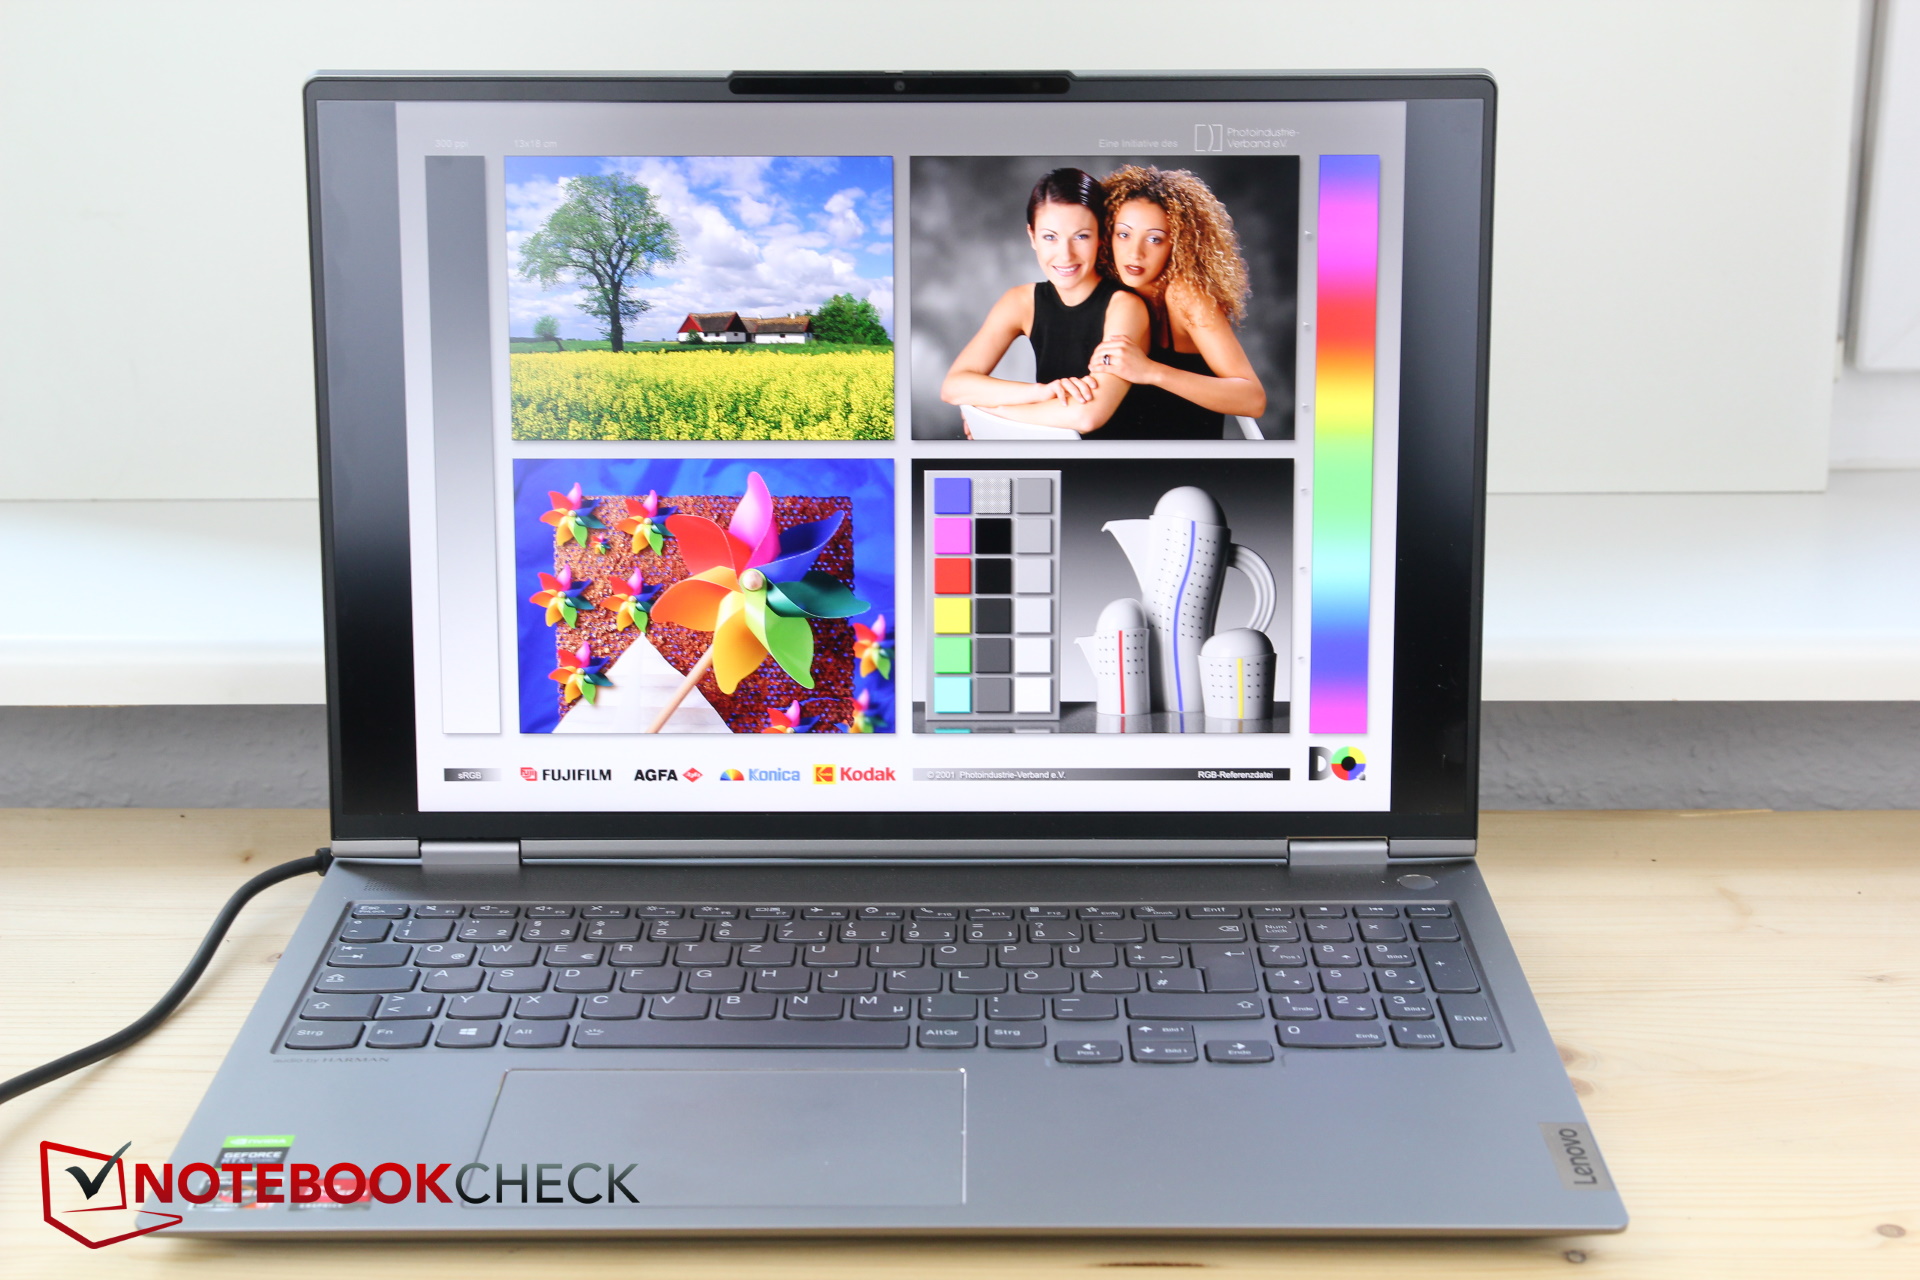
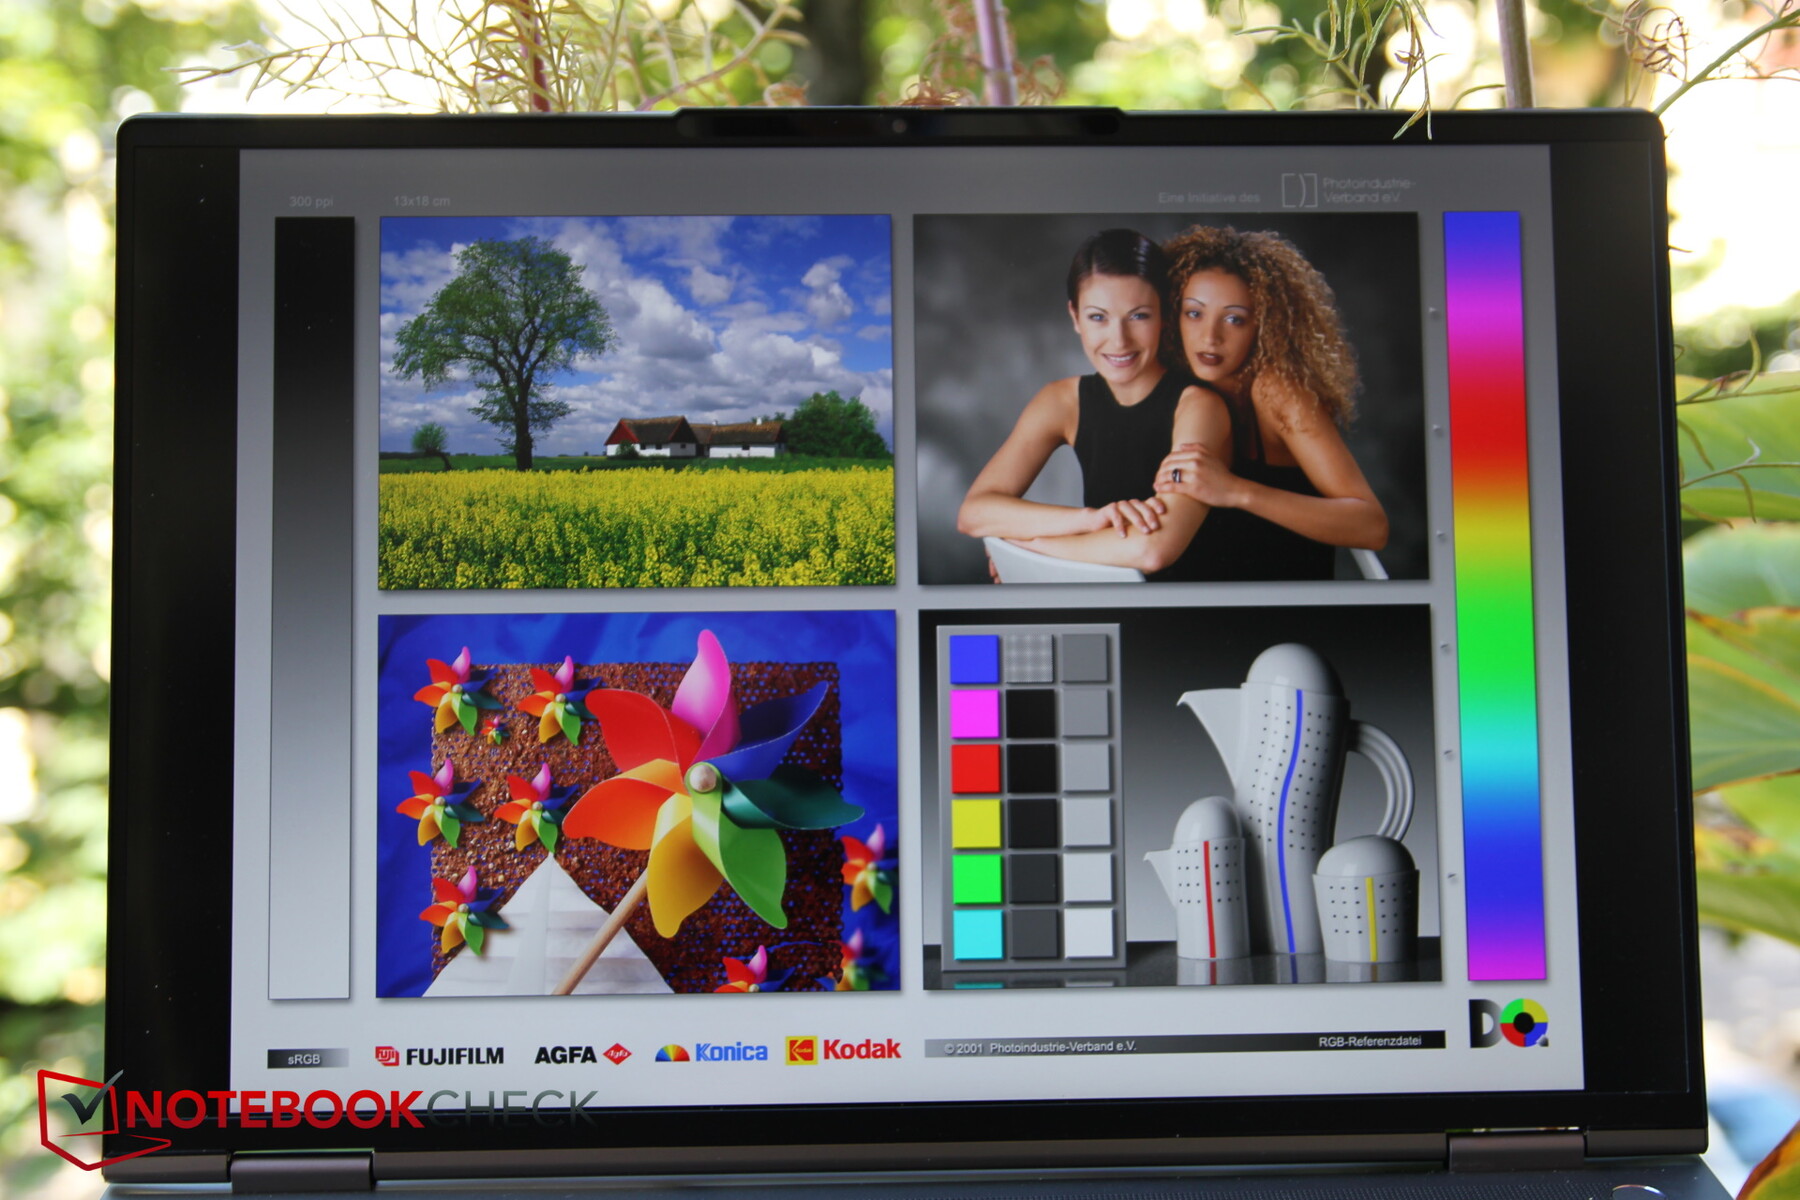
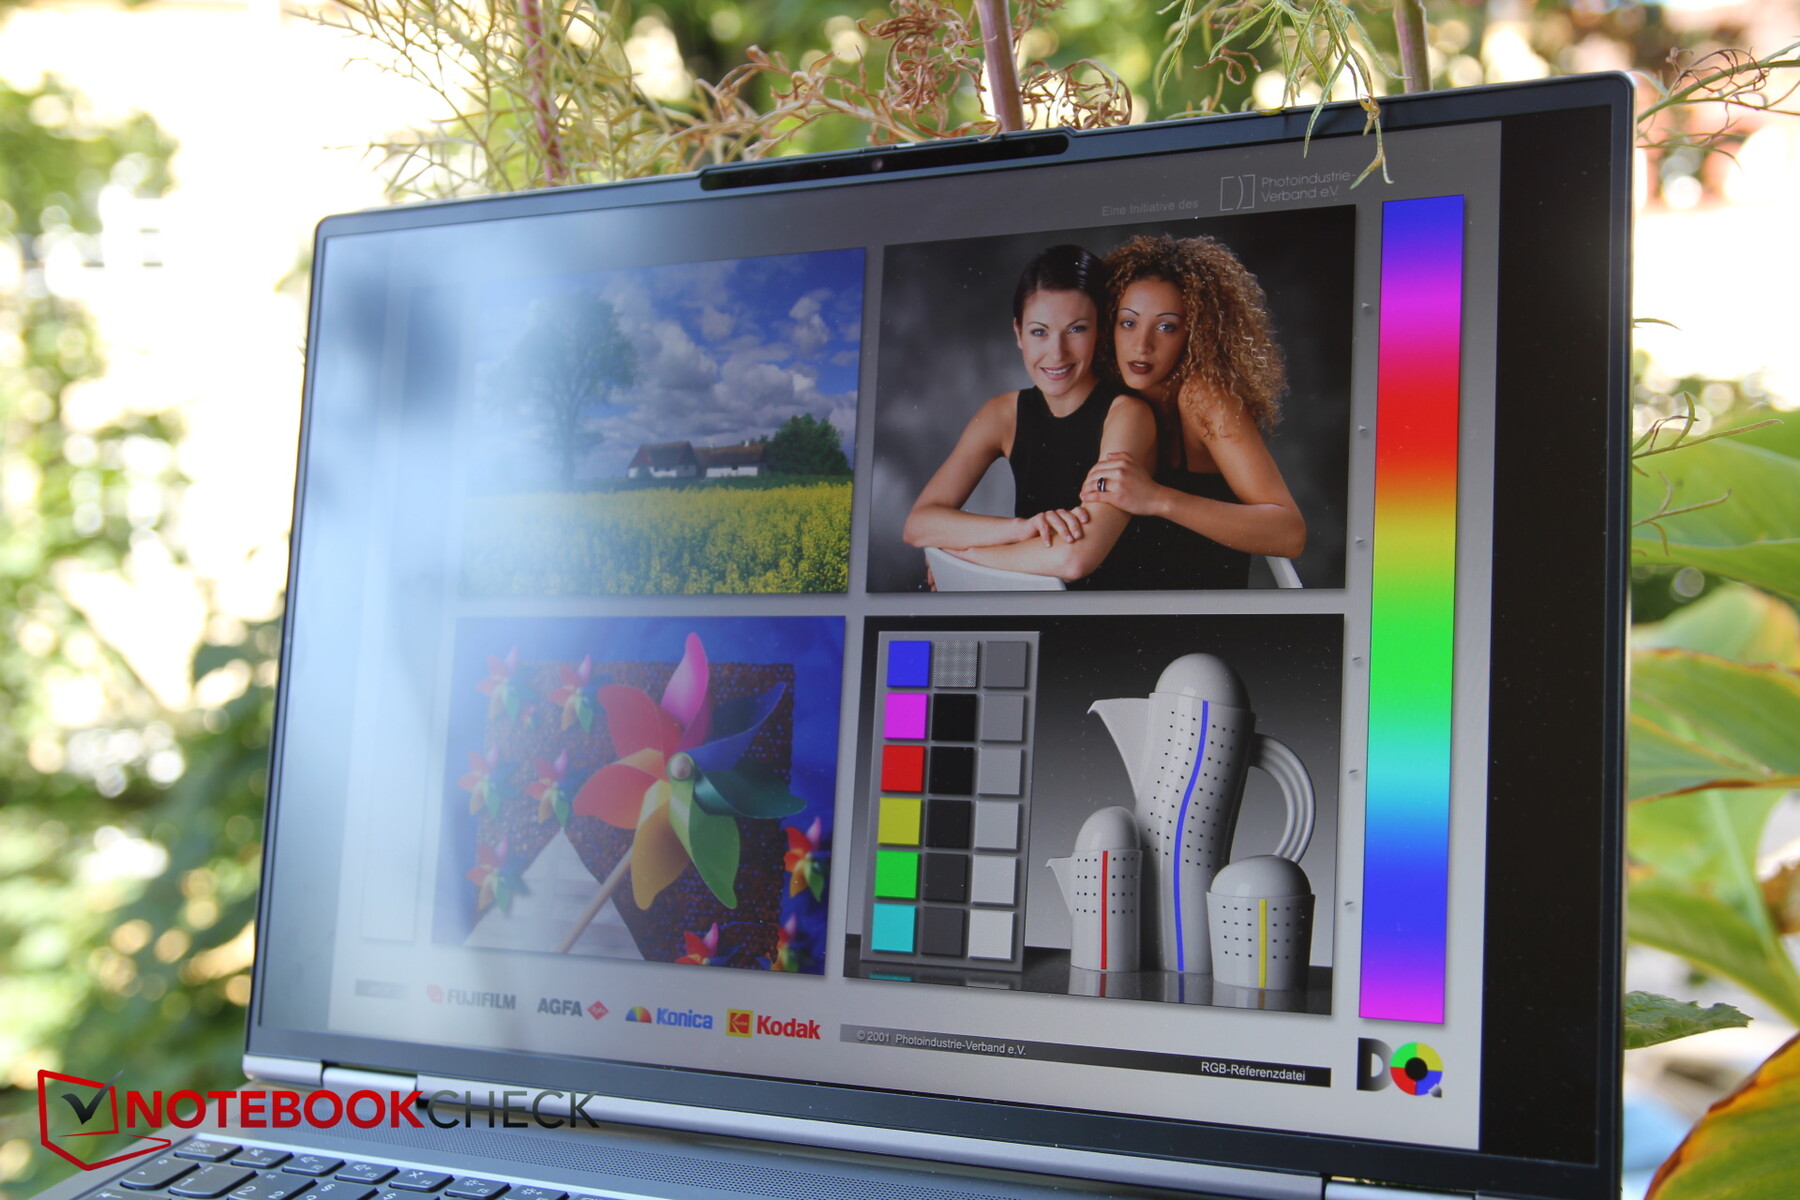
Display - 16:10, but only 60 Hz


The IPS display is one of the highlights of the ThinkBook 16p. It has a resolution of 2560x1600 pixels, so it has an aspect ratio of 16:10, but it only offers a 60 Hz refresh rate - this makes it clear that the ThinkBook isn't meant to be a dedicated gaming laptop, since their displays usually offer a higher refresh rate nowadays.
The brightness of nearly 400 nits is good, but the brightness distribution could be better. Luminosity decreases considerably in the lower right corner in particular.
PWM is not used. The response times are disappointing, at least by gaming standards.
| |||||||||||||||||||||||||
Brightness Distribution: 83 %
Center on Battery: 438 cd/m²
Contrast: 998:1 (Black: 0.44 cd/m²)
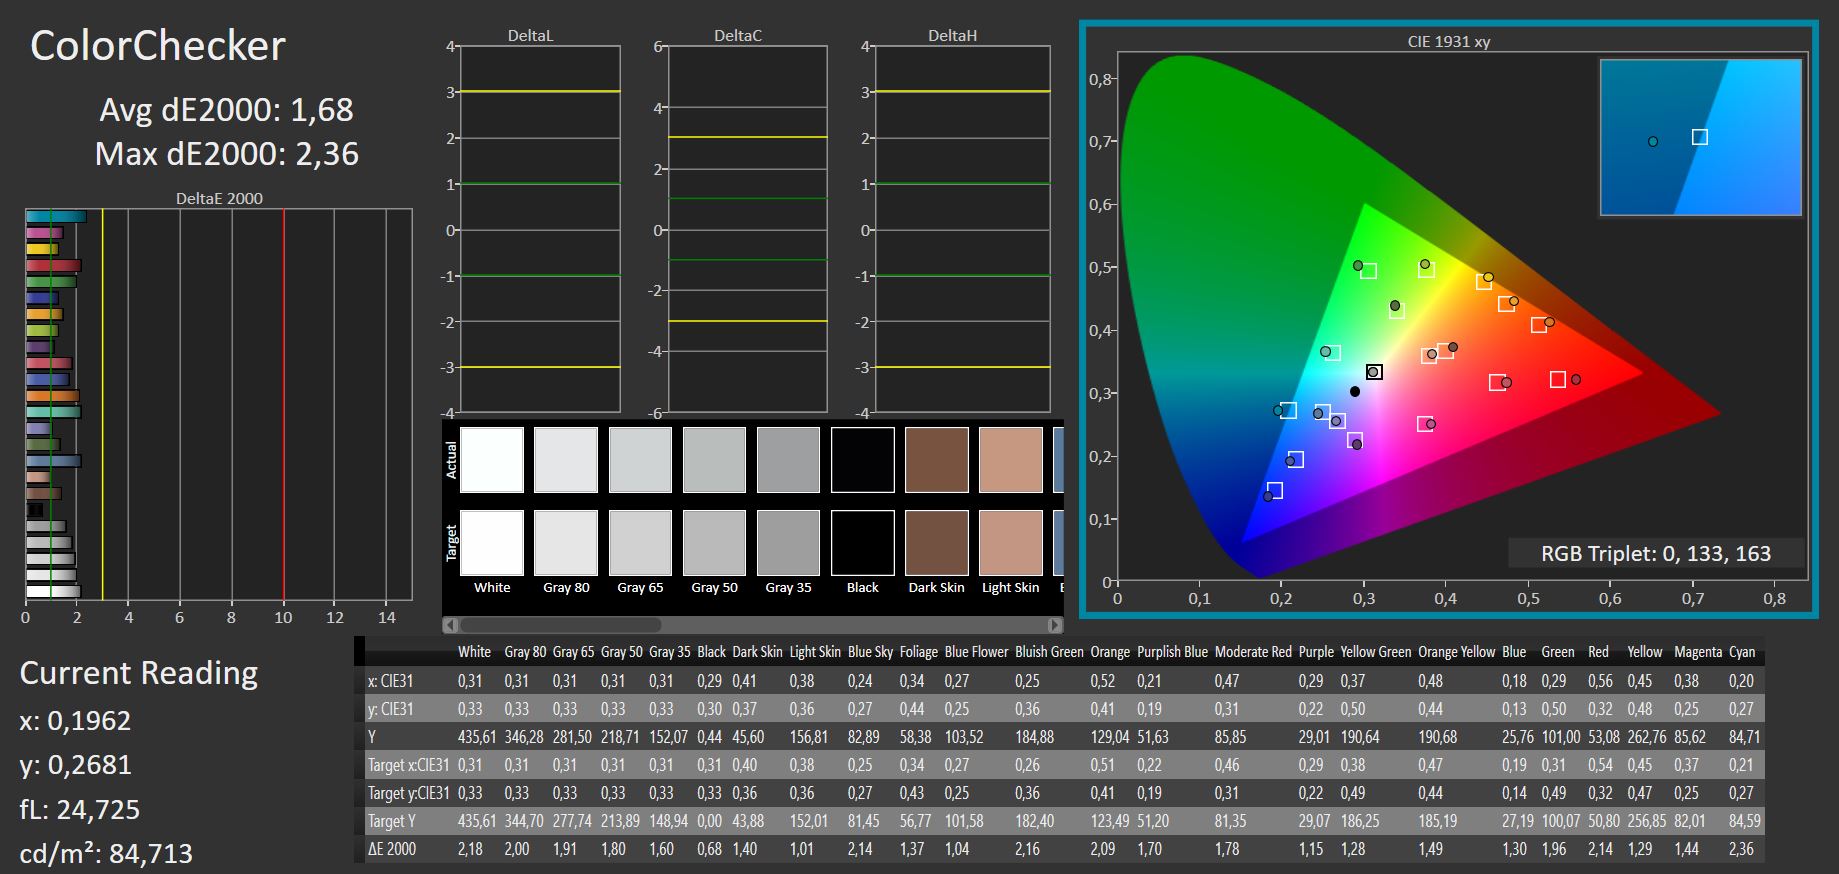
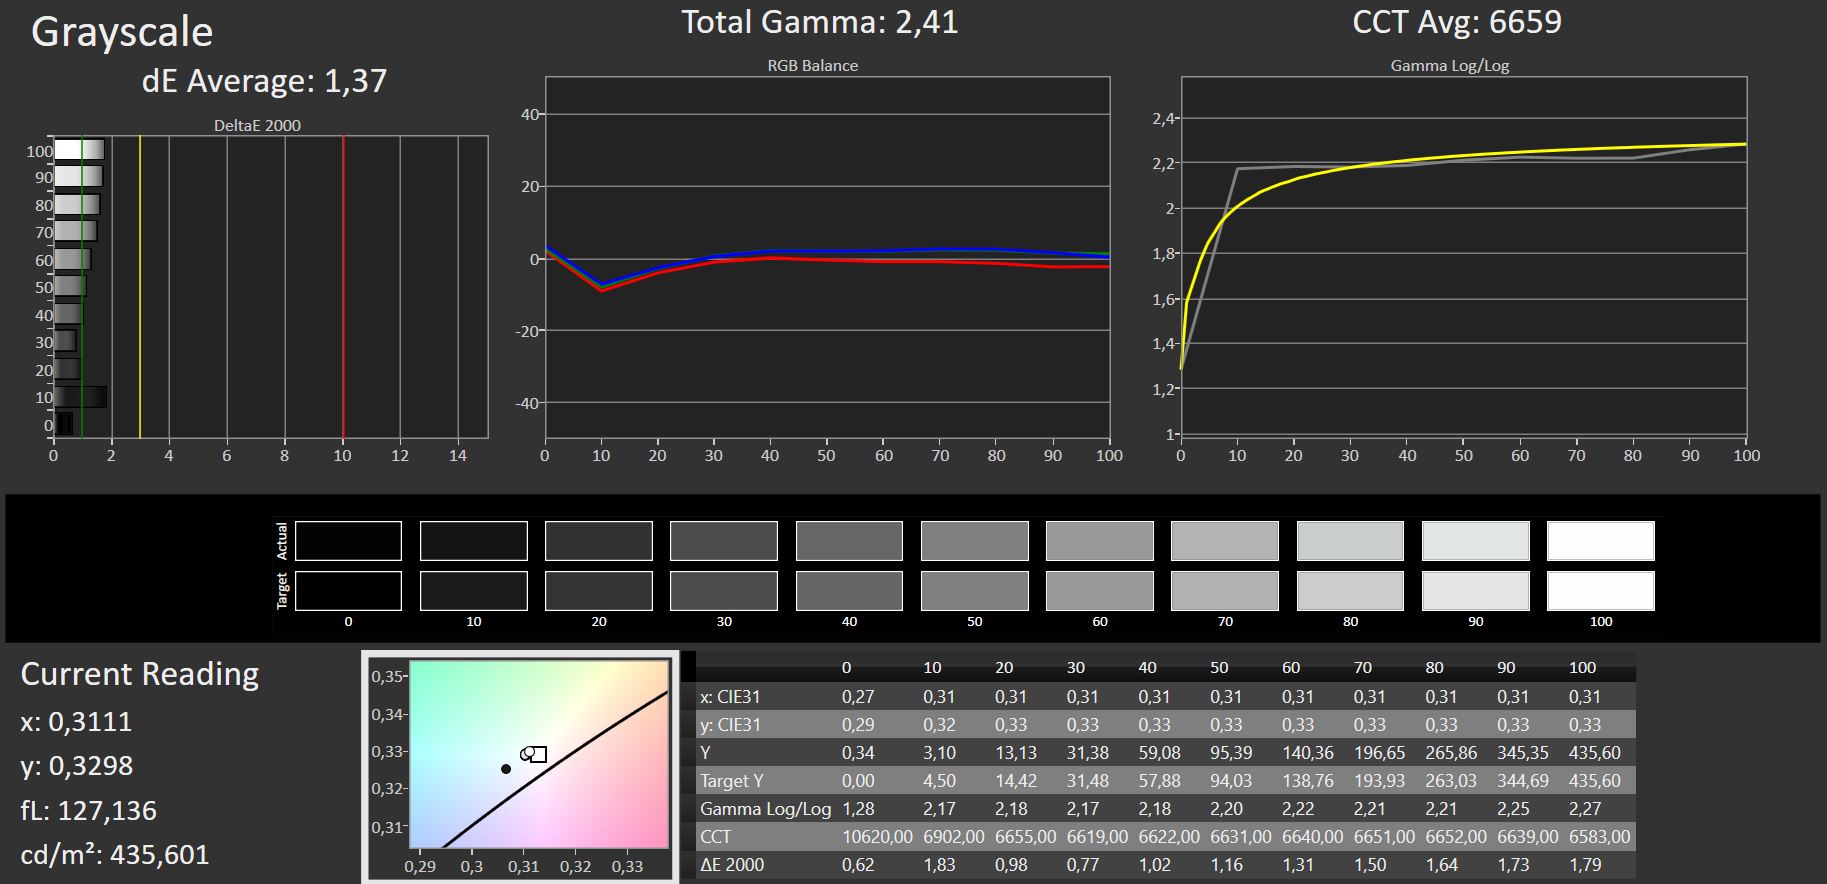
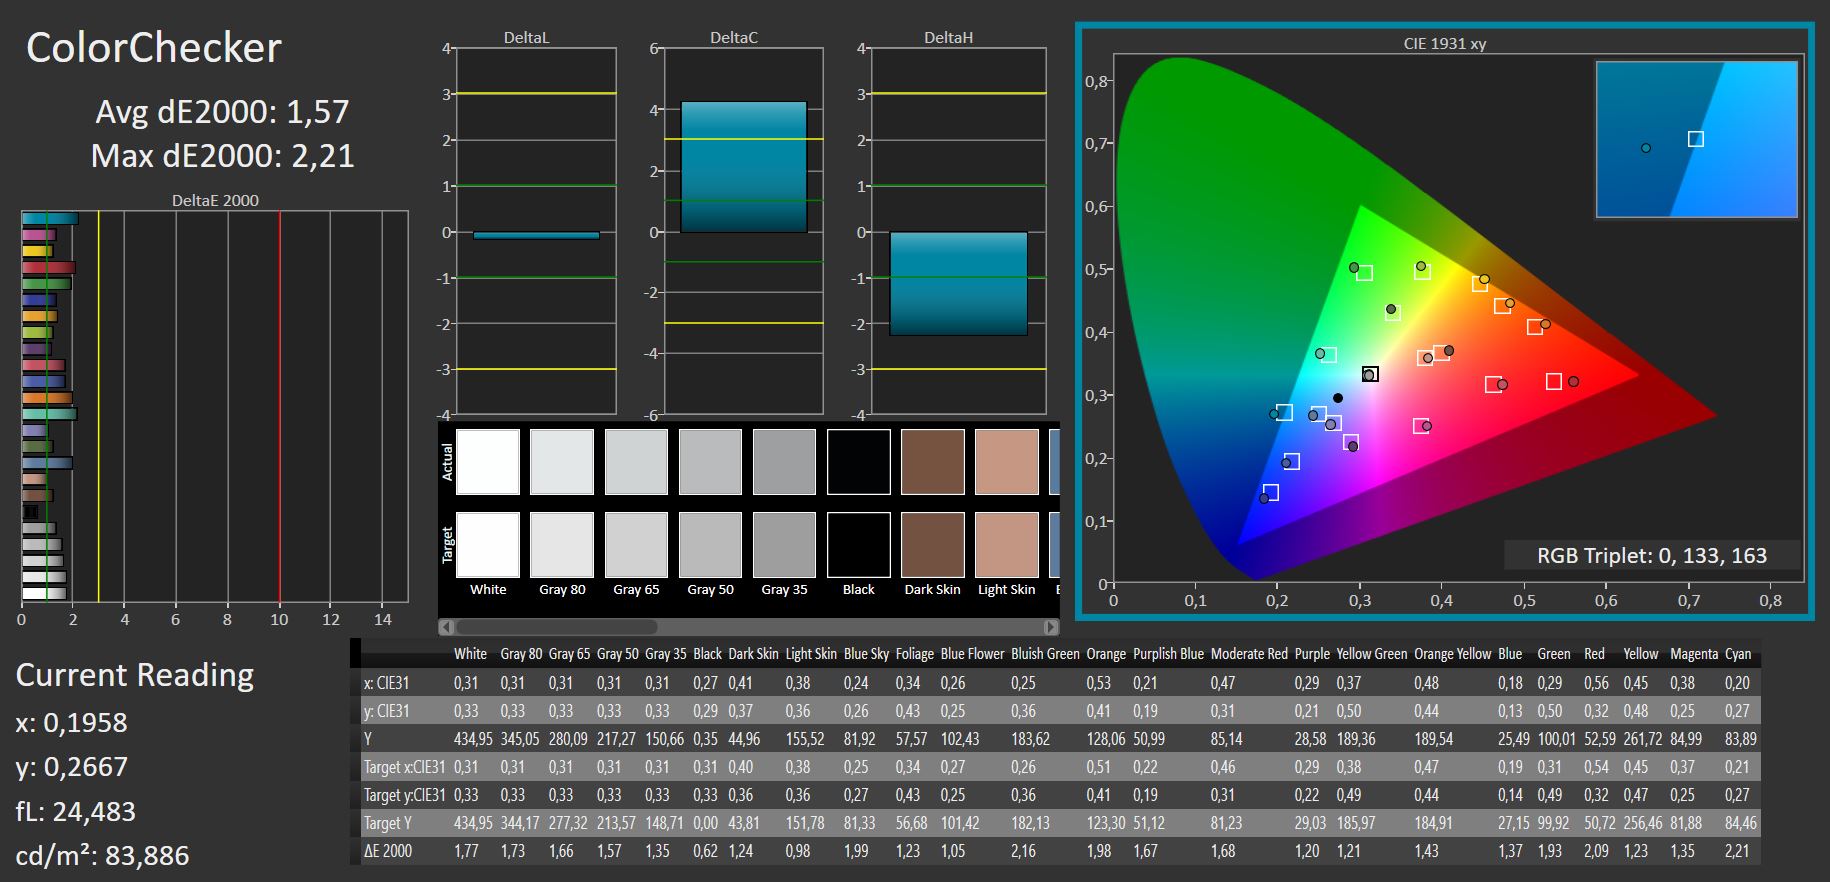
ΔE ColorChecker Calman: 1.68 | ∀{0.5-29.43 Ø4.79}
calibrated: 1.57
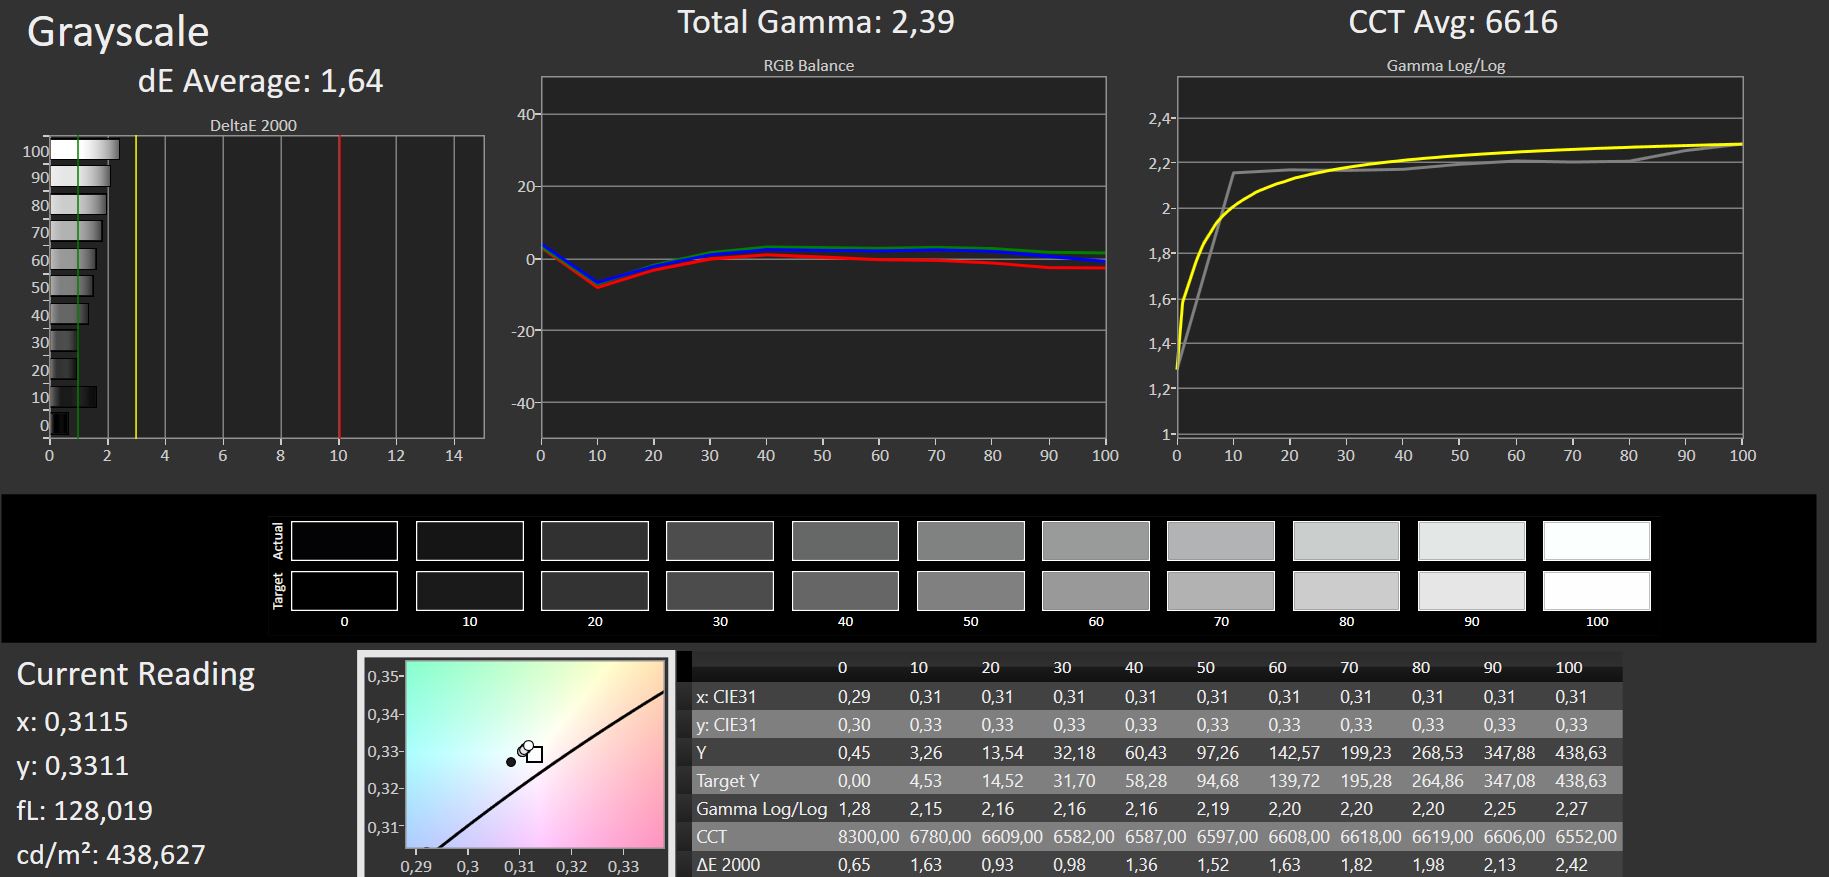
ΔE Greyscale Calman: 1.64 | ∀{0.09-98 Ø5}
77.4% AdobeRGB 1998 (Argyll 3D)
100% sRGB (Argyll 3D)
76.4% Display P3 (Argyll 3D)
Gamma: 2.39
CCT: 6616 K
| Lenovo ThinkBook 16p G2 ACH Lenovo LEN8A95 (AUO B160QAN02.M), IPS, 2560x1600, 16" | Lenovo ThinkBook 15p Gen1 4K CSOT T3 MNF601EA-1, IPS, 3840x2160, 15.6" | Dell Inspiron 16 Plus 7610 AU Optronics B160QAN, IPS, 3072x1920, 16" | Razer Blade 15 Base Edition 2021, i7-10750H RTX 3060 BOE NV156FHM-N4K, IPS, 1920x1080, 15.6" | Alienware m15 R5 Ryzen Edition B156HAN, IPS, 1920x1080, 15.6" | Schenker XMG Core 15 Ampere BOE CQ NE156QHM-NY2, IPS, 2560x1440, 15.6" | |
|---|---|---|---|---|---|---|
| Display | 13% | -2% | -13% | -6% | ||
| Display P3 Coverage (%) | 76.4 | 87.4 14% | 74.1 -3% | 64.3 -16% | 69.8 -9% | |
| sRGB Coverage (%) | 100 | 99.6 0% | 99.4 -1% | 91.8 -8% | 98.8 -1% | |
| AdobeRGB 1998 Coverage (%) | 77.4 | 96.9 25% | 75.8 -2% | 65.5 -15% | 70.7 -9% | |
| Response Times | -44% | -81% | 58% | 69% | 48% | |
| Response Time Grey 50% / Grey 80% * (ms) | 36 | 44.8 ? -24% | 49.2 ? -37% | 8.8 ? 76% | 4 ? 89% | 14.8 ? 59% |
| Response Time Black / White * (ms) | 16.4 | 26.8 ? -63% | 36.8 ? -124% | 10 ? 39% | 8.4 ? 49% | 10.4 ? 37% |
| PWM Frequency (Hz) | 1000 ? | |||||
| Screen | 17% | -21% | -66% | -22% | 4% | |
| Brightness middle (cd/m²) | 439 | 599 36% | 296.8 -32% | 317.2 -28% | 329 -25% | 347 -21% |
| Brightness (cd/m²) | 397 | 599 51% | 292 -26% | 306 -23% | 321 -19% | 328 -17% |
| Brightness Distribution (%) | 83 | 91 10% | 87 5% | 89 7% | 92 11% | 89 7% |
| Black Level * (cd/m²) | 0.44 | 0.37 16% | 0.21 52% | 0.31 30% | 0.27 39% | 0.27 39% |
| Contrast (:1) | 998 | 1619 62% | 1413 42% | 1023 3% | 1219 22% | 1285 29% |
| Colorchecker dE 2000 * | 1.68 | 1.4 17% | 2.56 -52% | 4.37 -160% | 2.78 -65% | 1.66 1% |
| Colorchecker dE 2000 max. * | 2.36 | 2.9 -23% | 4.76 -102% | 6.62 -181% | 4.88 -107% | 3.03 -28% |
| Colorchecker dE 2000 calibrated * | 1.57 | 1.86 -18% | 2.67 -70% | 1.63 -4% | 1.23 22% | |
| Greyscale dE 2000 * | 1.64 | 2.2 -34% | 2.6 -59% | 4.5 -174% | 2.5 -52% | 1.6 2% |
| Gamma | 2.39 92% | 2.14 103% | 2.07 106% | 2.4 92% | 2.106 104% | 2.278 97% |
| CCT | 6616 98% | 6842 95% | 6628 98% | 7418 88% | 6201 105% | 6430 101% |
| Color Space (Percent of AdobeRGB 1998) (%) | 83.6 | 59.2 | 76 | 71 | ||
| Color Space (Percent of sRGB) (%) | 99.5 | 91.4 | 99 | 94 | ||
| Total Average (Program / Settings) | -5% /
7% | -35% /
-26% | -7% /
-37% | 24% /
-6% | 15% /
8% |
* ... smaller is better
The contrast and black level could be improved, but the display is already well configured out of the box in return, with correspondingly low color deviations. A new calibration hardly brings any improvements.
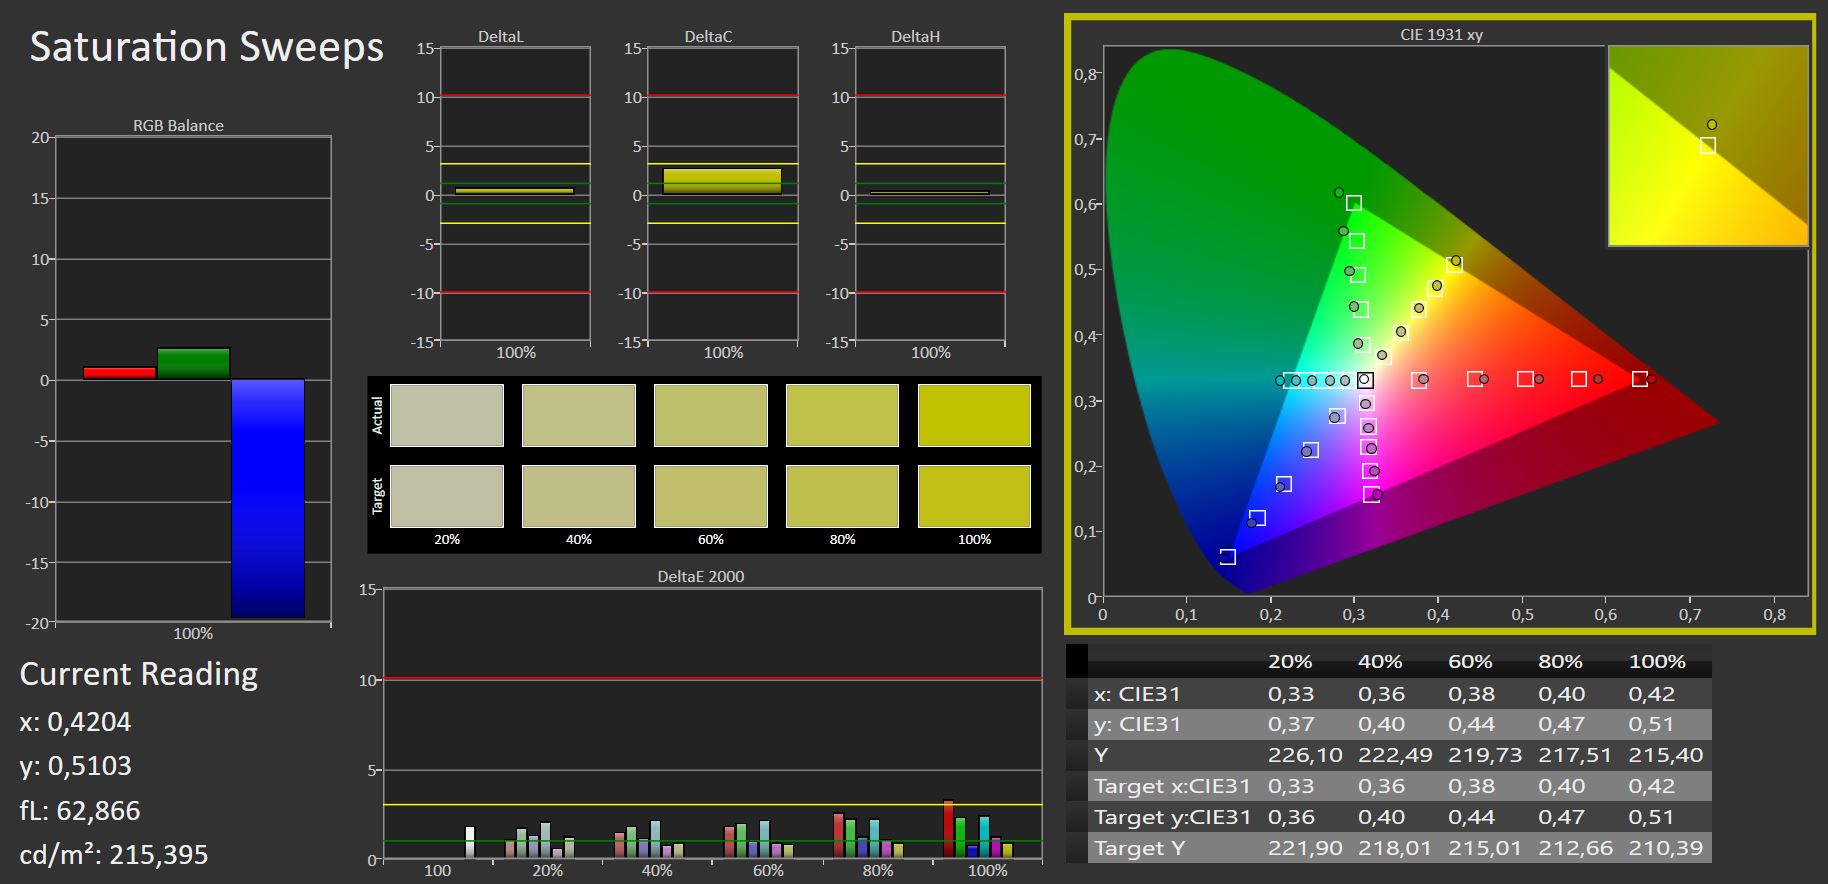
Lenovo advertises the display with a full sRGB coverage, which is confirmed by our measurements. AdobeRGB and Display P3 are still covered by about 77% each. The 4K display in the ThinkBook 15p was much better here, and it even covered the AdobeRGB color space almost completely. Therefore, there's a minor shortcoming here for creatives, since an optional 4K display is not offered due to the 16:10 aspect ratio.

The matte surface eliminates most reflections reliably, and the good maximum brightness ensures that the ThinkBook can be used quite well even outdoors.
Display Response Times
| ↔ Response Time Black to White | ||
|---|---|---|
| 16.4 ms ... rise ↗ and fall ↘ combined | ↗ ms rise | 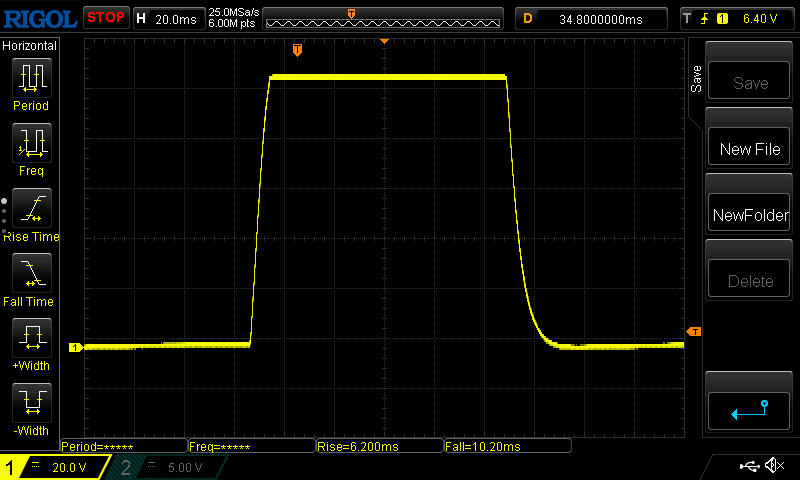 |
| ↘ ms fall | ||
| The screen shows good response rates in our tests, but may be too slow for competitive gamers. In comparison, all tested devices range from 0.1 (minimum) to 240 (maximum) ms. » 37 % of all devices are better. This means that the measured response time is better than the average of all tested devices (20.3 ms). | ||
| ↔ Response Time 50% Grey to 80% Grey | ||
| 36 ms ... rise ↗ and fall ↘ combined | ↗ ms rise | 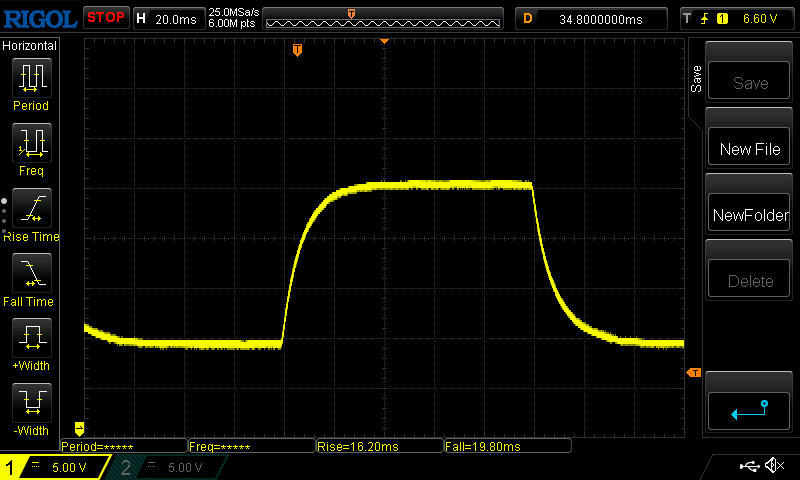 |
| ↘ ms fall | ||
| The screen shows slow response rates in our tests and will be unsatisfactory for gamers. In comparison, all tested devices range from 0.165 (minimum) to 636 (maximum) ms. » 49 % of all devices are better. This means that the measured response time is worse than the average of all tested devices (31.7 ms). | ||
Screen Flickering / PWM (Pulse-Width Modulation)
| Screen flickering / PWM not detected | 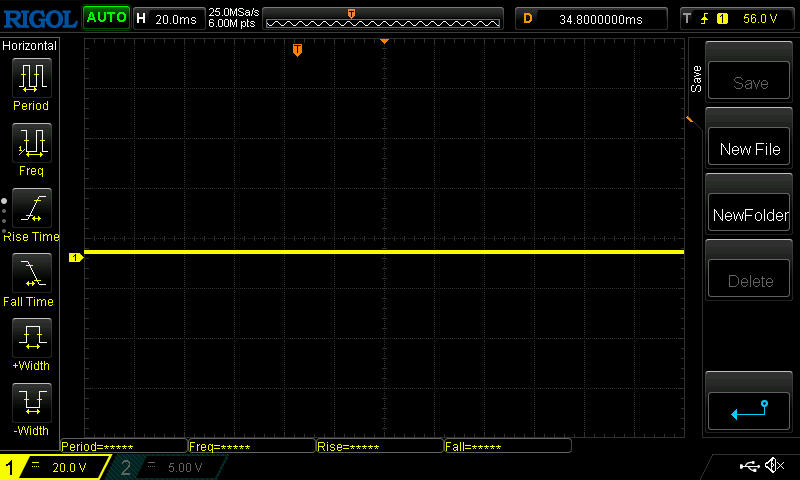 | ||
In comparison: 53 % of all tested devices do not use PWM to dim the display. If PWM was detected, an average of 8152 (minimum: 5 - maximum: 343500) Hz was measured. | |||
The connection to an external monitor worked smoothly with the help of a USB hub with an HDMI port.
As is typical for IPS panels, the display has relatively stable viewing angles. Nevertheless, you will notice that the "brilliance" disappears and the picture becomes a bit duller when you look at it from narrow angles, but this hardly worsens afterwards.

Performance - Ryzen top, slowed-down RTX
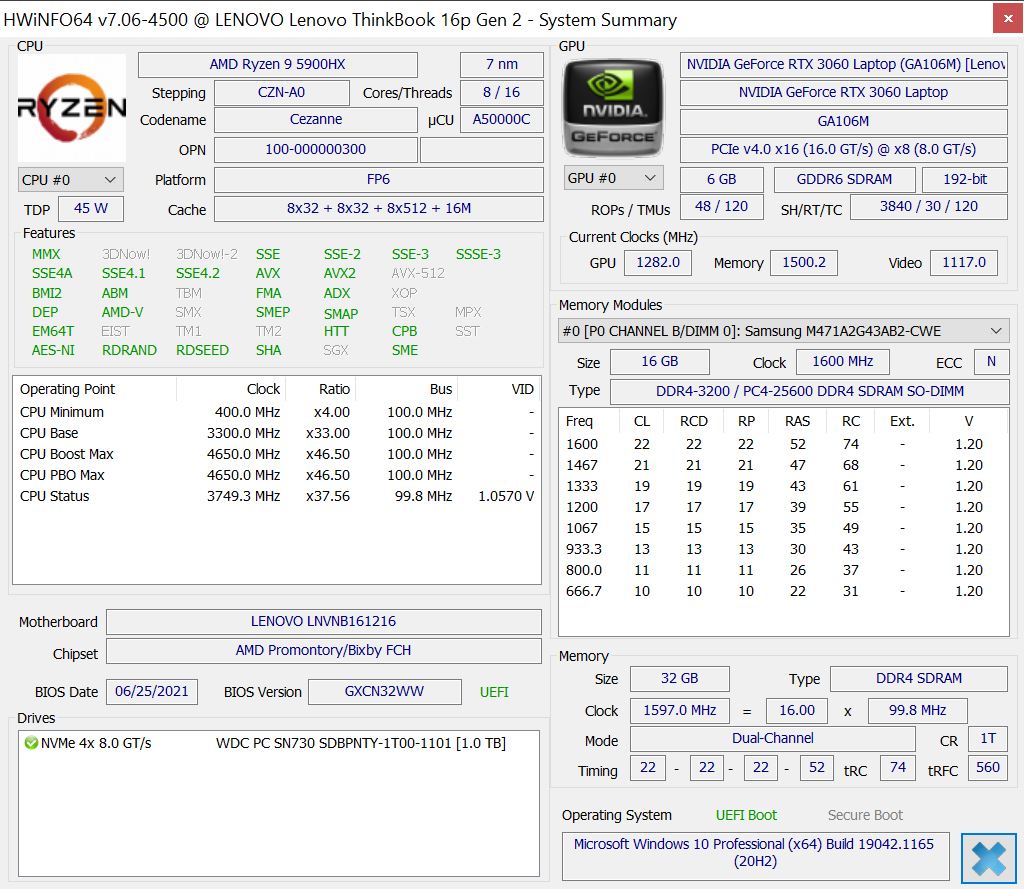
With its NVIDIA GeForce RTX 3060 laptop GPU, 32 GB of RAM, and AMD Ryzen 9 5900HX processor, the ThinkBook is too powerful for a business laptop, which is why Lenovo is trying to appeal to creators in particular. Apart from the low refresh rate and the less favorable response times of the display, the laptop could also be recommended as a gaming device, since the performance required for this should be available.
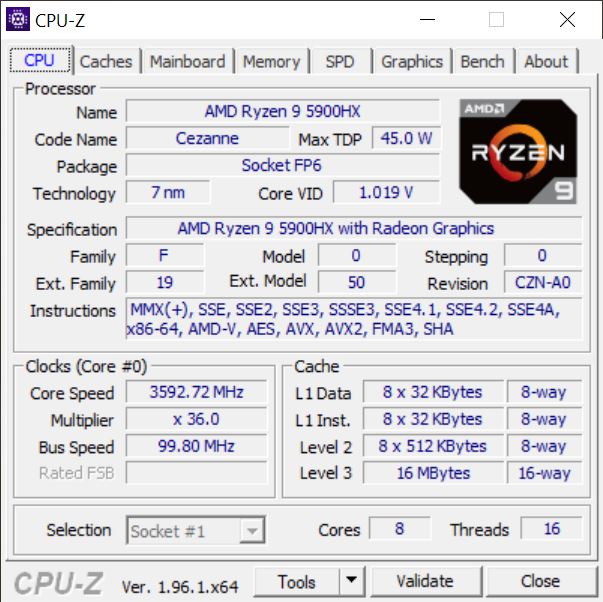
Processor
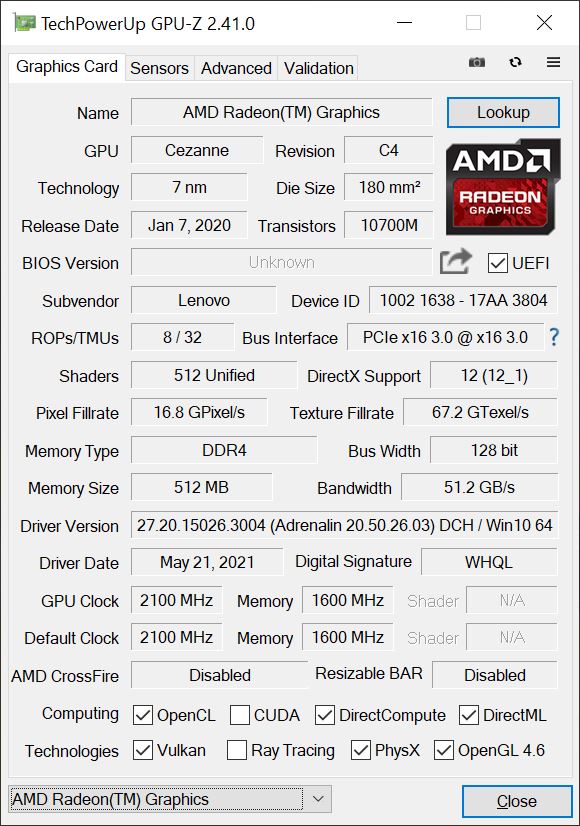
The AMD Ryzen 9 5900HX is a powerful CPU with eight cores, which reach clock speeds of up to 4.6 GHz in Turbo mode; in addition, it can process a total of 16 threads at the same time. Furthermore, the Radeon RX Vega 8 GPU is integrated into the processor.
The performance observed in our Cinebench R15 endurance test is very consistent, without the otherwise usual drop after the first few runs. The Ryzen processor clearly outperforms the Intel Core i7-11800H, which also has eight cores. While they're on par in single-thread operation, the AMD CPU has a lead of about 20% in multi-thread tests! As expected, the CPU in the ThinkBook is even slightly faster than the AMD Ryzen 7 5800H in the Alienware gaming laptop.
On battery power, the Cinebench R15 score drops to 1,444, which corresponds to a performance drop of about 33%!
Cinebench R15 Multi endurance test
Cinebench R20: CPU (Single Core) | CPU (Multi Core)
Cinebench R15: CPU Single 64Bit | CPU Multi 64Bit
Blender: v2.79 BMW27 CPU
7-Zip 18.03: 7z b 4 -mmt1 | 7z b 4
Geekbench 5.5: Single-Core | Multi-Core
HWBOT x265 Benchmark v2.2: 4k Preset
LibreOffice : 20 Documents To PDF
R Benchmark 2.5: Overall mean
| Cinebench R23 / Single Core | |
| Average of class Multimedia (1128 - 2459, n=73, last 2 years) | |
| Dell Inspiron 16 Plus 7610 | |
| Lenovo ThinkBook 16p G2 ACH | |
| Average AMD Ryzen 9 5900HX (1218 - 1499, n=29) | |
| Alienware m15 R5 Ryzen Edition | |
| Schenker XMG Core 15 Ampere | |
| Razer Blade 15 Base Edition 2021, i7-10750H RTX 3060 | |
| Lenovo ThinkBook 15p Gen1 4K | |
| Cinebench R23 / Multi Core | |
| Average of class Multimedia (4861 - 30783, n=81, last 2 years) | |
| Lenovo ThinkBook 16p G2 ACH | |
| Average AMD Ryzen 9 5900HX (6622 - 14363, n=30) | |
| Alienware m15 R5 Ryzen Edition | |
| Schenker XMG Core 15 Ampere | |
| Dell Inspiron 16 Plus 7610 | |
| Lenovo ThinkBook 15p Gen1 4K | |
| Razer Blade 15 Base Edition 2021, i7-10750H RTX 3060 | |
| Cinebench R20 / CPU (Single Core) | |
| Average of class Multimedia (420 - 853, n=63, last 2 years) | |
| Dell Inspiron 16 Plus 7610 | |
| Lenovo ThinkBook 16p G2 ACH | |
| Average AMD Ryzen 9 5900HX (471 - 584, n=29) | |
| Alienware m15 R5 Ryzen Edition | |
| Schenker XMG Core 15 Ampere | |
| Razer Blade 15 Base Edition 2021, i7-10750H RTX 3060 | |
| Lenovo ThinkBook 15p Gen1 4K | |
| Cinebench R20 / CPU (Multi Core) | |
| Average of class Multimedia (1887 - 11924, n=63, last 2 years) | |
| Lenovo ThinkBook 16p G2 ACH | |
| Average AMD Ryzen 9 5900HX (2242 - 5476, n=30) | |
| Alienware m15 R5 Ryzen Edition | |
| Schenker XMG Core 15 Ampere | |
| Dell Inspiron 16 Plus 7610 | |
| Lenovo ThinkBook 15p Gen1 4K | |
| Razer Blade 15 Base Edition 2021, i7-10750H RTX 3060 | |
| Cinebench R15 / CPU Single 64Bit | |
| Average of class Multimedia (99.6 - 323, n=66, last 2 years) | |
| Lenovo ThinkBook 16p G2 ACH | |
| Average AMD Ryzen 9 5900HX (197 - 243, n=25) | |
| Alienware m15 R5 Ryzen Edition | |
| Dell Inspiron 16 Plus 7610 | |
| Razer Blade 15 Base Edition 2021, i7-10750H RTX 3060 | |
| Lenovo ThinkBook 15p Gen1 4K | |
| Schenker XMG Core 15 Ampere | |
| Cinebench R15 / CPU Multi 64Bit | |
| Average of class Multimedia (856 - 5224, n=71, last 2 years) | |
| Lenovo ThinkBook 16p G2 ACH | |
| Average AMD Ryzen 9 5900HX (1076 - 2267, n=29) | |
| Alienware m15 R5 Ryzen Edition | |
| Schenker XMG Core 15 Ampere | |
| Dell Inspiron 16 Plus 7610 | |
| Lenovo ThinkBook 15p Gen1 4K | |
| Razer Blade 15 Base Edition 2021, i7-10750H RTX 3060 | |
| Blender / v2.79 BMW27 CPU | |
| Razer Blade 15 Base Edition 2021, i7-10750H RTX 3060 | |
| Lenovo ThinkBook 15p Gen1 4K | |
| Dell Inspiron 16 Plus 7610 | |
| Average of class Multimedia (100 - 557, n=65, last 2 years) | |
| Alienware m15 R5 Ryzen Edition | |
| Schenker XMG Core 15 Ampere | |
| Average AMD Ryzen 9 5900HX (219 - 442, n=29) | |
| Lenovo ThinkBook 16p G2 ACH | |
| 7-Zip 18.03 / 7z b 4 -mmt1 | |
| Lenovo ThinkBook 16p G2 ACH | |
| Average of class Multimedia (3666 - 7545, n=60, last 2 years) | |
| Average AMD Ryzen 9 5900HX (4791 - 5905, n=29) | |
| Alienware m15 R5 Ryzen Edition | |
| Dell Inspiron 16 Plus 7610 | |
| Razer Blade 15 Base Edition 2021, i7-10750H RTX 3060 | |
| Lenovo ThinkBook 15p Gen1 4K | |
| Schenker XMG Core 15 Ampere | |
| 7-Zip 18.03 / 7z b 4 | |
| Lenovo ThinkBook 16p G2 ACH | |
| Average of class Multimedia (29095 - 130368, n=60, last 2 years) | |
| Average AMD Ryzen 9 5900HX (36011 - 62503, n=29) | |
| Alienware m15 R5 Ryzen Edition | |
| Schenker XMG Core 15 Ampere | |
| Dell Inspiron 16 Plus 7610 | |
| Lenovo ThinkBook 15p Gen1 4K | |
| Razer Blade 15 Base Edition 2021, i7-10750H RTX 3060 | |
| Geekbench 5.5 / Single-Core | |
| Average of class Multimedia (805 - 2974, n=64, last 2 years) | |
| Lenovo ThinkBook 16p G2 ACH | |
| Average AMD Ryzen 9 5900HX (1271 - 1574, n=27) | |
| Alienware m15 R5 Ryzen Edition | |
| Razer Blade 15 Base Edition 2021, i7-10750H RTX 3060 | |
| Lenovo ThinkBook 15p Gen1 4K | |
| Schenker XMG Core 15 Ampere | |
| Geekbench 5.5 / Multi-Core | |
| Average of class Multimedia (4652 - 23059, n=64, last 2 years) | |
| Lenovo ThinkBook 16p G2 ACH | |
| Average AMD Ryzen 9 5900HX (5057 - 9294, n=27) | |
| Schenker XMG Core 15 Ampere | |
| Alienware m15 R5 Ryzen Edition | |
| Lenovo ThinkBook 15p Gen1 4K | |
| Razer Blade 15 Base Edition 2021, i7-10750H RTX 3060 | |
| HWBOT x265 Benchmark v2.2 / 4k Preset | |
| Average of class Multimedia (5.26 - 34.3, n=60, last 2 years) | |
| Lenovo ThinkBook 16p G2 ACH | |
| Average AMD Ryzen 9 5900HX (8.26 - 17.1, n=29) | |
| Alienware m15 R5 Ryzen Edition | |
| Schenker XMG Core 15 Ampere | |
| Dell Inspiron 16 Plus 7610 | |
| Lenovo ThinkBook 15p Gen1 4K | |
| Razer Blade 15 Base Edition 2021, i7-10750H RTX 3060 | |
| LibreOffice / 20 Documents To PDF | |
| Schenker XMG Core 15 Ampere | |
| Alienware m15 R5 Ryzen Edition | |
| Lenovo ThinkBook 15p Gen1 4K | |
| Lenovo ThinkBook 16p G2 ACH | |
| Average AMD Ryzen 9 5900HX (44.1 - 87.4, n=29) | |
| Average of class Multimedia (23.9 - 146.7, n=61, last 2 years) | |
| Razer Blade 15 Base Edition 2021, i7-10750H RTX 3060 | |
| Dell Inspiron 16 Plus 7610 | |
| R Benchmark 2.5 / Overall mean | |
| Razer Blade 15 Base Edition 2021, i7-10750H RTX 3060 | |
| Lenovo ThinkBook 15p Gen1 4K | |
| Schenker XMG Core 15 Ampere | |
| Dell Inspiron 16 Plus 7610 | |
| Alienware m15 R5 Ryzen Edition | |
| Average AMD Ryzen 9 5900HX (0.48 - 0.599, n=29) | |
| Lenovo ThinkBook 16p G2 ACH | |
| Average of class Multimedia (0.3604 - 0.947, n=60, last 2 years) | |
* ... smaller is better
System performance
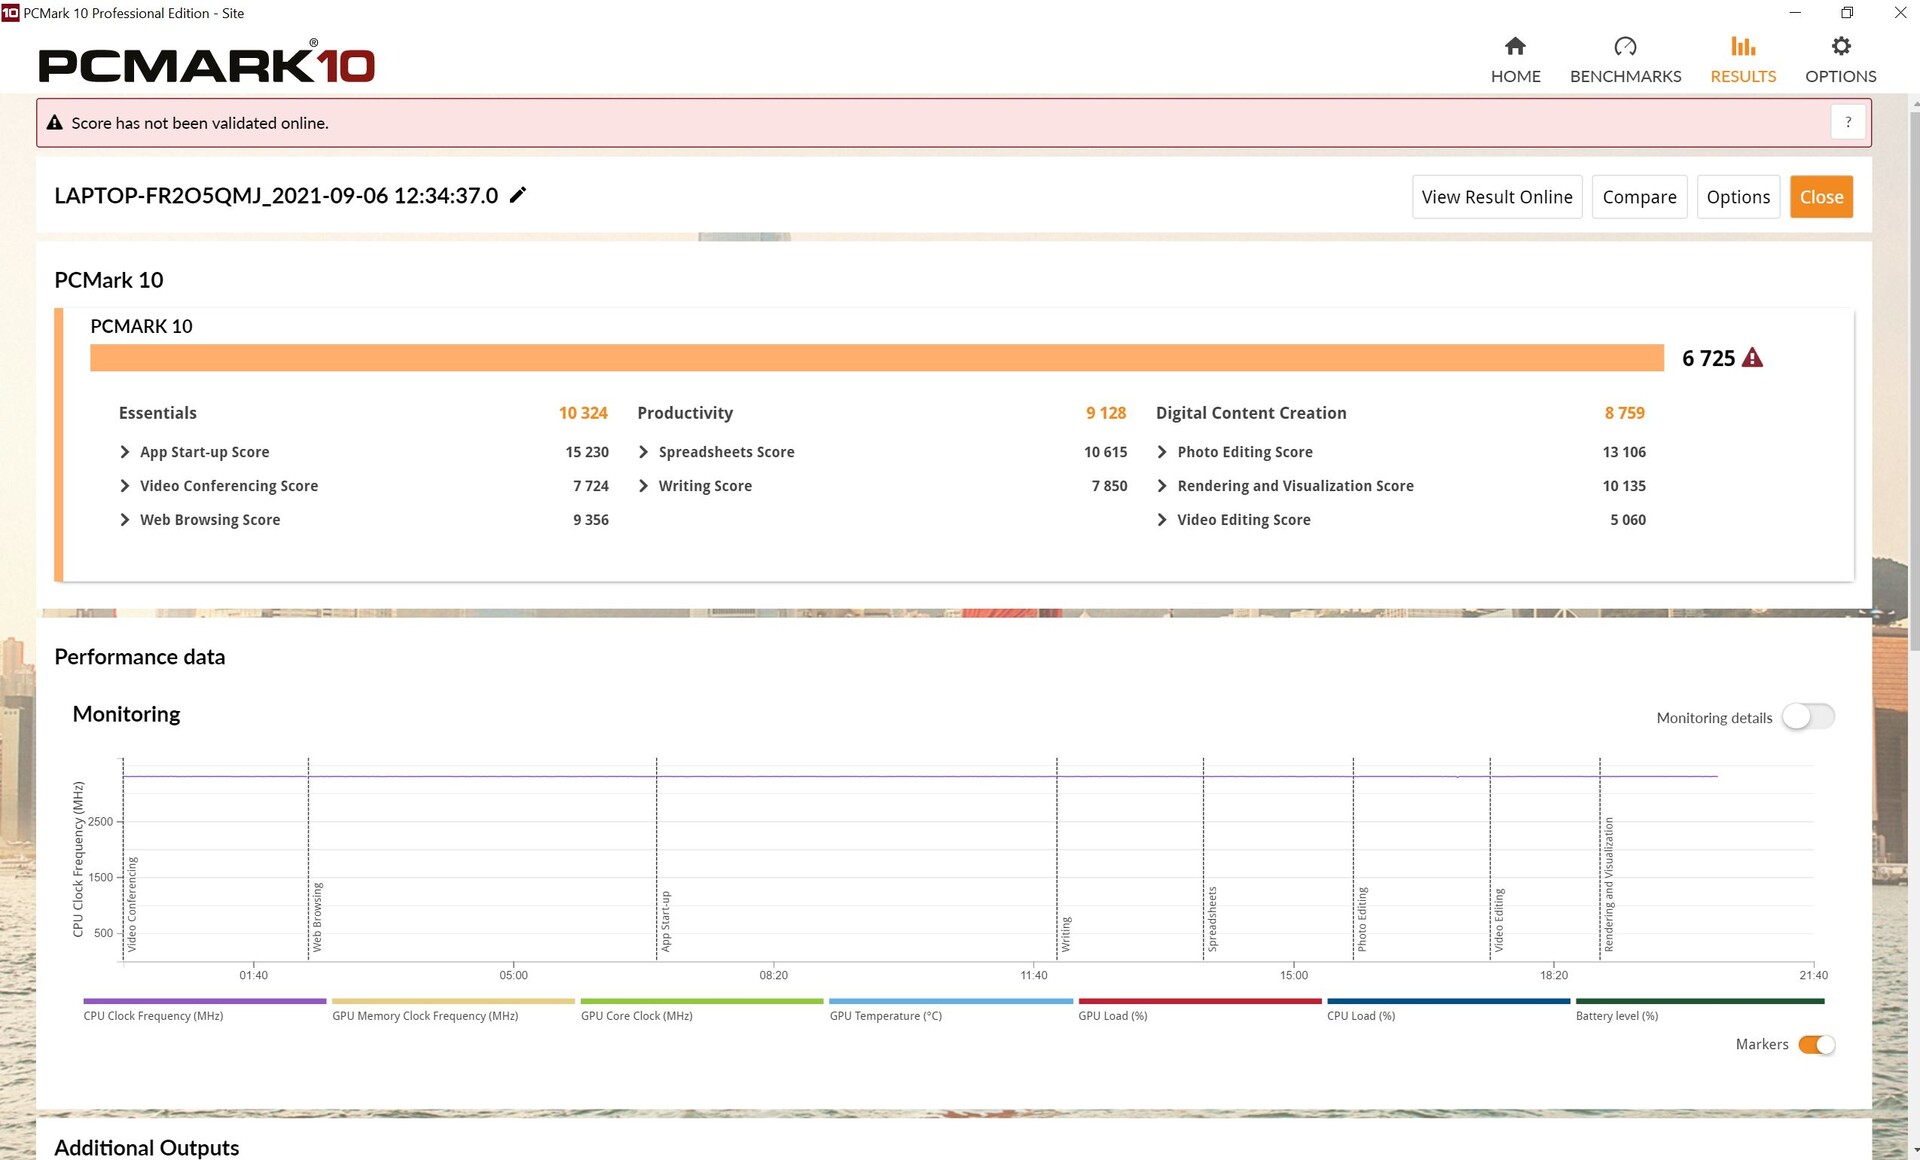
In PCMark 10, the 16p takes the lead in all the subtests, and the difference to the Comet Lake-powered 15p is especially noticeable. The rest of the competition is usually a few percentage points behind our test model.
| PCMark 10 / Score | |
| Average of class Multimedia (4325 - 8670, n=54, last 2 years) | |
| Lenovo ThinkBook 16p G2 ACH | |
| Average AMD Ryzen 9 5900HX, NVIDIA GeForce RTX 3060 Laptop GPU (6505 - 6725, n=2) | |
| Alienware m15 R5 Ryzen Edition | |
| Razer Blade 15 Base Edition 2021, i7-10750H RTX 3060 | |
| Dell Inspiron 16 Plus 7610 | |
| Schenker XMG Core 15 Ampere | |
| Lenovo ThinkBook 15p Gen1 4K | |
| PCMark 10 / Essentials | |
| Average of class Multimedia (8025 - 12420, n=54, last 2 years) | |
| Lenovo ThinkBook 16p G2 ACH | |
| Razer Blade 15 Base Edition 2021, i7-10750H RTX 3060 | |
| Average AMD Ryzen 9 5900HX, NVIDIA GeForce RTX 3060 Laptop GPU (9827 - 10324, n=2) | |
| Dell Inspiron 16 Plus 7610 | |
| Alienware m15 R5 Ryzen Edition | |
| Schenker XMG Core 15 Ampere | |
| Lenovo ThinkBook 15p Gen1 4K | |
| PCMark 10 / Productivity | |
| Lenovo ThinkBook 16p G2 ACH | |
| Average of class Multimedia (6763 - 10615, n=54, last 2 years) | |
| Average AMD Ryzen 9 5900HX, NVIDIA GeForce RTX 3060 Laptop GPU (8803 - 9128, n=2) | |
| Alienware m15 R5 Ryzen Edition | |
| Dell Inspiron 16 Plus 7610 | |
| Razer Blade 15 Base Edition 2021, i7-10750H RTX 3060 | |
| Schenker XMG Core 15 Ampere | |
| Lenovo ThinkBook 15p Gen1 4K | |
| PCMark 10 / Digital Content Creation | |
| Average of class Multimedia (3651 - 15438, n=54, last 2 years) | |
| Lenovo ThinkBook 16p G2 ACH | |
| Average AMD Ryzen 9 5900HX, NVIDIA GeForce RTX 3060 Laptop GPU (8634 - 8759, n=2) | |
| Alienware m15 R5 Ryzen Edition | |
| Schenker XMG Core 15 Ampere | |
| Razer Blade 15 Base Edition 2021, i7-10750H RTX 3060 | |
| Dell Inspiron 16 Plus 7610 | |
| Lenovo ThinkBook 15p Gen1 4K | |
| PCMark 10 Score | 6725 points | |
Help | ||
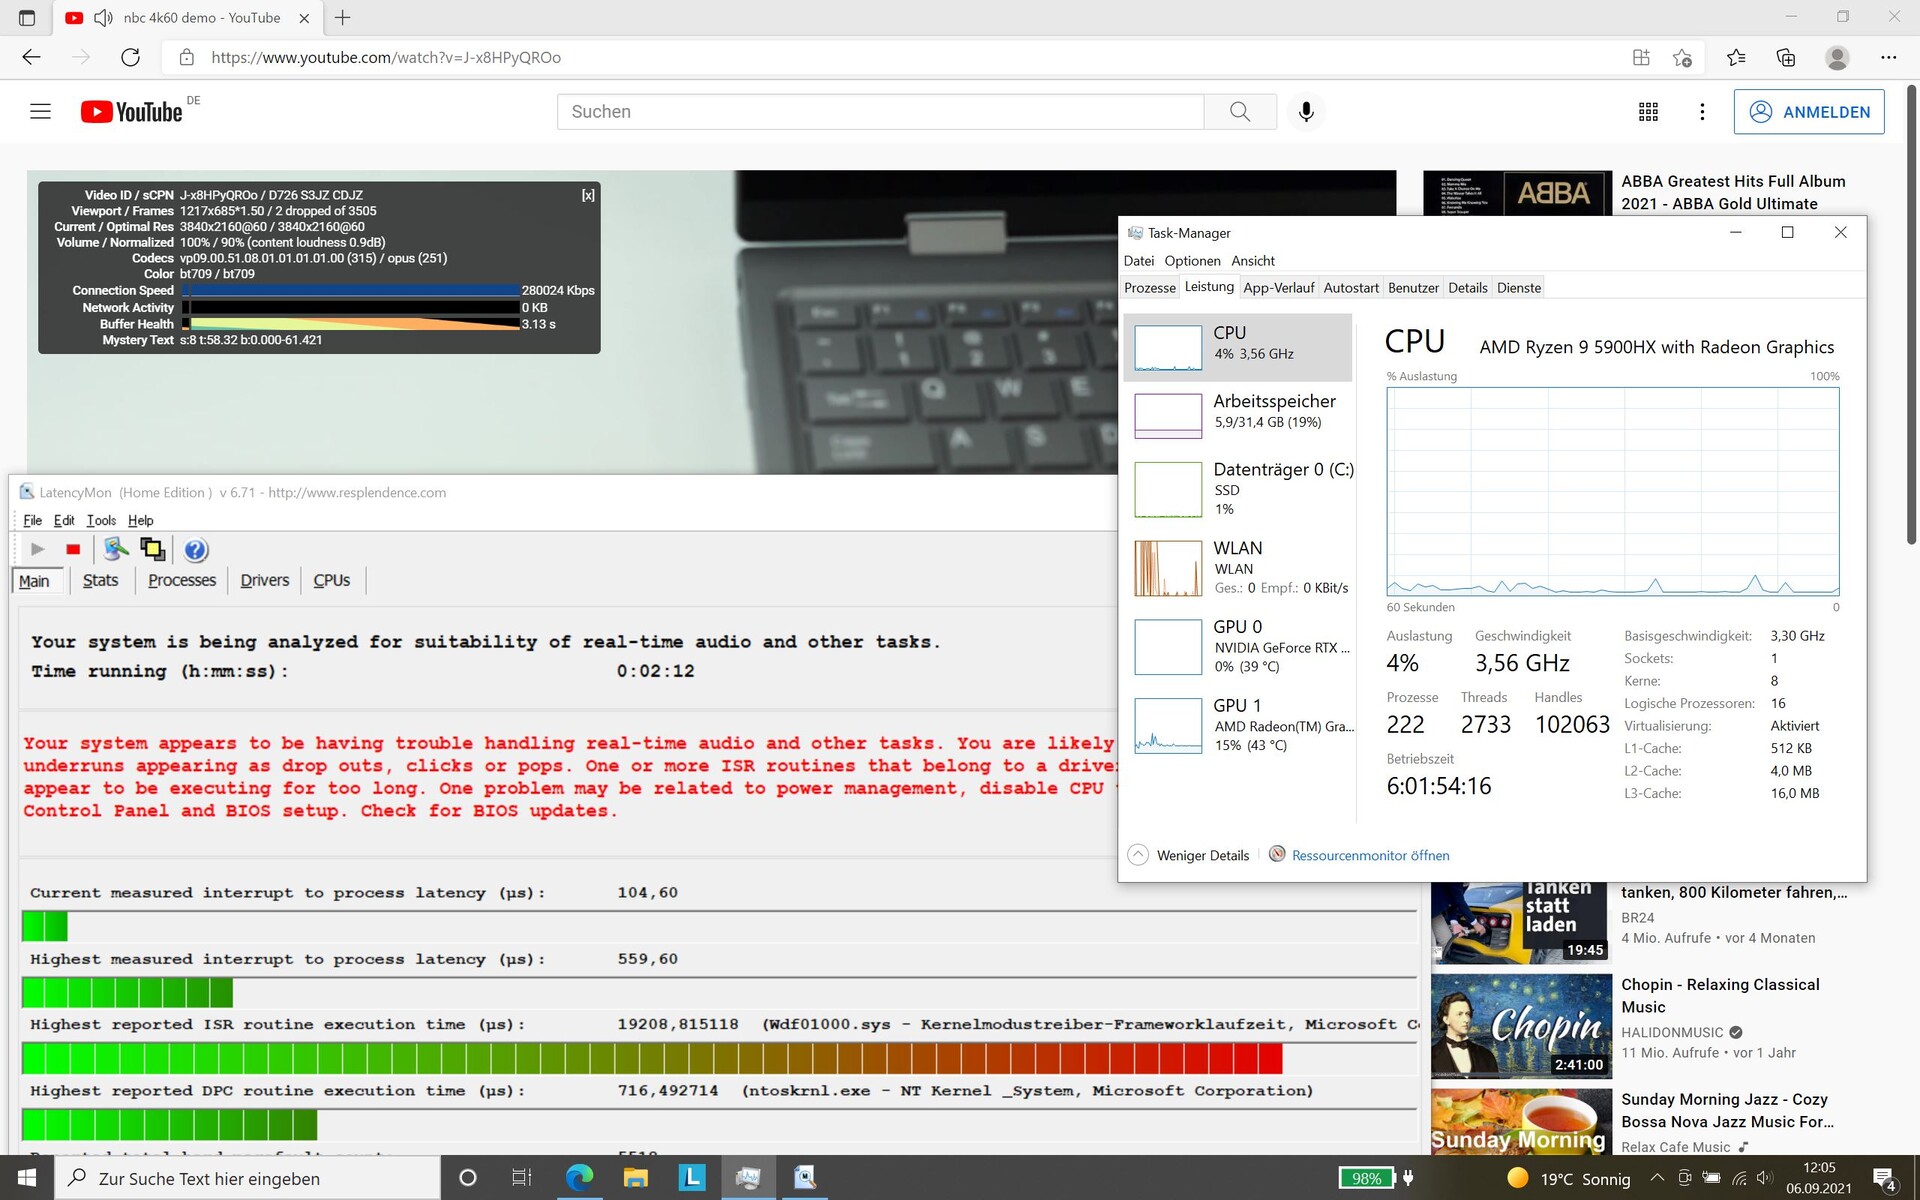
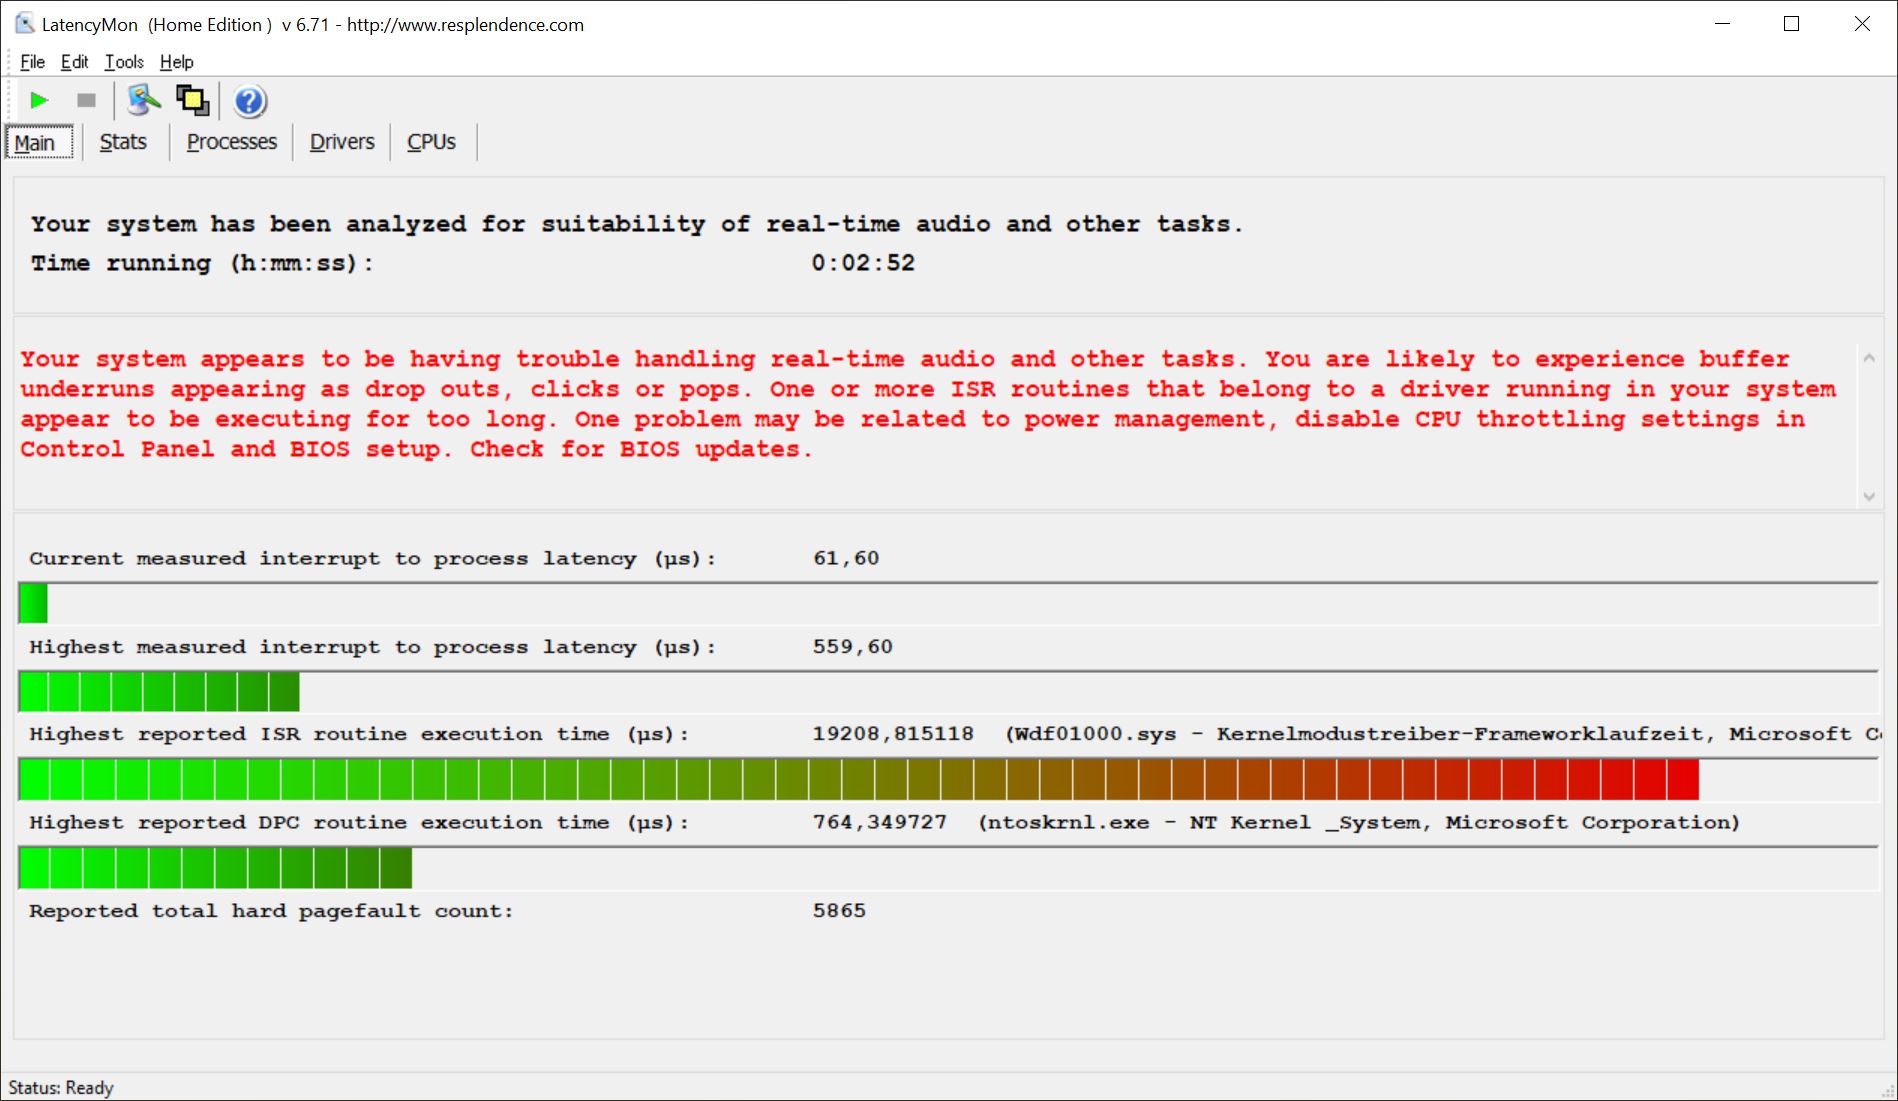
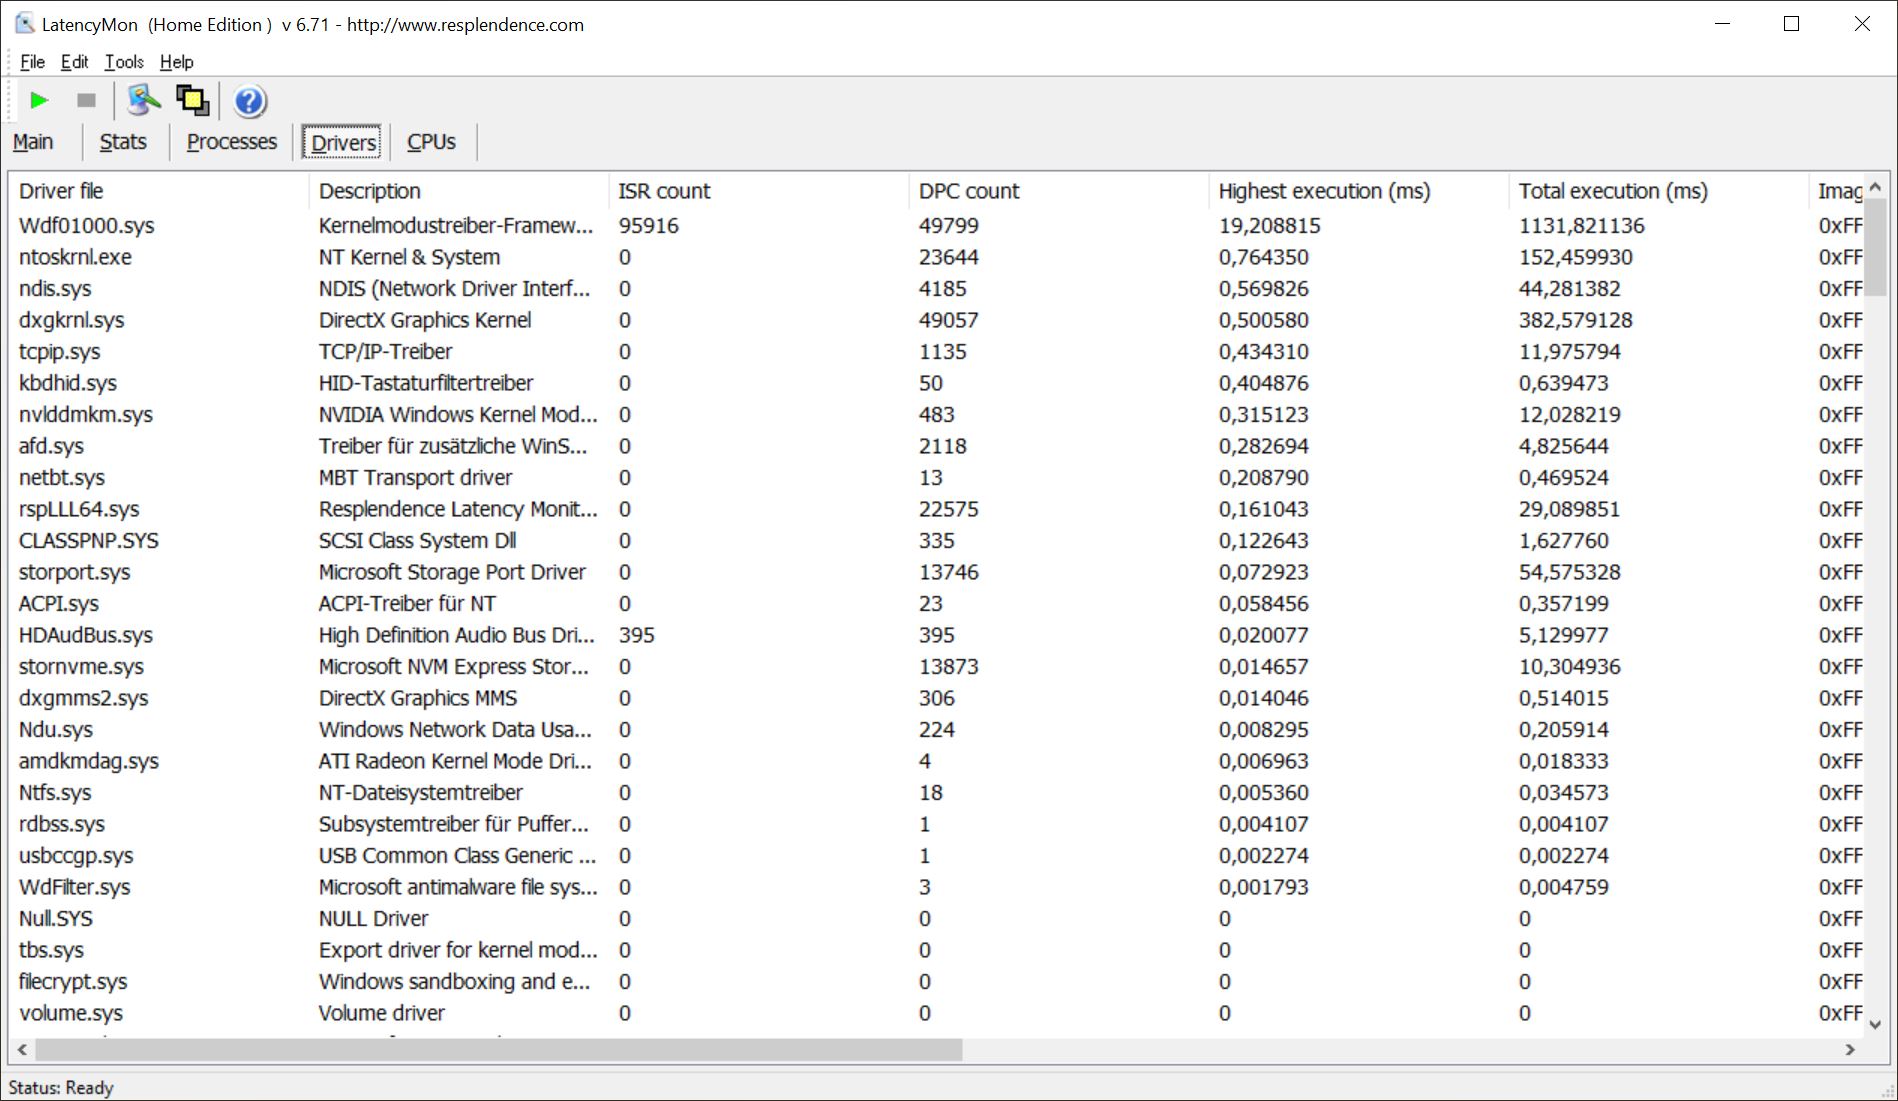
DPC latencies
The ThinkBook doesn't have any problems with multiple browser tabs, but it does struggle with playing our 4K/60 fps test video on YouTube, which it reproduces with two dropped frames. The LatencyMon tool also reveals that there are problems with real-time audio playback. Once again, the main culprit is the Kernel Mode Driver Framework Runtime.
| DPC Latencies / LatencyMon - interrupt to process latency (max), Web, Youtube, Prime95 | |
| Dell Inspiron 16 Plus 7610 | |
| Lenovo ThinkBook 15p Gen1 4K | |
| Razer Blade 15 Base Edition 2021, i7-10750H RTX 3060 | |
| Lenovo ThinkBook 16p G2 ACH | |
| Schenker XMG Core 15 Ampere | |
| Alienware m15 R5 Ryzen Edition | |
* ... smaller is better
Storage
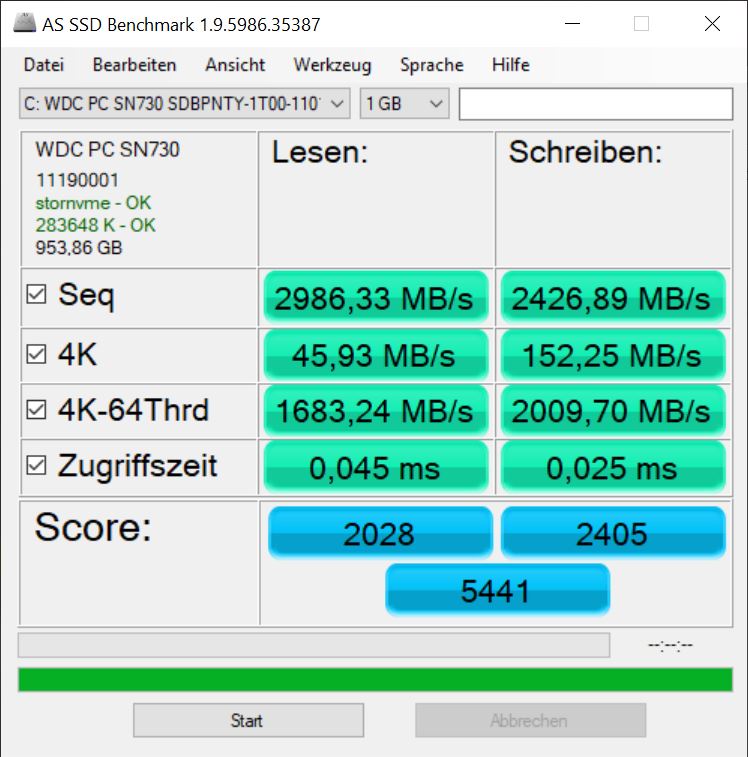
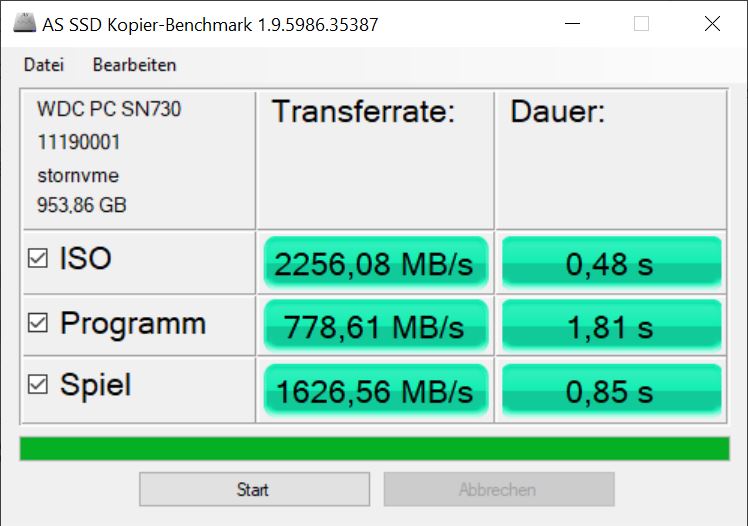
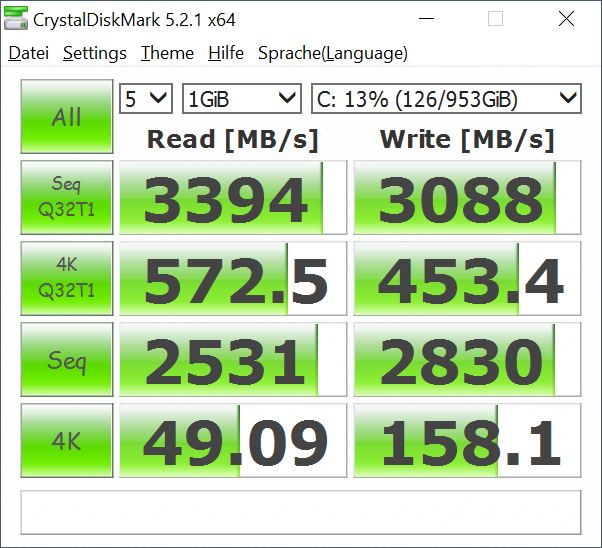
Lenovo installs a 1 TB NVMe SSD from Western Digital that ranks 28th in our SSD/HDD Benchmarks article. The built-in SSD is even about 10% faster than the same model in the ThinkBook 15p. Most competitors can be outperformed, and only the SSD in the Schenker XMG Core 15 is marginally faster.
| Lenovo ThinkBook 16p G2 ACH WDC PC SN730 SDBPNTY-1T00 | Lenovo ThinkBook 15p Gen1 4K WDC PC SN730 SDBPNTY-1T00 | Dell Inspiron 16 Plus 7610 Kingston OM3PDP3512B | Razer Blade 15 Base Edition 2021, i7-10750H RTX 3060 Samsung SSD PM981a MZVLB512HBJQ | Alienware m15 R5 Ryzen Edition Toshiba KBG40ZNS512G NVMe | Schenker XMG Core 15 Ampere Samsung SSD 970 EVO Plus 1TB | Average WDC PC SN730 SDBPNTY-1T00 | |
|---|---|---|---|---|---|---|---|
| CrystalDiskMark 5.2 / 6 | -9% | -23% | -10% | -26% | 2% | -10% | |
| Write 4K (MB/s) | 158.1 | 150.8 -5% | 176.8 12% | 123.8 -22% | 116.9 -26% | 139.1 -12% | 139.9 ? -12% |
| Read 4K (MB/s) | 49.09 | 43.01 -12% | 52.3 7% | 45.53 -7% | 44.56 -9% | 47.59 -3% | 44.5 ? -9% |
| Write Seq (MB/s) | 2830 | 2846 1% | 1170 -59% | 2132 -25% | 1552 -45% | 2917 3% | 2346 ? -17% |
| Read Seq (MB/s) | 2531 | 2366 -7% | 1557 -38% | 2067 -18% | 1682 -34% | 2586 2% | 2102 ? -17% |
| Write 4K Q32T1 (MB/s) | 453.4 | 450 -1% | 471.5 4% | 462.9 2% | 497.8 10% | 511 13% | 442 ? -3% |
| Read 4K Q32T1 (MB/s) | 573 | 295.5 -48% | 437.9 -24% | 553 -3% | 436.8 -24% | 571 0% | 460 ? -20% |
| Write Seq Q32T1 (MB/s) | 3088 | 3079 0% | 1214 -61% | 2955 -4% | 1461 -53% | 3263 6% | 3049 ? -1% |
| Read Seq Q32T1 (MB/s) | 3394 | 3433 1% | 2549 -25% | 3246 -4% | 2364 -30% | 3567 5% | 3285 ? -3% |
| AS SSD | -15% | -43% | -35% | -83% | 4% | -27% | |
| Seq Read (MB/s) | 2986 | 2852 -4% | 2077 -30% | 2401 -20% | 2082 -30% | 2829 -5% | 2606 ? -13% |
| Seq Write (MB/s) | 2426 | 2344 -3% | 778 -68% | 2087 -14% | 825 -66% | 2646 9% | 1935 ? -20% |
| 4K Read (MB/s) | 45.93 | 37.3 -19% | 49.6 8% | 49.58 8% | 42.41 -8% | 54.8 19% | 42.9 ? -7% |
| 4K Write (MB/s) | 152.3 | 79.6 -48% | 236.1 55% | 98.8 -35% | 98.3 -35% | 179.1 18% | 129.1 ? -15% |
| 4K-64 Read (MB/s) | 1683 | 1500 -11% | 801 -52% | 1601 -5% | 1255 -25% | 1734 3% | 1361 ? -19% |
| 4K-64 Write (MB/s) | 2010 | 2055 2% | 942 -53% | 1862 -7% | 738 -63% | 2396 19% | 1920 ? -4% |
| Access Time Read * (ms) | 0.045 | 0.053 -18% | 0.06 -33% | 0.06 -33% | 0.109 -142% | 0.033 27% | 0.0689 ? -53% |
| Access Time Write * (ms) | 0.025 | 0.033 -32% | 0.073 -192% | 0.11 -340% | 0.17 -580% | 0.021 16% | 0.06215 ? -149% |
| Score Read (Points) | 2028 | 1822 -10% | 1059 -48% | 1890 -7% | 1506 -26% | 2072 2% | 1664 ? -18% |
| Score Write (Points) | 2405 | 2369 -1% | 1256 -48% | 2170 -10% | 918 -62% | 2839 18% | 2242 ? -7% |
| Score Total (Points) | 5441 | 5095 -6% | 2804 -48% | 5015 -8% | 3136 -42% | 5965 10% | 4726 ? -13% |
| Copy ISO MB/s (MB/s) | 2256 | 2071 -8% | 1028 -54% | 2206 -2% | 1391 -38% | 2119 -6% | 2041 ? -10% |
| Copy Program MB/s (MB/s) | 779 | 605 -22% | 794 2% | 694 -11% | 645 -17% | 406.1 -48% | 552 ? -29% |
| Copy Game MB/s (MB/s) | 1627 | 1131 -30% | 987 -39% | 1555 -4% | 1101 -32% | 1086 -33% | 1183 ? -27% |
| Total Average (Program / Settings) | -12% /
-13% | -33% /
-36% | -23% /
-26% | -55% /
-63% | 3% /
3% | -19% /
-21% |
* ... smaller is better

Continuous load read: DiskSpd Read Loop, Queue Depth 8
Graphics card
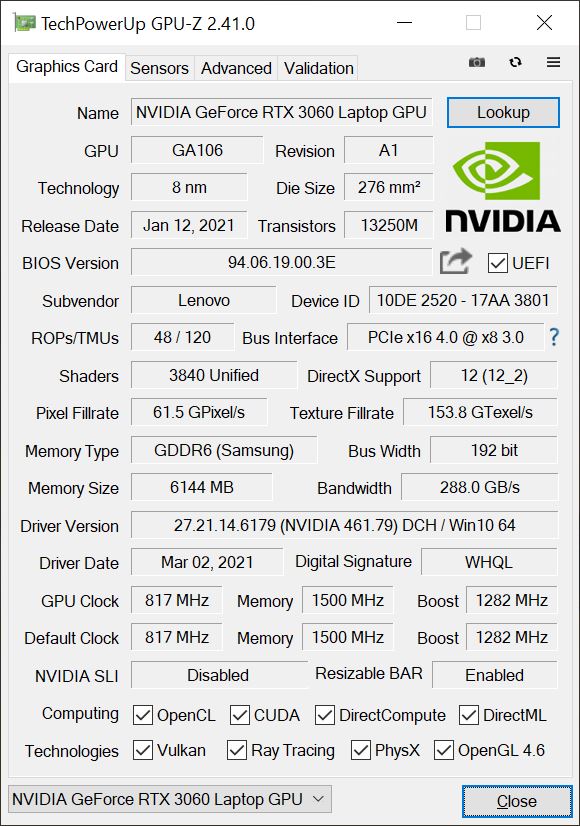
Depending on the configuration, the ThinkBook 16p comes either with the Radeon RX Vega 8 that is integrated into the CPU or with the much more powerful NVIDIA GeForce RTX 3060 laptop GPU. Unfortunately, Lenovo doesn't specify the TGP used by the RTX 3060 on its product page - a no-go for a manufacturer when it comes to such an important performance value.
Elsewhere, the TGP is said to be 75 watts. This value can be between 60 and 115 watts in an RTX 3060, so it's rather low in our test model. As a result, it performs slightly below an average RTX 3060 from our database in the 3DMark tests. The gaming competition is more powerful here, but the Dell Inspiron 16 Plus 7610 with the RTX 3050 is usually another 20% to 30% behind our ThinkBook.
On battery power, the GPU performance drops very sharply. Instead of the initial 24,689 points, we only measure 6,900 GPU points in 3DMark 11, which represents a decline of over 70%!
| 3DMark 11 Performance | 21986 points | |
| 3DMark Cloud Gate Standard Score | 42348 points | |
| 3DMark Fire Strike Score | 16883 points | |
| 3DMark Time Spy Score | 7634 points | |
Help | ||
Gaming performance
When gaming, it should be noted that using the 16:10 aspect ratio with standard 16:9 resolutions, such as Full HD, results in the image being stretched, and with it, all the figures and objects in the game.
The result from the 3DMark tests is confirmed in The Witcher 3: The higher the resolution and the detail level, the bigger the differences to the gaming competition. Overall, the RTX 3060 only performs marginally below the expected level, but the gaming laptops of the competition usually do considerably better.
In addition, the native resolution is above Full HD, which puts a lot of strain on the GPU. Nevertheless, the 16p manages about 53 fps when playing The Witcher 3 at the native resolution; it also reaches 67 fps in Far Cry 5 at the native resolution and Ultra settings. In Shadow of the Tomb Raider, 58 fps can be achieved.
Even over the course of an hour, the observed frame rates during The Witcher 3 are quite stable and only drop marginally.
The Witcher 3 FPS diagram
| low | med. | high | ultra | |
|---|---|---|---|---|
| GTA V (2015) | 178 | 149 | 87.3 | |
| The Witcher 3 (2015) | 313 | 132 | 73 | |
| Dota 2 Reborn (2015) | 152 | 146 | 129 | 121 |
| X-Plane 11.11 (2018) | 103 | 88.6 | 74 | |
| Far Cry 5 (2018) | 114 | 98 | 95 | 90 |
| Strange Brigade (2018) | 292 | 169 | 142 | 125 |
| Shadow of the Tomb Raider (2018) | 137 | 107 | 101 | 91 |
Emissions - Unobtrusive Lenovo ThinkBook
Noise emissions
The noise development of the ThinkBook 16p is at the expected level. One good thing is that the system usually doesn't activate the fans in idle usage, and silence prevails as a result. Under load, it remains quieter than its gaming competitors with more powerful GPUs; the Dell Inspiron doesn't run any quieter despite its weaker GPU.
The fans themselves are a bit too high-pitched for our taste, but the annoyance factor remains within limits.
Noise level
| Idle |
| 23 / 23 / 23 dB(A) |
| Load |
| 35.66 / 48.13 dB(A) |
 | ||
30 dB silent 40 dB(A) audible 50 dB(A) loud |
||
min: | ||
| Lenovo ThinkBook 16p G2 ACH GeForce RTX 3060 Laptop GPU, R9 5900HX, WDC PC SN730 SDBPNTY-1T00 | Lenovo ThinkBook 15p Gen1 4K GeForce GTX 1650 Ti Max-Q, i7-10750H, WDC PC SN730 SDBPNTY-1T00 | Dell Inspiron 16 Plus 7610 GeForce RTX 3050 4GB Laptop GPU, i7-11800H, Kingston OM3PDP3512B | Razer Blade 15 Base Edition 2021, i7-10750H RTX 3060 GeForce RTX 3060 Laptop GPU, i7-10750H, Samsung SSD PM981a MZVLB512HBJQ | Alienware m15 R5 Ryzen Edition GeForce RTX 3060 Laptop GPU, R7 5800H, Toshiba KBG40ZNS512G NVMe | Schenker XMG Core 15 Ampere GeForce RTX 3060 Laptop GPU, R7 4800H, Samsung SSD 970 EVO Plus 1TB | |
|---|---|---|---|---|---|---|
| Noise | -12% | -9% | -8% | -14% | -14% | |
| off / environment * (dB) | 23 | 28.7 -25% | 24.4 -6% | 25.3 -10% | 24 -4% | 24 -4% |
| Idle Minimum * (dB) | 23 | 28.7 -25% | 24.4 -6% | 25.4 -10% | 24 -4% | 26 -13% |
| Idle Average * (dB) | 23 | 28.7 -25% | 24.4 -6% | 25.4 -10% | 25 -9% | 28 -22% |
| Idle Maximum * (dB) | 23 | 28.7 -25% | 24.4 -6% | 25.4 -10% | 35 -52% | 30 -30% |
| Load Average * (dB) | 35.66 | 34.8 2% | 48.3 -35% | 42.5 -19% | 44 -23% | 42 -18% |
| Witcher 3 ultra * (dB) | 48.7 | 43.6 10% | 48.9 -0% | 42 14% | 48 1% | 50 -3% |
| Load Maximum * (dB) | 48.13 | 45.6 5% | 48.9 -2% | 52.2 -8% | 50 -4% | 52 -8% |
* ... smaller is better
Temperature
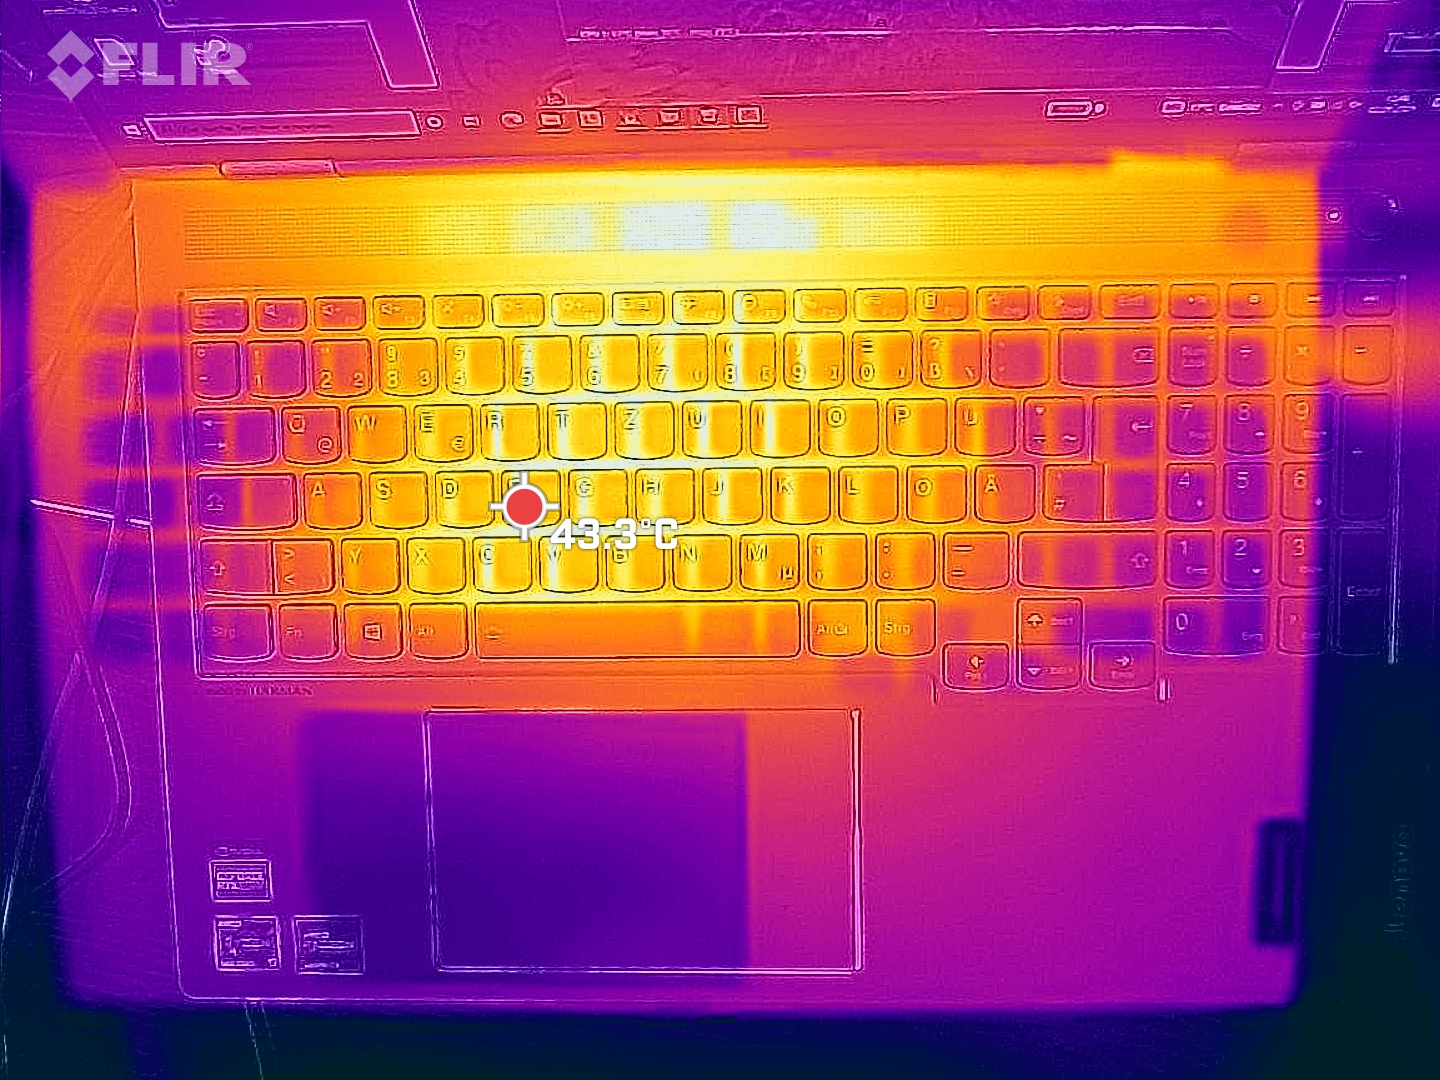
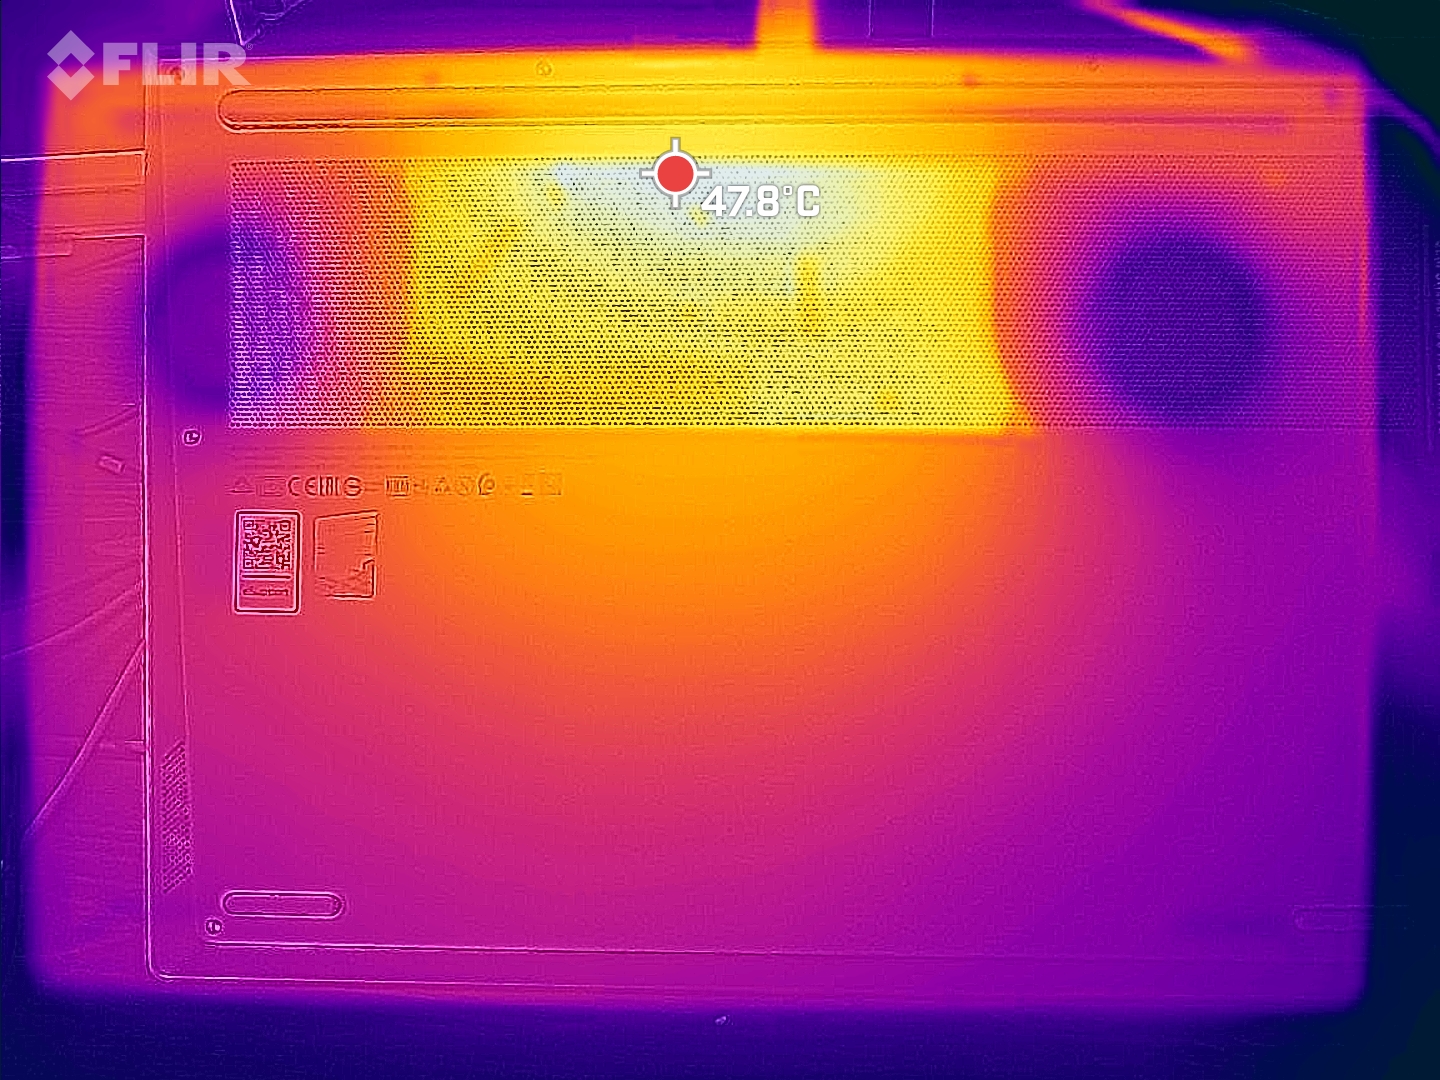
There are hot spots in the center towards the display, where temperatures of 50 °C (~122 °F) (top) to 53 °C (~127 °F) (bottom) can be reached in the stress test or in our The Witcher 3 test. The palm rest area remains comparatively cool at just over 30 °C (~86 °F), but the WASD keys can reach temperatures of up to 45 °C (~113 °F). The Razer Blade remains slightly cooler under load, and the Alienware gets significantly hotter; otherwise, the competitors are closely aligned here.
(-) The maximum temperature on the upper side is 50 °C / 122 F, compared to the average of 36.9 °C / 98 F, ranging from 21.1 to 71 °C for the class Multimedia.
(-) The bottom heats up to a maximum of 53 °C / 127 F, compared to the average of 39.2 °C / 103 F
(+) In idle usage, the average temperature for the upper side is 28.1 °C / 83 F, compared to the device average of 31.3 °C / 88 F.
(-) Playing The Witcher 3, the average temperature for the upper side is 40.6 °C / 105 F, compared to the device average of 31.3 °C / 88 F.
(+) The palmrests and touchpad are reaching skin temperature as a maximum (34 °C / 93.2 F) and are therefore not hot.
(-) The average temperature of the palmrest area of similar devices was 28.7 °C / 83.7 F (-5.3 °C / -9.5 F).
| Lenovo ThinkBook 16p G2 ACH GeForce RTX 3060 Laptop GPU, R9 5900HX, WDC PC SN730 SDBPNTY-1T00 | Lenovo ThinkBook 15p Gen1 4K GeForce GTX 1650 Ti Max-Q, i7-10750H, WDC PC SN730 SDBPNTY-1T00 | Dell Inspiron 16 Plus 7610 GeForce RTX 3050 4GB Laptop GPU, i7-11800H, Kingston OM3PDP3512B | Razer Blade 15 Base Edition 2021, i7-10750H RTX 3060 GeForce RTX 3060 Laptop GPU, i7-10750H, Samsung SSD PM981a MZVLB512HBJQ | Alienware m15 R5 Ryzen Edition GeForce RTX 3060 Laptop GPU, R7 5800H, Toshiba KBG40ZNS512G NVMe | Schenker XMG Core 15 Ampere GeForce RTX 3060 Laptop GPU, R7 4800H, Samsung SSD 970 EVO Plus 1TB | |
|---|---|---|---|---|---|---|
| Heat | 19% | -7% | -6% | -18% | 3% | |
| Maximum Upper Side * (°C) | 50 | 41.2 18% | 46.4 7% | 45.2 10% | 62 -24% | 48 4% |
| Maximum Bottom * (°C) | 53 | 47 11% | 54.8 -3% | 48 9% | 61 -15% | 50 6% |
| Idle Upper Side * (°C) | 29 | 22.6 22% | 31.4 -8% | 34.4 -19% | 36 -24% | 28 3% |
| Idle Bottom * (°C) | 30 | 23.1 23% | 36.6 -22% | 37.2 -24% | 33 -10% | 31 -3% |
* ... smaller is better
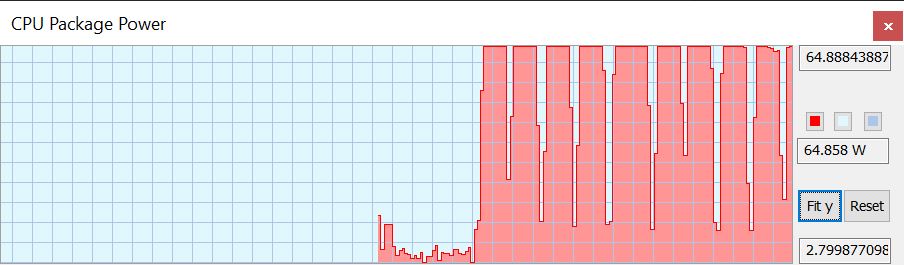
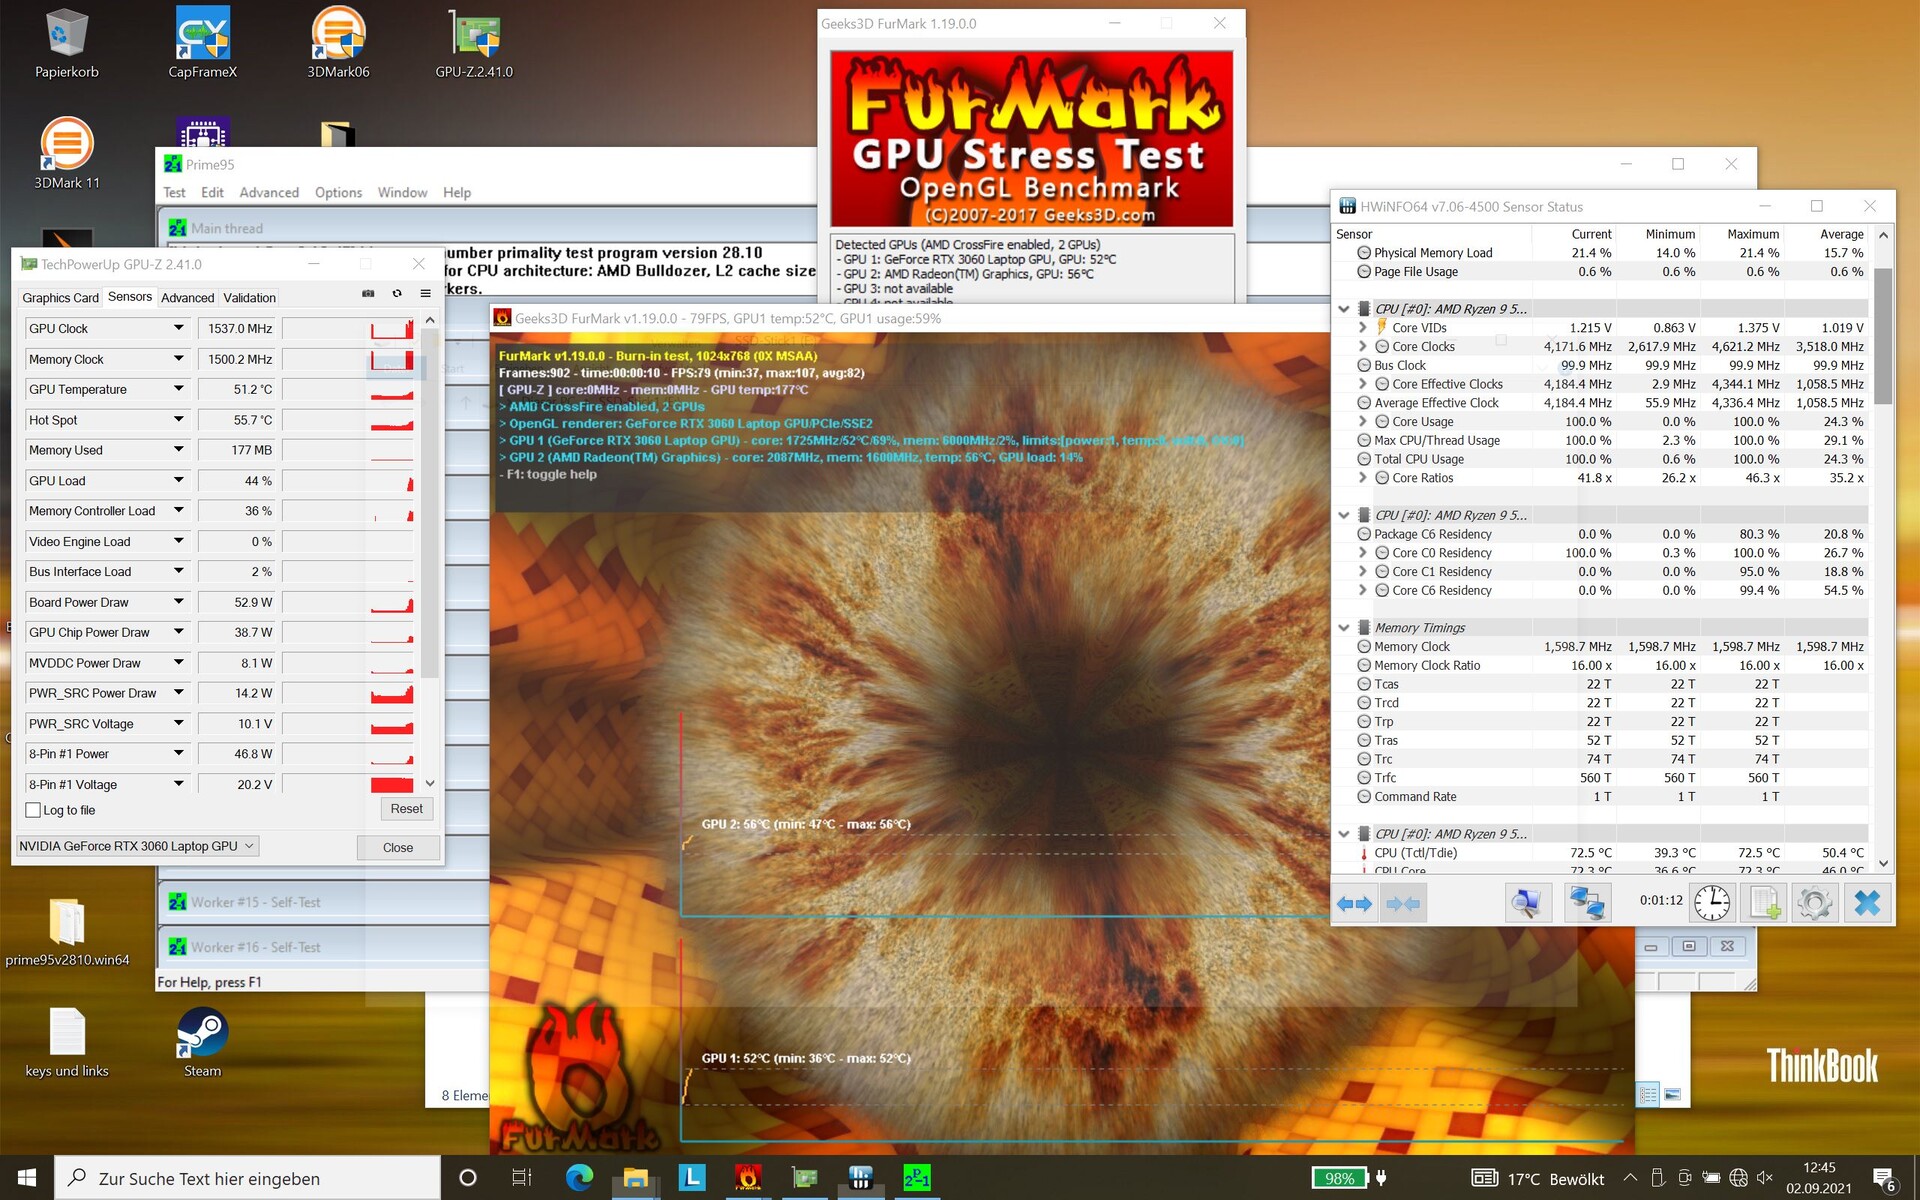
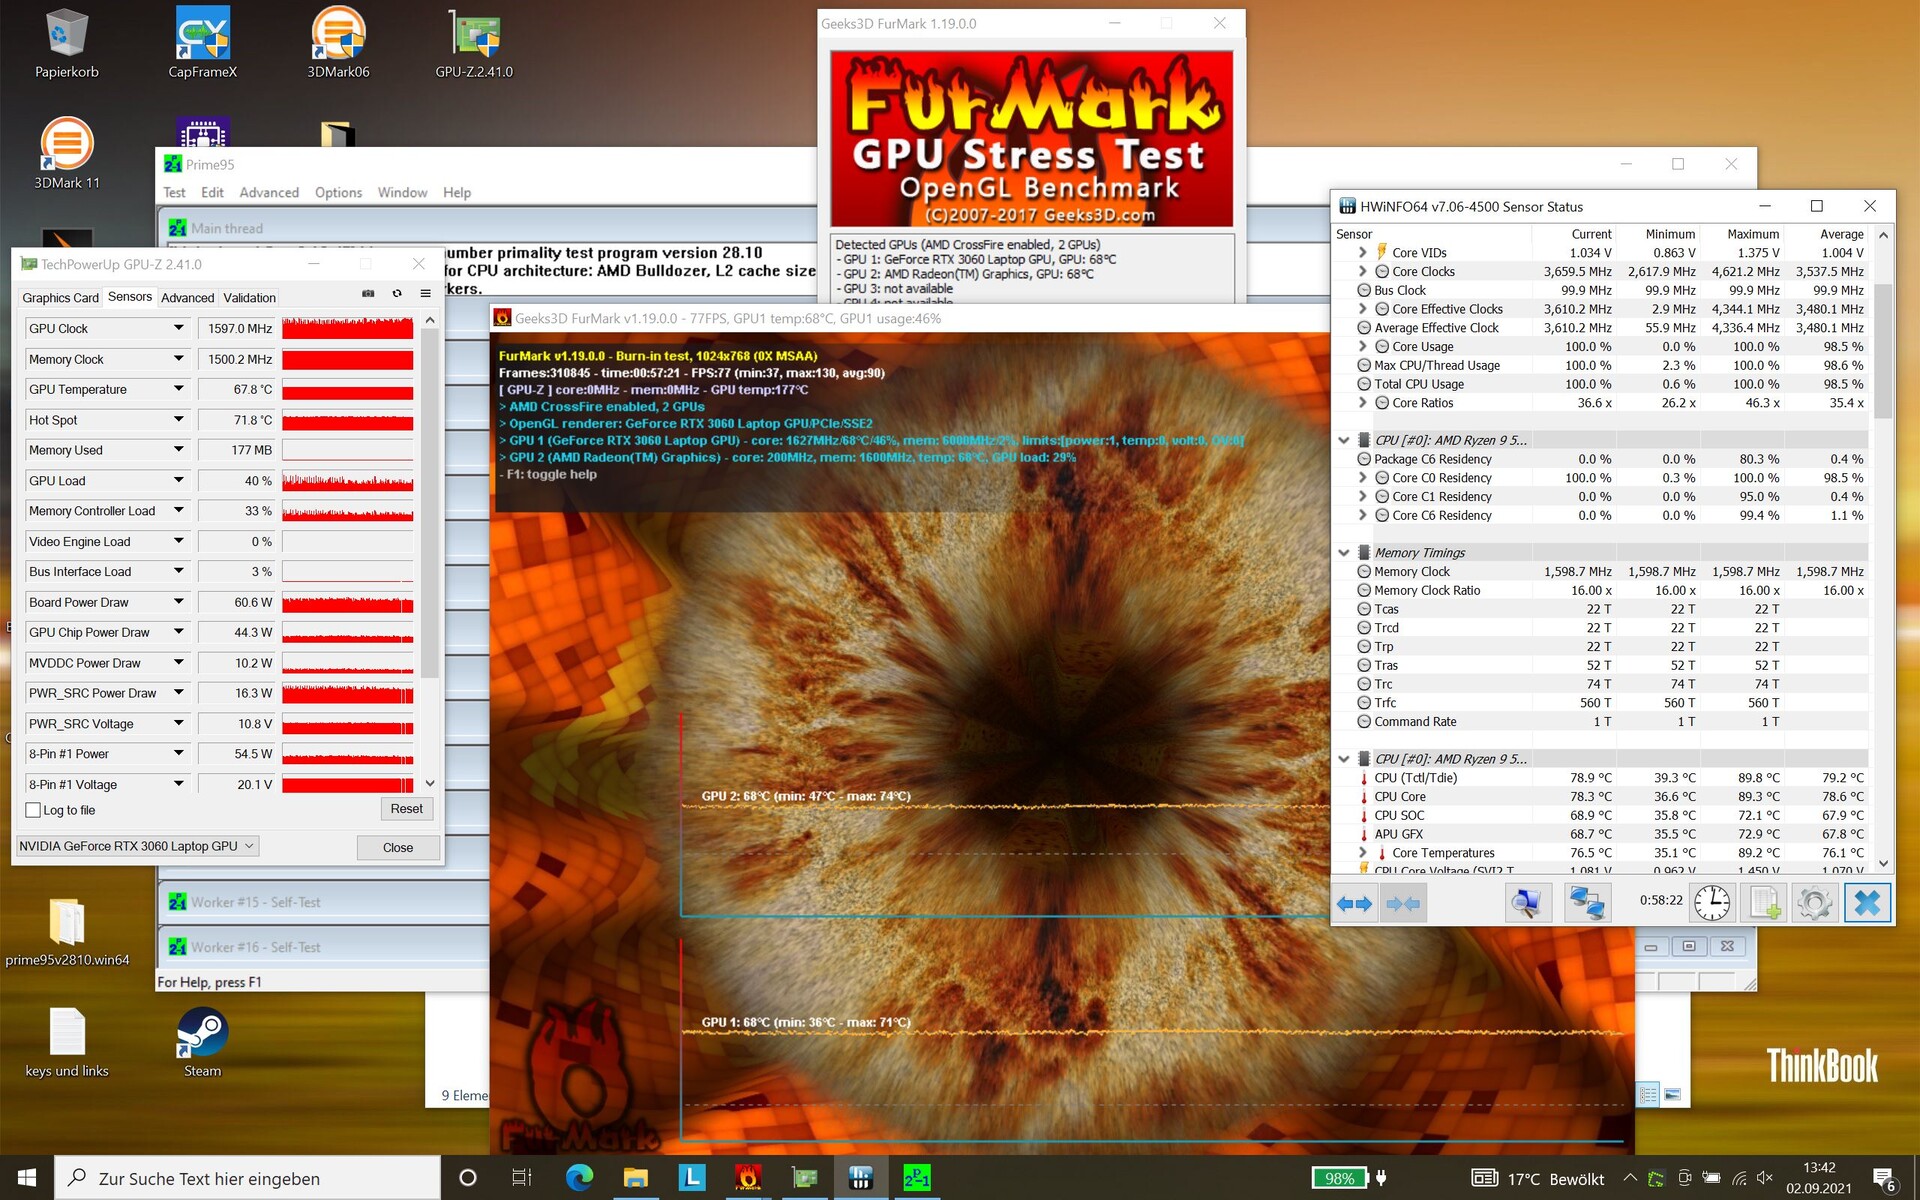
The CPU cores start the stress test at about 4.2 GHz. The clock rate drops over the next hour and ultimately fluctuates between around 3.4 and 4 GHz. The core temperatures always remain below 90 °C (~194 °F).
The GPU clock rate fluctuates between around 1.3 and 1.8 GHz over the entire test. At the same time, the graphics card heats up to 75 °C (~167 °F), a value that isn't an issue. A new run of 3DMark 11 shows that the hardware recovers quickly from stress, and no significant performance losses can be observed.
Speakers
The speakers reproduce mid and high tones in a balanced way, but bass reproduction is mediocre at best, as is often the case. Furthermore, the speakers could be a bit louder. For external audio devices, only the combined headphone and microphone connection is available when it comes to analog ports.
Lenovo ThinkBook 16p G2 ACH audio analysis
(±) | speaker loudness is average but good (74.8 dB)
Bass 100 - 315 Hz
(±) | reduced bass - on average 14.7% lower than median
(±) | linearity of bass is average (11.1% delta to prev. frequency)
Mids 400 - 2000 Hz
(+) | balanced mids - only 4.2% away from median
(+) | mids are linear (5.5% delta to prev. frequency)
Highs 2 - 16 kHz
(+) | balanced highs - only 2.7% away from median
(+) | highs are linear (6.6% delta to prev. frequency)
Overall 100 - 16.000 Hz
(+) | overall sound is linear (14.9% difference to median)
Compared to same class
» 32% of all tested devices in this class were better, 5% similar, 63% worse
» The best had a delta of 5%, average was 17%, worst was 45%
Compared to all devices tested
» 19% of all tested devices were better, 4% similar, 77% worse
» The best had a delta of 4%, average was 24%, worst was 134%
Dell Inspiron 16 Plus 7610 audio analysis
(±) | speaker loudness is average but good (75.3 dB)
Bass 100 - 315 Hz
(±) | reduced bass - on average 14.4% lower than median
(±) | linearity of bass is average (8.4% delta to prev. frequency)
Mids 400 - 2000 Hz
(±) | higher mids - on average 5.6% higher than median
(±) | linearity of mids is average (7.9% delta to prev. frequency)
Highs 2 - 16 kHz
(+) | balanced highs - only 3.9% away from median
(±) | linearity of highs is average (7.2% delta to prev. frequency)
Overall 100 - 16.000 Hz
(±) | linearity of overall sound is average (19.3% difference to median)
Compared to same class
» 60% of all tested devices in this class were better, 8% similar, 32% worse
» The best had a delta of 5%, average was 17%, worst was 45%
Compared to all devices tested
» 45% of all tested devices were better, 8% similar, 47% worse
» The best had a delta of 4%, average was 24%, worst was 134%
Energy management - Reasonable consumption, good battery life
Energy consumption
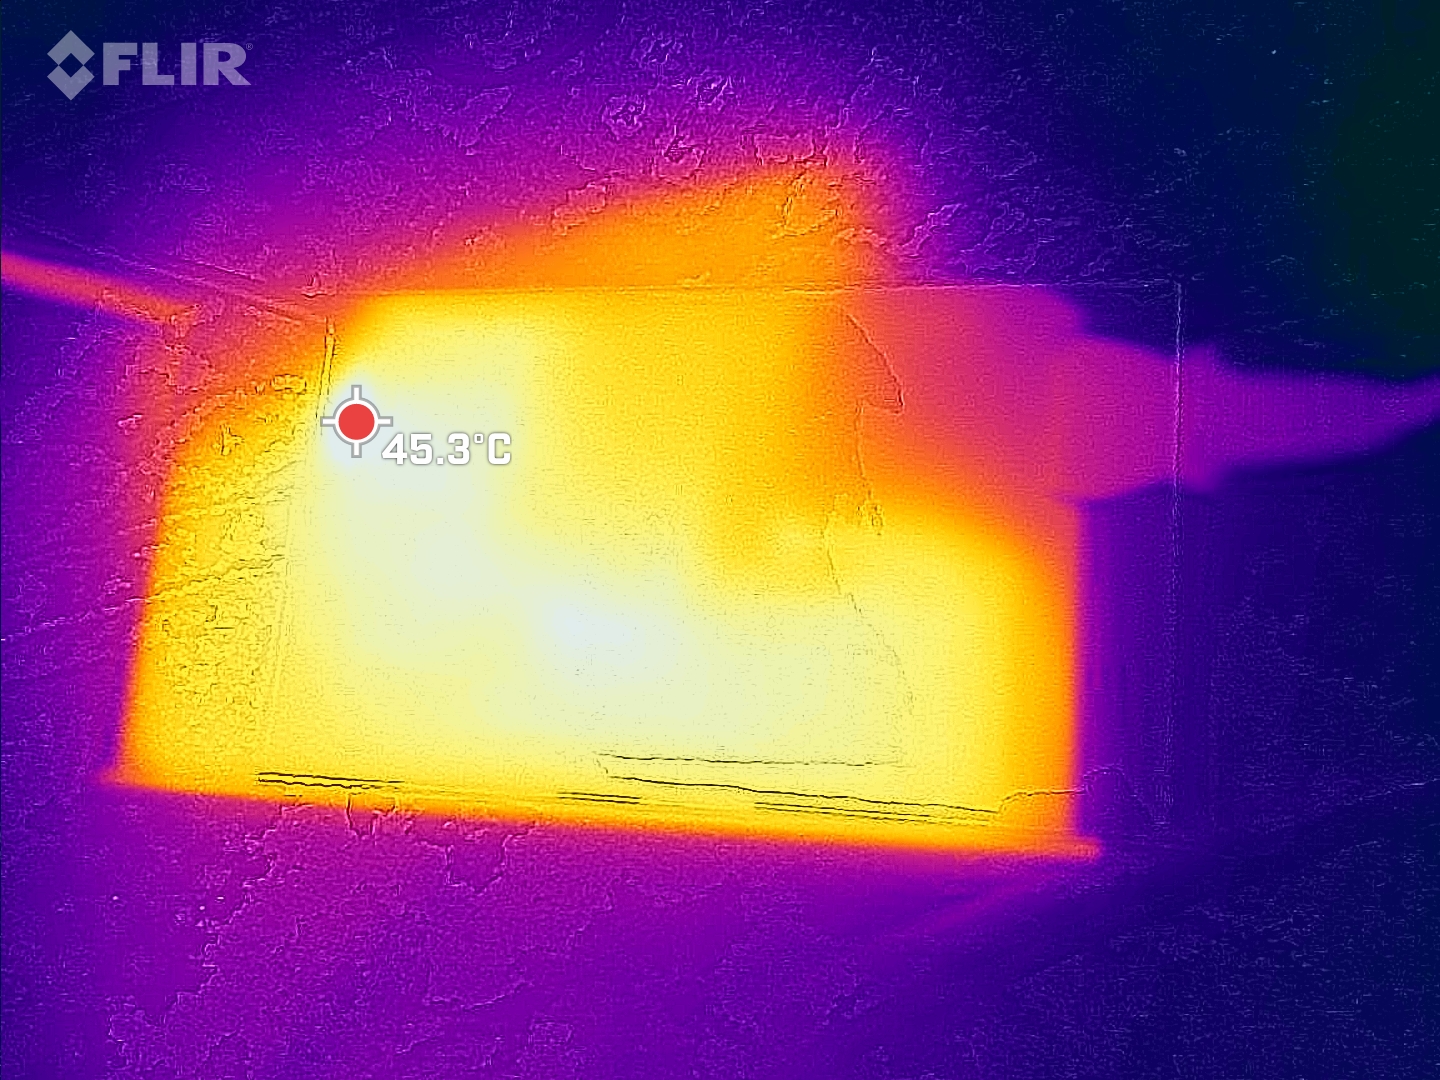
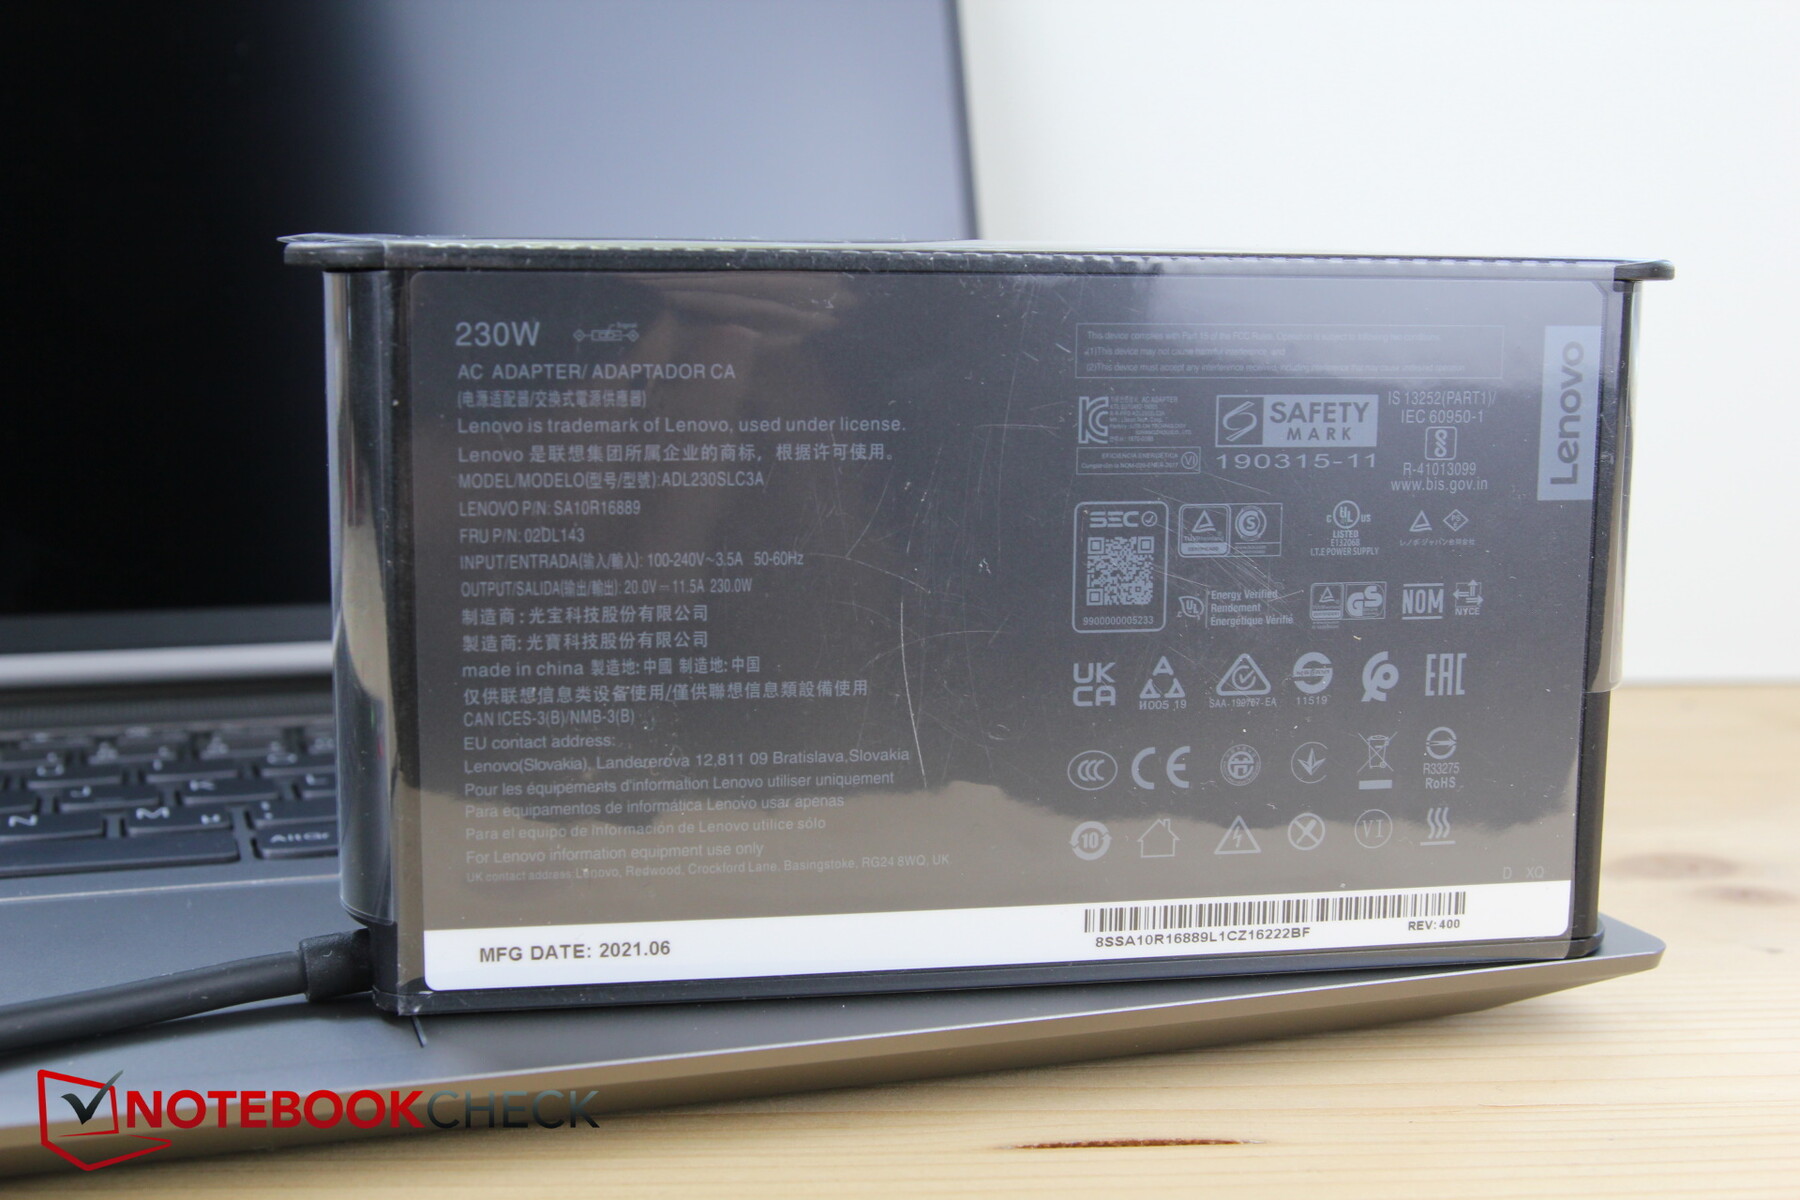
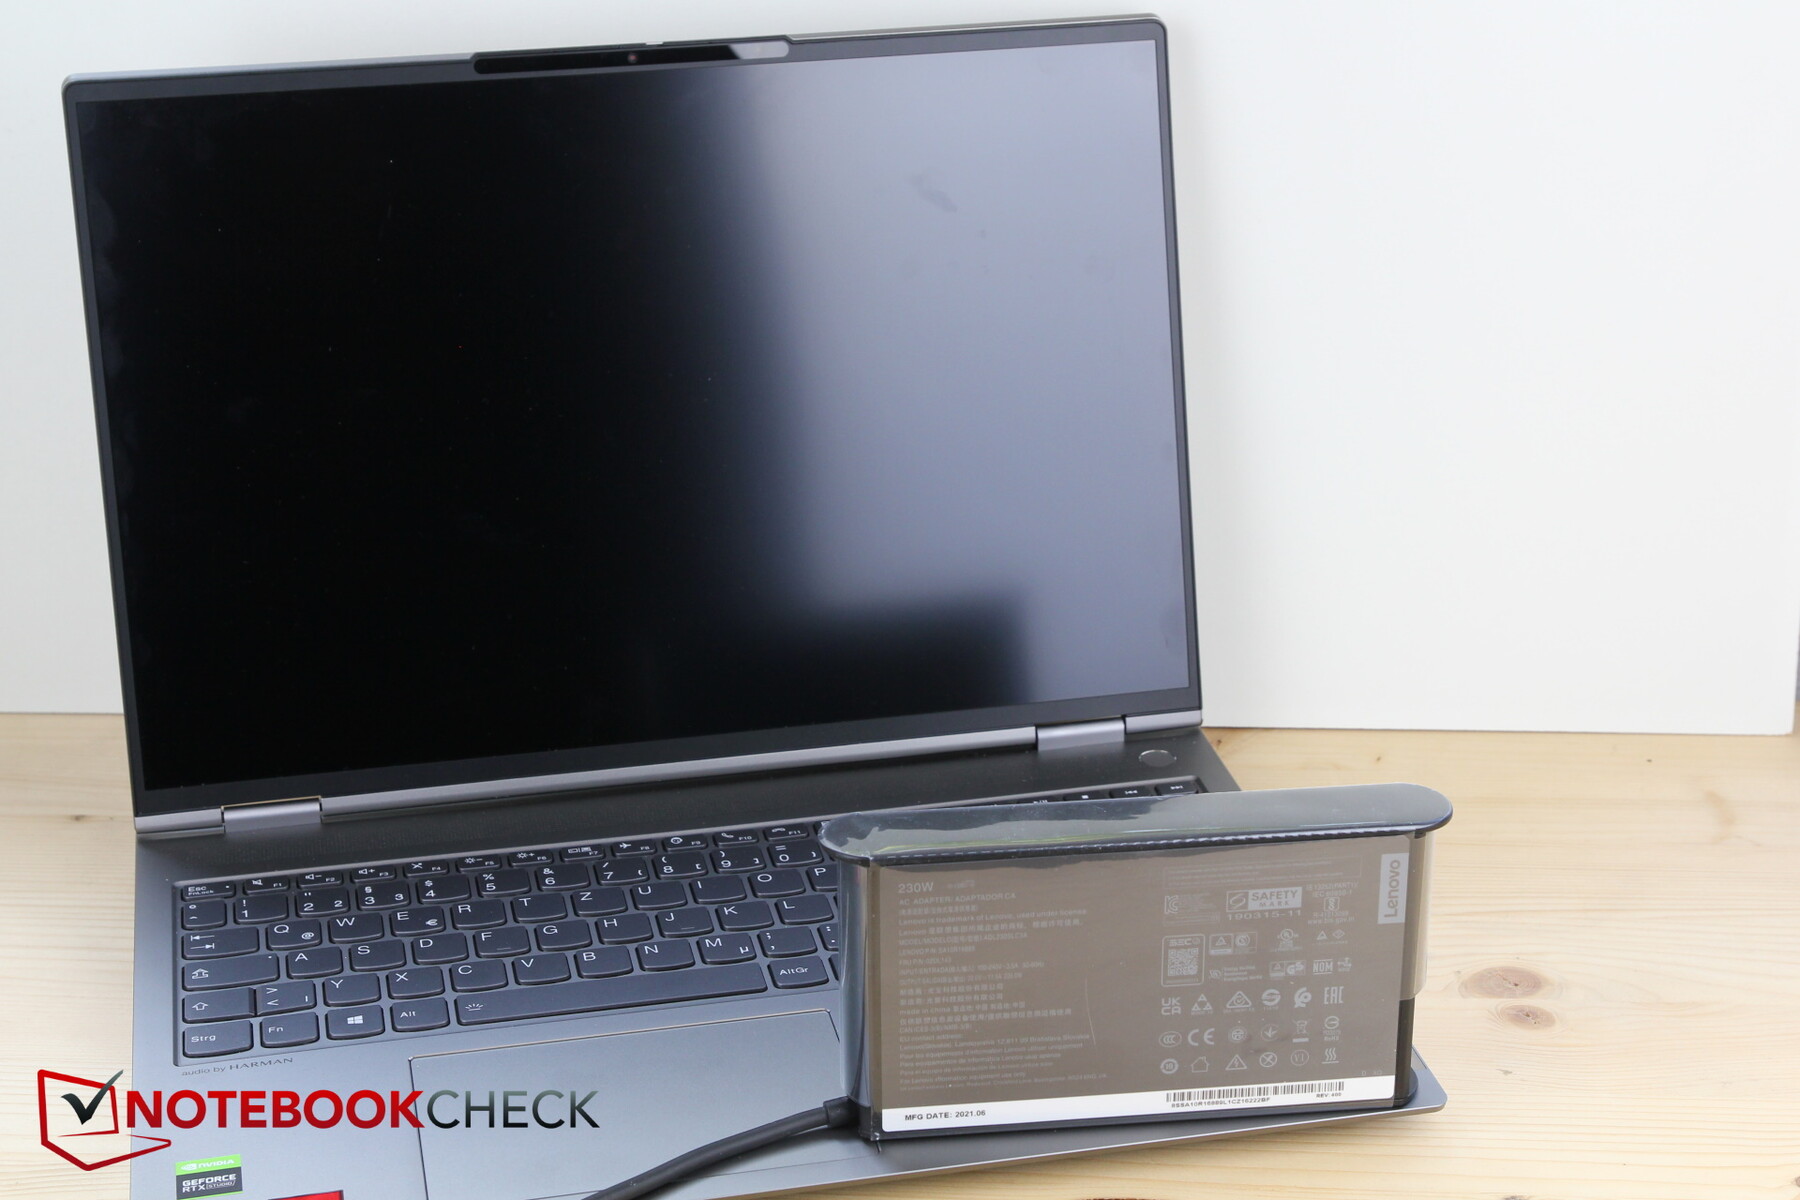
In terms of consumption, the laptop ranks between the Inspiron with the RTX 3050 and the gaming models. In idle usage, the system consumes slightly more than the competition. Under load, the graphics card's low TGP lowers the maximum consumption, which temporarily reaches a maximum of 142 watts. The power adapter supplies 230 watts, so it's far from facing any problems.
| Off / Standby | |
| Idle | |
| Load |
|
Key:
min: | |
| Lenovo ThinkBook 16p G2 ACH R9 5900HX, GeForce RTX 3060 Laptop GPU, WDC PC SN730 SDBPNTY-1T00, IPS, 2560x1600, 16" | Lenovo ThinkBook 15p Gen1 4K i7-10750H, GeForce GTX 1650 Ti Max-Q, WDC PC SN730 SDBPNTY-1T00, IPS, 3840x2160, 15.6" | Dell Inspiron 16 Plus 7610 i7-11800H, GeForce RTX 3050 4GB Laptop GPU, Kingston OM3PDP3512B, IPS, 3072x1920, 16" | Razer Blade 15 Base Edition 2021, i7-10750H RTX 3060 i7-10750H, GeForce RTX 3060 Laptop GPU, Samsung SSD PM981a MZVLB512HBJQ, IPS, 1920x1080, 15.6" | Alienware m15 R5 Ryzen Edition R7 5800H, GeForce RTX 3060 Laptop GPU, Toshiba KBG40ZNS512G NVMe, IPS, 1920x1080, 15.6" | Schenker XMG Core 15 Ampere R7 4800H, GeForce RTX 3060 Laptop GPU, Samsung SSD 970 EVO Plus 1TB, IPS, 2560x1440, 15.6" | Average NVIDIA GeForce RTX 3060 Laptop GPU | Average of class Multimedia | |
|---|---|---|---|---|---|---|---|---|
| Power Consumption | 22% | 15% | -19% | -25% | -18% | -12% | 33% | |
| Idle Minimum * (Watt) | 13.2 | 4.3 67% | 7.7 42% | 11.7 11% | 11 17% | 11 17% | 10.4 ? 21% | 5.83 ? 56% |
| Idle Average * (Watt) | 17 | 10.8 36% | 10.7 37% | 16 6% | 14 18% | 14 18% | 14.5 ? 15% | 10.4 ? 39% |
| Idle Maximum * (Watt) | 18.6 | 13.2 29% | 16.8 10% | 29.3 -58% | 25 -34% | 20 -8% | 21.4 ? -15% | 12.7 ? 32% |
| Load Average * (Watt) | 88.8 | 103.2 -16% | 100.39 -13% | 95.6 -8% | 123 -39% | 94 -6% | 109.3 ? -23% | 69 ? 22% |
| Witcher 3 ultra * (Watt) | 123 123 | 94 24% | 108 12% | 141.3 -15% | 176 -43% | 167 -36% | ||
| Load Maximum * (Watt) | 132 | 140.2 -6% | 129 2% | 197 -49% | 226 -71% | 251 -90% | 206 ? -56% | 111.9 ? 15% |
* ... smaller is better
Energy consumption during The Witcher 3 / Stress test
Battery life
Lenovo uses a 71 Wh battery. That's significantly bigger than the 56 Wh one found in the 15p, but the Dell Inspiron and Alienware have 86 Wh batteries. The former lasts about an hour longer in the Wi-Fi test, but the Alienware lasts 3 hours less despite the larger battery. 8:30 hours of browsing and about 7 hours of watching videos are good rates for a laptop with this configuration.
| Lenovo ThinkBook 16p G2 ACH R9 5900HX, GeForce RTX 3060 Laptop GPU, 71 Wh | Lenovo ThinkBook 15p Gen1 4K i7-10750H, GeForce GTX 1650 Ti Max-Q, 57 Wh | Dell Inspiron 16 Plus 7610 i7-11800H, GeForce RTX 3050 4GB Laptop GPU, 86 Wh | Razer Blade 15 Base Edition 2021, i7-10750H RTX 3060 i7-10750H, GeForce RTX 3060 Laptop GPU, 65 Wh | Alienware m15 R5 Ryzen Edition R7 5800H, GeForce RTX 3060 Laptop GPU, 86 Wh | Schenker XMG Core 15 Ampere R7 4800H, GeForce RTX 3060 Laptop GPU, 62 Wh | Average of class Multimedia | |
|---|---|---|---|---|---|---|---|
| Battery runtime | 1% | 41% | -35% | -23% | -29% | 50% | |
| H.264 (h) | 7 | 7.3 4% | 8.8 26% | 6 -14% | 16.2 ? 131% | ||
| WiFi v1.3 (h) | 8.5 | 9.8 15% | 9.9 16% | 4.8 -44% | 5.1 -40% | 5.8 -32% | 11.6 ? 36% |
| Load (h) | 2 | 1.7 -15% | 3.3 65% | 1.5 -25% | 0.9 -55% | 1.2 -40% | 1.655 ? -17% |
| Reader / Idle (h) | 20.5 | 7.8 | 14.7 | 7.8 | 22 ? | ||
| Witcher 3 ultra (h) | 1.6 |
Pros
Cons
Verdict - Not a gaming laptop, and that's good
Whether you like the ThinkBook 16p depends entirely on your own requirements and expectations. If you expect a gaming laptop geared towards performance because of the RTX 3060, you might be disappointed. The ThinkBook doesn't intend to be a gaming laptop despite its powerful hardware, but rather a workhorse for performance-oriented business users or even creators. You can also play games on the ThinkBook without any problems, but there are better gaming laptops that can get even more performance out of the RTX 3060 and that offer a higher refresh rate.
In return, the ThinkBook also circumvents various drawbacks of gaming laptops. Thanks to the somewhat slowed-down RTX 3060, it has good battery life, and it never gets annoyingly loud or hot. Creators might definitely like the 16:10 display, even though an additional 4K option would've been nice to have.
However, the workhorse has to be criticized for its lack of ports. Fast Internet over LAN is only possible with an adapter due to the lack of a port, and an external monitor can only be connected using an adapter or hub as well; this restricts mobility on the one hand, while on the other, it makes additional purchases necessary - after all, Lenovo doesn't include any adapters in the box. Nevertheless, a hub is almost mandatory with the ThinkBook 16p.
Rightfully, the ThinkBook 16p isn't marketed as a gaming laptop, but as a business laptop or a powerful laptop for creative professionals. Its strong hardware makes its usability quite universal, but you have to accept compromises on both sides.
Price and availability
At the time of writing, our exact test configuration of the Lenovo ThinkBook 16p doesn't seem to be available. You can currently find a version with the AMD Ryzen 7 5800H, the RTX 3060, 16 GB of RAM, and a 1 TB SSD in the manufacturer's online store for $2,319. Alternatively, you can also wait for other configurations to be available on Amazon or newegg, for example.
Lenovo ThinkBook 16p G2 ACH
- 09/10/2021 v7 (old)
Christian Hintze
More articles related to this device
Lenovo ThinkBook 16p G2 ACH (ThinkBook 16p Series)Related Articles

Price comparison

