EUROCOM X8 (Clevo P377SMA) Notebook Review
(January 4, 2015 update): We previously stated that the X8 utilizes the Clevo P375SM when it is in fact the P377SMA. The title now reflects this change.
With roughly 2000 notebooks reviewed and published here as of this writing, the top one percent according to our raw hardware and benchmark numbers are almost always models from resellers. Thus, when we received the Eurocom X8 for testing, we had no doubts that this 17.3-inch gaming monster would top our charts yet again and supplant our last year's Eurocom X7 in pure performance.
Our X8 on hand houses serious hardware on all fronts, including a 3.1 GHz Core i7-4940MX, GTX 980M SLI graphics, 32 GB of overclocked DDR3 RAM, and a 120 GB Samsung mSATA SSD with a secondary 1 TB SATA SSD for good measure. This Eurocom is in the ballpark of $5000 USD as configured, which puts it in the same price range as not just other high-end gaming notebooks, but also high-end mobile workstations like the ZBook and Precision series. We provide the hard facts and numbers below while comparing the performance of our X8 with more well-known models from Asus, Alienware, Aorus, and others.
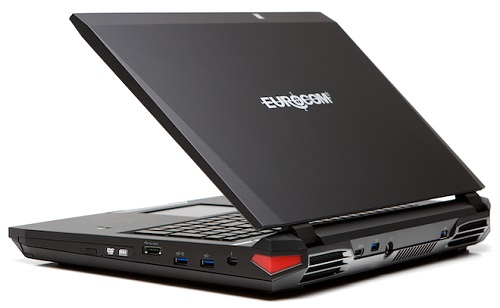
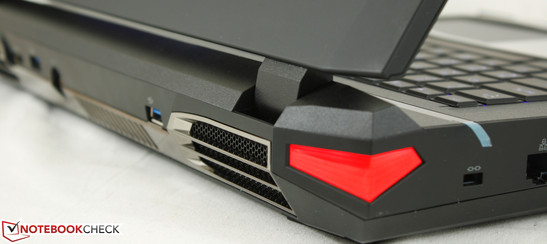
Case
The X8 utilizes a similar Clevo P377SMA chassis as the X7 with similar quality and features.. so why the different names? The X8 is marketed as one of Eurocom's high-end mobile workstations whereas the X7 is geared towards the gaming crowd. Nonetheless, they both share very similar configuration options with only a few specific differences to cater to their respective audiences.
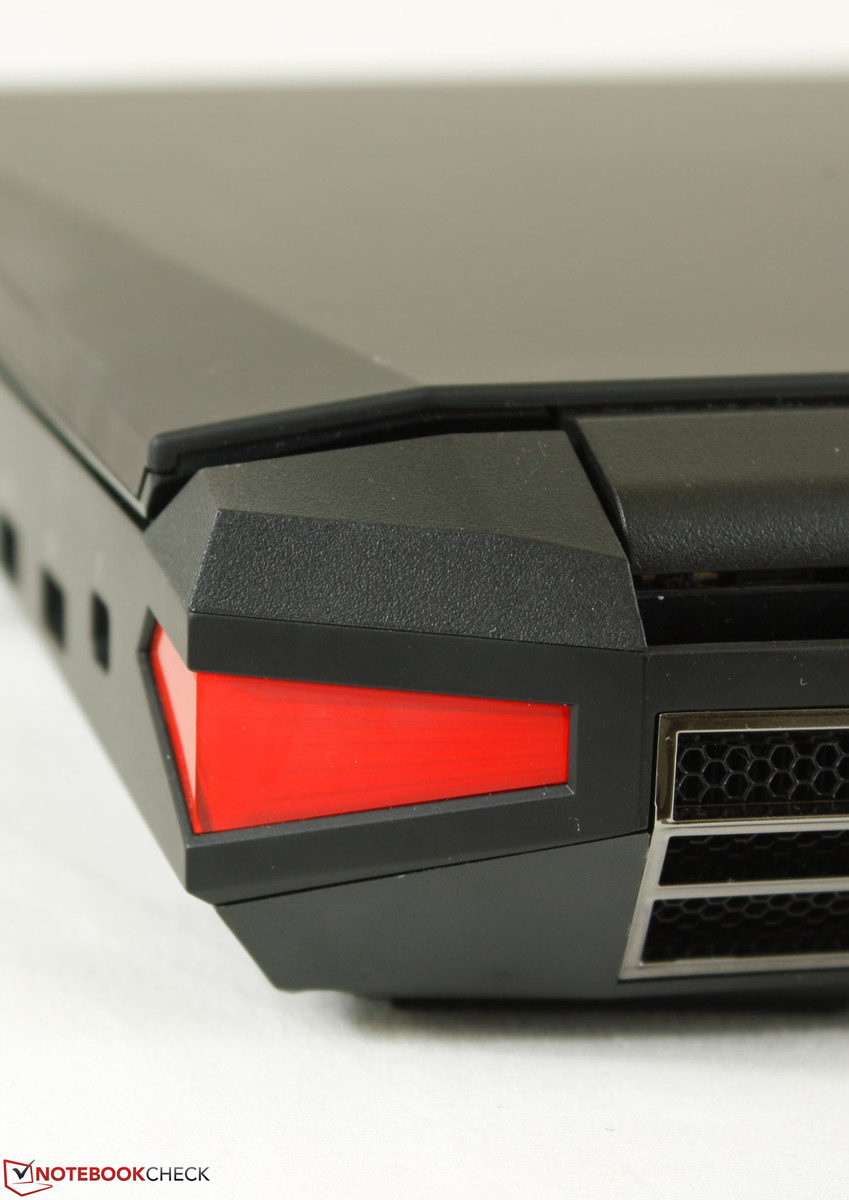
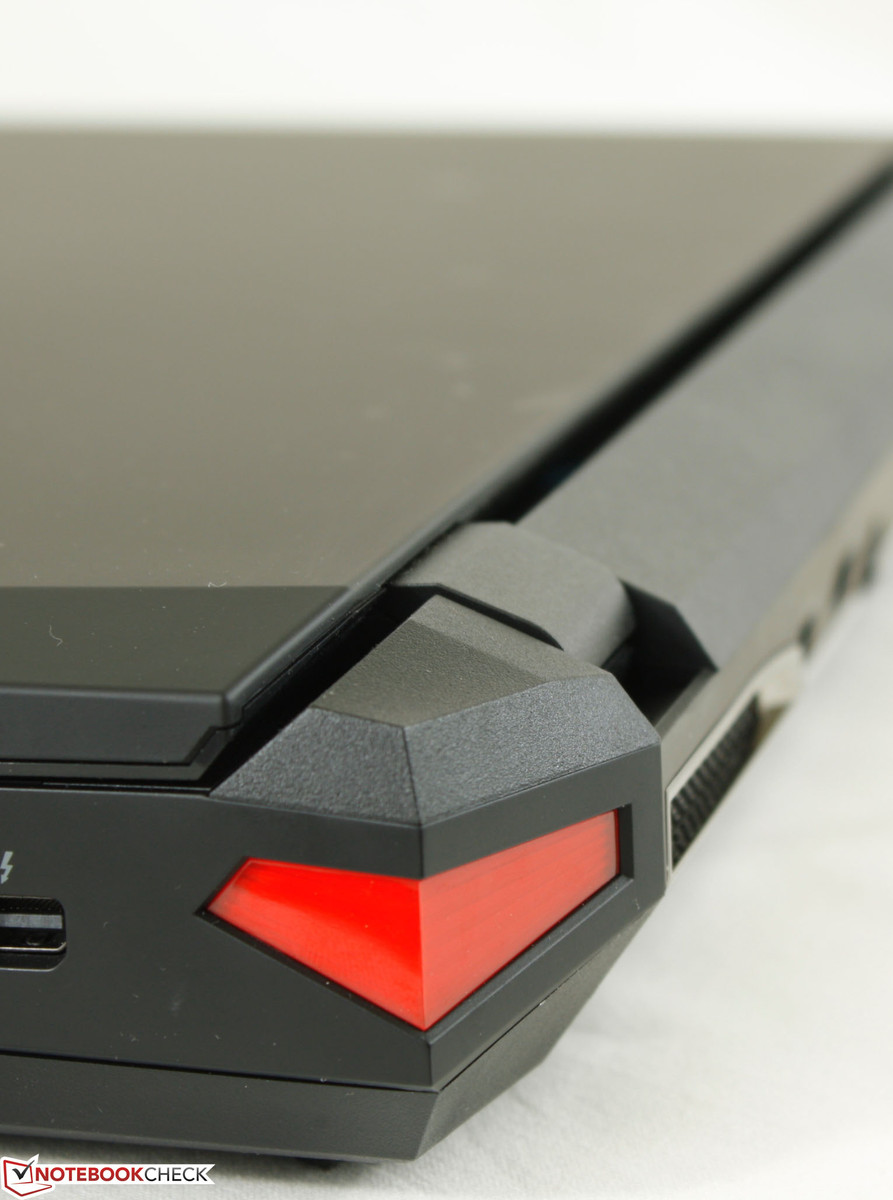
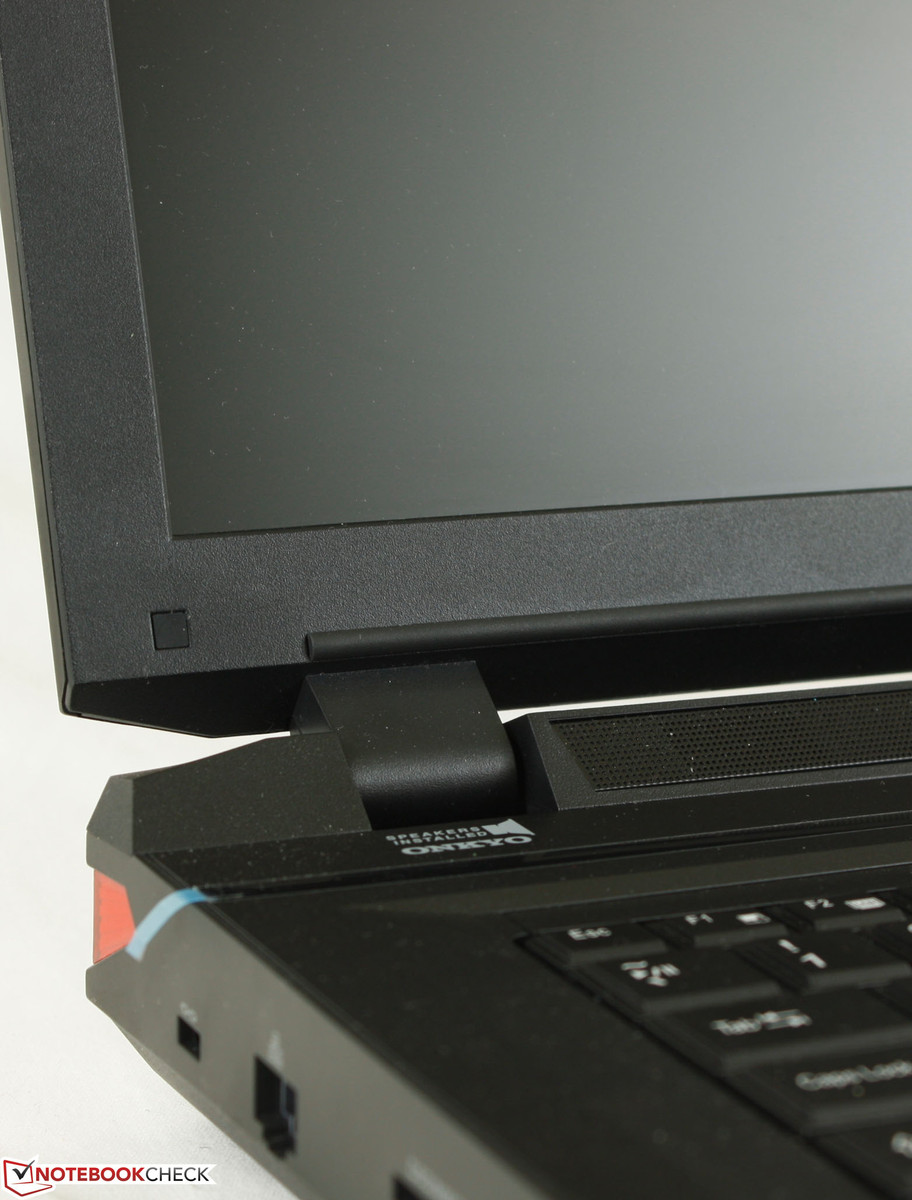
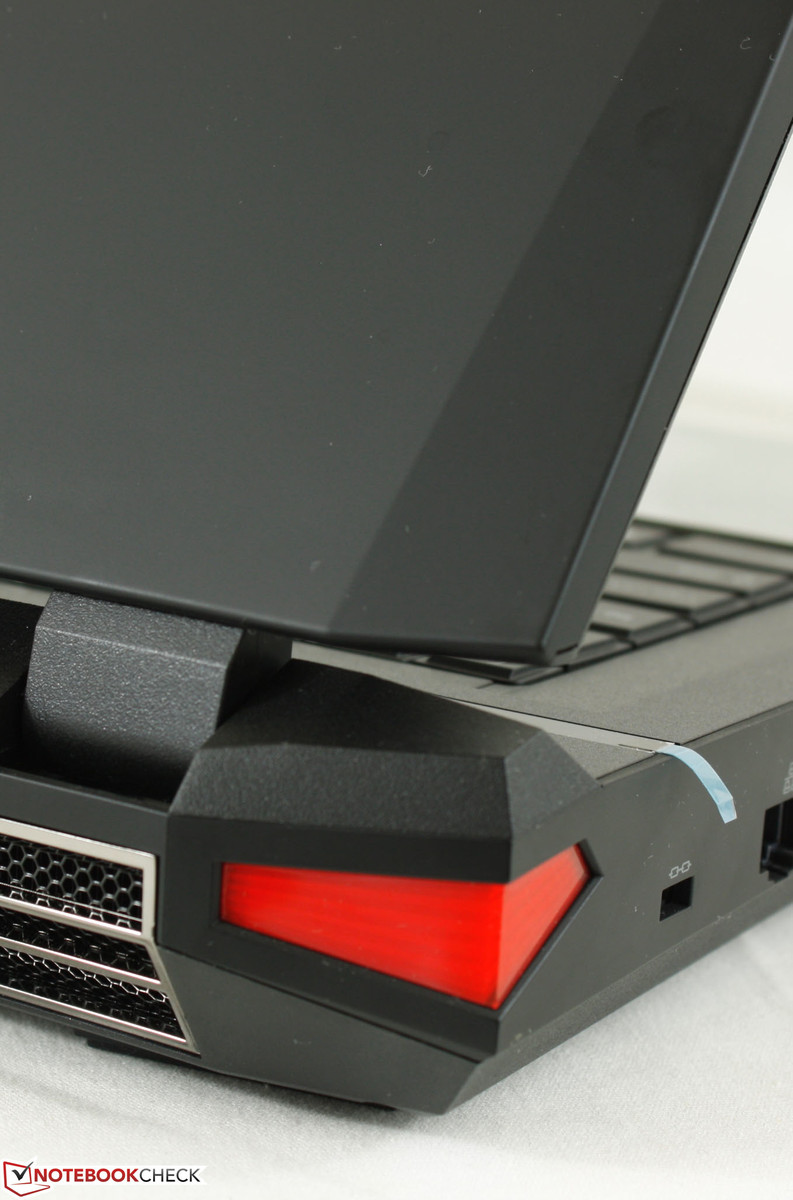
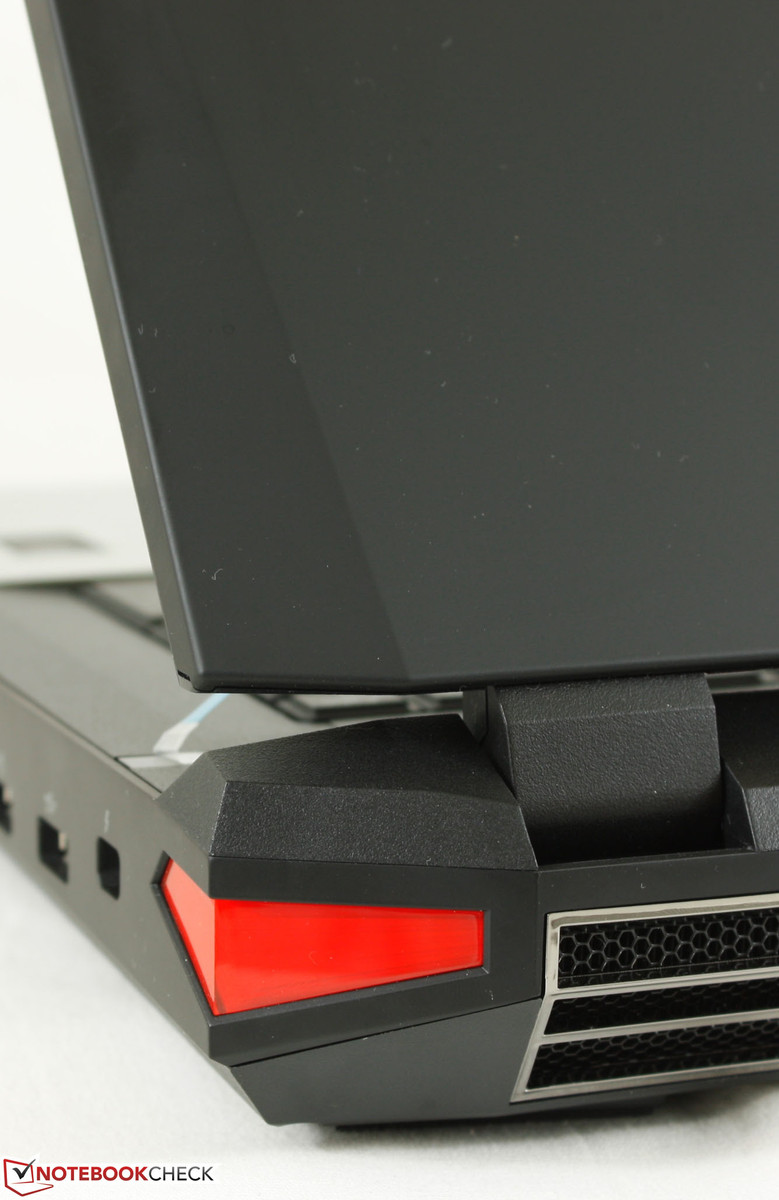
Though the X8 has not received any visual upgrades since last year's X7, we still find the chassis to be more visually appealing than other Clevo barebones. However, this does mean that certain properties have yet to be improved, including the outer lid. For example, as large as the notebook may be, the center of the lid feels very thin. We refer to our Eurocom X7 review for a more detailed look and discussion on chassis quality.
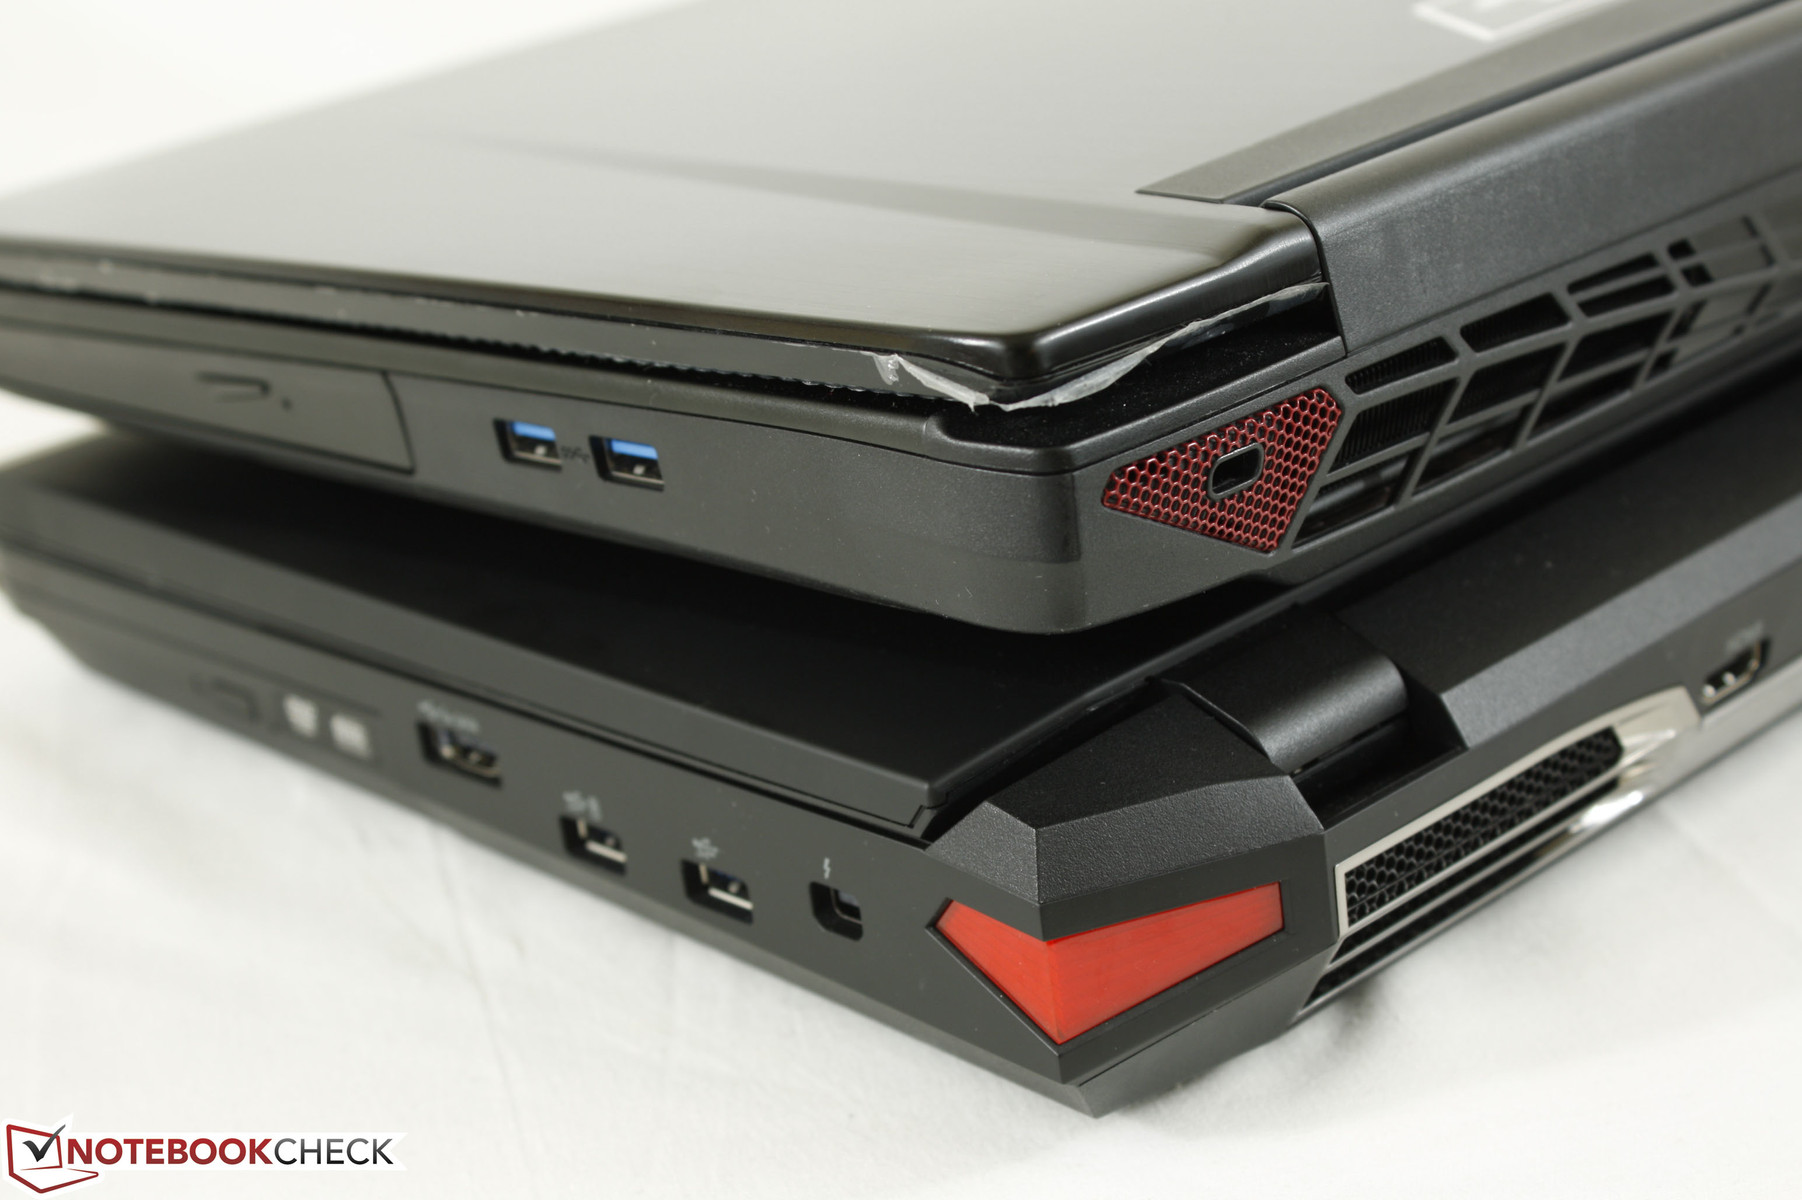
In terms of size, the X8 is very similar to the Alienware 17 and MSI GT72 in both length and width, but it is noticeably thicker at 54.8 mm compared to "just" 46 mm and 48 mm of the Dell and MSI, respectively. The Asus G750 is even thicker despite not having dual GPUs. However, the ROG models are notable for their relatively low surface temperatures and quiet operation, so the additional girth can be justified in this case. Meanwhile, the superthin Aorus X7 and its GTX 970M SLI GPUs is less than half as thick as the X8.

Display
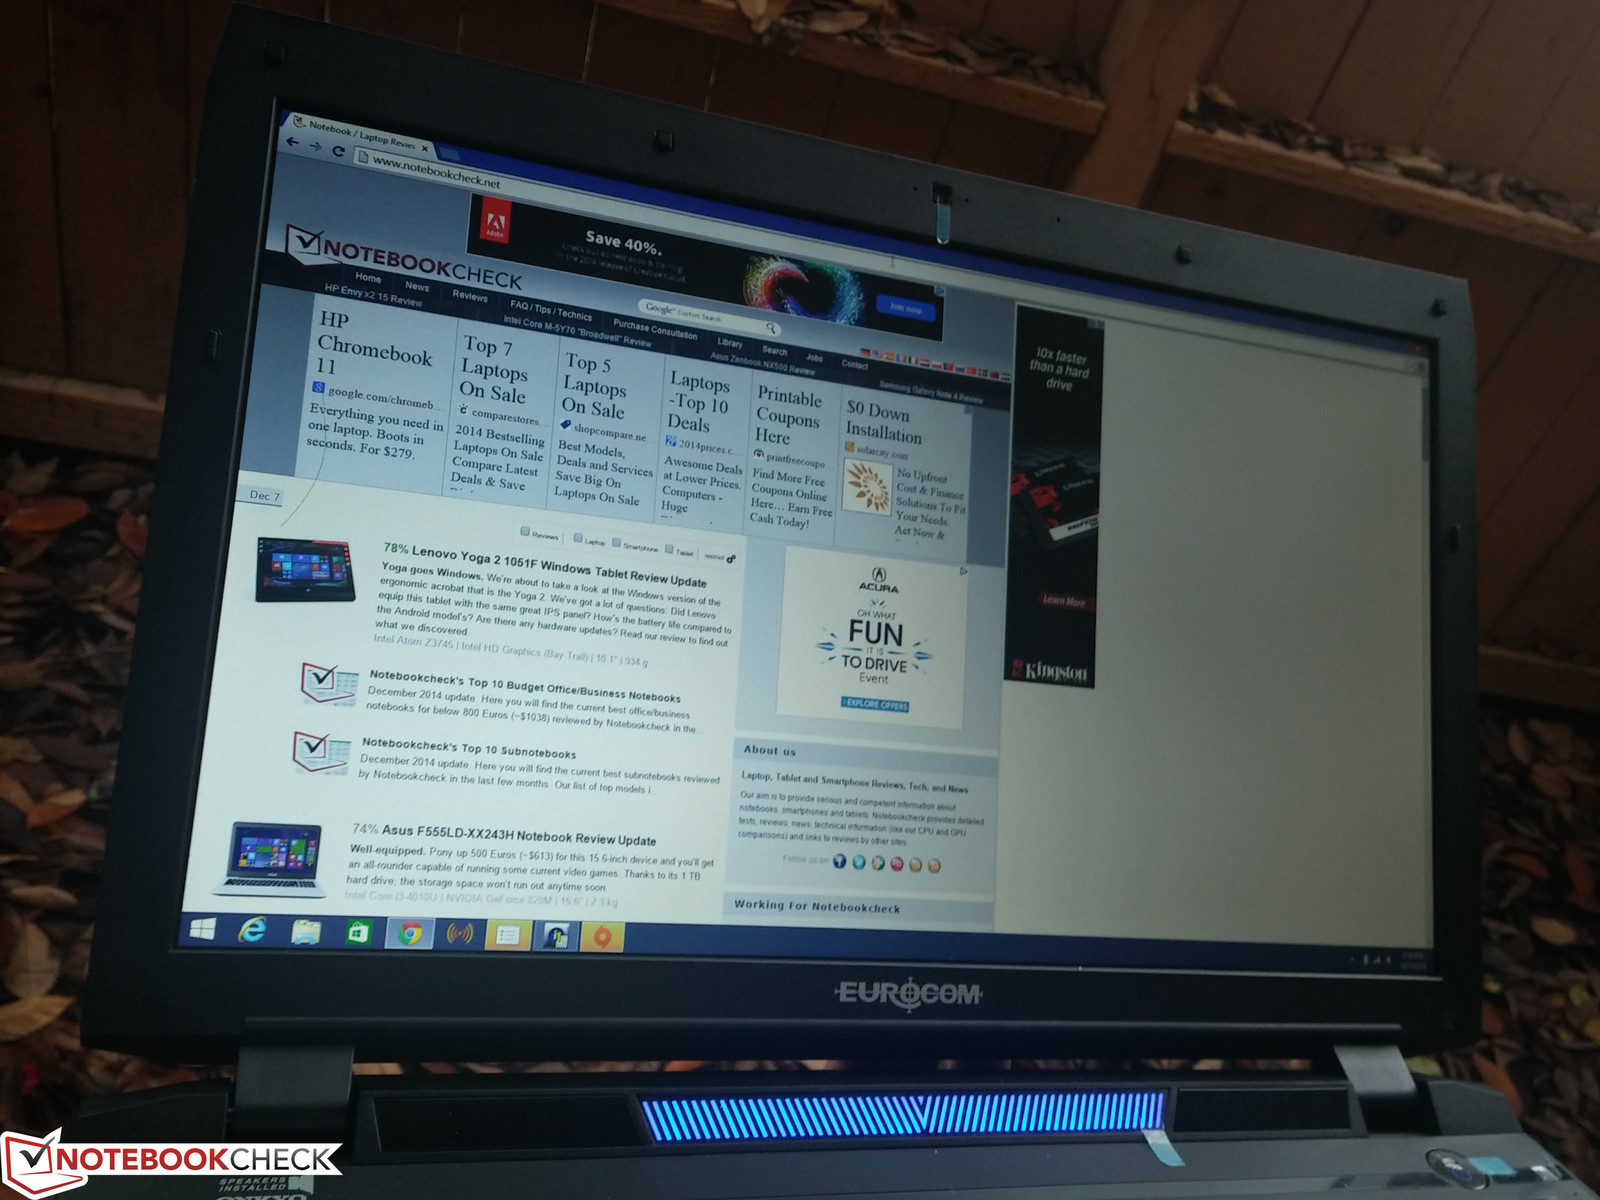
Available display panels are limited to 1080p as 17.3-inch UHD and QHD displays are still hard to come by. Gamers looking for models beyond 1080p can check out some 15.6-inch options including the MSI GS60 or Gigabyte P35X. Nonetheless, Eurocom offers both matte and glossy options with 120 Hz refresh or 90 percent NTSC coverage depending on the display. While digital artists may be interested in better color accuracy, a 120 Hz display will reduce screen tears, improve onscreen motion, and reduce input lag, all of which are essential for serious gaming.
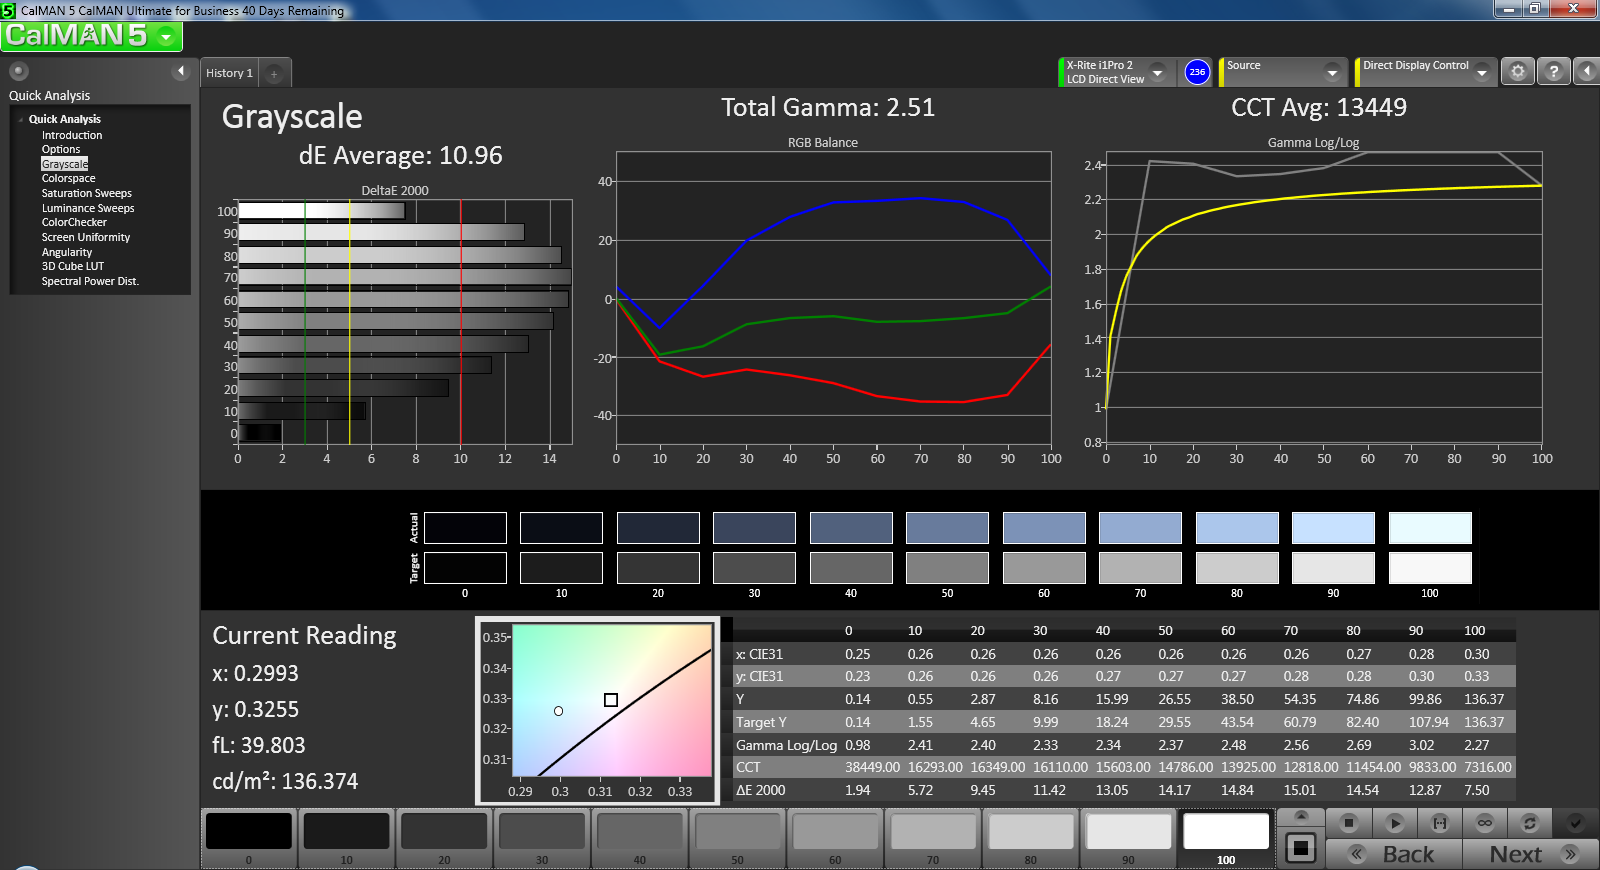
The CHI MEI N173HGE-L11 LVDS panel on our model exhibits clean text and pictures with no noticeable color abnormalities or significant backlight bleeding. This particular panel can also be found on a number of other high-end 17.3-inch notebooks as well, including the MS GT70, Fujitsu Lifebook NH751, and the Sony Vaio SVE1711X1EB. Our measured brightness of about 250 nits across the display is a little less than what we had hoped as competing models tend to be closer to 300 nits or higher. Contrast is also merely average at about 450:1, so our equipped display offers nothing out of the ordinary.
| |||||||||||||||||||||||||
Brightness Distribution: 78 %
Center on Battery: 267.9 cd/m²
Contrast: 432:1 (Black: 0.62 cd/m²)
ΔE ColorChecker Calman: 10.39 | ∀{0.5-29.43 Ø4.73}
ΔE Greyscale Calman: 10.96 | ∀{0.09-98 Ø4.98}
57% AdobeRGB 1998 (Argyll 1.6.3 3D)
64.9% AdobeRGB 1998 (Argyll 3D)
88.5% sRGB (Argyll 3D)
65.3% Display P3 (Argyll 3D)
Gamma: 2.51
CCT: 13449 K
| Eurocom X8 GeForce GTX 980M SLI, 4940MX, Samsung SSD 840 EVO 120GB mSATA | Alienware 17 (GTX 880M) GeForce GTX 880M, 4700MQ, WDC Scorpio Blue WD10JPVX-75JC3T0 | Asus G750JZ-T4023H GeForce GTX 880M, 4700HQ, 2x Sandisk X110 SD6SP1M-128G RAID 0 | MSI GT72-2QE32SR311BW GeForce GTX 980M, 4710HQ, 4x Kingston RBU-SNS8100S3256GD1 (RAID 0) | Aorus X7 Pro GeForce GTX 970M SLI, 4870HQ, 2x Lite-On LMT-256L9M (RAID 0) | |
|---|---|---|---|---|---|
| Display | 0% | 1% | -6% | 1% | |
| Display P3 Coverage (%) | 65.3 | 67.1 3% | 67.9 4% | 60.3 -8% | 67.9 4% |
| sRGB Coverage (%) | 88.5 | 87.8 -1% | 88.6 0% | 84 -5% | 88.7 0% |
| AdobeRGB 1998 Coverage (%) | 64.9 | 64.2 -1% | 64.8 0% | 61.4 -5% | 64.9 0% |
| Screen | 16% | 26% | 19% | 29% | |
| Brightness middle (cd/m²) | 267.9 | 302 13% | 275 3% | 273 2% | 318 19% |
| Brightness (cd/m²) | 254 | 284 12% | 258 2% | 259 2% | 283 11% |
| Brightness Distribution (%) | 78 | 90 15% | 80 3% | 85 9% | 82 5% |
| Black Level * (cd/m²) | 0.62 | 0.49 21% | 0.49 21% | 0.3 52% | 0.54 13% |
| Contrast (:1) | 432 | 616 43% | 561 30% | 910 111% | 589 36% |
| Colorchecker dE 2000 * | 10.39 | 9.31 10% | 3.34 68% | 11.63 -12% | 3.79 64% |
| Greyscale dE 2000 * | 10.96 | 9.63 12% | 2.2 80% | 11.9 -9% | 2.35 79% |
| Gamma | 2.51 88% | 2.13 103% | 2.5 88% | 2.56 86% | 2.37 93% |
| CCT | 13449 48% | 10778 60% | 6654 98% | 15491 42% | 6775 96% |
| Color Space (Percent of AdobeRGB 1998) (%) | 57 | 57 0% | 58 2% | 54 -5% | 58 2% |
| Total Average (Program / Settings) | 8% /
12% | 14% /
19% | 7% /
12% | 15% /
21% |
* ... smaller is better
Color space coverage is roughly 57.32 percent and 77.92 percent of AdobeRGB and sRGB, respectively. While certainly not fit for professional graphics work, our sRGB coverage is much higher than the typical ~60 percent found on most mainstream notebooks. A wide color gamut is inconsequential during the heat of battle for gamers and Eurocom does offer more accurate panels as mentioned above for those who need it. However, users will find that most gaming notebooks have similar color coverages as response times are a higher priority.


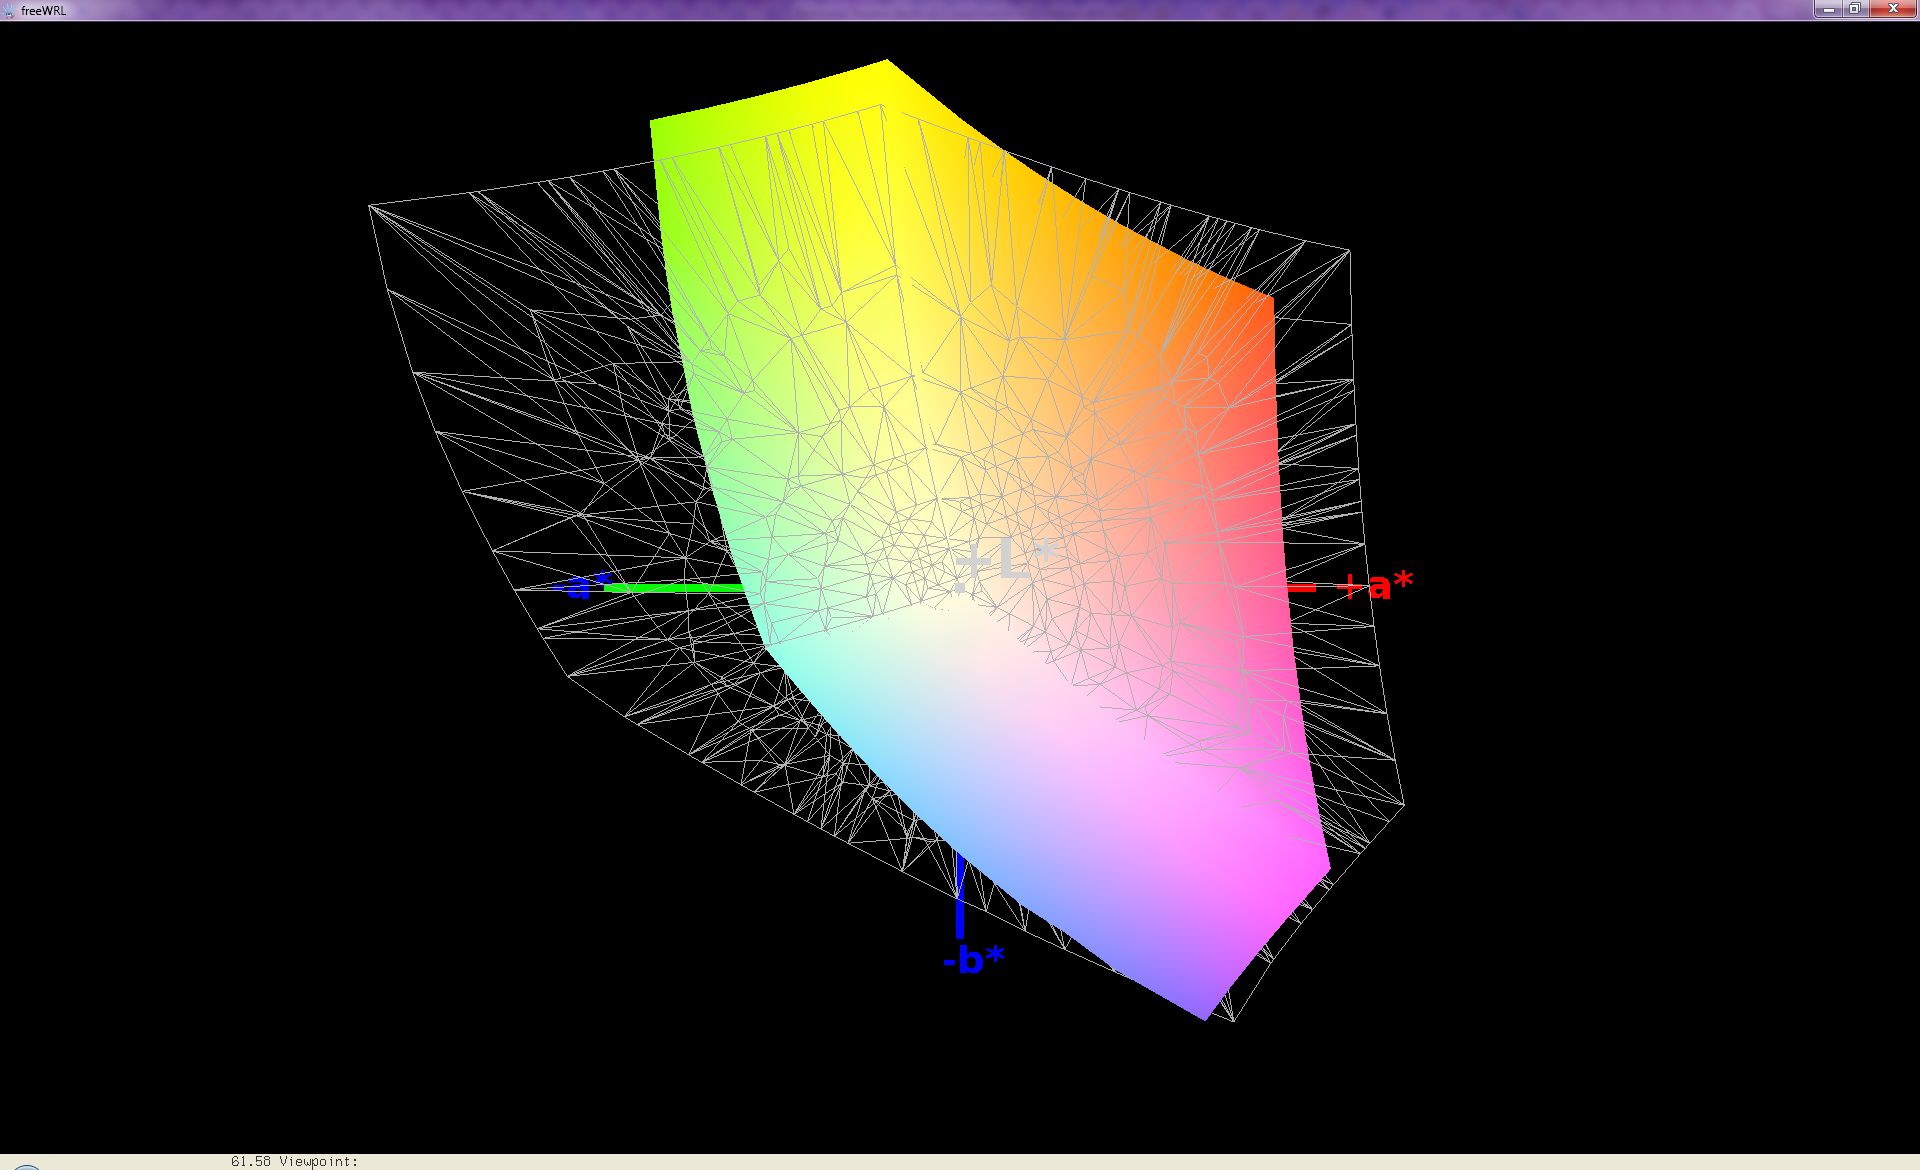
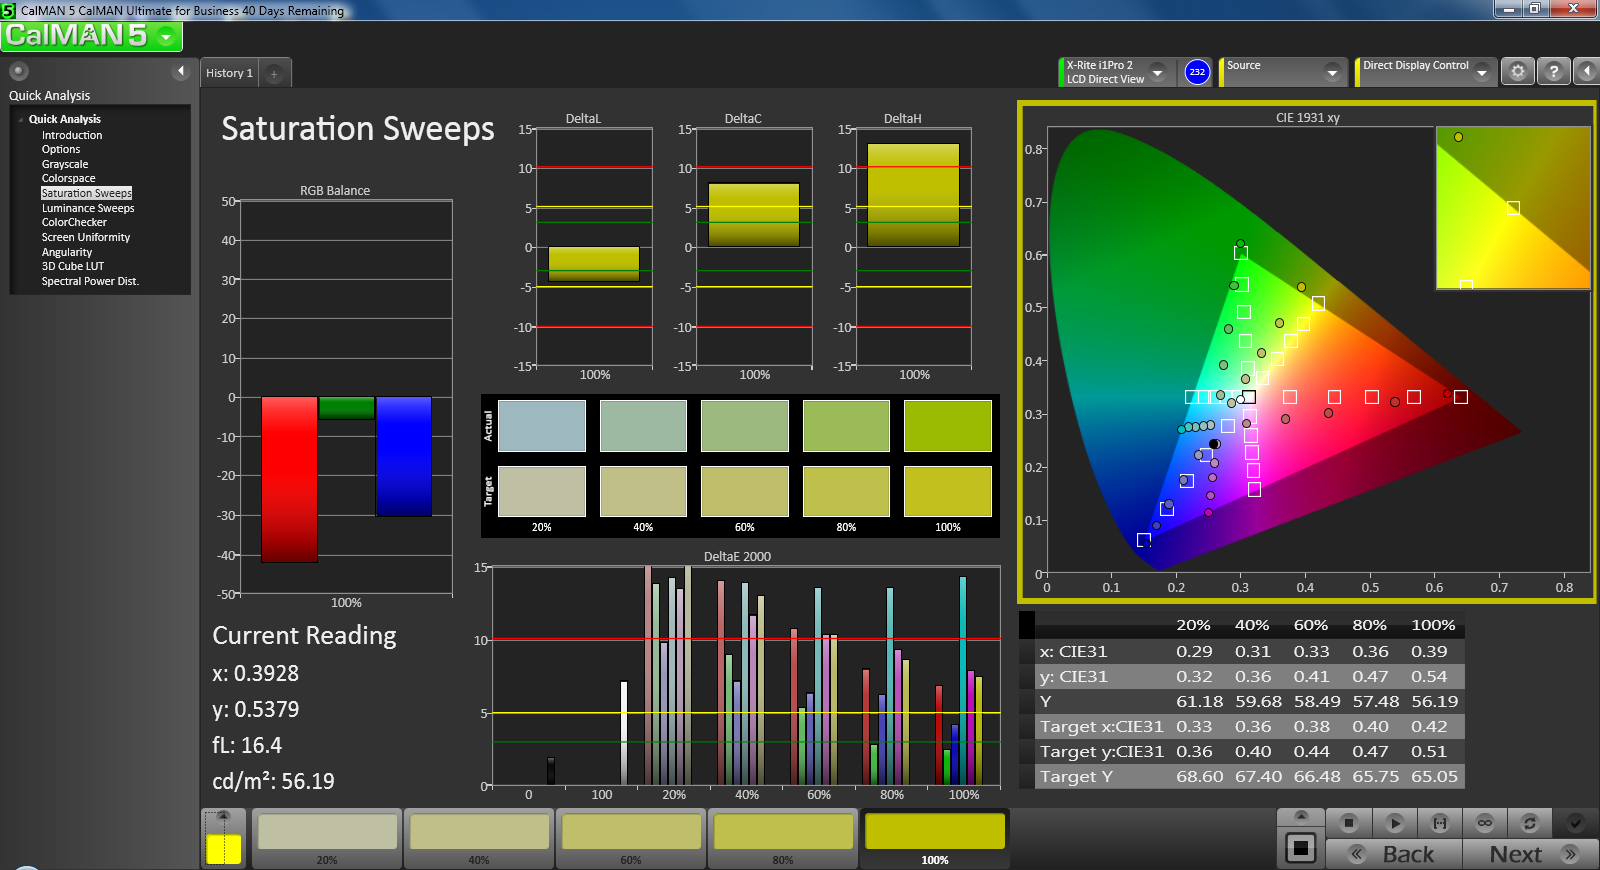
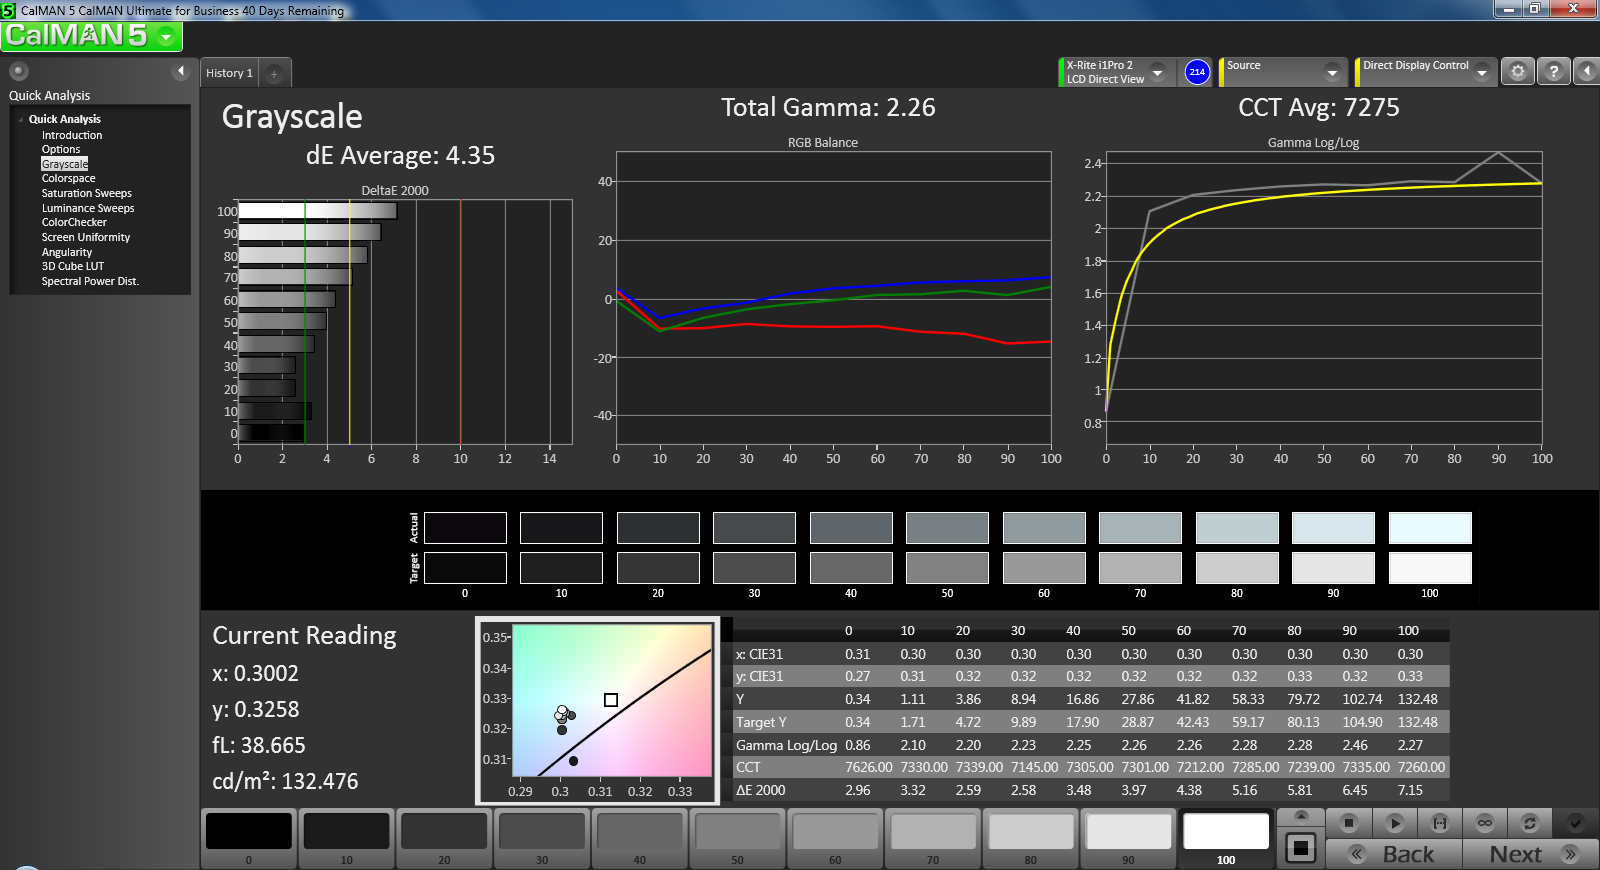
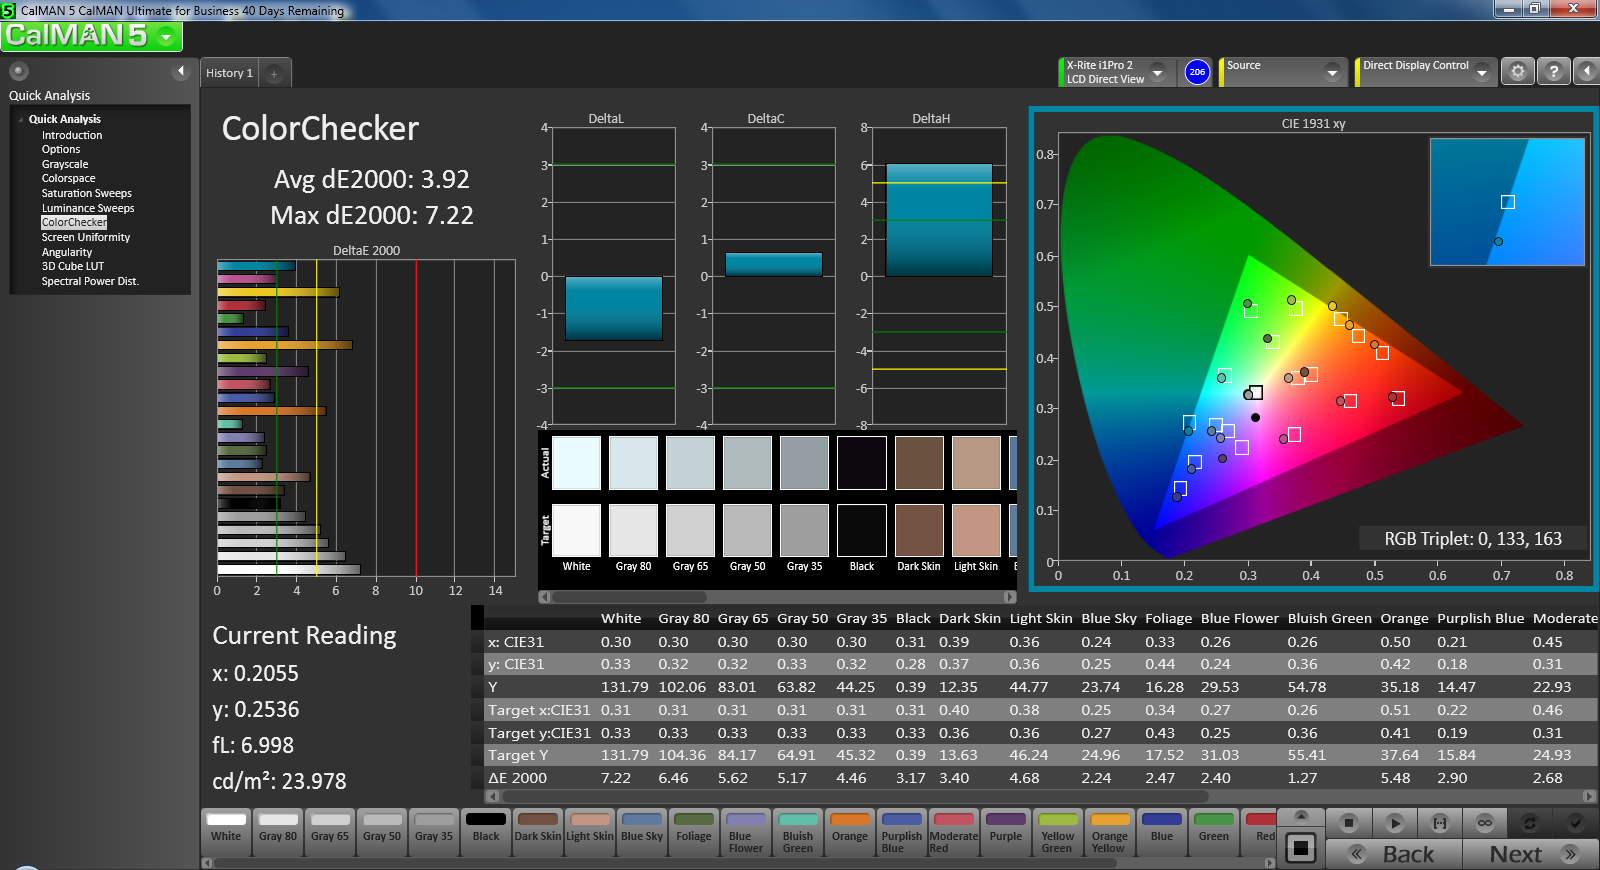
Further display analyses with a X-Rite spectrophotometer reveal generally inaccurate colors and grayscale out-of-the-box. The display improves dramatically after calibration, including a flatter RGB balance, more accurate colors across tested saturation levels, and a gamma closer to the 2.2 sRGB ideal. In general, colors become more accurate the higher the saturation level with no one color deviating significantly from the others. Nitpickers will point out that orange and yellow tend to be a bit less accurate, but performance is very consistent nonetheless.


Outdoor visibility is difficult even at maximum display brightness. While the matte display helps in reducing glare, the large display requires a stronger backlight than what is provided for comfortable use under sunlight. Maximum brightness does not artificially drop when running on batteries and the display is passable for some quick work on cloudy days if required, but anyone intending to use the X8 outdoors for extended periods on a daily basis may want to consider having a lighter secondary notebook around.
Viewing angles are stable as far as TN panels go. Colors are consistent if viewing from the left or right or from above the display, but they quickly degrade if viewing from below the normal. This is thankfully not a significant limitation to usability for the sole user or if sharing the display with others nearby. However, users who will go for the glossy display option may find tighter viewing angles due to increased glare, especially when considering that the hinges will only extend up to 135 degrees.

Performance
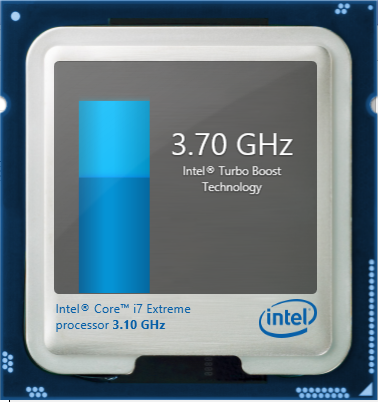
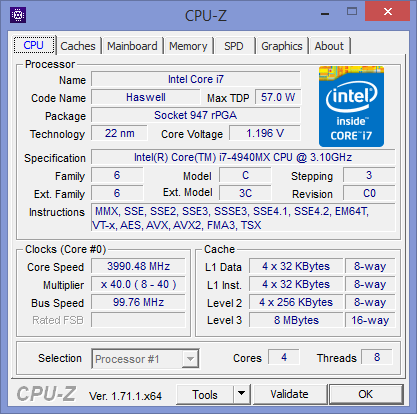
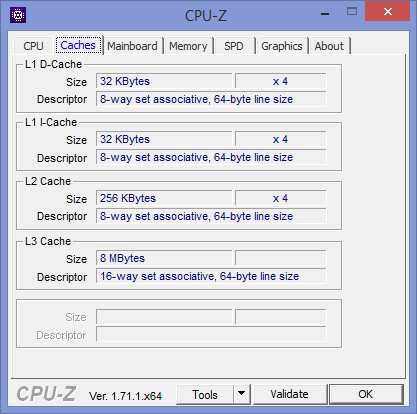
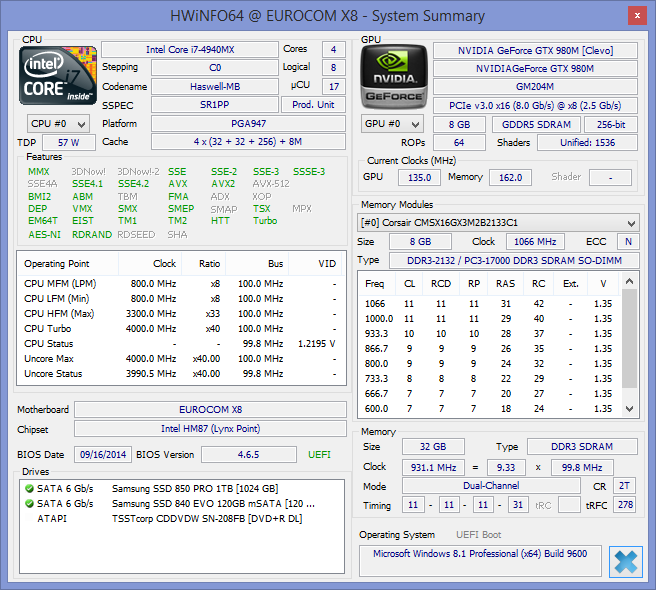
Users attracted to the most powerful mobile hardware tend to gravitate toward barebones solutions as they normally offer more hardware components and high-end niche features like RAID or SLI. The Eurocom X8 is no exception with its wealth of powerful CPU and GPU options ranging from a Core i7-4810MQ to Radeon R9 290X CrossFireX graphics. Our X8 on hand is equipped with the most powerful CPU option: the 3.1 GHz Core i7-4940MX. This quad-core processor is the fastest consumer-based Haswell core in the market as of this writing and is capable of running all cores at 3.8 GHz with Turbo Boost. If only one core is active, this CPU is the only mobile Haswell core officially rated at 4 GHz thus far. When idling or on the Power Saver profile, all cores will run at 800 MHz to preserve power. The CPU also includes an integrated HD 4600 GPU as is common on Intel Core ix models, but the GPU is disabled in this case in favor of discrete graphics and for the ability to output up to 3 external displays.
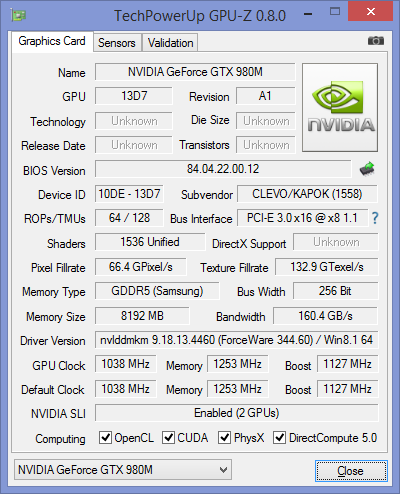
On the GPU side, users can choose between Nvidia GeForce (both Kepler and Maxwell) and Quadro cards up to the GTX 980M and K5100M, respectively. The GTX 980M SLI GPUs here are clocked at 1038/5010 MHz core/memory each plus GPU Boost. When idling and on the Power Saver profile, both cards will reduce to just 135/162 MHz to preserve power according to GPU-Z. Though the system lacks Optimus, users can switch SLI on or off via the Nvidia Control Panel. Note that this will require a system restart each time, which is in contrast to desktop SLI solutions.
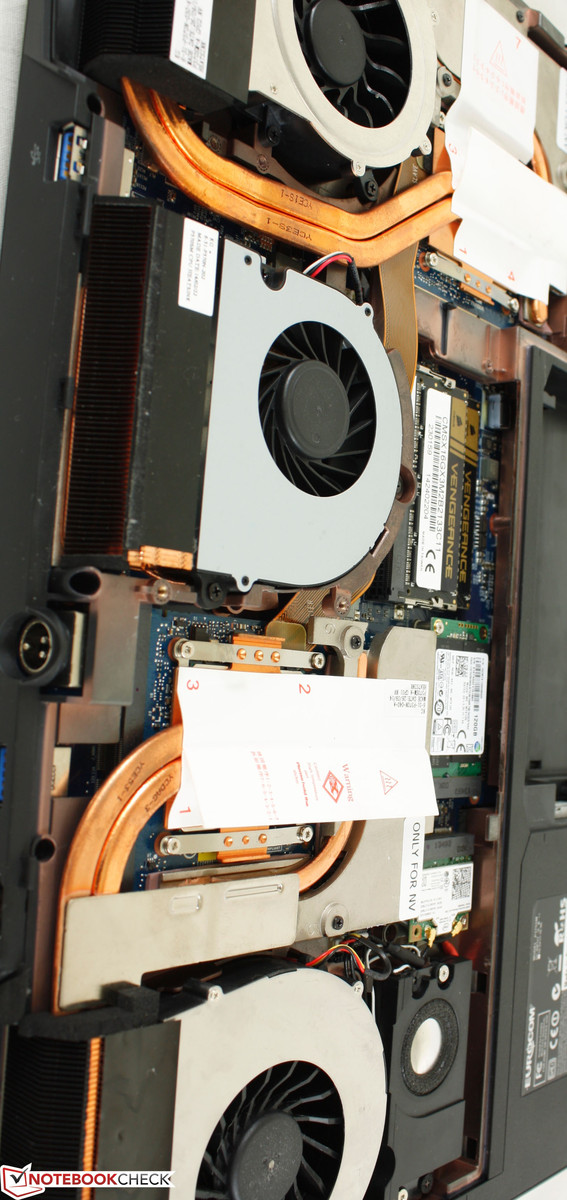
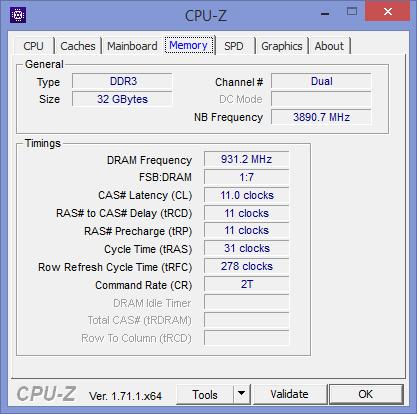
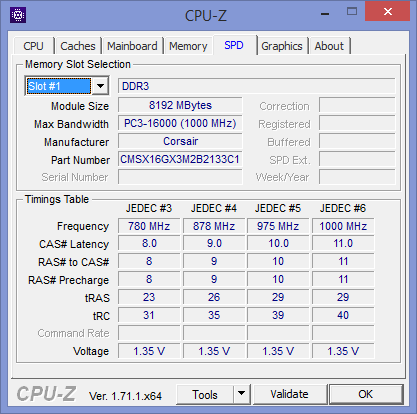
RAM is provided by four Corsair PC3-16000 DDR3 SODIMM modules overclocked at 1000 MHz for a total of 32 GB. Two of the four RAM slots are immediately accessible underneath the maintenance hatch and the other two are under the keyboard. Like last year's model, end-user accessibility to internal hardware is quick and easy with plenty of space inside.
Processor
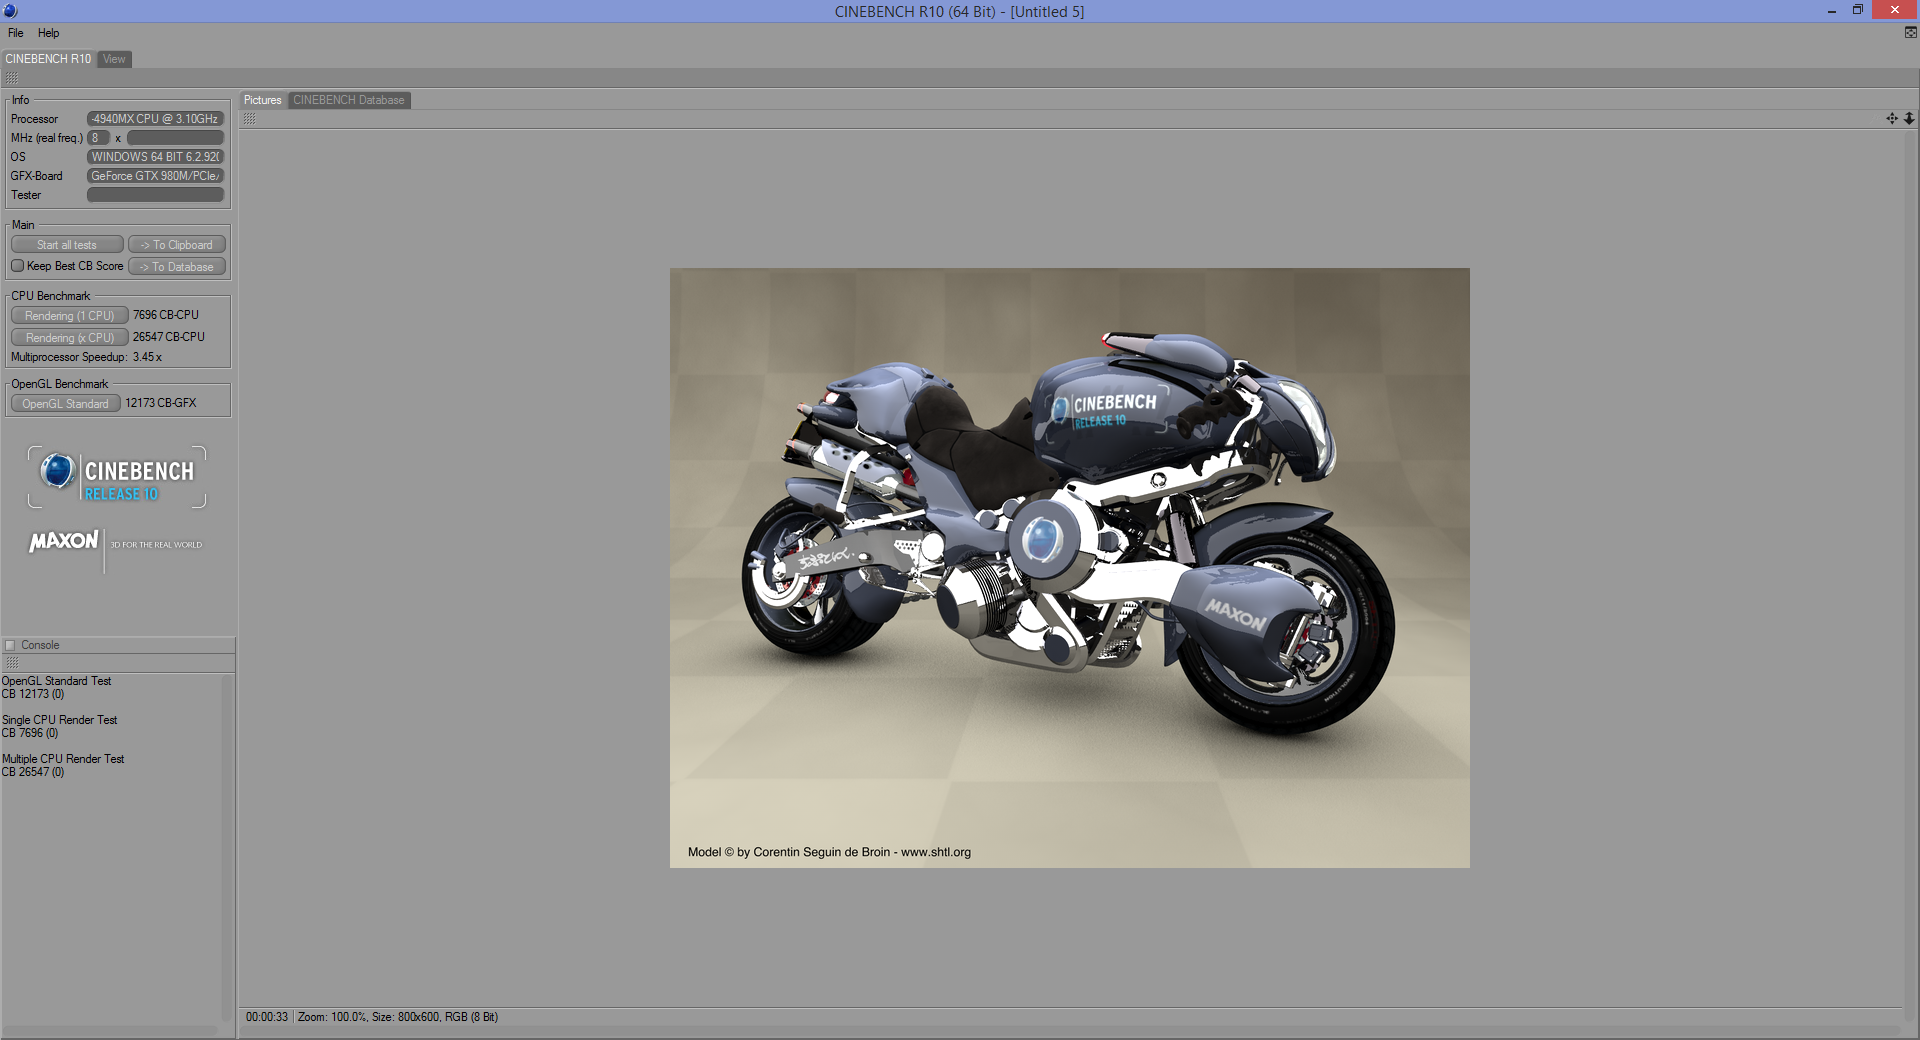
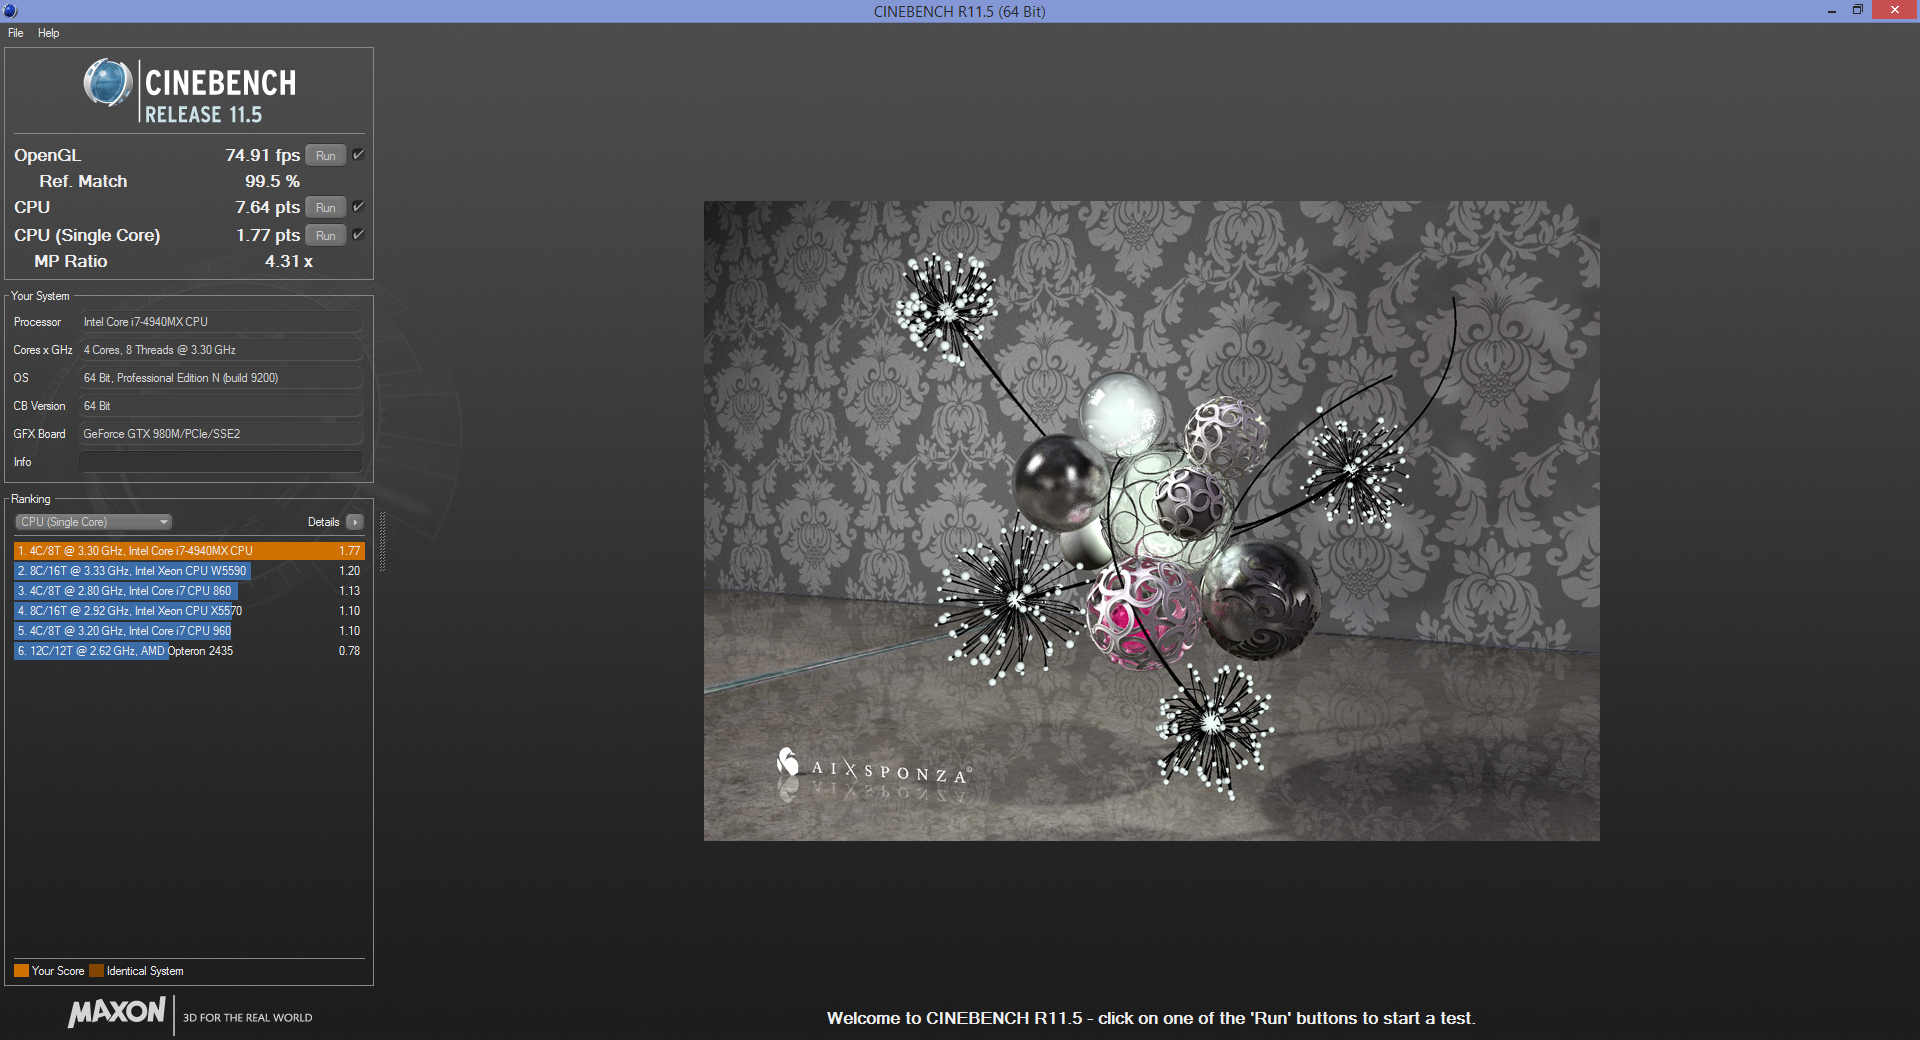
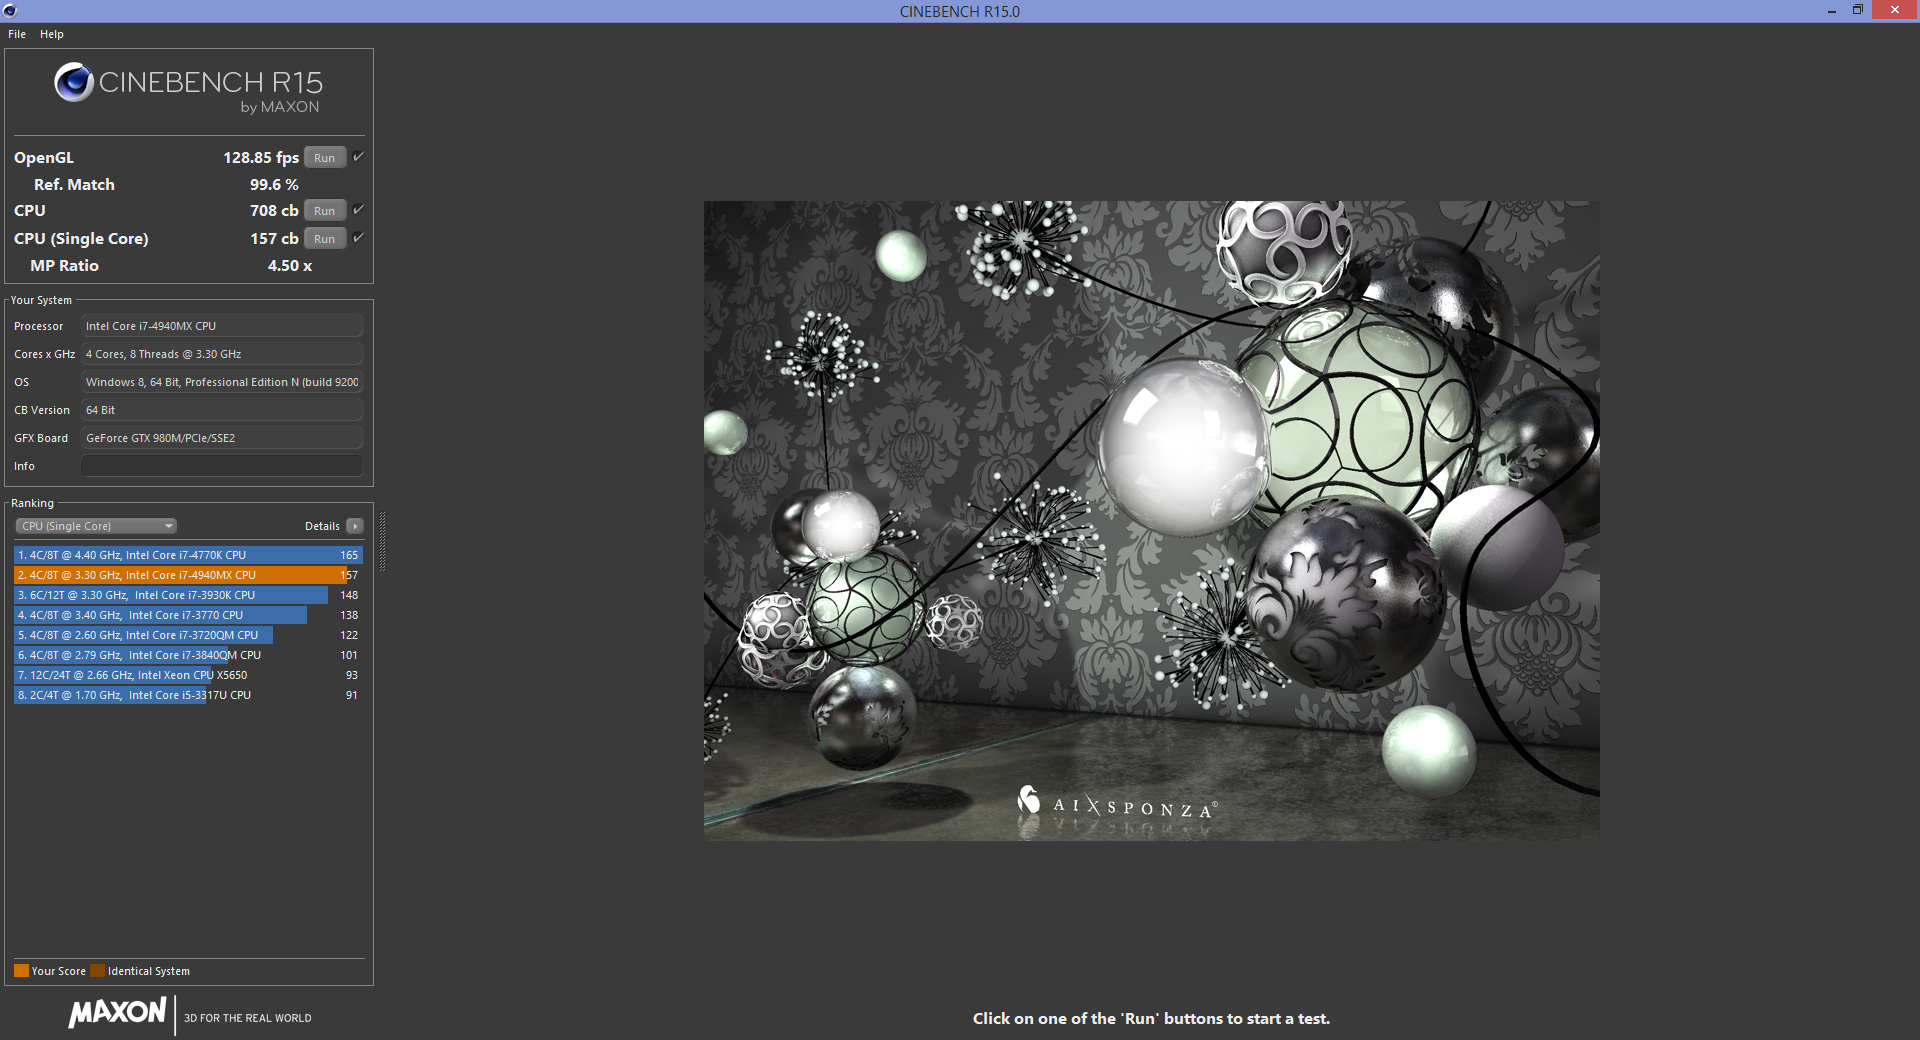
As the first system with the Core i7-4940MX in our database, the Eurocom X8 unsurprisingly tops out a good handful of benchmarks including CineBench single- and multi-core tests as well as wPrime and Super Pi. The benefits are somewhat marginal, however, even compared to high-end CPUs from the Ivy Bridge generation. For example, the X8 CineBench R11.5 Multi score of 7.67 points is less than 10 percent higher than the average i7-3920XM of 7.2 points. Single-core performance according to Super Pi 32M shows a similar result with a completion time of 491 seconds compared to 531 seconds from the average i7-3920XM. Performance differences against the i7-4930MX are even narrower as the i7-4940MX is only 100 MHz faster with equal cache sizes and features.
Compared to desktop CPUs, the i7-4940MX is most similar in performance to the i7-4770K. The mobile model trades blows with the desktop model quite well in both single- and multi-core benchmarks despite running on a lower TDP that is just two-thirds of the i7-4770K (57 W vs. 84 W). For more benchmarks and technical information on the i7-4940MX, see our dedicated CPU page here.
System Performance
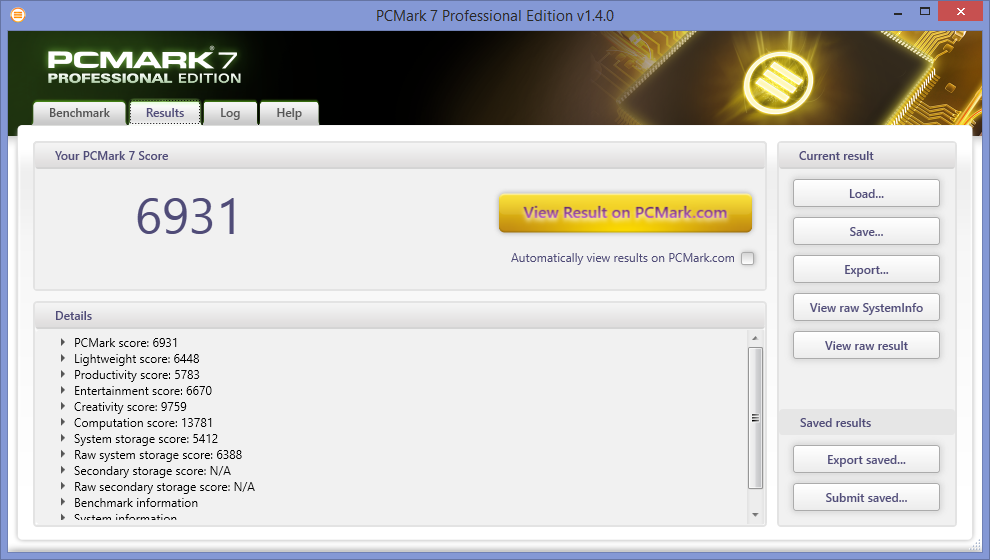
We use PCMark 7 to objectively assess system performance. Our standard PCMark 8 benchmarks (as of version 2.3.293) return errors and so will not be included in this review until the issues are resolved.
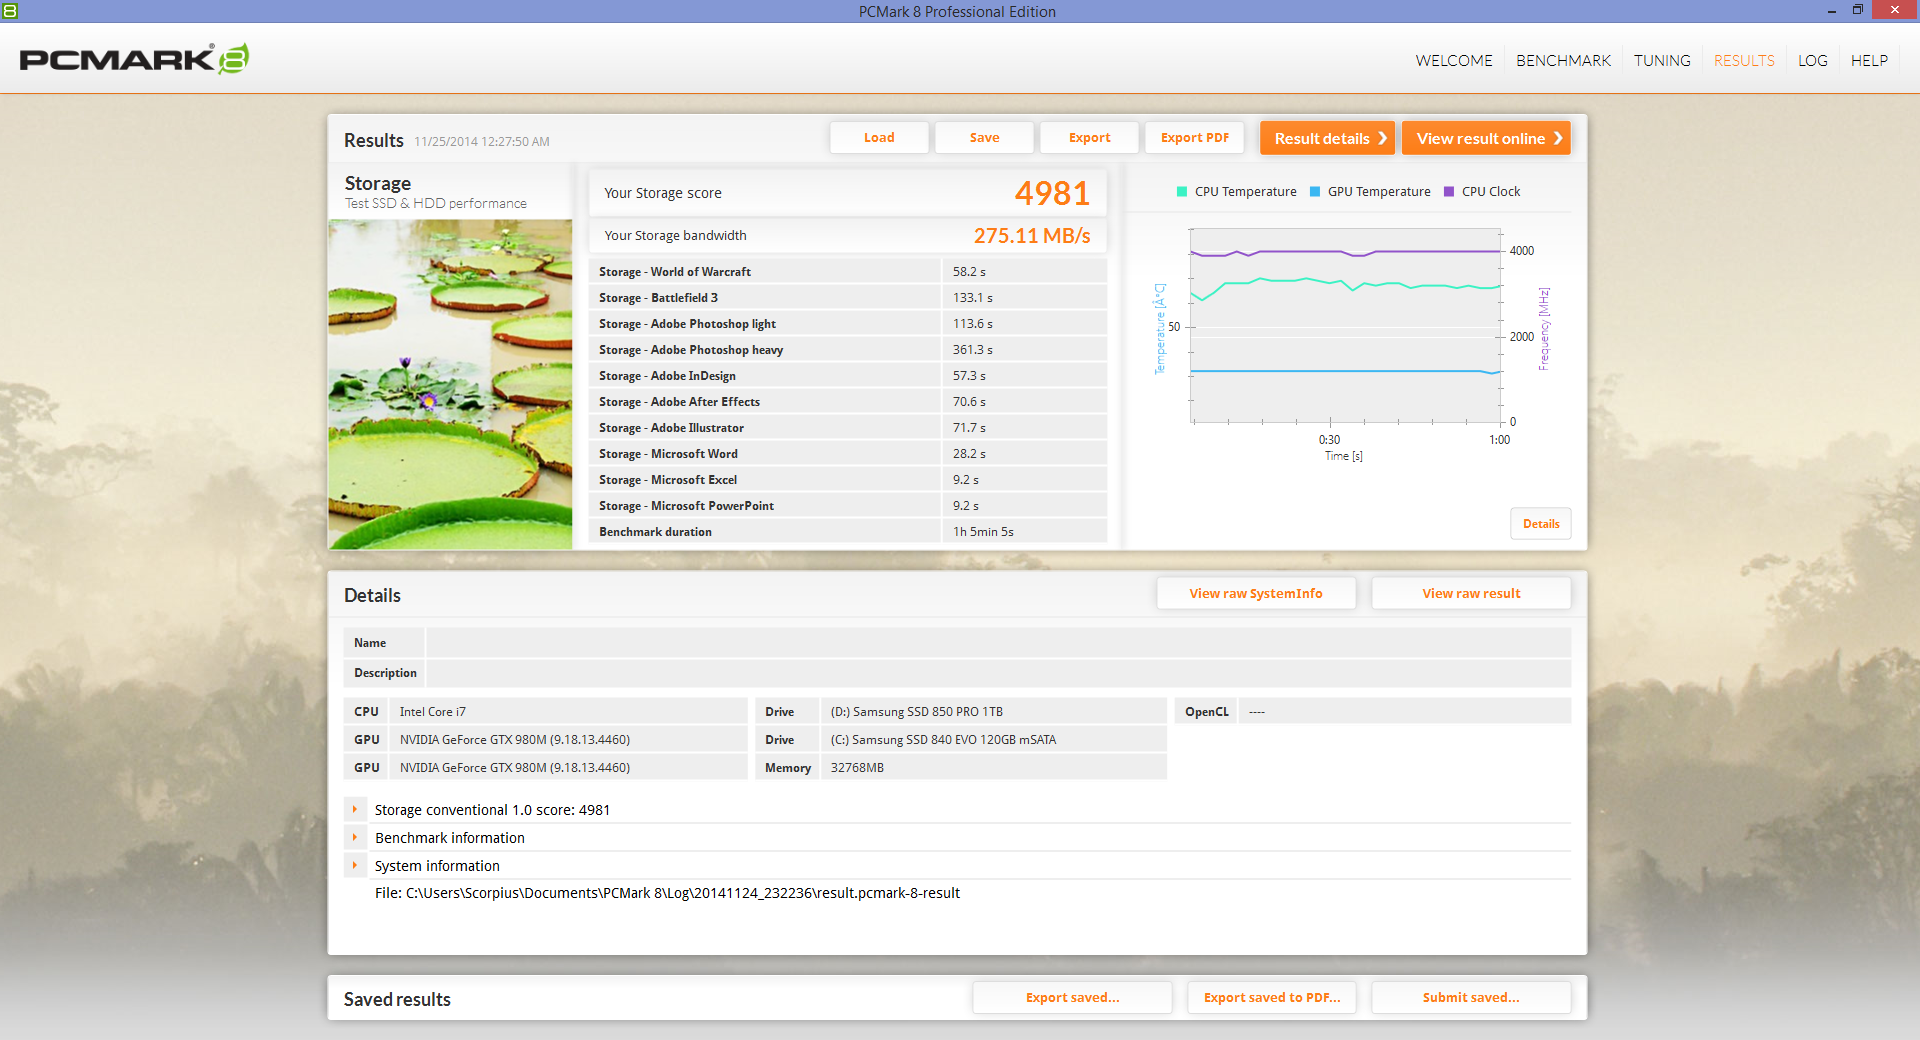
Our final PCMark 7 score of 6931 points is at the very top of our database as of this writing. The next closest model is coincidentally the Eurocom X7 (i7-4930MX and GTX 880M) with 6498 points. The X8 could have achieved even higher scores had we checked out a configuration with RAID 0 SSDs. Subjectively, this leads to lightning speeds when navigating and launching applications.
The Windows Experience Index shows a very balanced system across its major components; In other words, no one component scores significantly higher than the other. The hard disk score is a bit lower than the rest, so upgrading to RAID 0 solutions will benefit enthusiasts.
| PCMark 7 Score | 6931 points | |
Help | ||
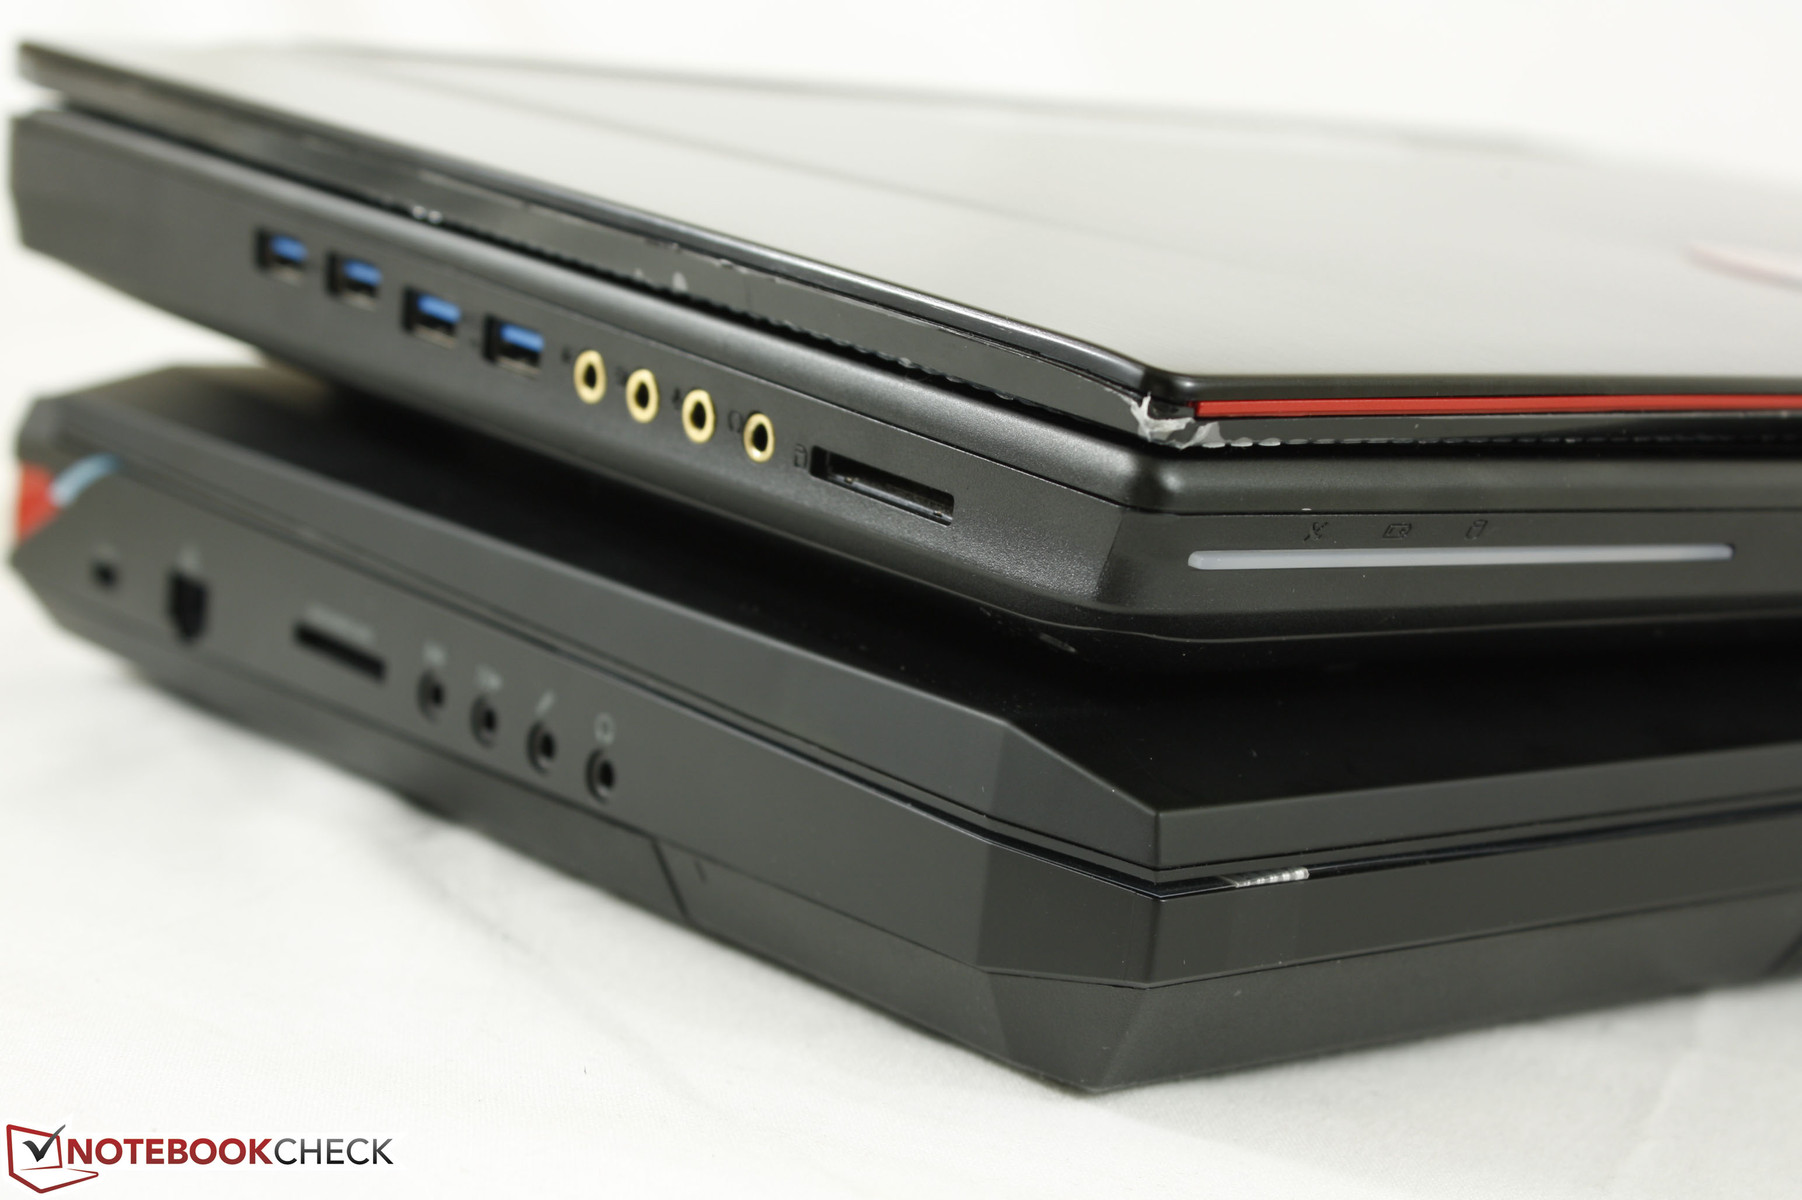
Storage Devices
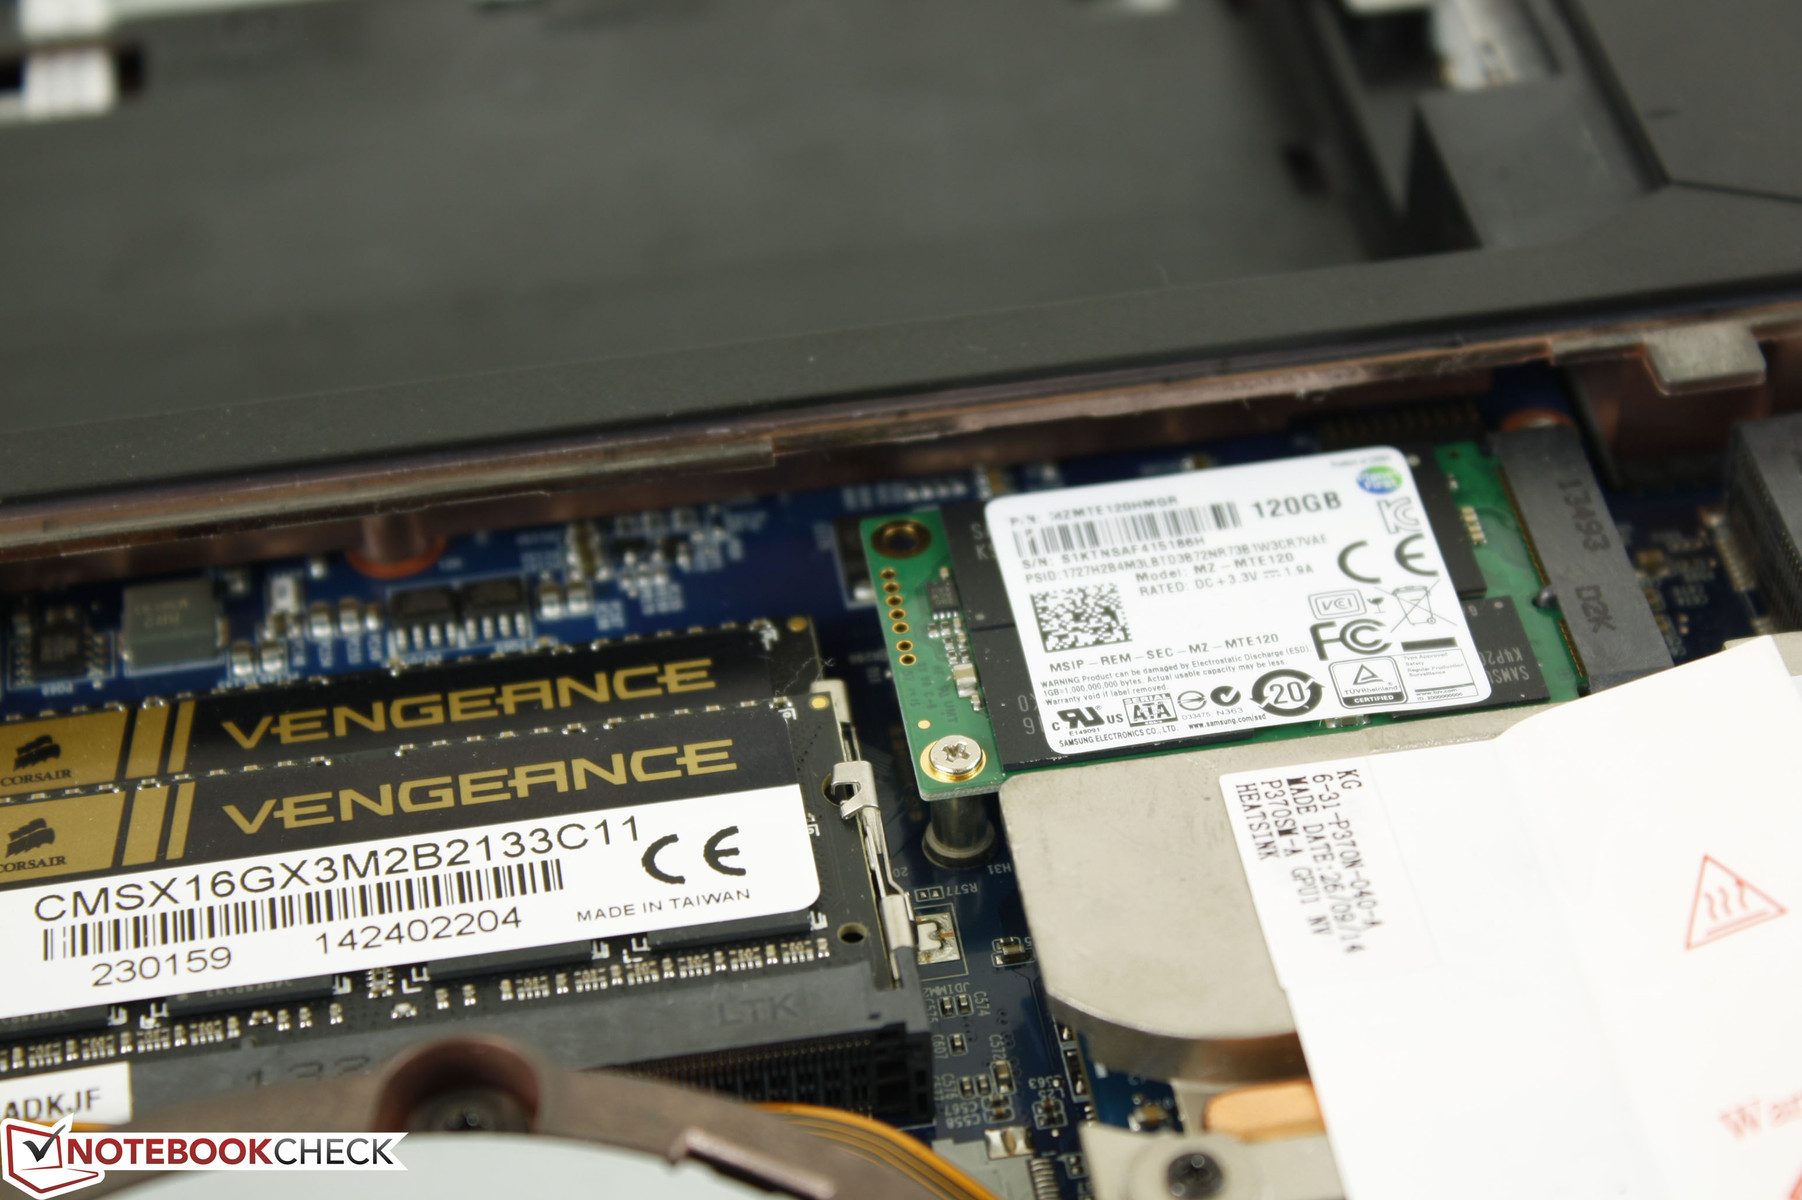
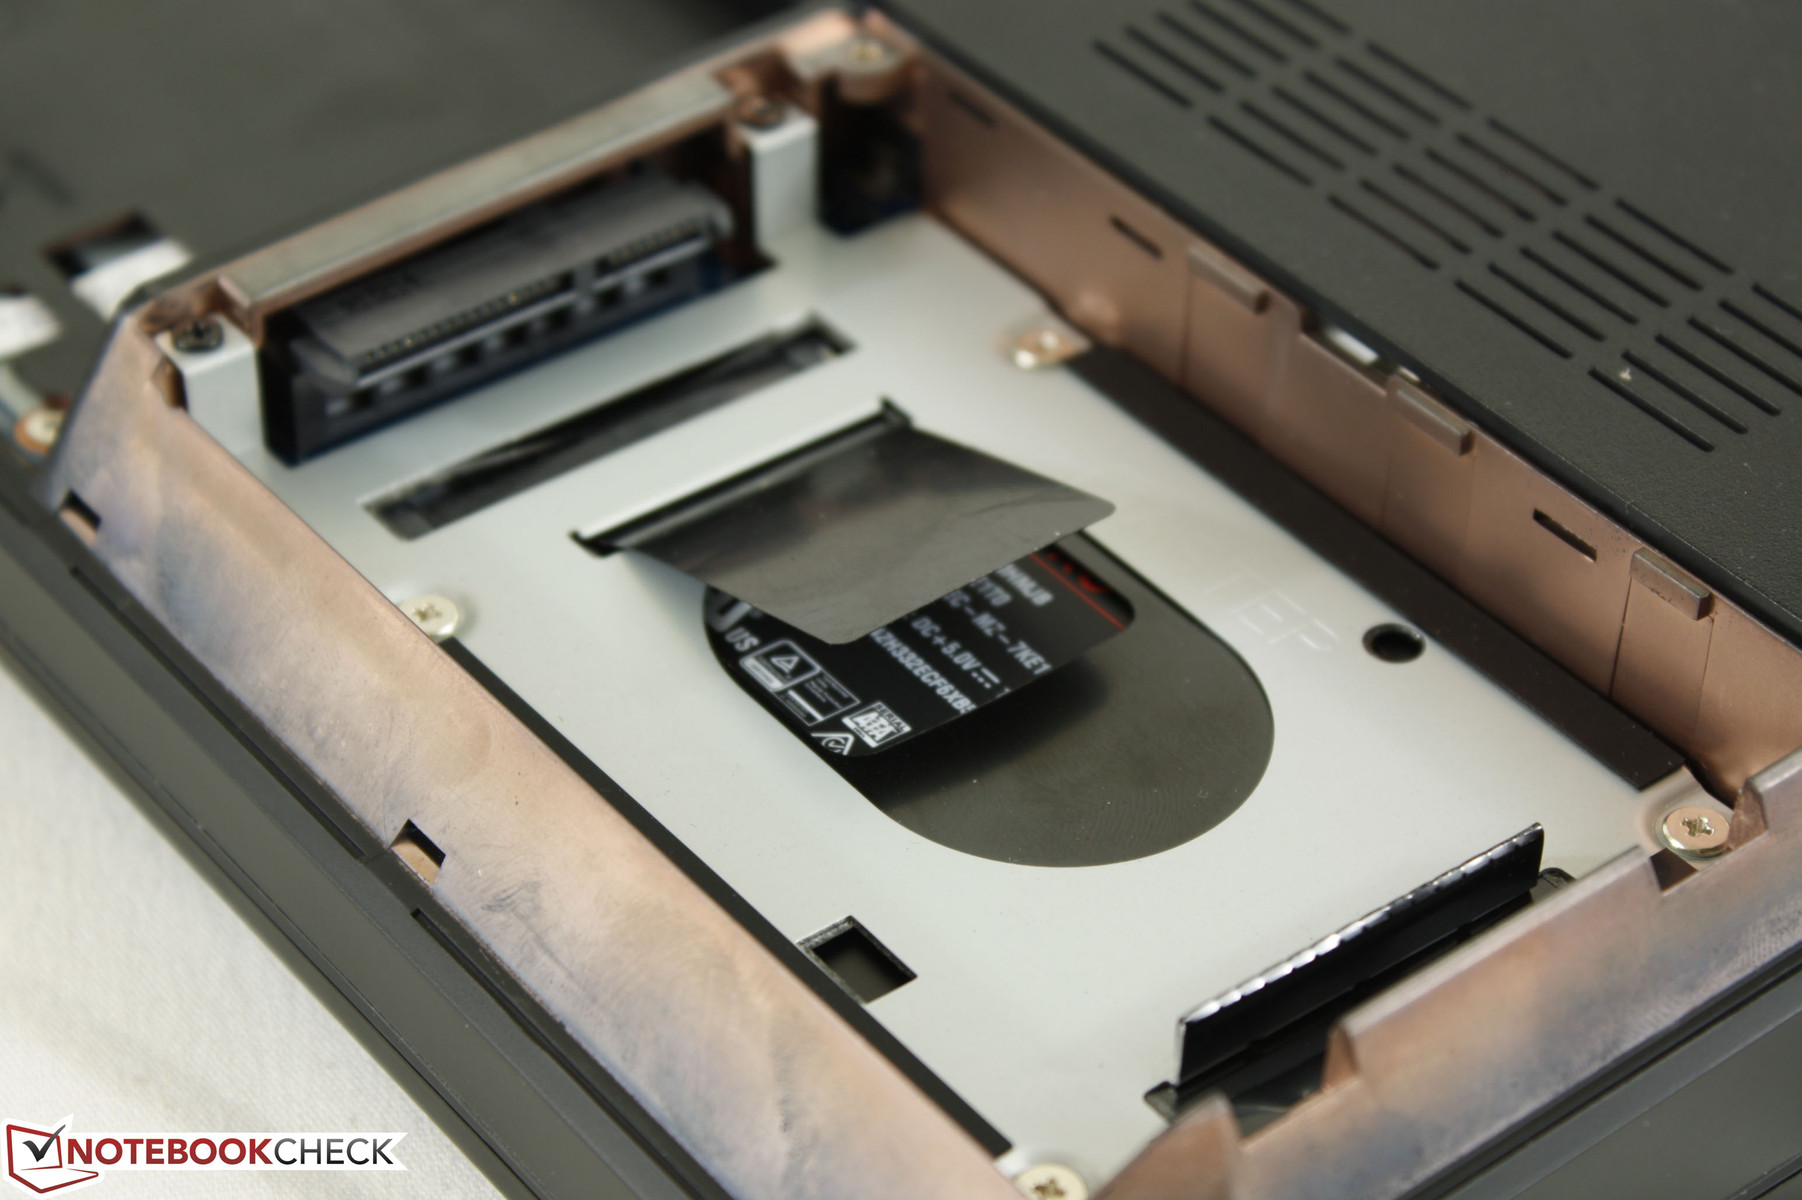
Like the X7 before it, the X8 can hold up to five independent storage drives: 2x mSATA, 2x SATA III, and 1x ODD in place of the standard optical drive. Furthermore, the mSATA and SATA drives are RAID 0/1/5/10 compatible. Eurocom offers a plethora of storage options and combinations ranging from 120 GB SSDs to 1 TB models. Note that one mSATA slot and both SATA III slots are immediately accessible from underneath the notebook; Direct access to the remaining mSATA and ODD slots will require additional disassembly.
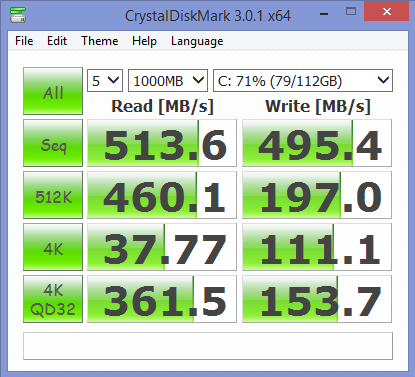
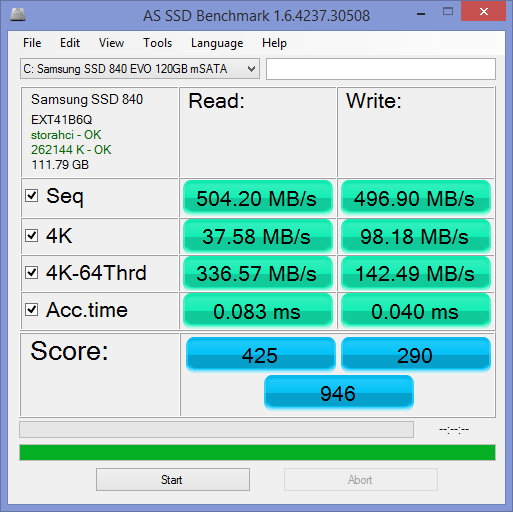
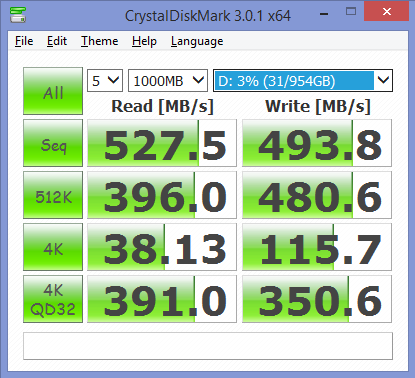
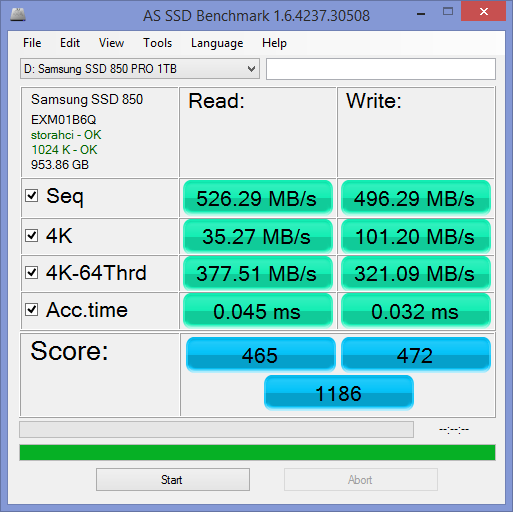
Our Samsung SSD 840 EVO 120 GB mSATA primary and 7 mm Samsung SSD 850 Pro 1 TB secondary return excellent scores in both Crystal Disk Mark and AS SSD. Sequential read and write rates of around 500 MB/s are normal for SATA III SSDs, but the 512K write performance of the SSD 850 stands out as extremely fast and above almost all current non-RAID SSDs in our database. Samsung advertises the SSD 850 Pro lineup as the world's first SSD with 3D vertical NAND technology for higher density and performance. Similarly, the primary SSD 840 has surprisingly fast 512K write performance that outclasses most other brands.
For a full list and benchmark comparison table of SSDs and HDDs, see our dedicated page here.

GPU Performance
The GTX 980M is Nvidia's crown jewel for the mobile market. It and the GTX 970M are only a few months old as of this writing and are the most powerful Maxwell cards for notebooks. Compared to the desktop GTX 970, the GTX 980M operates at a slightly lower base lower clock (1038 vs. 1050 MHz) with both fewer shaders (1536 vs. 1664) and Texture Mapping Units (96 vs. 104). The mobile model has twice the GDDR5 VRAM in return at 8192 MB vs 4096 MB of the GTX 970, which should help in rendering extreme texture packs as found on titles like Ryse, Titanfall, and Shadow of Mordor. For more technical information and benchmarks on the GTX 980M, please see our dedicated page here.
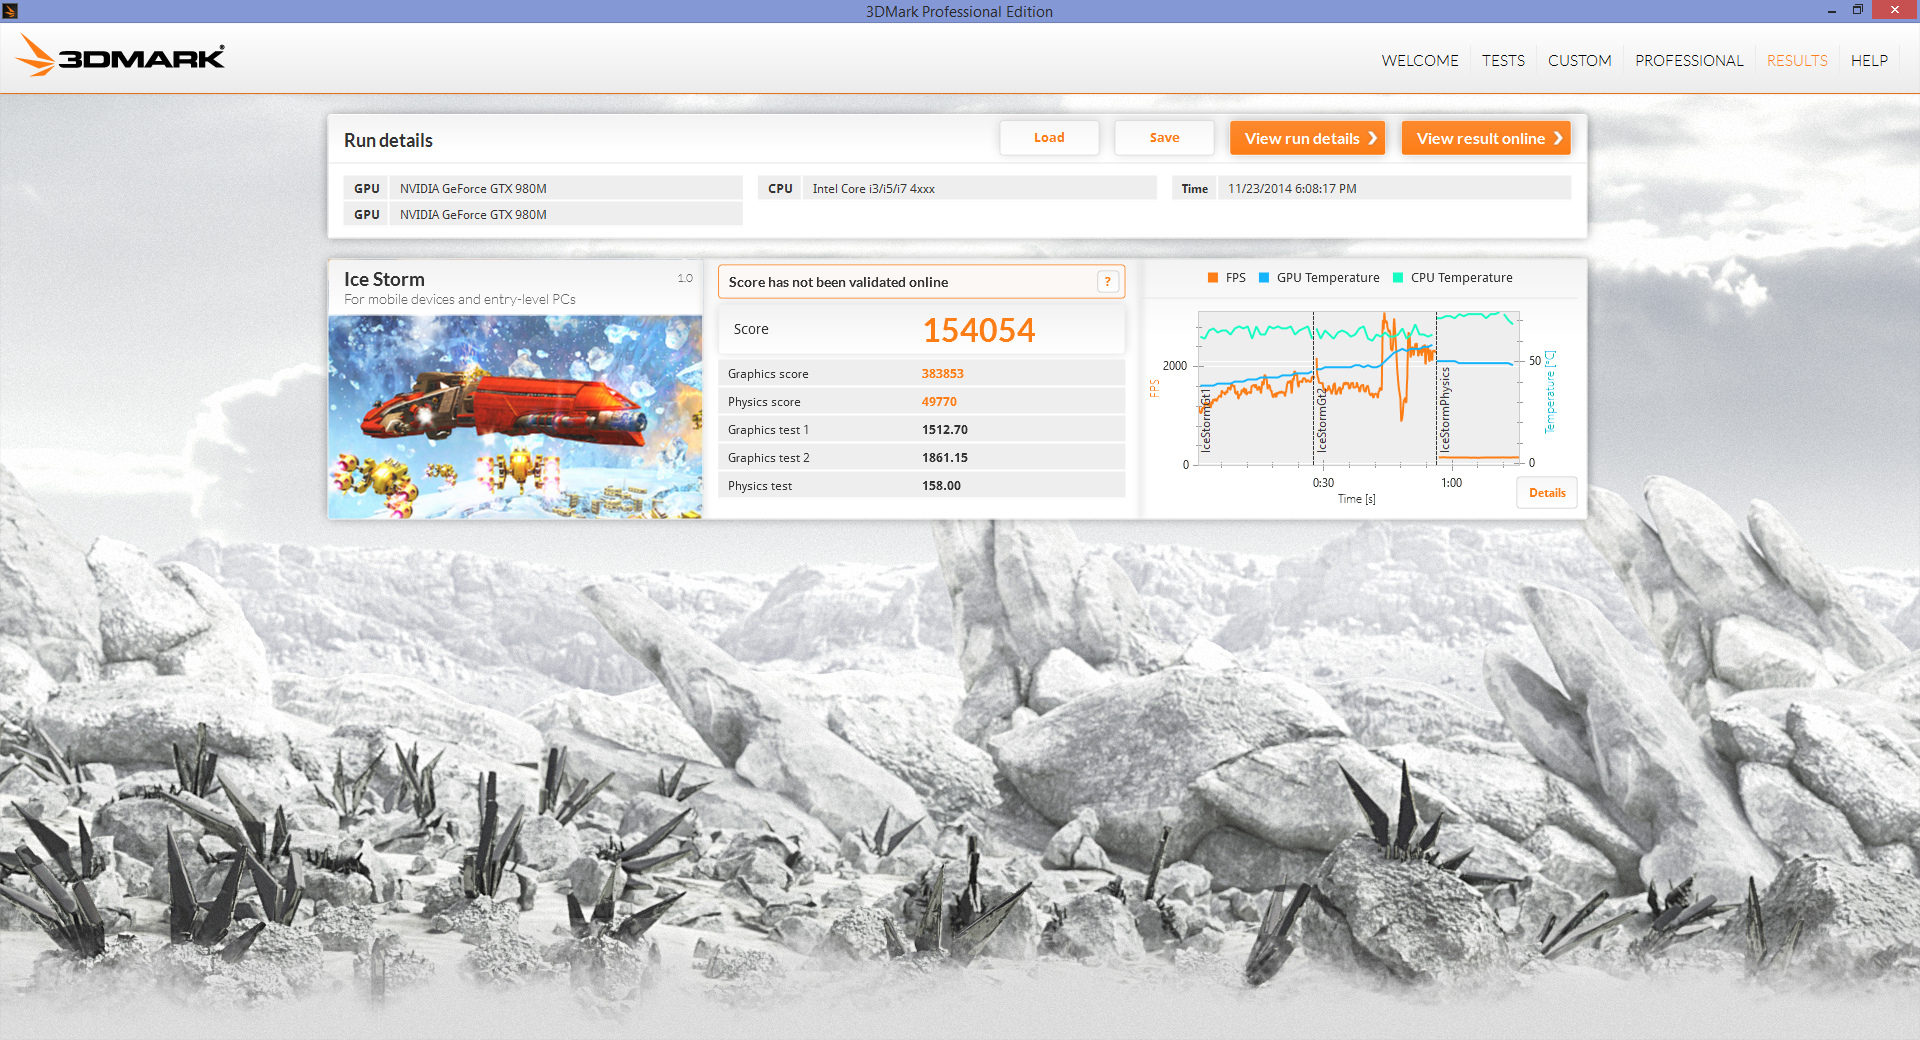
Synthetic benchmarks like 3DMark place the X8 at the top of our database. Our 3DMark 11 score of 16276 points, for example, is over 2000 points more than our next closest model: The Aorus X7 and its GTX 970M SLI graphics. 3DMark 2013 Fire Strike Standard is also about 24 percent higher on the X8 compared to the Aorus and almost twice as high as the MSI GT72 with a single GTX 980M (18400 vs. 9615 points), which shows very good SLI scaling.
| 3DMark 06 Standard Score | 26604 points | |
| 3DMark 11 Performance | 16276 points | |
| 3DMark Ice Storm Standard Score | 154054 points | |
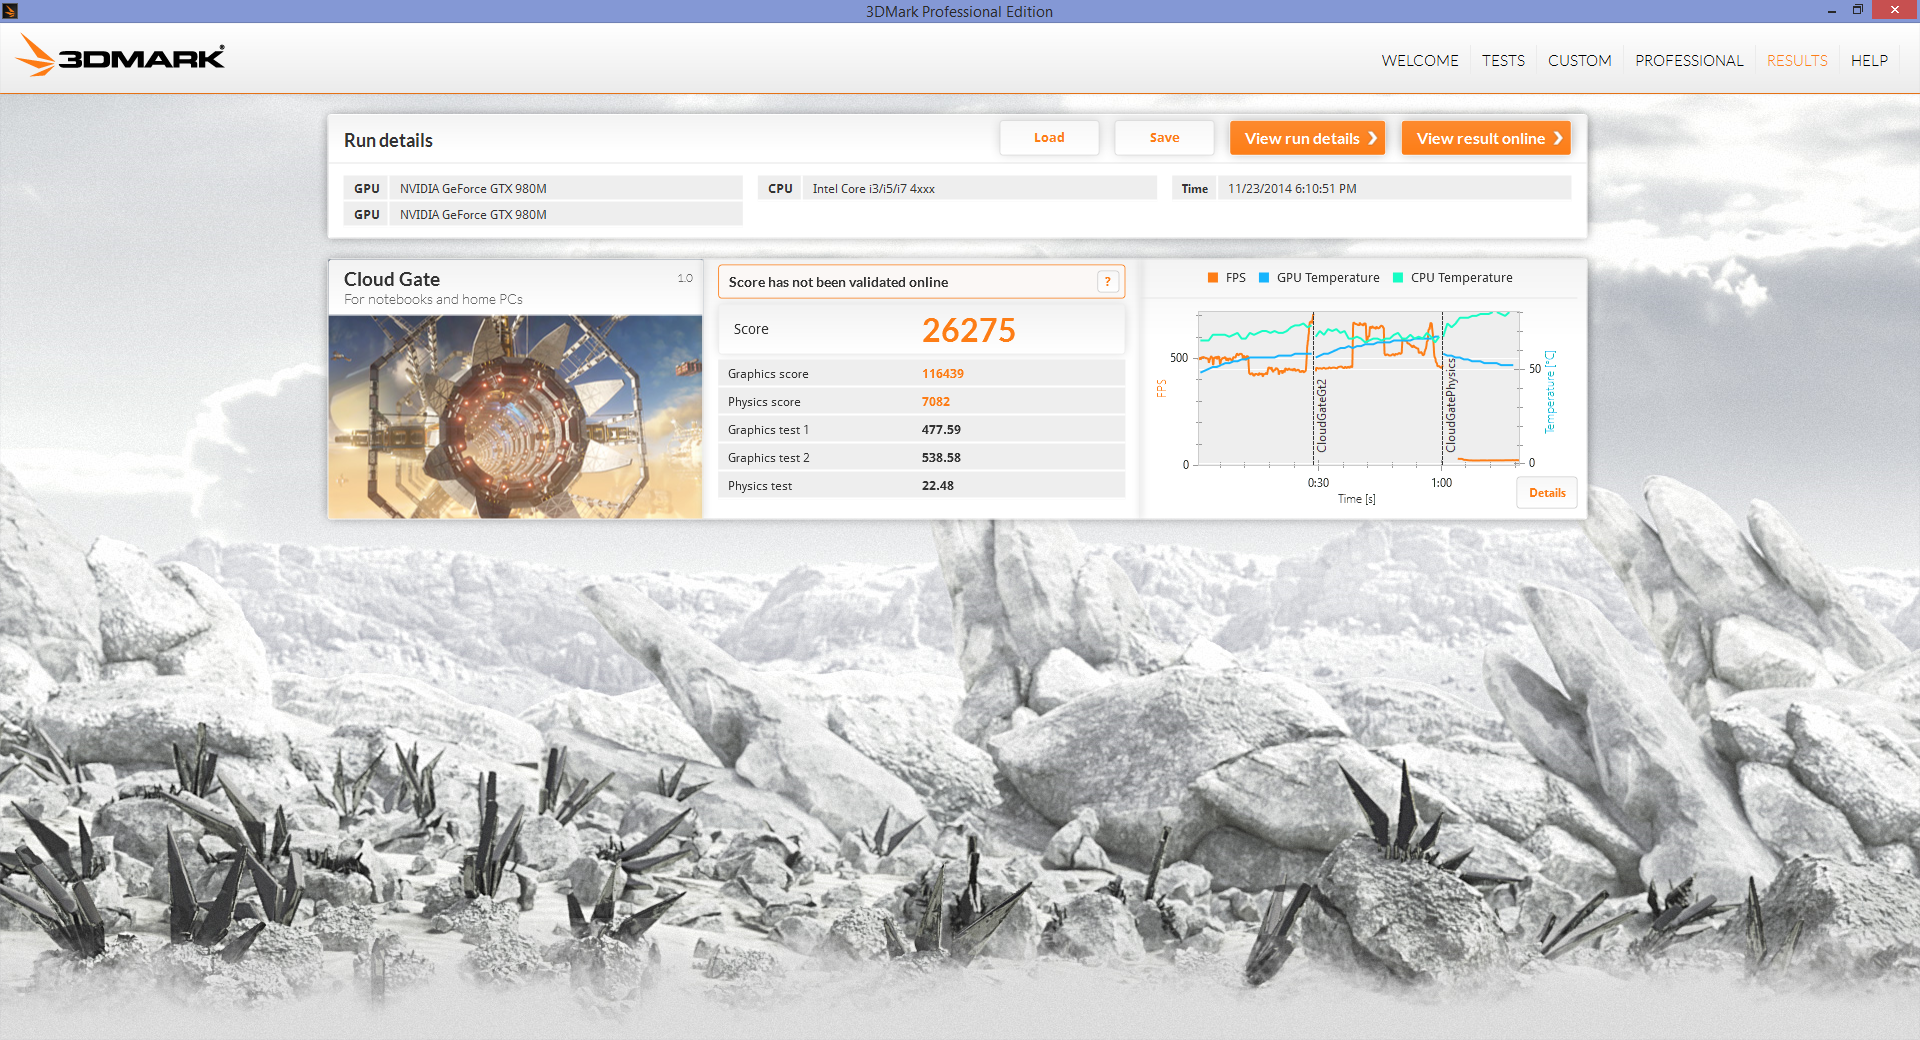
| 3DMark Cloud Gate Standard Score | 26275 points | |
| 3DMark Fire Strike Score | 13181 points | |
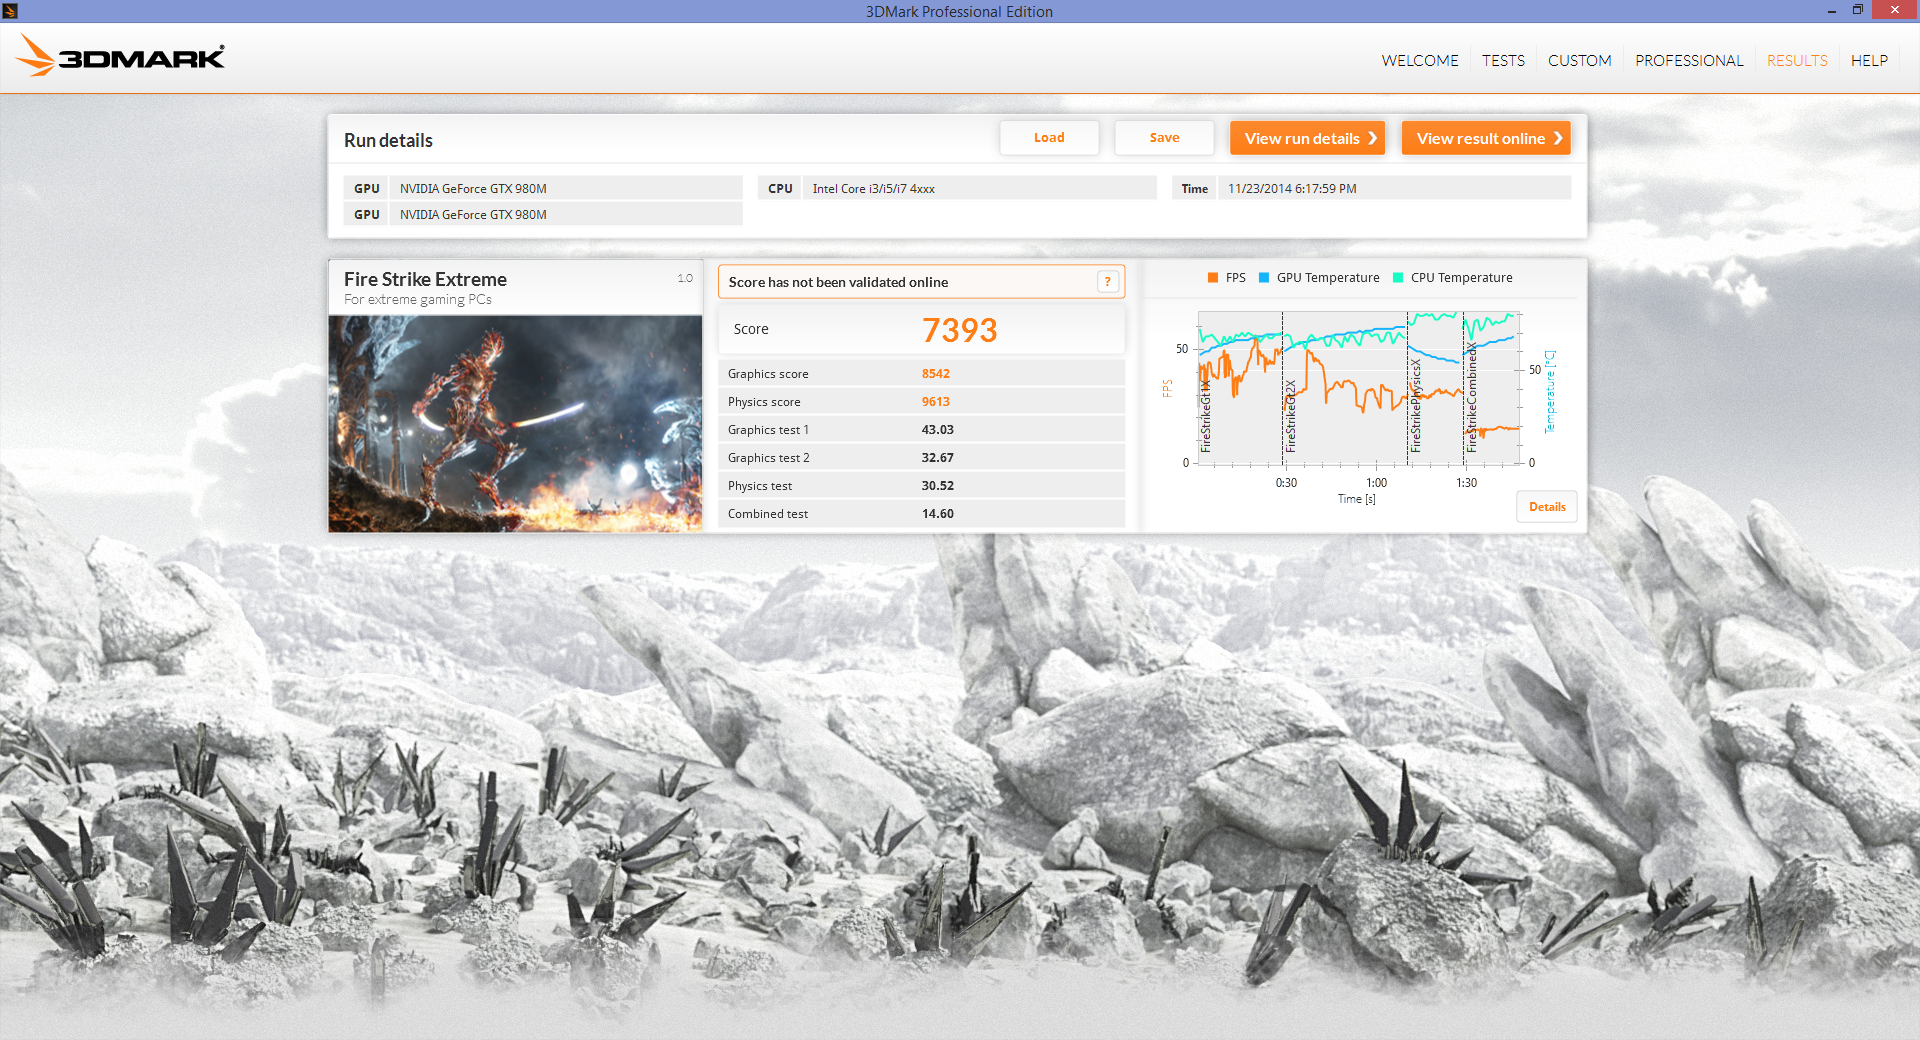
| 3DMark Fire Strike Extreme Score | 7393 points | |
Help | ||
Gaming Performance
A single GTX 980M is more than sufficient for 1080p gaming. Getting a locked 1080p60 experience on maximum settings, however, remains elusive on a few titles including Ryse and Watch Dogs. This can finally be achieved with a dual GTX 980M setup for those who are unsatisfied with anything less than a silky smooth 60 FPS experience.
The majority of titles like BioShock Infinite, Last Light, and Thief in particular show frame rate improvements of about 50 to 60 percent over a single GTX 980M. Other titles, however, show only marginal improvements. Advanced Warfare, for example, runs only 13 percent faster and Ryse only 19 percent faster. Though more frames are certainly welcomed, much larger improvements are expected from costly and power-hungry SLI systems like the X8. We fully expect that performance on a number of these games will increase overtime as new drivers and updates go live from Nvidia and publishers.


| low | med. | high | ultra | |
|---|---|---|---|---|
| Sleeping Dogs (2012) | 178 | 109 | ||
| Guild Wars 2 (2012) | 69 | 64 | ||
| Tomb Raider (2013) | 435 | 198 | ||
| StarCraft II: Heart of the Swarm (2013) | 141 | 92 | ||
| BioShock Infinite (2013) | 212 | 145 | ||
| Metro: Last Light (2013) | 125 | 95 | ||
| Company of Heroes 2 (2013) | 68 | 38 | ||
| Thief (2014) | 93 | 87 | ||
| GRID: Autosport (2014) | 163 | 145 | ||
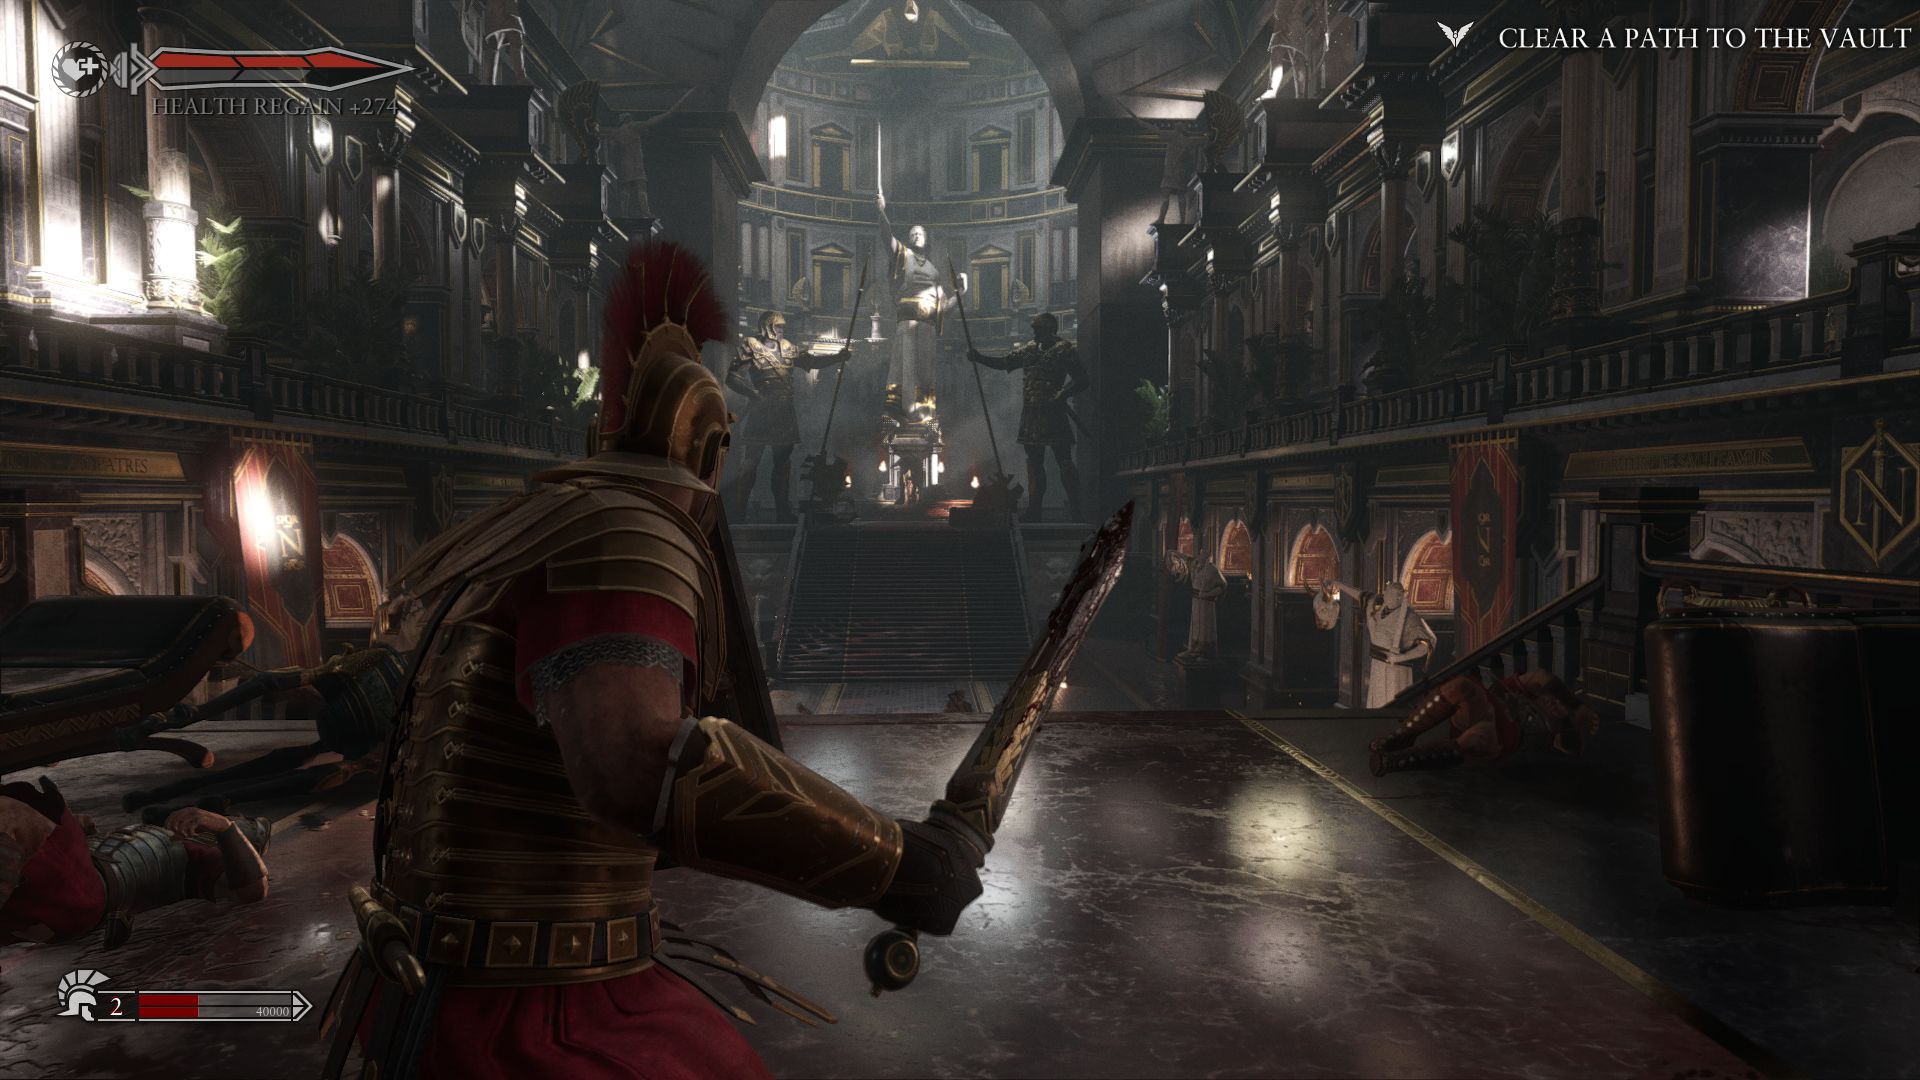
| Ryse: Son of Rome (2014) | 111 | 103 | ||
| F1 2014 (2014) | 117 | 102 | ||
| Call of Duty: Advanced Warfare (2014) | 114 | 69 | ||
| Dragon Age: Inquisition (2014) | 119 | 85 |
| Company of Heroes 2 | |
| 1920x1080 Maximum / Higher / High AA:High (sort by value) | |
| Eurocom X8 | |
| Alienware 18 | |
| Ibuypower GT72 Dominator | |
| 1366x768 High AA:Medium (sort by value) | |
| Eurocom X8 | |
| Alienware 18 | |
| Ibuypower GT72 Dominator | |
| 1366x768 Medium AA:Off (sort by value) | |
| Alienware 18 | |
| BioShock Infinite | |
| 1920x1080 Ultra Preset, DX11 (DDOF) (sort by value) | |
| Eurocom X8 | |
| Alienware 18 | |
| Alienware 17 (GTX 880M) | |
| Ibuypower GT72 Dominator | |
| Schenker XMG P724 | |
| Aorus X7 Pro | |
| 1366x768 High Preset (sort by value) | |
| Eurocom X8 | |
| Alienware 18 | |
| Alienware 17 (GTX 880M) | |
| Ibuypower GT72 Dominator | |
| Schenker XMG P724 | |
| Aorus X7 Pro | |
| 1366x768 Medium Preset (sort by value) | |
| Alienware 18 | |
| Schenker XMG P724 | |
| Aorus X7 Pro | |
| 1280x720 Very Low Preset (sort by value) | |
| Schenker XMG P724 | |
| Aorus X7 Pro | |
| GRID: Autosport | |
| 1920x1080 Ultra Preset AA:4x MS (sort by value) | |
| Eurocom X8 | |
| Ibuypower GT72 Dominator | |
| Aorus X7 Pro | |
| 1920x1080 High Preset (sort by value) | |
| Eurocom X8 | |
| Ibuypower GT72 Dominator | |
| Aorus X7 Pro | |
| 1366x768 Medium Preset (sort by value) | |
| Aorus X7 Pro | |
| 1024x768 Ultra Low Preset (sort by value) | |
| Aorus X7 Pro | |
| Metro: Last Light | |
| 1920x1080 Very High (DX11) AF:16x (sort by value) | |
| Eurocom X8 | |
| Alienware 18 | |
| Alienware 17 (GTX 880M) | |
| Gigabyte P35X v3 | |
| Ibuypower GT72 Dominator | |
| Schenker XMG P724 | |
| Aorus X7 Pro | |
| 1366x768 High (DX11) AF:16x (sort by value) | |
| Eurocom X8 | |
| Alienware 18 | |
| Alienware 17 (GTX 880M) | |
| Gigabyte P35X v3 | |
| Ibuypower GT72 Dominator | |
| Schenker XMG P724 | |
| Aorus X7 Pro | |
| 1366x768 Medium (DX10) AF:4x (sort by value) | |
| Alienware 18 | |
| Gigabyte P35X v3 | |
| Schenker XMG P724 | |
| Aorus X7 Pro | |
| 1024x768 Low (DX10) AF:4x (sort by value) | |
| Gigabyte P35X v3 | |
| Schenker XMG P724 | |
| Aorus X7 Pro | |
| Thief | |
| 1920x1080 Very High Preset AA:FXAA & High SS AF:8x (sort by value) | |
| Eurocom X8 | |
| Alienware 17 (GTX 880M) | |
| Ibuypower GT72 Dominator | |
| Schenker XMG P724 | |
| Aorus X7 Pro | |
| 1366x768 High Preset AA:FXAA & Low SS AF:4x (sort by value) | |
| Eurocom X8 | |
| Alienware 17 (GTX 880M) | |
| Ibuypower GT72 Dominator | |
| Schenker XMG P724 | |
| Aorus X7 Pro | |
| 1366x768 Normal Preset AA:FX (sort by value) | |
| Schenker XMG P724 | |
| Aorus X7 Pro | |
| 1024x768 Very Low Preset (sort by value) | |
| Schenker XMG P724 | |
| Aorus X7 Pro | |
| Tomb Raider | |
| 1920x1080 Ultra Preset AA:FX AF:16x (sort by value) | |
| Eurocom X8 | |
| Alienware 18 | |
| Alienware 17 (GTX 880M) | |
| Ibuypower GT72 Dominator | |
| Schenker XMG P724 | |
| Aorus X7 Pro | |
| 1366x768 High Preset AA:FX AF:8x (sort by value) | |
| Eurocom X8 | |
| Alienware 18 | |
| Alienware 17 (GTX 880M) | |
| Ibuypower GT72 Dominator | |
| Schenker XMG P724 | |
| Aorus X7 Pro | |
| 1366x768 Normal Preset AA:FX AF:4x (sort by value) | |
| Alienware 18 | |
| Schenker XMG P724 | |
| Aorus X7 Pro | |
| 1024x768 Low Preset (sort by value) | |
| Schenker XMG P724 | |
| Aorus X7 Pro | |
| Call of Duty: Advanced Warfare | |
| 1920x1080 Extra / On (Cache Shadow Maps Off), 2x Supersampling AA:2x SM (sort by value) | |
| Eurocom X8 | |
| Gigabyte P35X v3 | |
| Ibuypower GT72 Dominator | |
| 1920x1080 High / On (Cache Shadow Maps Off) AA:FX (sort by value) | |
| Eurocom X8 | |
| Gigabyte P35X v3 | |
| Ibuypower GT72 Dominator | |
| 1366x768 Normal / On (Cache Shadow Maps Off) (sort by value) | |
| Gigabyte P35X v3 | |
| 1024x768 Low / Off (Shader Preload On) (sort by value) | |
| Gigabyte P35X v3 | |
| Sleeping Dogs | |
| 1920x1080 Extreme Preset AA:Extreme (sort by value) | |
| Eurocom X8 | |
| Alienware 18 | |
| Alienware 17 (GTX 880M) | |
| Ibuypower GT72 Dominator | |
| 1366x768 High Preset AA:High (sort by value) | |
| Eurocom X8 | |
| Alienware 18 | |
| Alienware 17 (GTX 880M) | |
| Ibuypower GT72 Dominator | |
| 1366x768 Medium Preset AA:Normal (sort by value) | |
| Alienware 18 | |
| Ryse: Son of Rome | |
| 1920x1080 Very High Texture Res. + High Graphics Quality (Motion Blur & Temporal AA On, Rest Off/Disabled) AF:8x (sort by value) | |
| Eurocom X8 | |
| Ibuypower GT72 Dominator | |
| Aorus X7 Pro | |
| 1920x1080 High Texture Res. + High Graphics Quality (Rest Off/Disabled) AF:8x (sort by value) | |
| Eurocom X8 | |
| Ibuypower GT72 Dominator | |
| Aorus X7 Pro | |
| 1366x768 Medium Texture Res. + Normal Graphics Quality (Rest Off/Disabled) AF:4x (sort by value) | |
| Aorus X7 Pro | |
| 1024x768 Low Texture Res. + Low Graphics Quality (Rest Off/Disabled) AF:2x (sort by value) | |
| Aorus X7 Pro | |
| Guild Wars 2 | |
| 1920x1080 All Maximum / On AA:FX (sort by value) | |
| Eurocom X8 | |
| Alienware 18 | |
| Gigabyte P35X v3 | |
| Ibuypower GT72 Dominator | |
| Schenker XMG P724 | |
| Aorus X7 Pro | |
| 1366x768 Best Appearance Preset AA:FX (sort by value) | |
| Eurocom X8 | |
| Alienware 18 | |
| Gigabyte P35X v3 | |
| Ibuypower GT72 Dominator | |
| Schenker XMG P724 | |
| Aorus X7 Pro | |
| 1024x768 Best Performance Preset (sort by value) | |
| Gigabyte P35X v3 | |
| Schenker XMG P724 | |
| Aorus X7 Pro | |
Stress Test
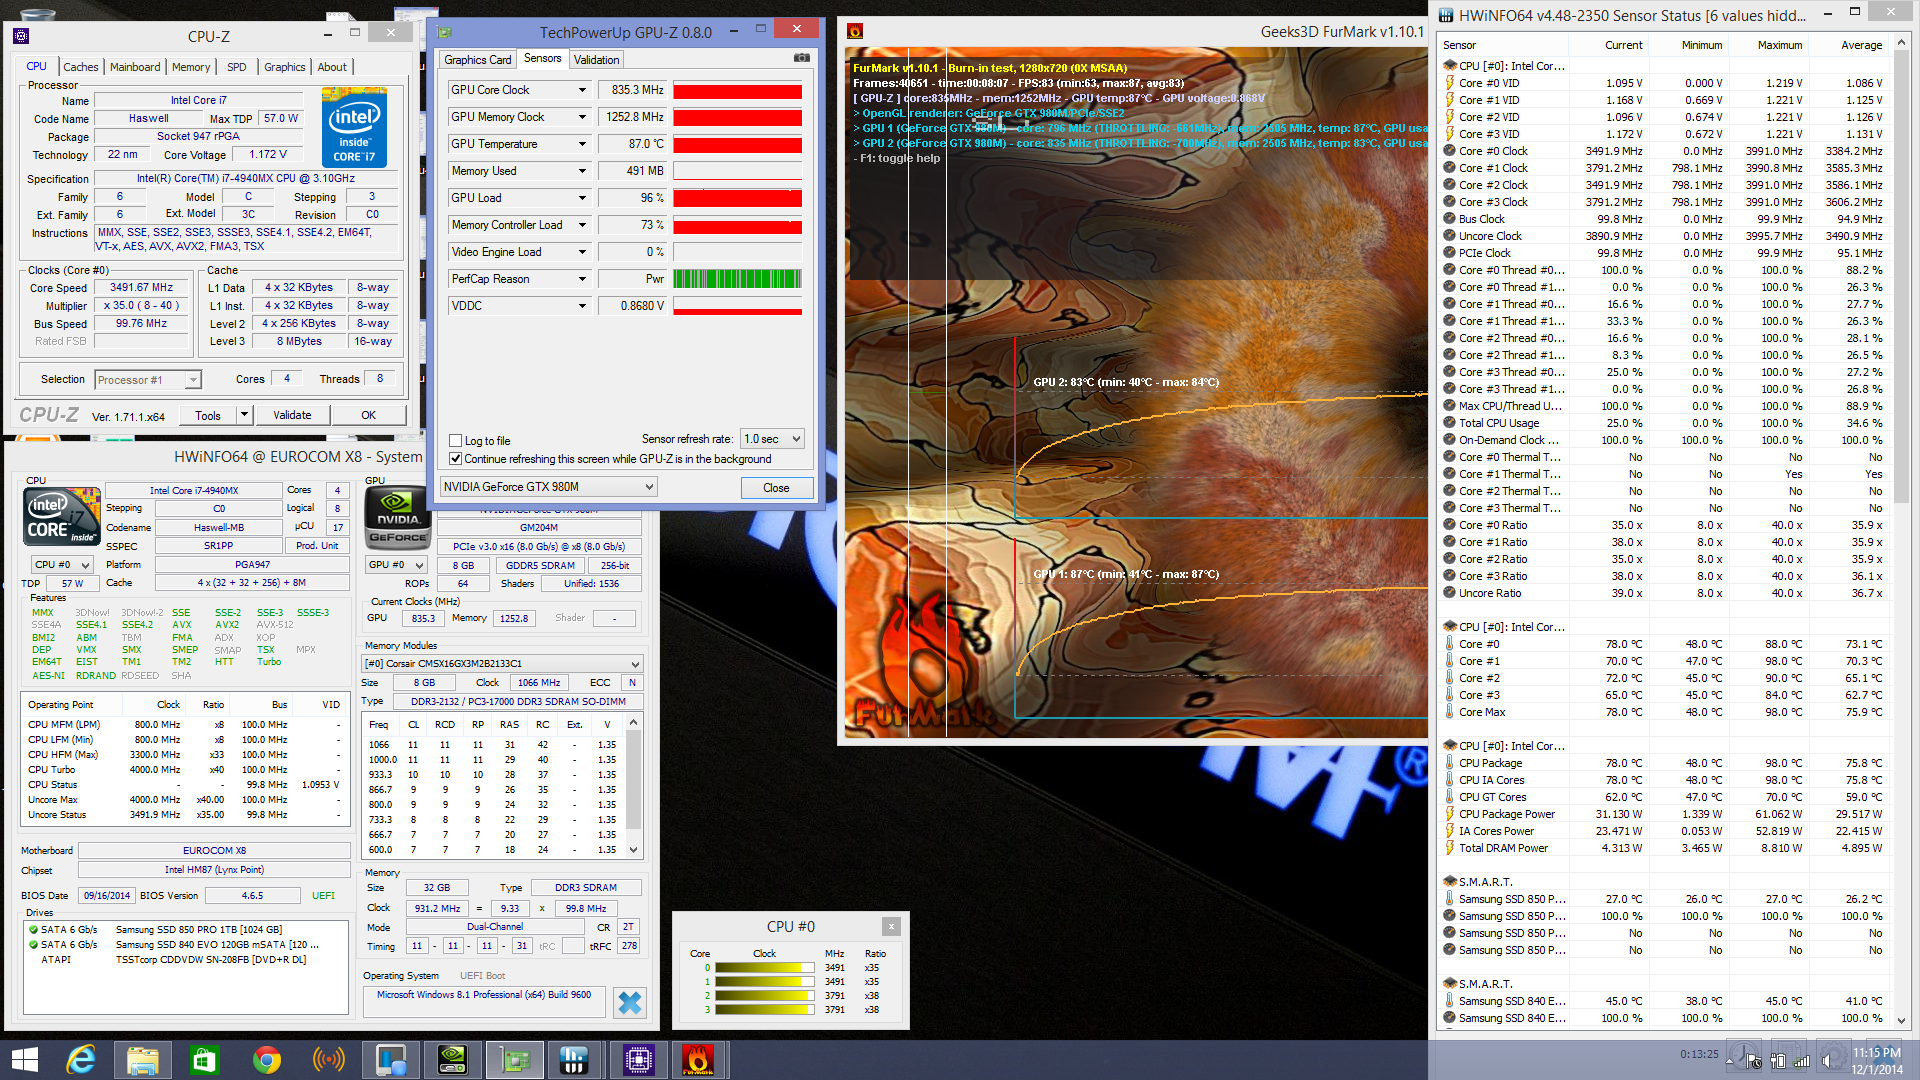
We use Prime95 and FurMark to stress the X8 with CPU-Z, GPU-Z, and HWiNFO monitoring tools active to identify any throttling or stability issues. With only Prime95 active, we can observe the CPU running at 3.2 to 3.5 GHz consistently, which is notably below its 3.8 GHz Turbo Boost speed. Core temperatures also jump quickly to 90 degrees C or more.
With only FurMark active to stress the GPU, the Nvidia cards can be seen running at 923.9 MHz each. This slowly dips after the first few minutes until finally settling at 835.3 MHz, which is slightly below its base clock of 1038 MHz. Core temperature peaks at about 87 degrees C.
When both Prime95 and FurMark are running simultaneously, both the CPU and GPU drop further in speed down to a stable 2.8 to 3.2 GHz and 797.3 MHz, respectively. While this is well below their base clock rates, the throttling should have no gaming repercussions as a 3DMark 11 run immediately following the stress test shows no drop in final scores.
Running on batteries will impact performance significantly. 3DMark 11 score drops by almost 10000 points from 16160 on mains to just 6460 on battery power under the High Performance profile. As is normal amongst powerful gaming laptops, both the CPU and GPU are throttled on battery power, in this case down to 1.9 GHz and 594.8 MHz or lower, respectively. VRAM is affected as well and is reduced to just 800 MHz. Plugging the system back to an outlet via its large 330 W power adapter will immediately return these components back to their normal operating speeds.
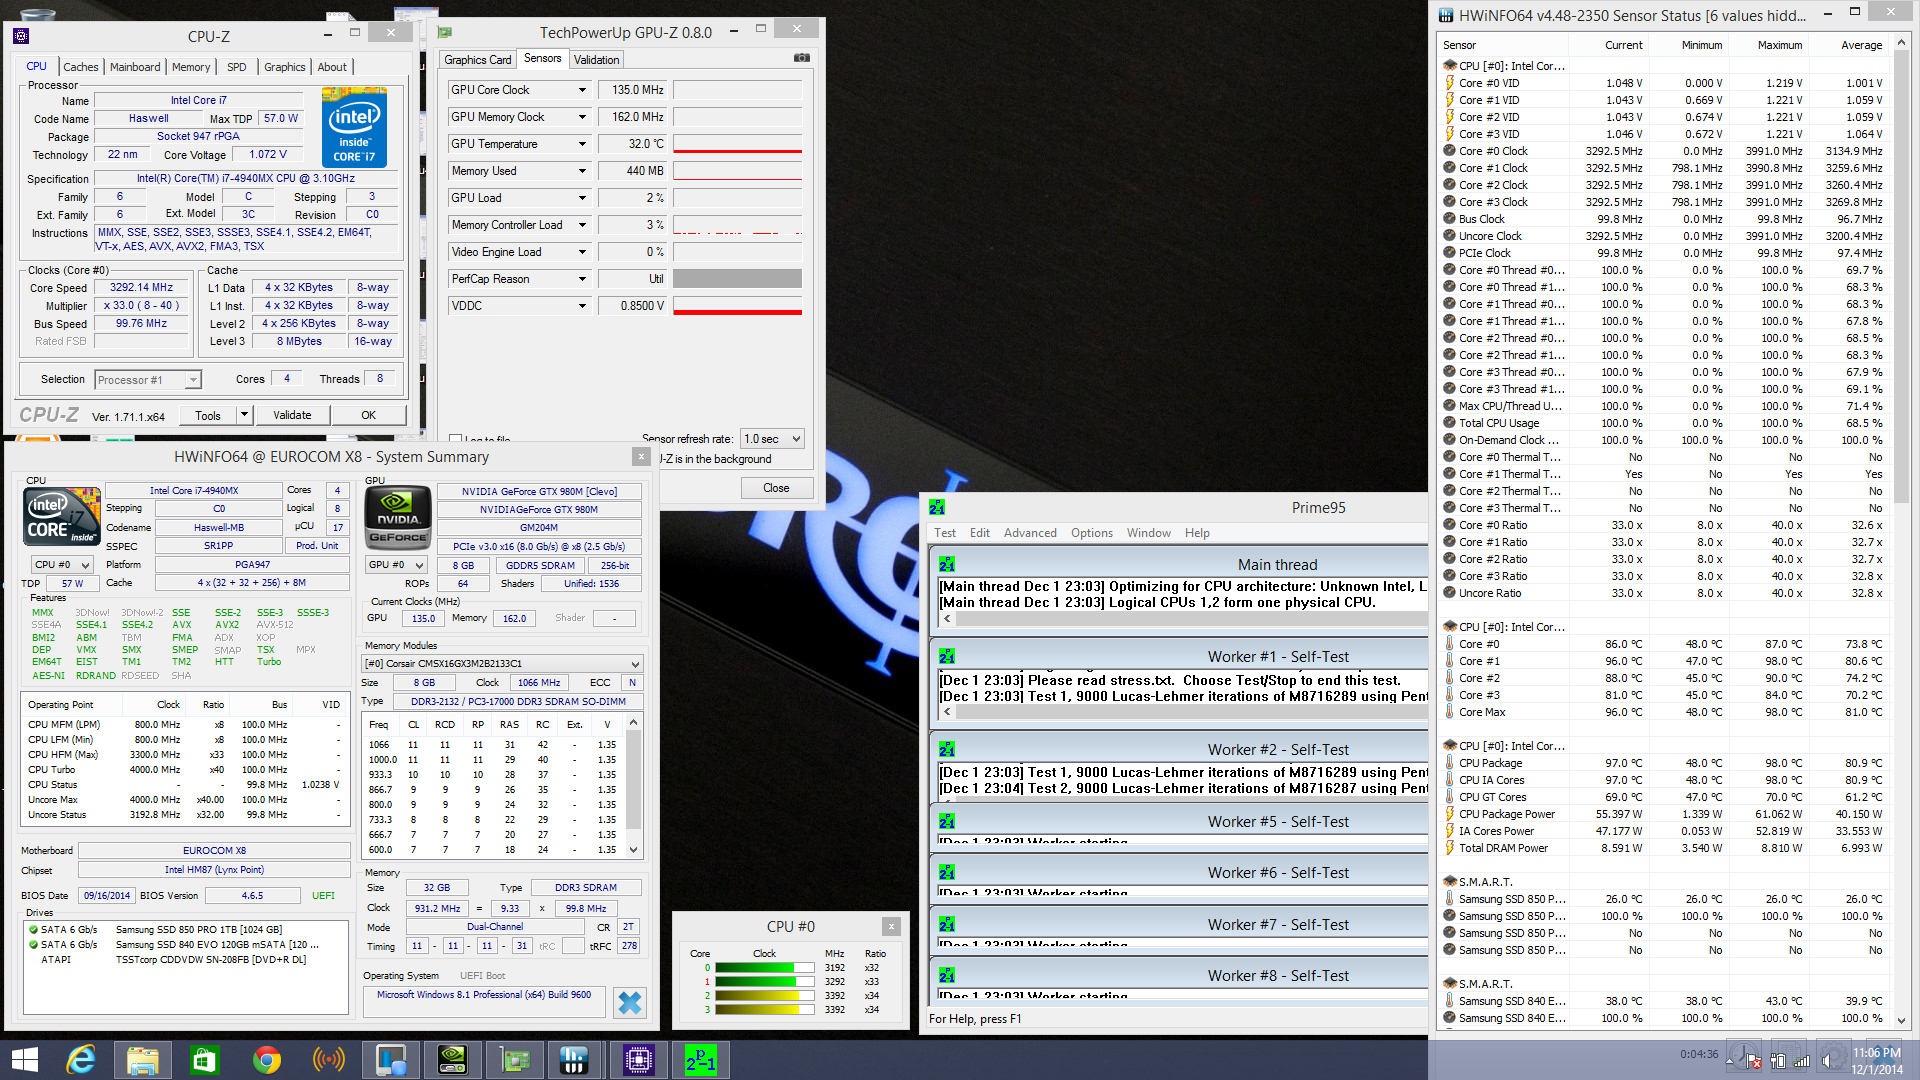
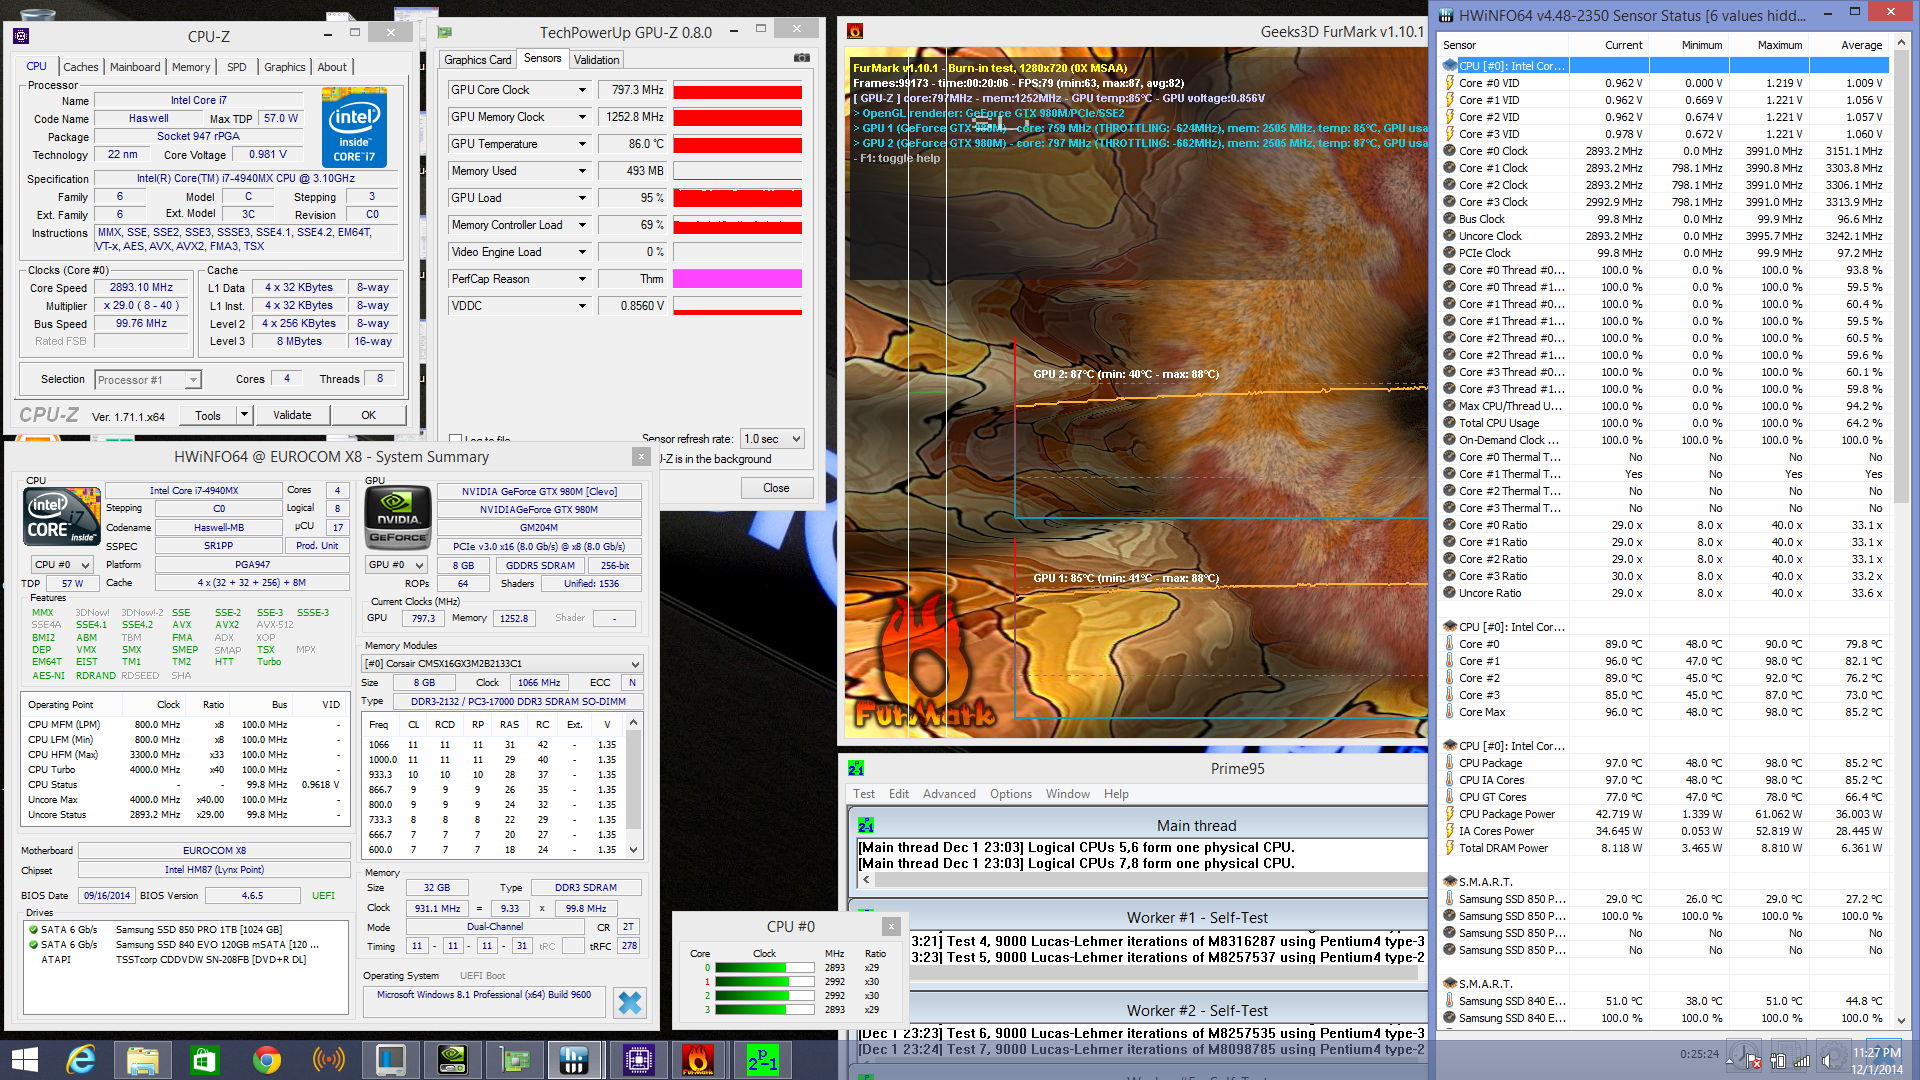

Since Prime95 and FurMark are unrepresentative of real-world use, we stress test again with Unigine Heaven 4.0 instead to better reflect 3D gaming conditions. The CPU performs much faster under these conditions reaching a steady 3.5 to 3.9 GHz clock rate. Unlike our Prime95 test, CPU temperature hovers around a cooler 80 degrees C, which may be responsible for the higher Turbo Boost benefits. It is worth noting that the core clock will occasionally drop to 3.1 GHz from time to time, though this is very short-lived before jumping right back up to 3.9 GHz.
Similarly, the Nvidia GPUs operate at a consistent 1101 to 1126 MHz speed to show some slight GPU Boost in action. This lasts for just a few minutes, however, as core clock then falls to a steady 1088 MHz. Memory clock remains constant at its maximum 1252.8 MHz according to GPU-Z.
Emissions
System Noise
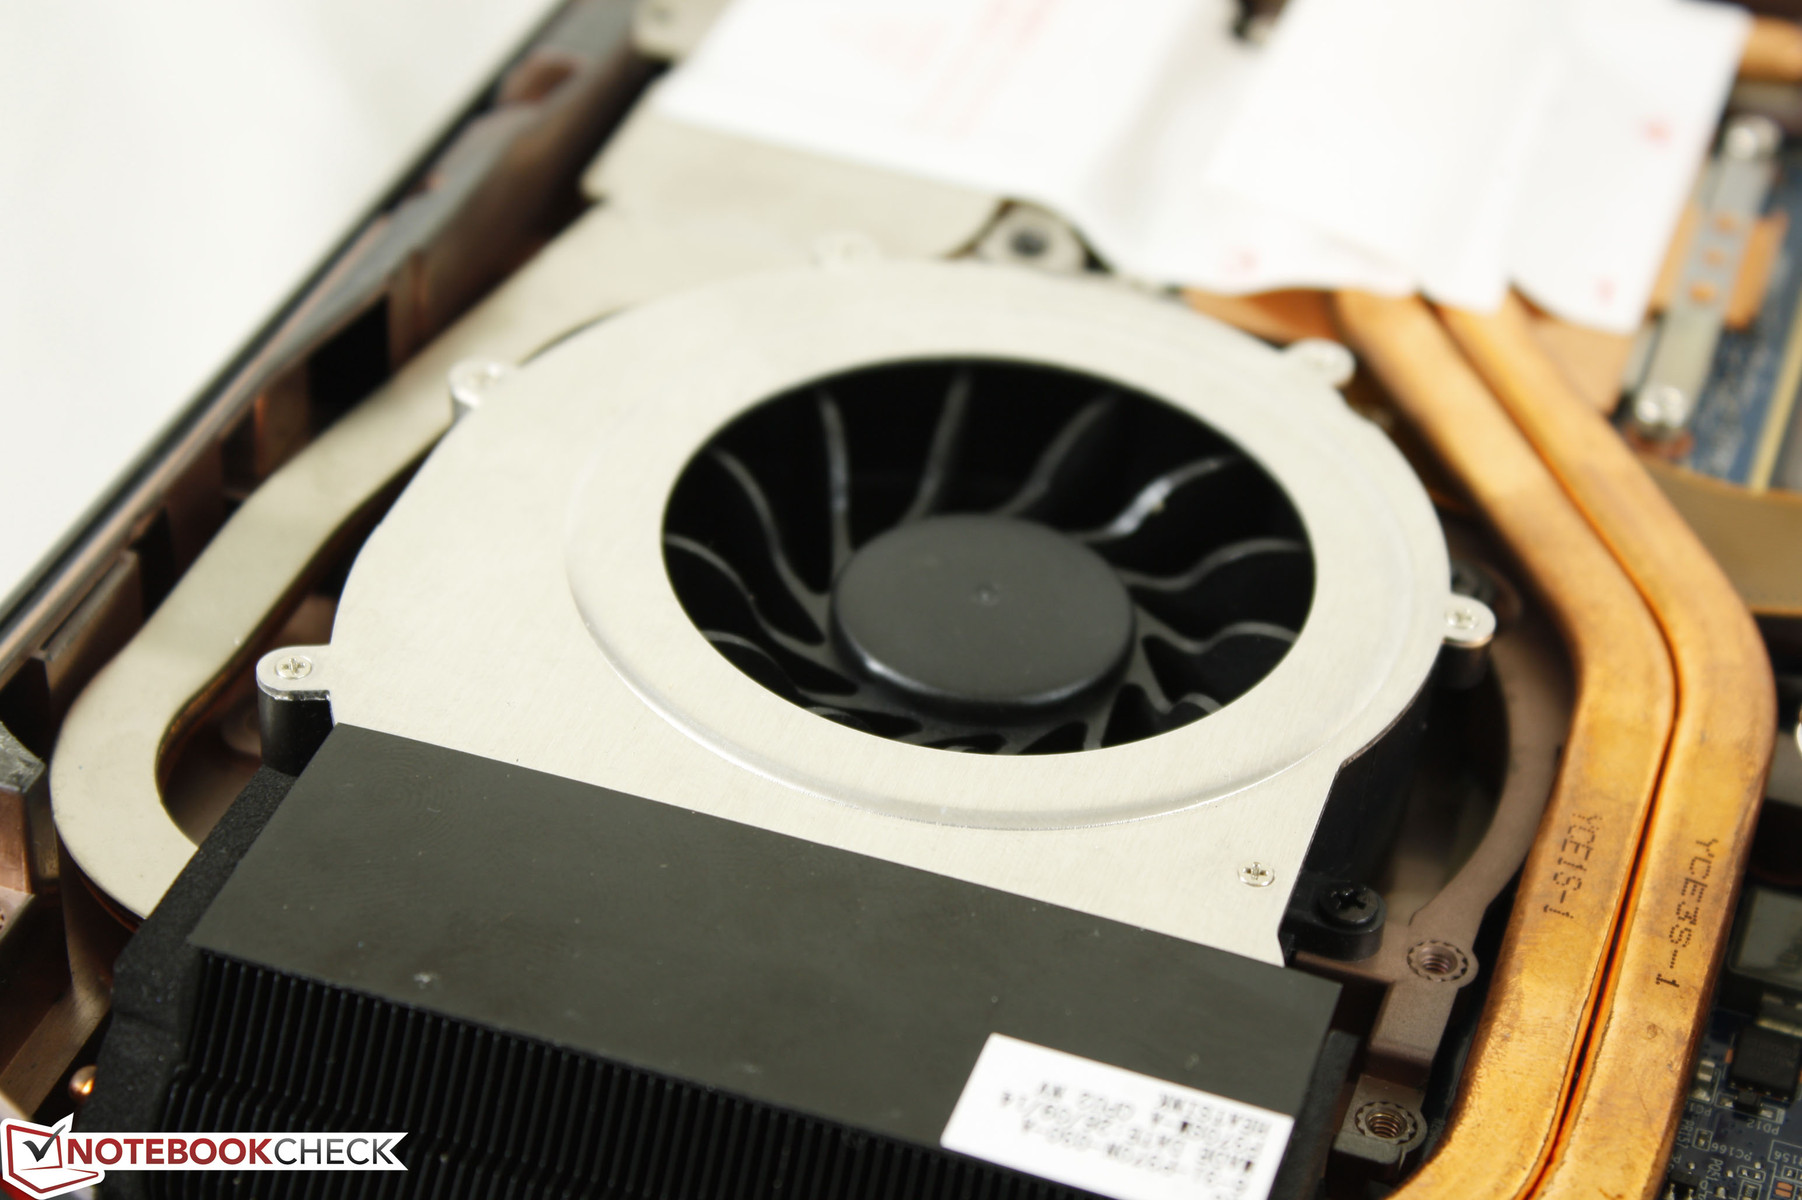
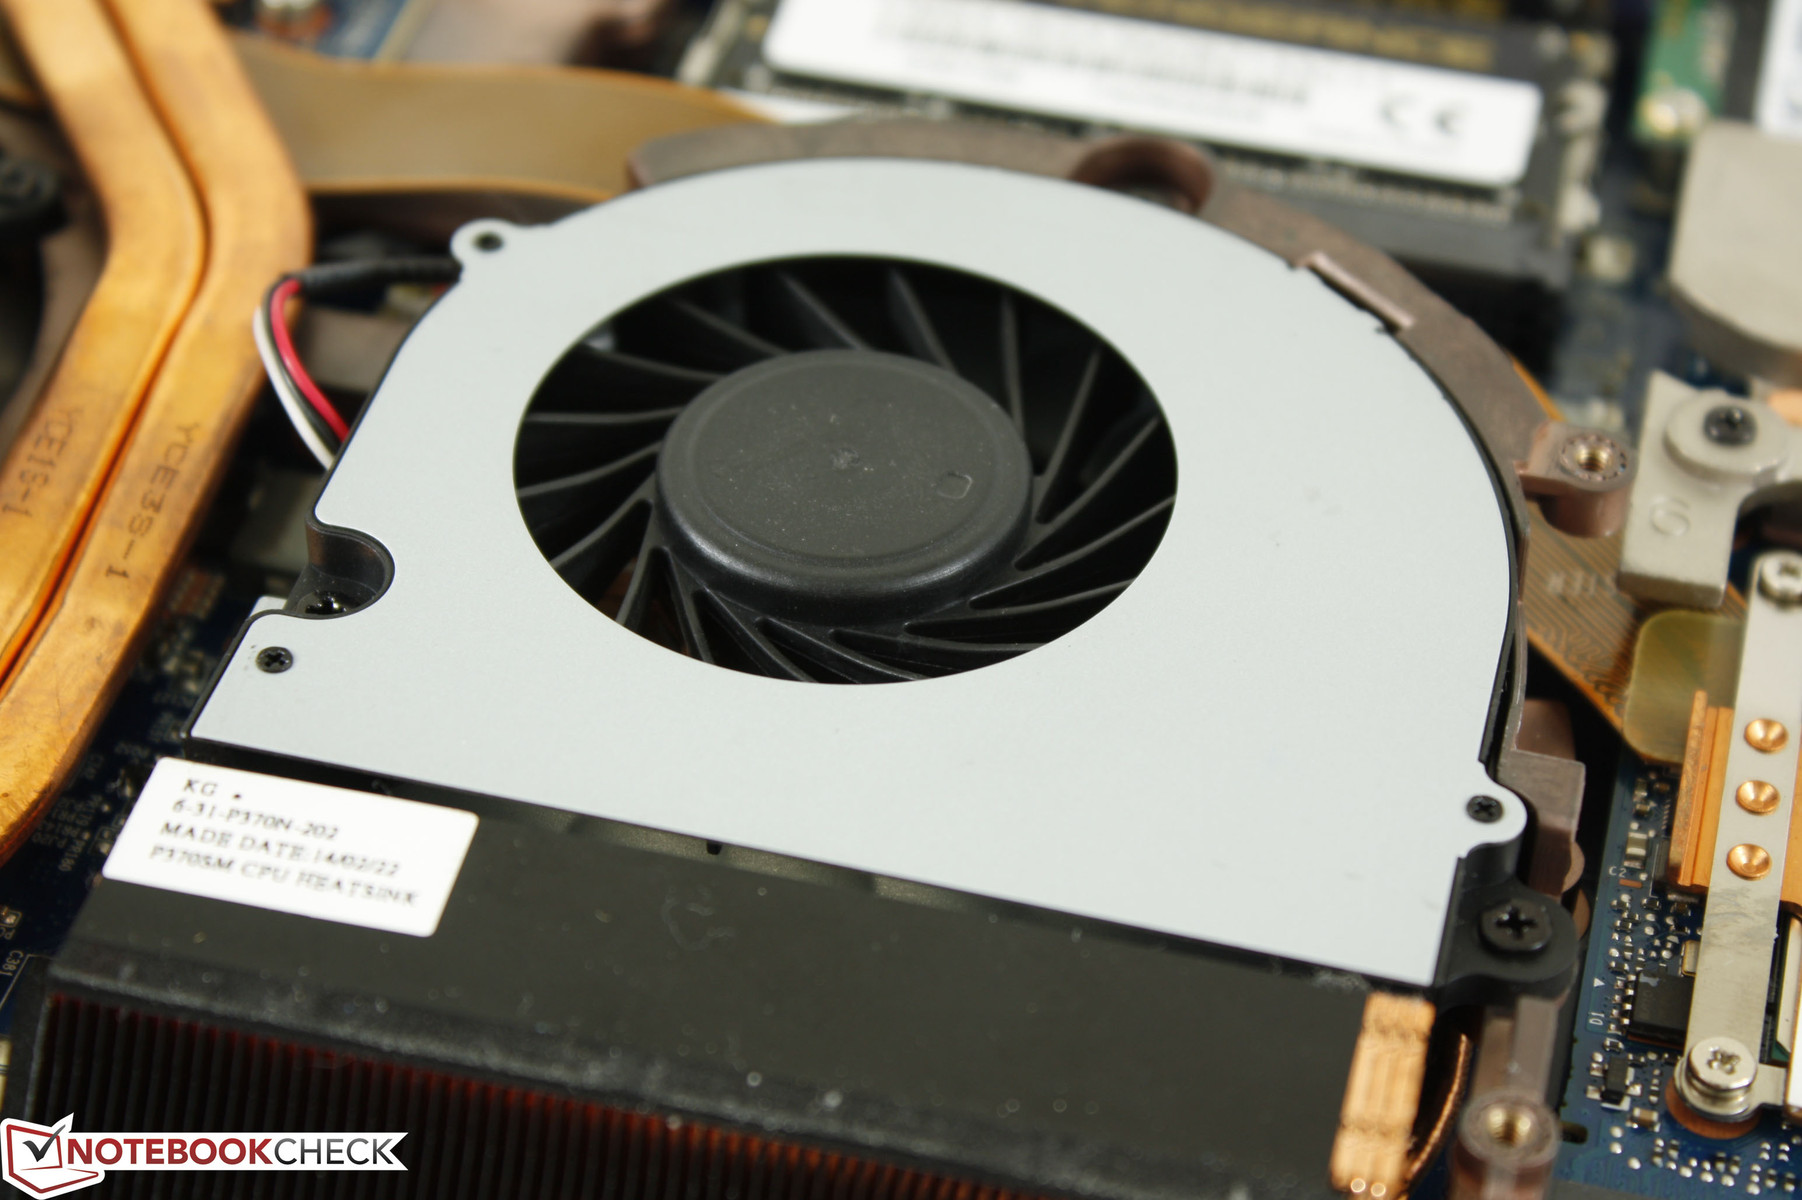
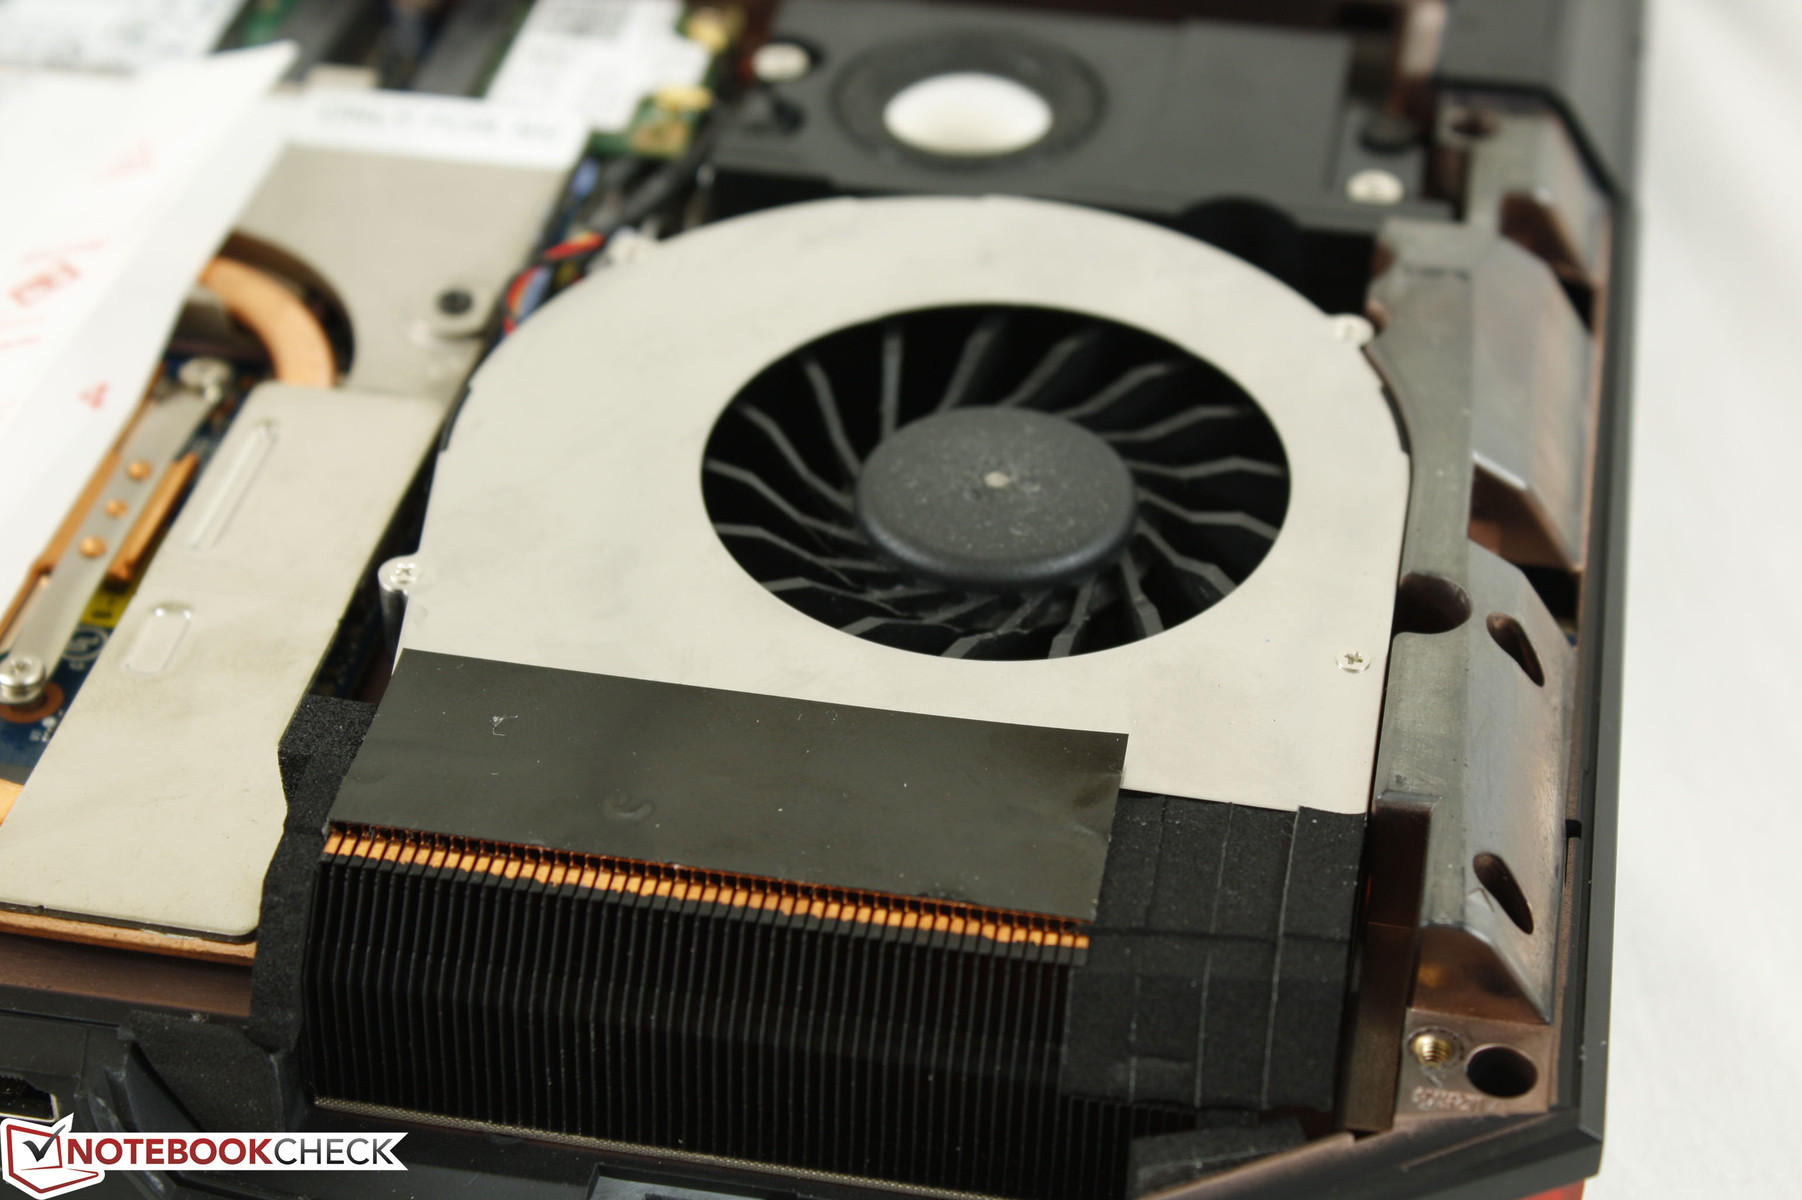
It takes three fans to sufficiently cool the X8 hardware - one for each processing unit. The fans are not as large compared to MSI GT7X models and none of the three are identical in size. The setup is again identical to the X7 with dedicated heat sinks and ventilation for each.
Fan noise is similar to the X7 both when idling and when under load. As such, the system is always audible no matter the workload. The 40 dB(A) range is typically the maximum on most mainstream notebooks, yet it is the minimum here on the X8. The pulsating fan is another annoying occurrence as light loads like browsing are enough to induce even louder fan noise.
Gaming will bump system noise to 46 dB(A) and up. This can be distracting when gaming, especially without any earphones. In contrast, the new MSI GT72 and Asus G750 remain in the lower 40s when gaming. Maximum load under FurMark and Prime95 will induce noise levels of up to a recorded 55 dB(A).
Noise level
| Idle |
| 40.5 / 41.4 / 41.6 dB(A) |
| DVD |
| 41.7 / 46.2 dB(A) |
| Load |
| 45.6 / 55 dB(A) |
 | ||
30 dB silent 40 dB(A) audible 50 dB(A) loud |
||
min: | ||
Temperature
Surface temperatures when idling are generally cool towards the front of the unit and become increasingly warm towards the rear. The hot spots are near the CPU and GPU as expected and a difference of about 5 or 6 degrees C can be felt between the coolest and warmest areas.
After running on very high loads for almost an hour, we were able to measure a hot spot of 44 degrees on the bottom rear of the X8. This is much cooler than on the Alienware 17 or older MSI GT70 models, which can reach nearly 50 to 60 degrees on the rear, and is comparable to the Asus ROG G750JZ. The palm rests stay cool for comfortable hands no matter the workload, but the center of the keyboard becomes a bit warmer than we would have liked at almost 40 degrees C. The left side of the keyboard where the WASD keys lie are fortunately cooler, though not as cool as on an Asus ROG under similar conditions. Despite this, we had no issues playing games for extended periods with active SLI.
(±) The maximum temperature on the upper side is 44 °C / 111 F, compared to the average of 40.4 °C / 105 F, ranging from 21.2 to 68.8 °C for the class Gaming.
(±) The bottom heats up to a maximum of 41.6 °C / 107 F, compared to the average of 43.2 °C / 110 F
(+) In idle usage, the average temperature for the upper side is 26.4 °C / 80 F, compared to the device average of 33.9 °C / 93 F.
(+) The palmrests and touchpad are cooler than skin temperature with a maximum of 27.8 °C / 82 F and are therefore cool to the touch.
(±) The average temperature of the palmrest area of similar devices was 28.8 °C / 83.8 F (+1 °C / 1.8 F).
Battery Life
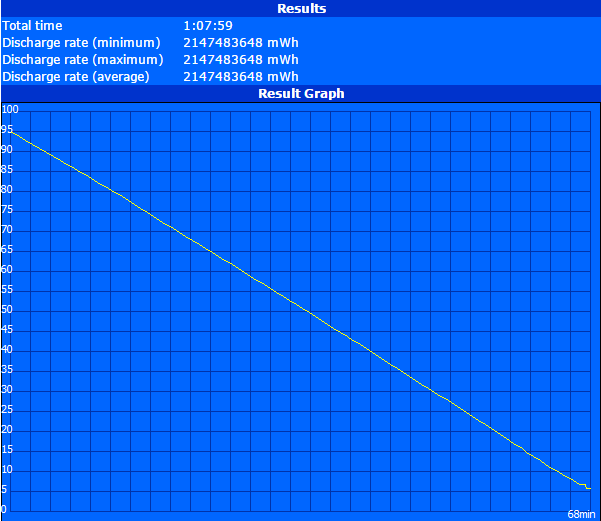
The removable 89.21 Wh (5900 mAh) Li-Ion battery is identical to last year's X7 with no other capacities or options available. Its capacity is nearly the same as competing 17-inch gaming notebooks like the Alienware 17 and MSI GT72. Even so, runtimes compared to the these examples differ quite dramatically as the integrated graphics is disabled on the Eurocom X8. The demanding hardware and overclocked components do not help either as users will be lucky to get close to three hours of constant usage on the Power Saver profile. Even the Aorus X7 with its GTX 970M SLI, lack of Optimus, and smaller 73 Wh battery can last up to half an hour longer under the same idling conditions.
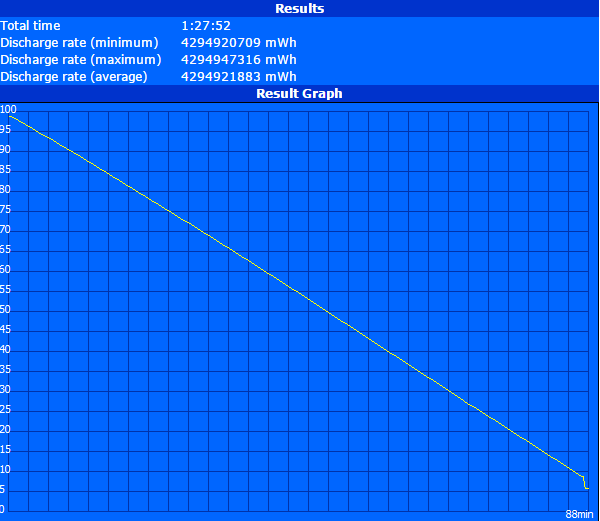
Gaming on batteries lasts just about as long as most other high-end gaming models at a little over one hour. This would have been even lower if not for the performance throttling when not connected to mains, but we imagine that the battery is outputting near its maximum rate under these demanding conditions.

| Eurocom X8 GeForce GTX 980M SLI, 4940MX, Samsung SSD 840 EVO 120GB mSATA | Alienware 17 (GTX 880M) GeForce GTX 880M, 4700MQ, WDC Scorpio Blue WD10JPVX-75JC3T0 | Asus G750JZ-T4023H GeForce GTX 880M, 4700HQ, 2x Sandisk X110 SD6SP1M-128G RAID 0 | Aorus X7 Pro GeForce GTX 970M SLI, 4870HQ, 2x Lite-On LMT-256L9M (RAID 0) | MSI GT72-2QE32SR311BW GeForce GTX 980M, 4710HQ, 4x Kingston RBU-SNS8100S3256GD1 (RAID 0) | |
|---|---|---|---|---|---|
| Battery runtime | 168% | 204% | 24% | 102% | |
| Reader / Idle (h) | 2.5 | 7.7 208% | 9.6 284% | 3 20% | 6.6 164% |
| WiFi (h) | 1.5 | 5.8 287% | 6.3 320% | 3.1 107% | |
| Load (h) | 1.1 | 1.2 9% | 1.2 9% | 1.4 27% | 1.5 36% |
Verdict
For something so powerful like the Eurocom X8, it's not a matter of price but performance and expectations. In truth, the i7-4940MX and GTX 980M SLI are overkill for a single 1080p screen. Performance in terms of CPU, GPU, RAM, and SSD RAID options is above and beyond what other manufacturers can offer with respectable Turbo and GPU Boost endurance to boot, but the 1080p display really does no justice for our configuration. At this level, users must exploit multi-monitor 1440p or higher setups to really allow the GTX 980M SLI to flex its muscles and show its potential. Otherwise, it would be hard to recommend such an extreme configuration when the performance overhead is so great for the same reasons why you wouldn't want to keep an oversized fish in a small fish bowl.
Does the X8 meet our expectations? It has certainly broken benchmark records in our database, but performance gains over a single GTX 980M still vary widely between games. Users expecting to invest on a mobile SLI solution should carefully look at what titles they intend to play and how much an SLI system will benefit their experience.
Even if users aren't going all out on hardware options, it is considerably easier to recommend the Eurocom X8 at more basic configuration levels. Its user-friendly expandability options give it very long legs compared to the more fixed models offered by other brands. This makes the X8 an ideal candidate for users who know they will be frequently upgrading and swapping components down the line. For those with no interest in RAID, SLI, or end-user upgrades, however, may be better off with lighter and more compact options like the Gigabyte P35X V3 for their gaming needs.
The Eurocom X8 can be configured and purchased through their official product page here.