

Dell XPS 13 Plus laptop review: Is the base configuration the best choice?

We can't get enough of XPS. Following the "fastest XPS 13 so far", an XPS 13 Plus with a Core i7-1260P and a 4K panel, we now have the entry-level Plus model equipped with a Core i5-1240P, a Full HD panel and a 512 GB Micron SSD. The entry into the performance-hungry XPS world currently costs 1,350 Euros (~$1,385).
As a reminder: As of this year, Dell offers the compact XPS 13 in two versions: The "normal" XPS 13 with Intel Alder Lake CPUs from the U-series, and the XPS 13 Plus with more powerful Alder Lake P chips. We've already reviewed both versions, and we conclude that the differences in performance are substantial. This applies not only to the CPU and the iGPU, but also to the storage device.
In this review update, we'll ask the following questions: Is the extra cost for the Core i7 worth it? What's the performance difference to the Alder Lake U model (i5)? What about battery life, considering that Alder Lake U doubled the runtime of Alder Lake P?
As before, there are competitors that received better overall scores in our reviews. First of all, the Apple MacBook Air 2020 M1 Entry and the Asus Zenbook S 13 OLED, both of which tend to be cheaper than the entry-level XPS 13 Plus i5.
Further Dell XPS 13 laptops reviewed by Notebookcheck:
XPS 13 Plus 9320 i7-1260P (4K, Alder Lake P 2022)
XPS 13 9315 i5-1230U (Full HD, Alder Lake U 2022)
XPS 13 9310 Core i7 (Full HD, Tiger Lake 2021)
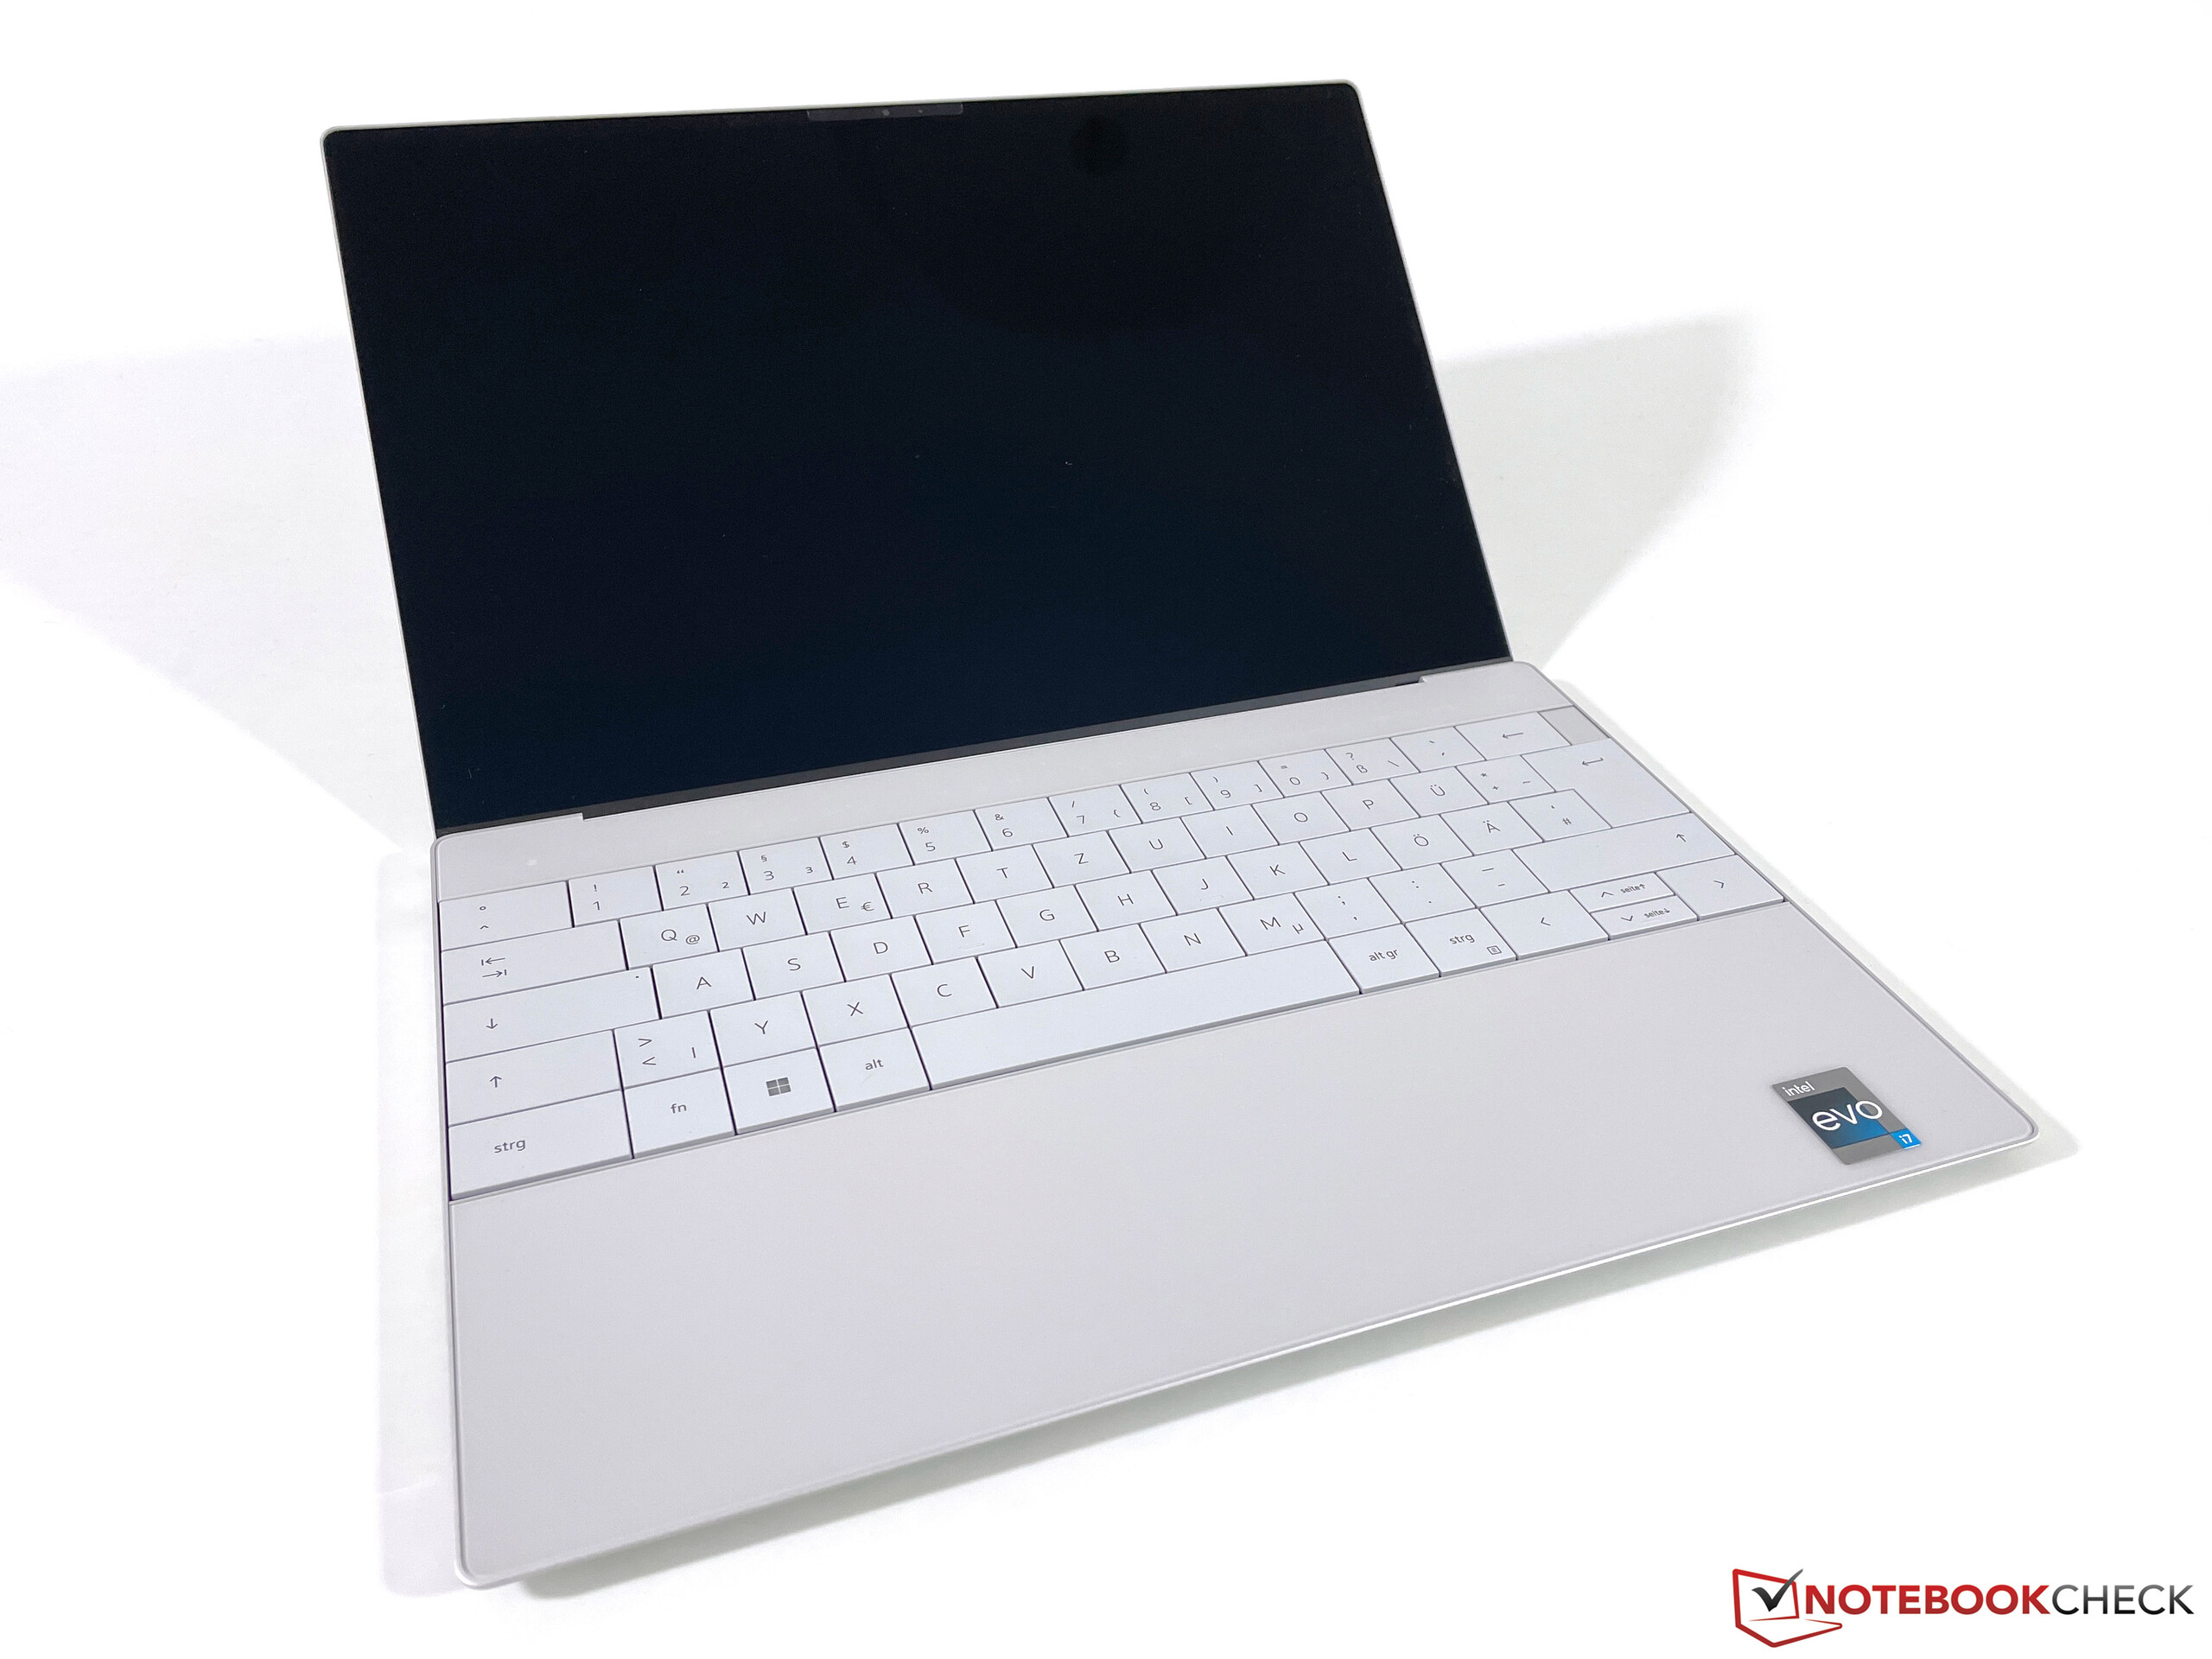
In this update, we won't go into the workmanship, port configuration, input devices or speakers; instead, please refer to our review of the XPS 13 Plus 9320 i7-1260P (4K, Alder Lake P 2022).
Possible contenders in comparison
Rating | Date | Model | Weight | Height | Size | Resolution | Price |
|---|---|---|---|---|---|---|---|
| 86.1 % v7 (old) | 08 / 2022 | Dell XPS 13 Plus 9320 i5-1240p i5-1240P, Iris Xe G7 80EUs | 1.2 kg | 15.3 mm | 13.40" | 1920x1200 | |
| 91.1 % v7 (old) | 12 / 2020 | Apple MacBook Air 2020 M1 Entry M1, M1 7-Core GPU | 1.3 kg | 16.1 mm | 13.30" | 2560x1600 | |
| 90.1 % v7 (old) | 07 / 2022 | Asus Zenbook S 13 OLED R7 6800U, Radeon 680M | 1.1 kg | 14.9 mm | 13.30" | 2880x1800 | |
| 89.8 % v7 (old) | 02 / 2021 | Lenovo ThinkPad X1 Nano-20UN002UGE i7-1160G7, Iris Xe G7 96EUs | 946 g | 16 mm | 13.00" | 2160x1350 | |
| 88.8 % v7 (old) | 02 / 2022 | Huawei MateBook 13s i5 11300H i5-11300H, Iris Xe G7 80EUs | 1.3 kg | 16.5 mm | 13.40" | 2520x1680 | |
| 86.9 % v7 (old) | 07 / 2022 | Dell XPS 13 Plus 9320 4K i7-1260P, Iris Xe G7 96EUs | 1.2 kg | 15.3 mm | 13.40" | 3840x2400 |
Connectivity - SSD upgrades only for the XPS Plus
Communication
We were able to connect to the Wi-Fi 6E network provided by our router with this review unit. This wasn't possible with the 4K/i7 variant of the Plus.
Webcam


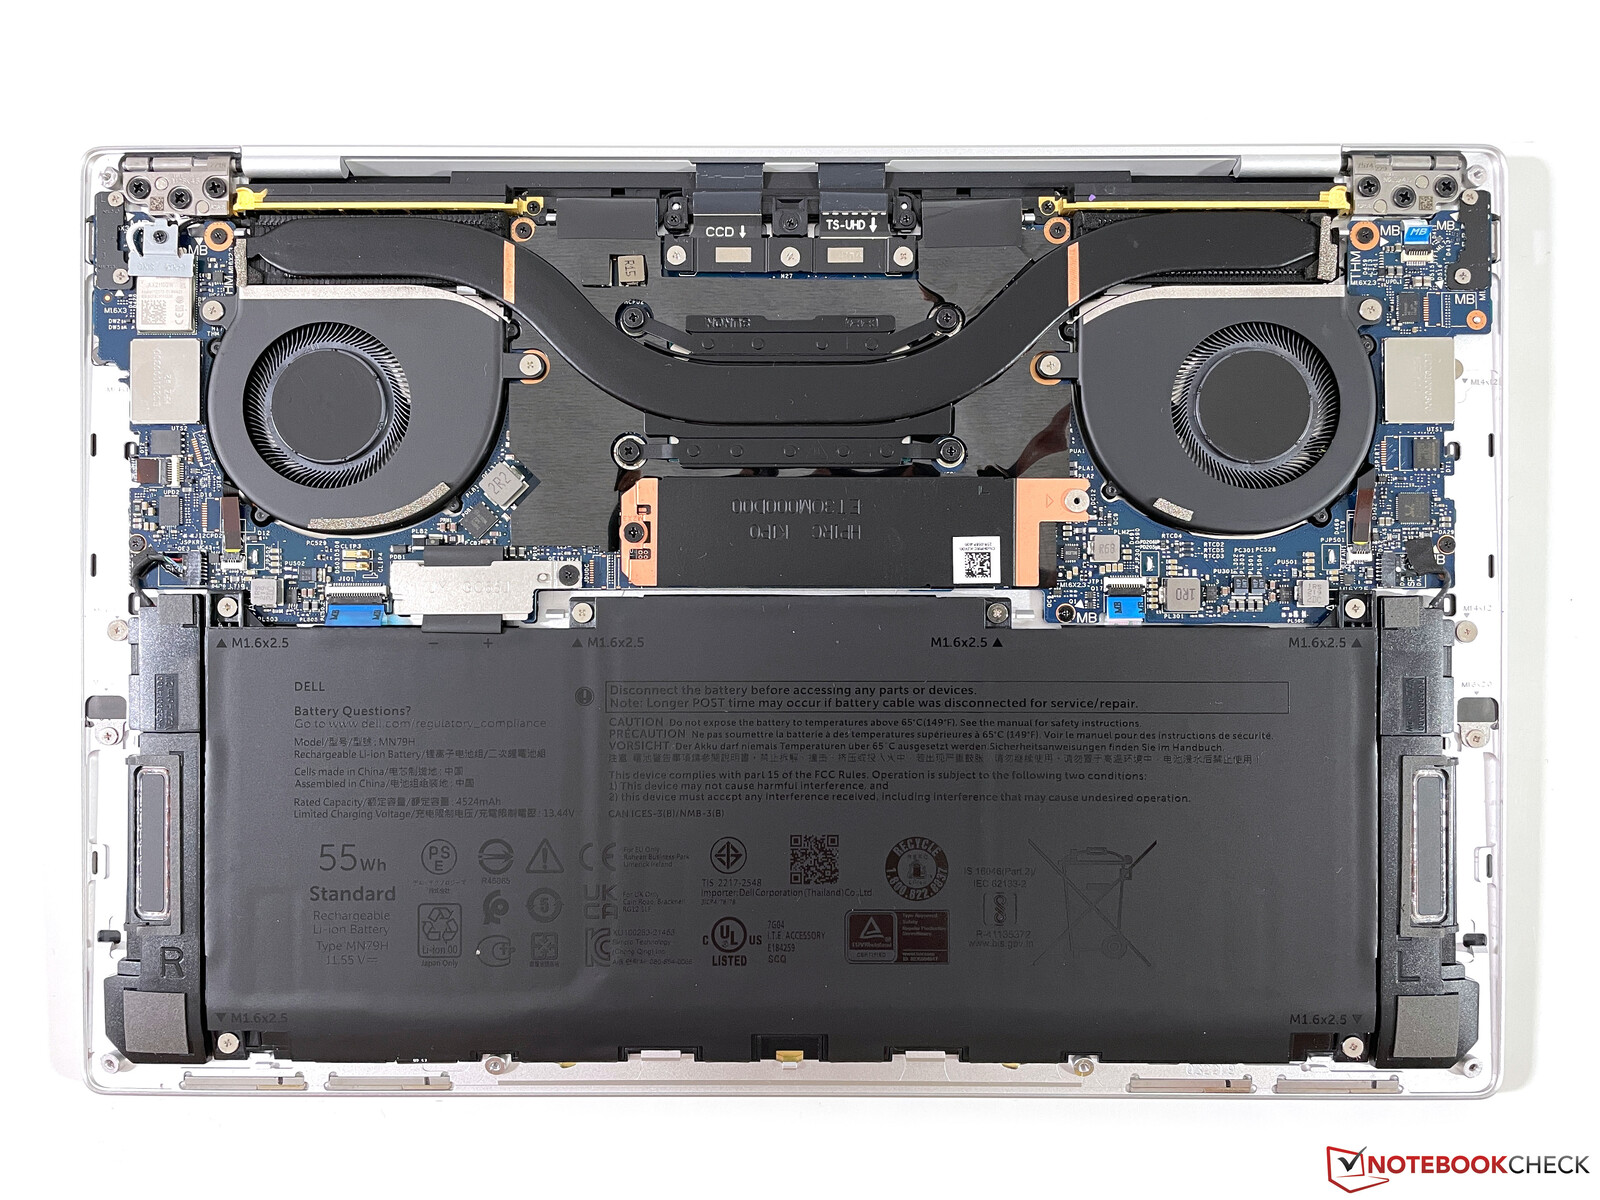
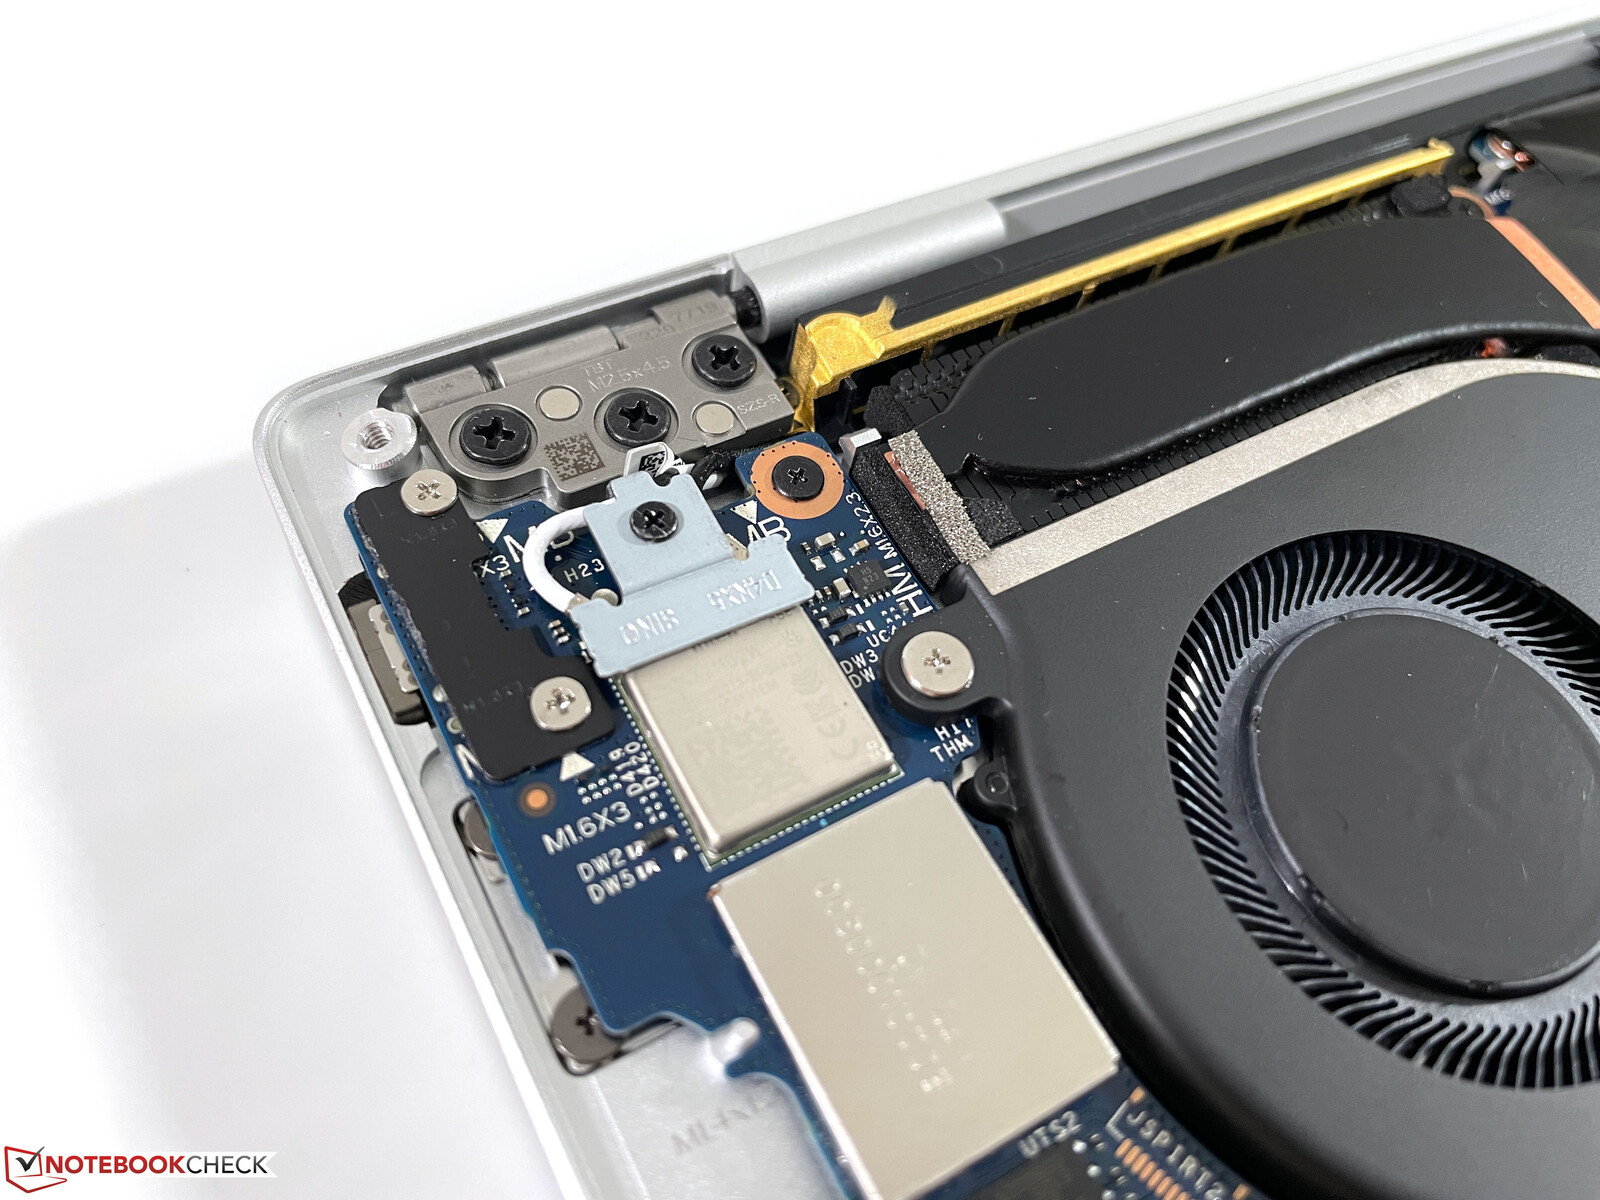
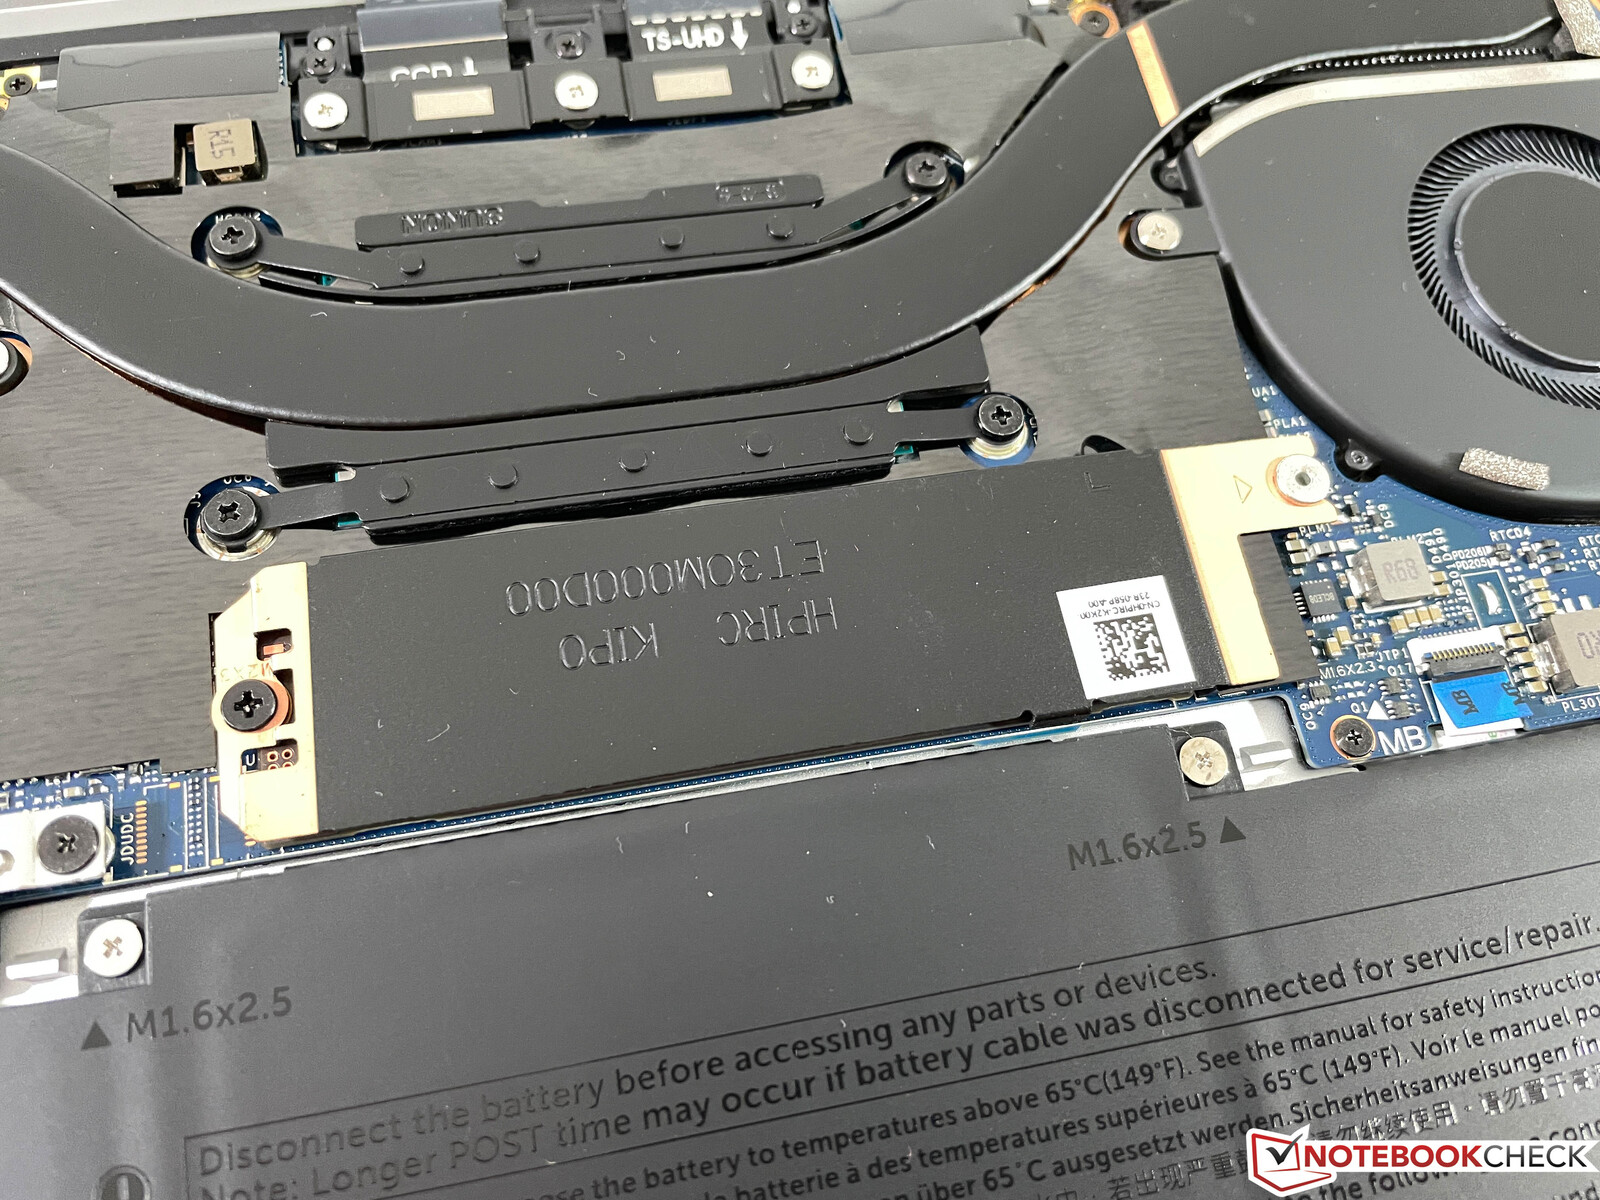
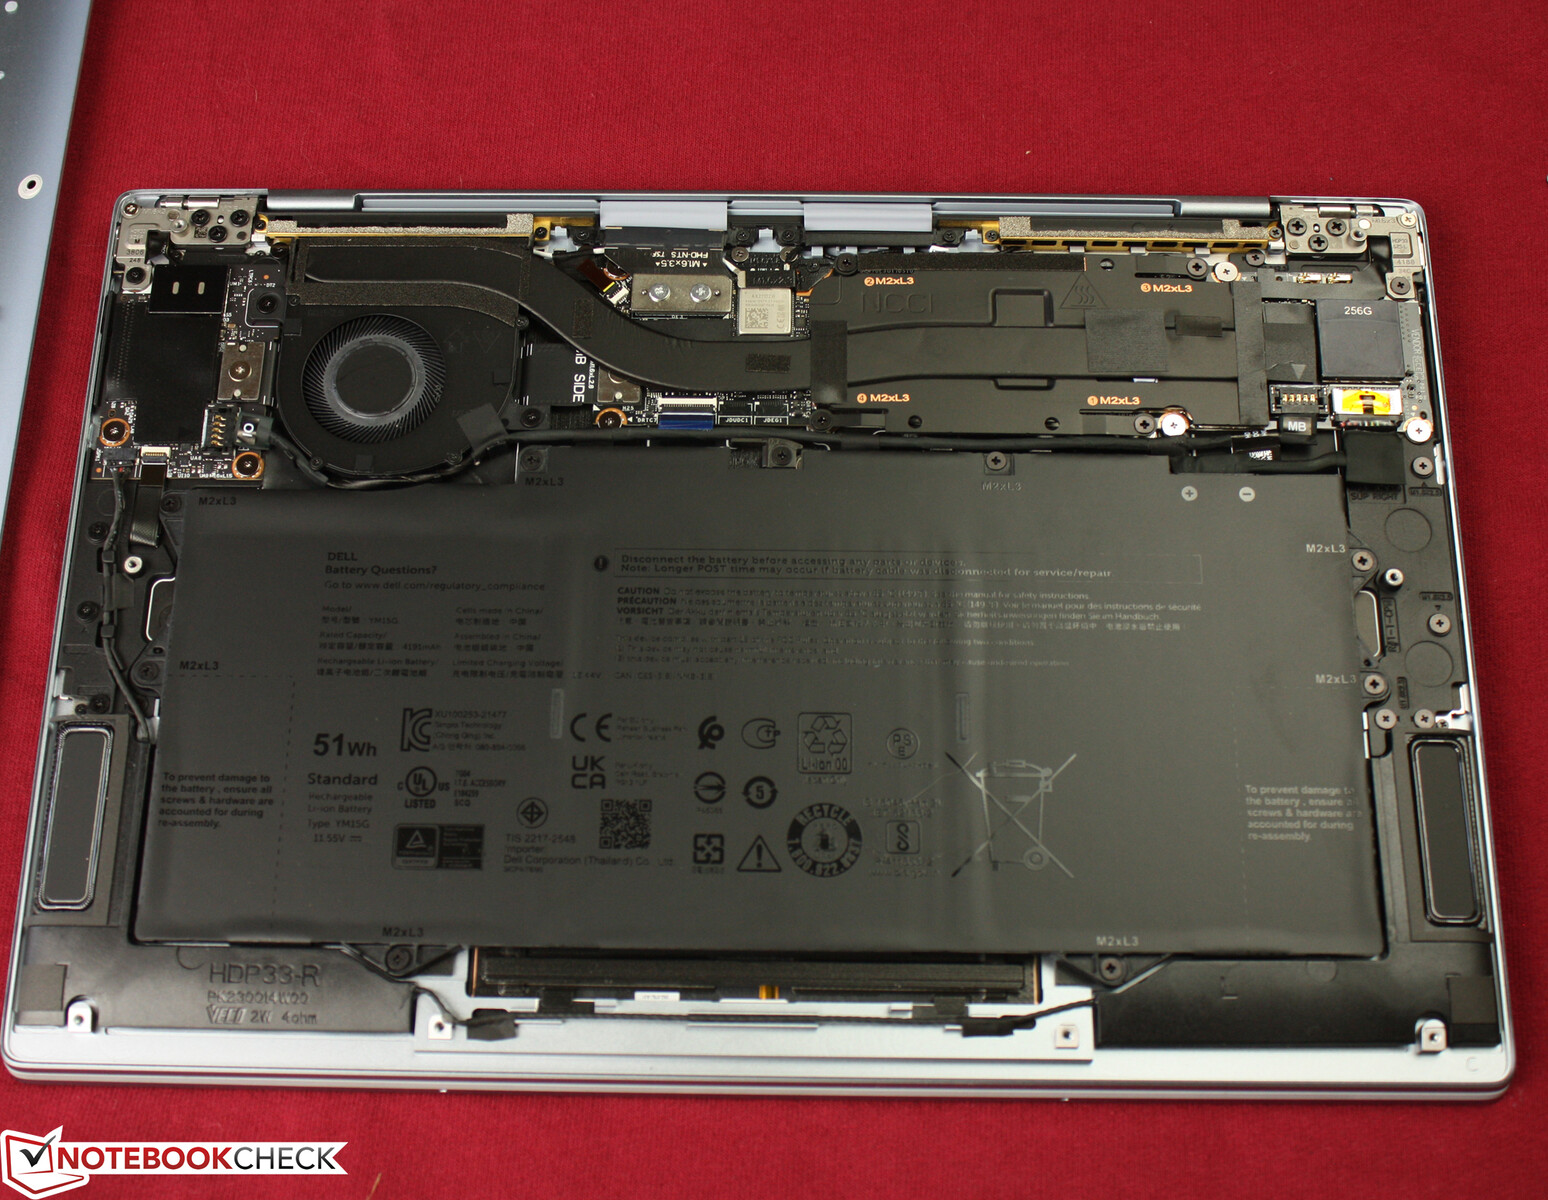
Maintenance
The bottom cover is secured with six Torx screws (T5) and is easy to remove. The interior has a well-organized layout, but users can only clean the fans or replace the M.2 SSD.
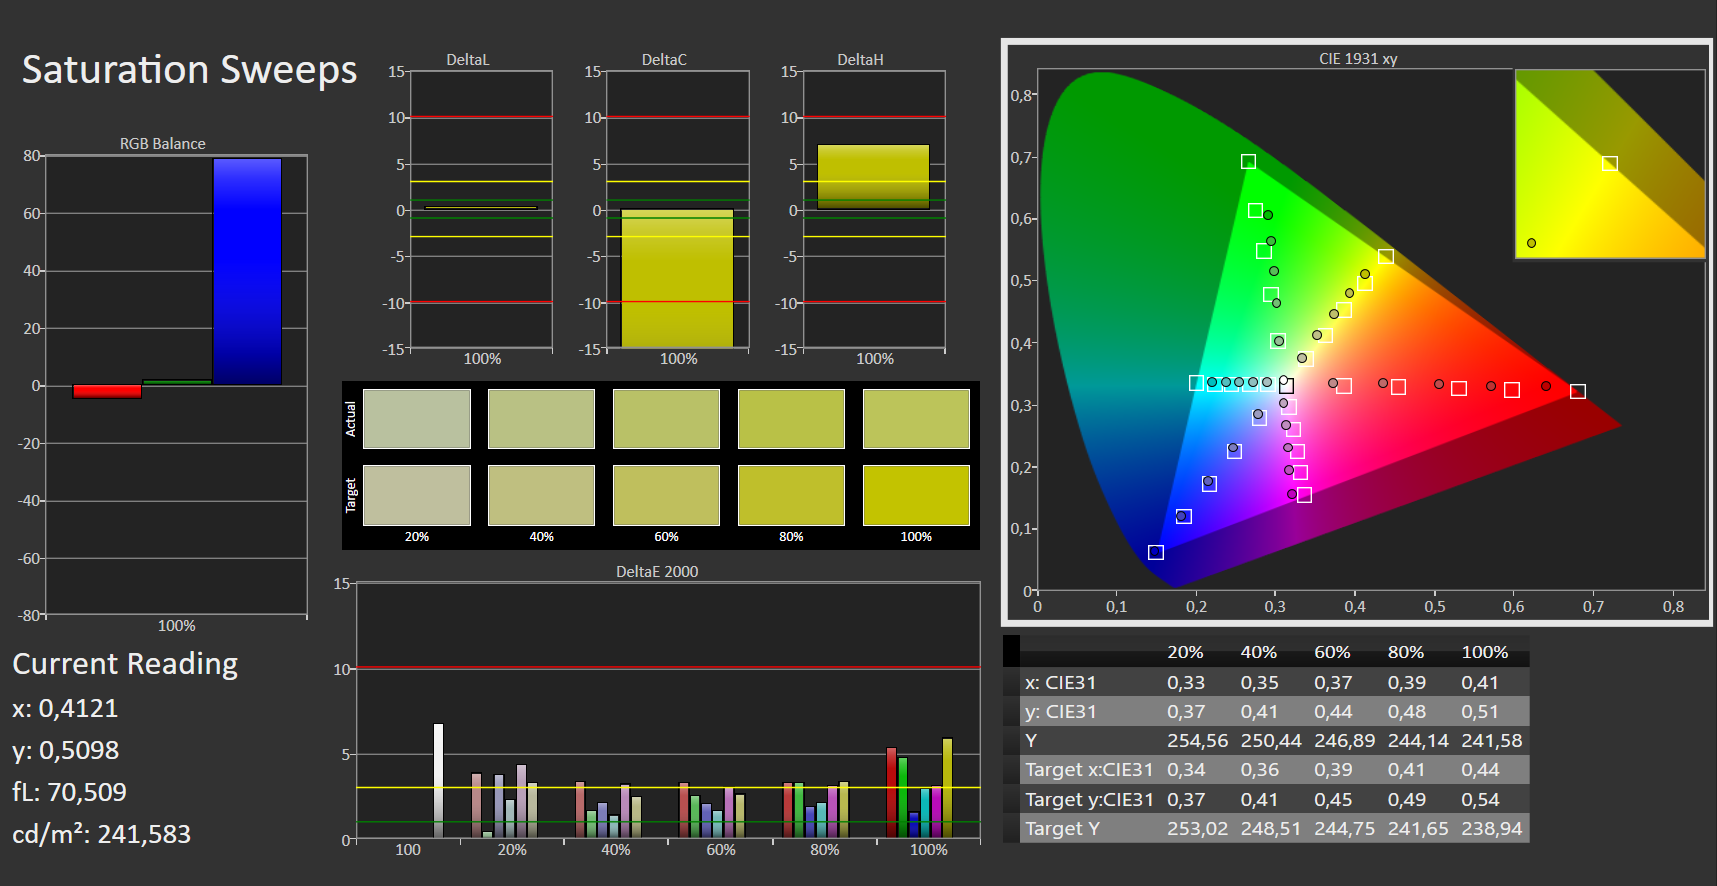
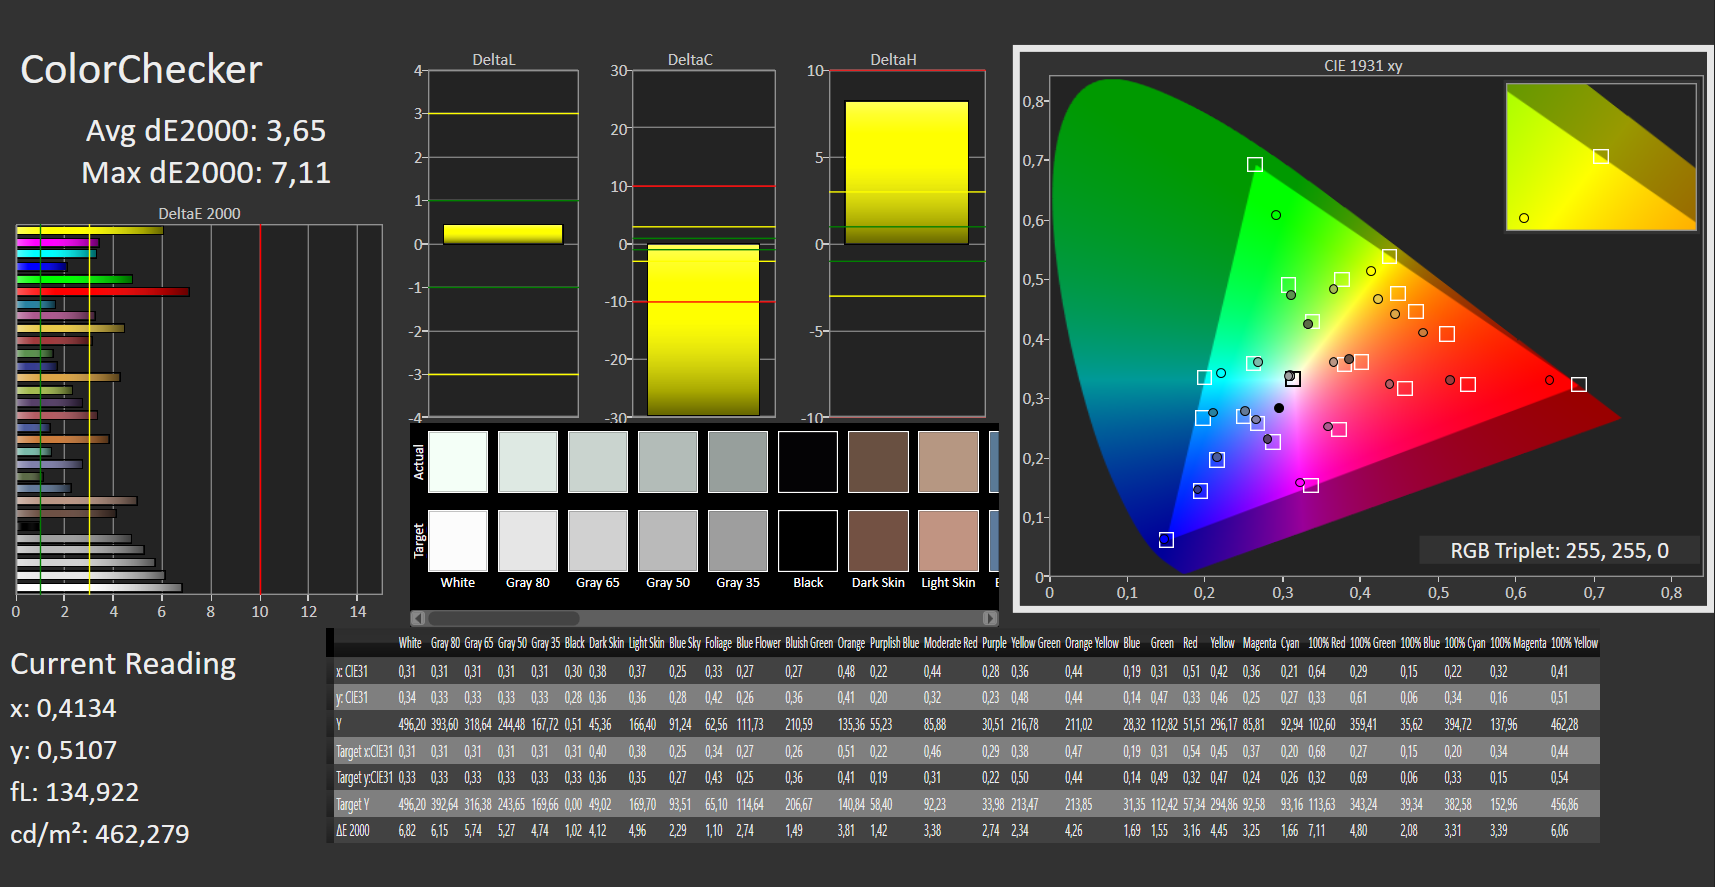
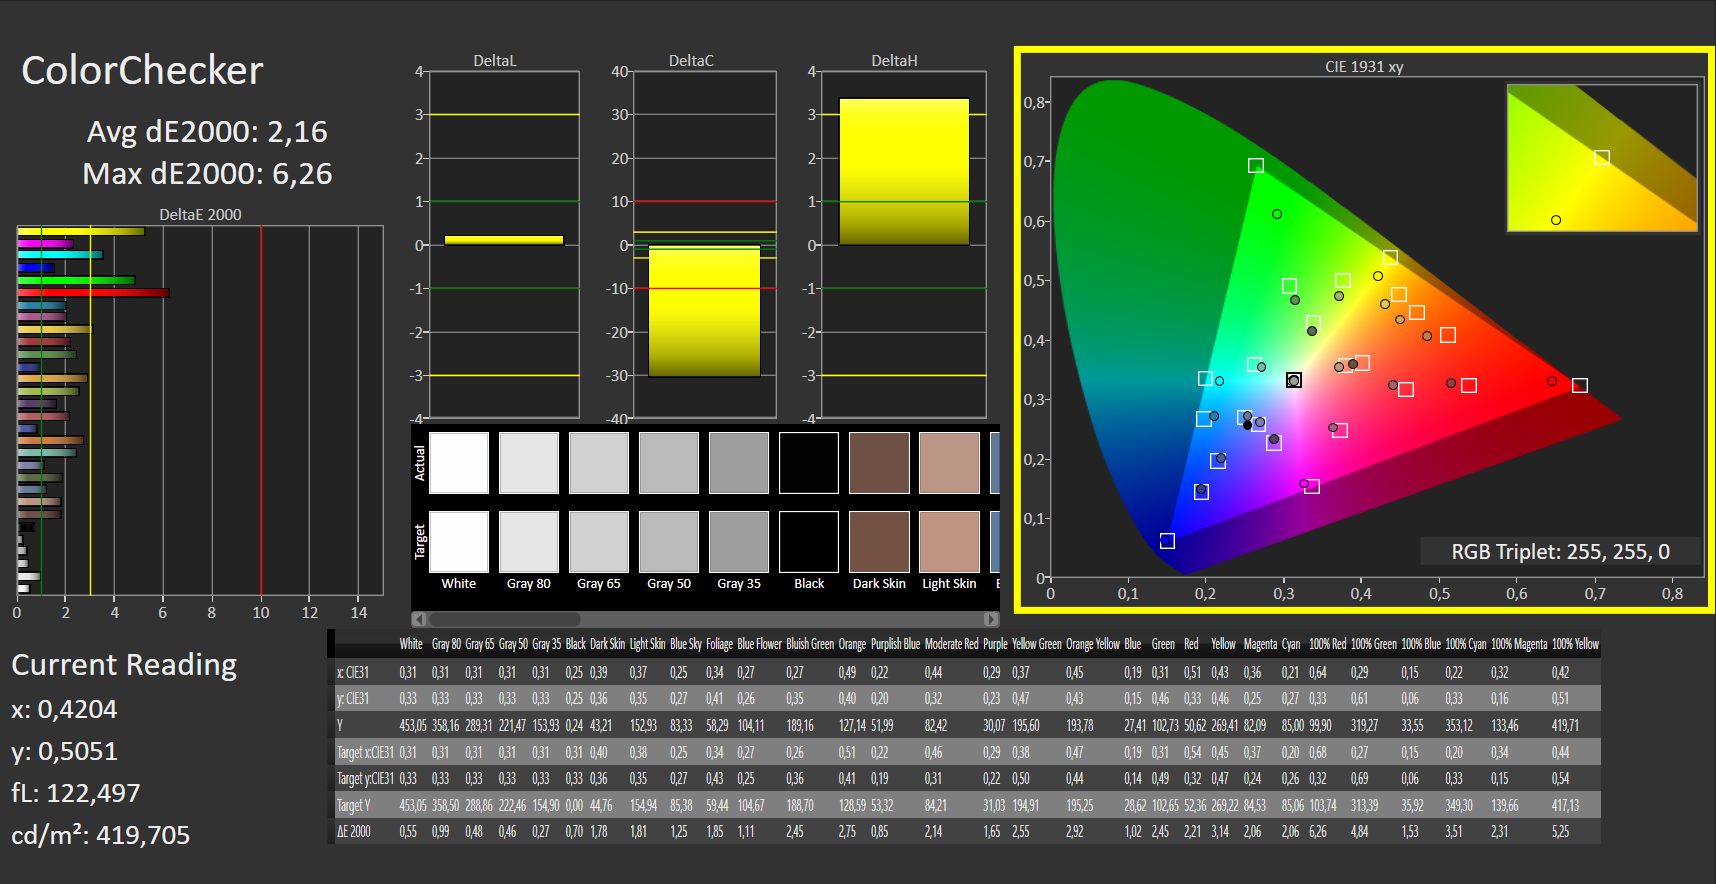
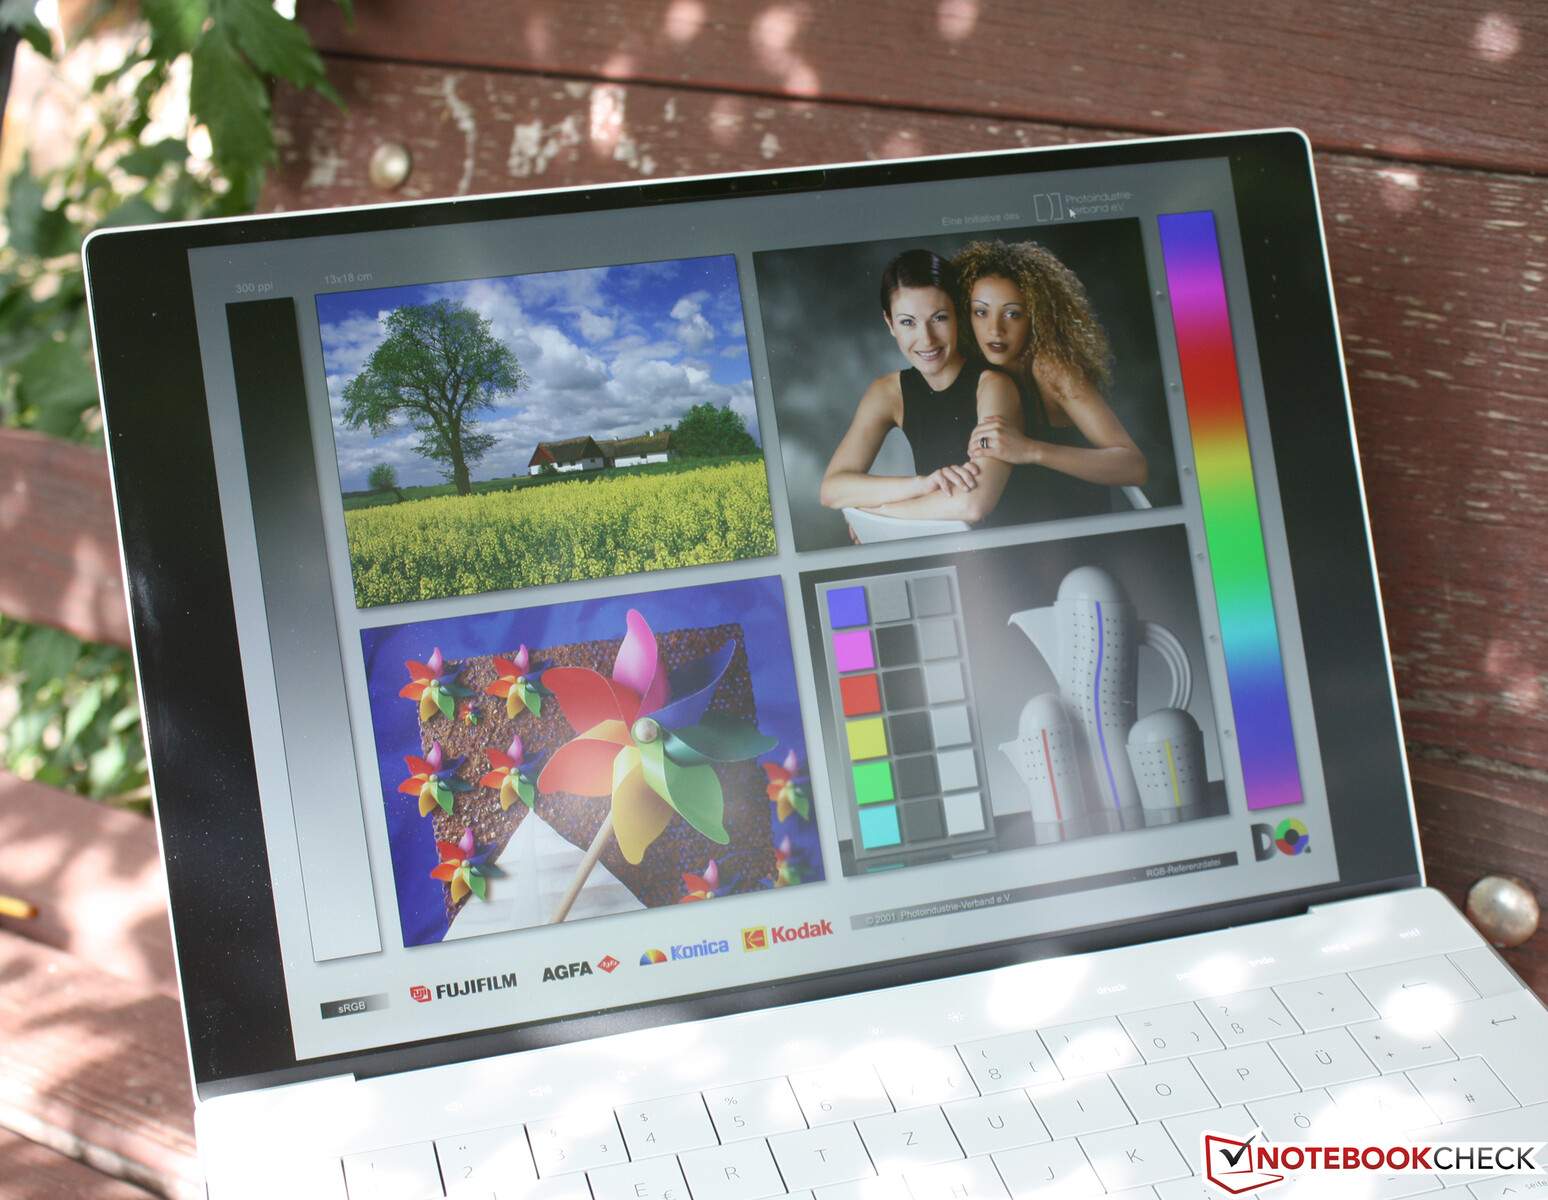
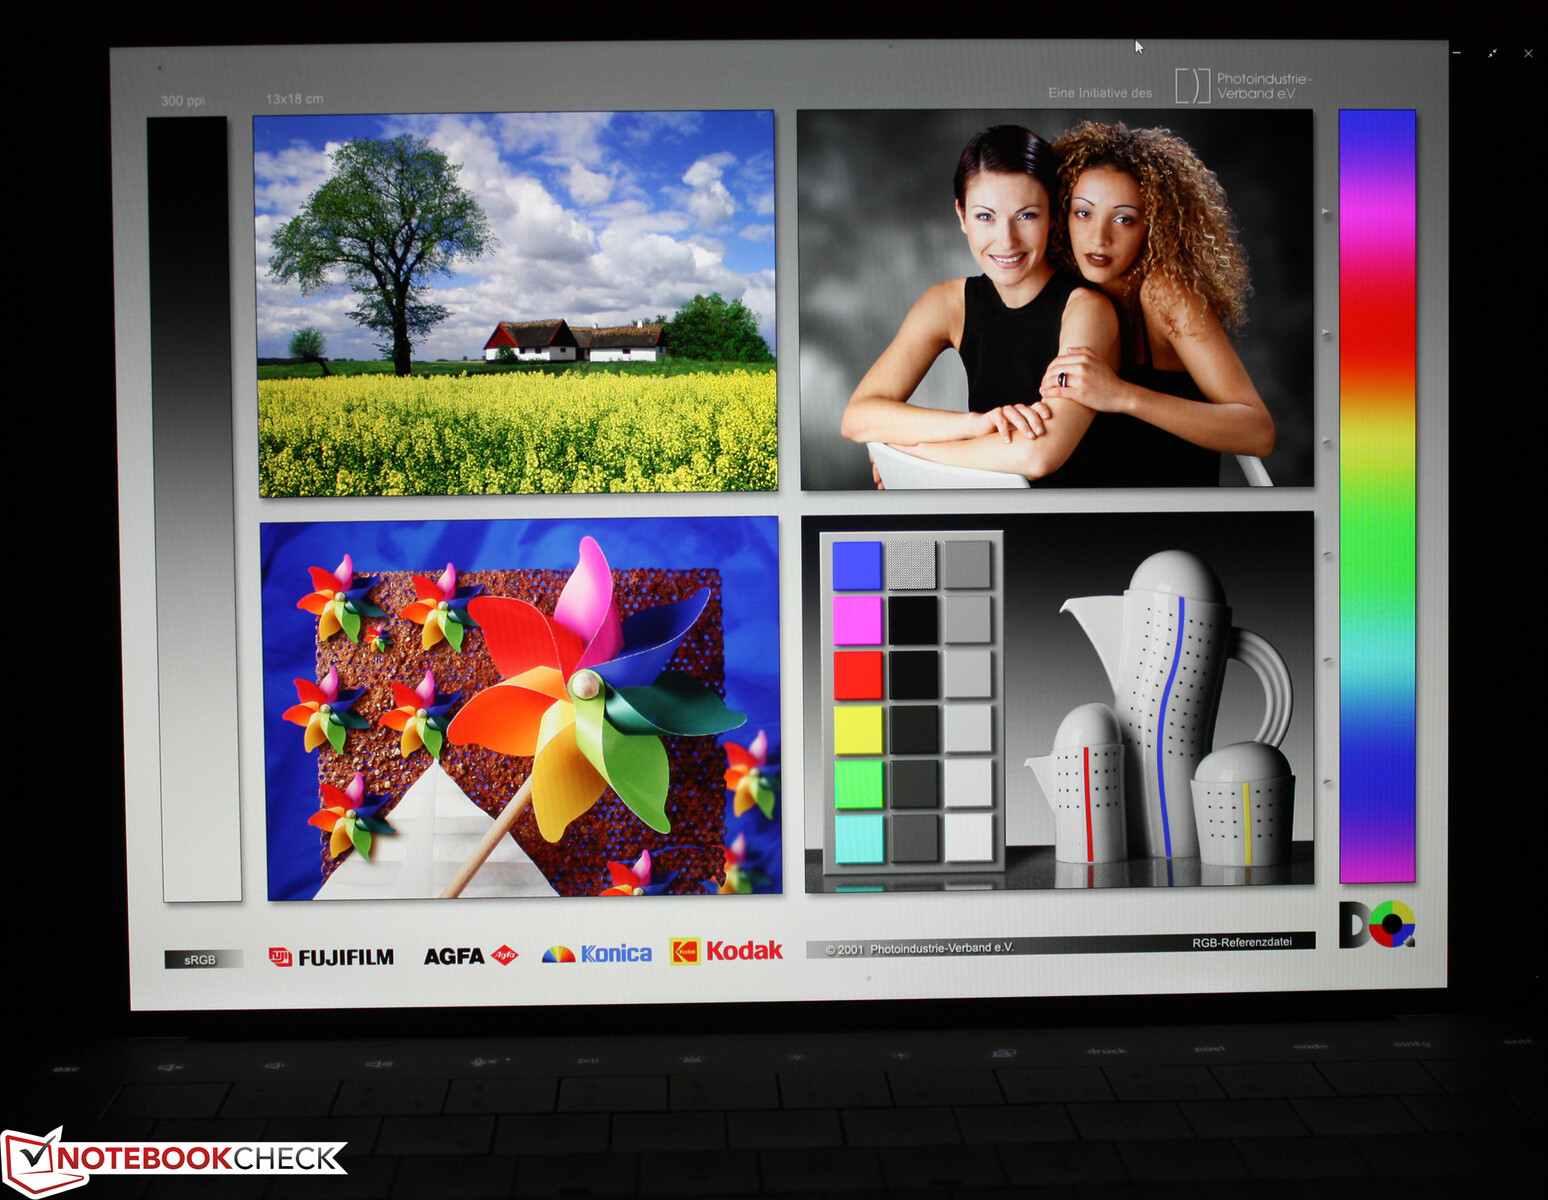
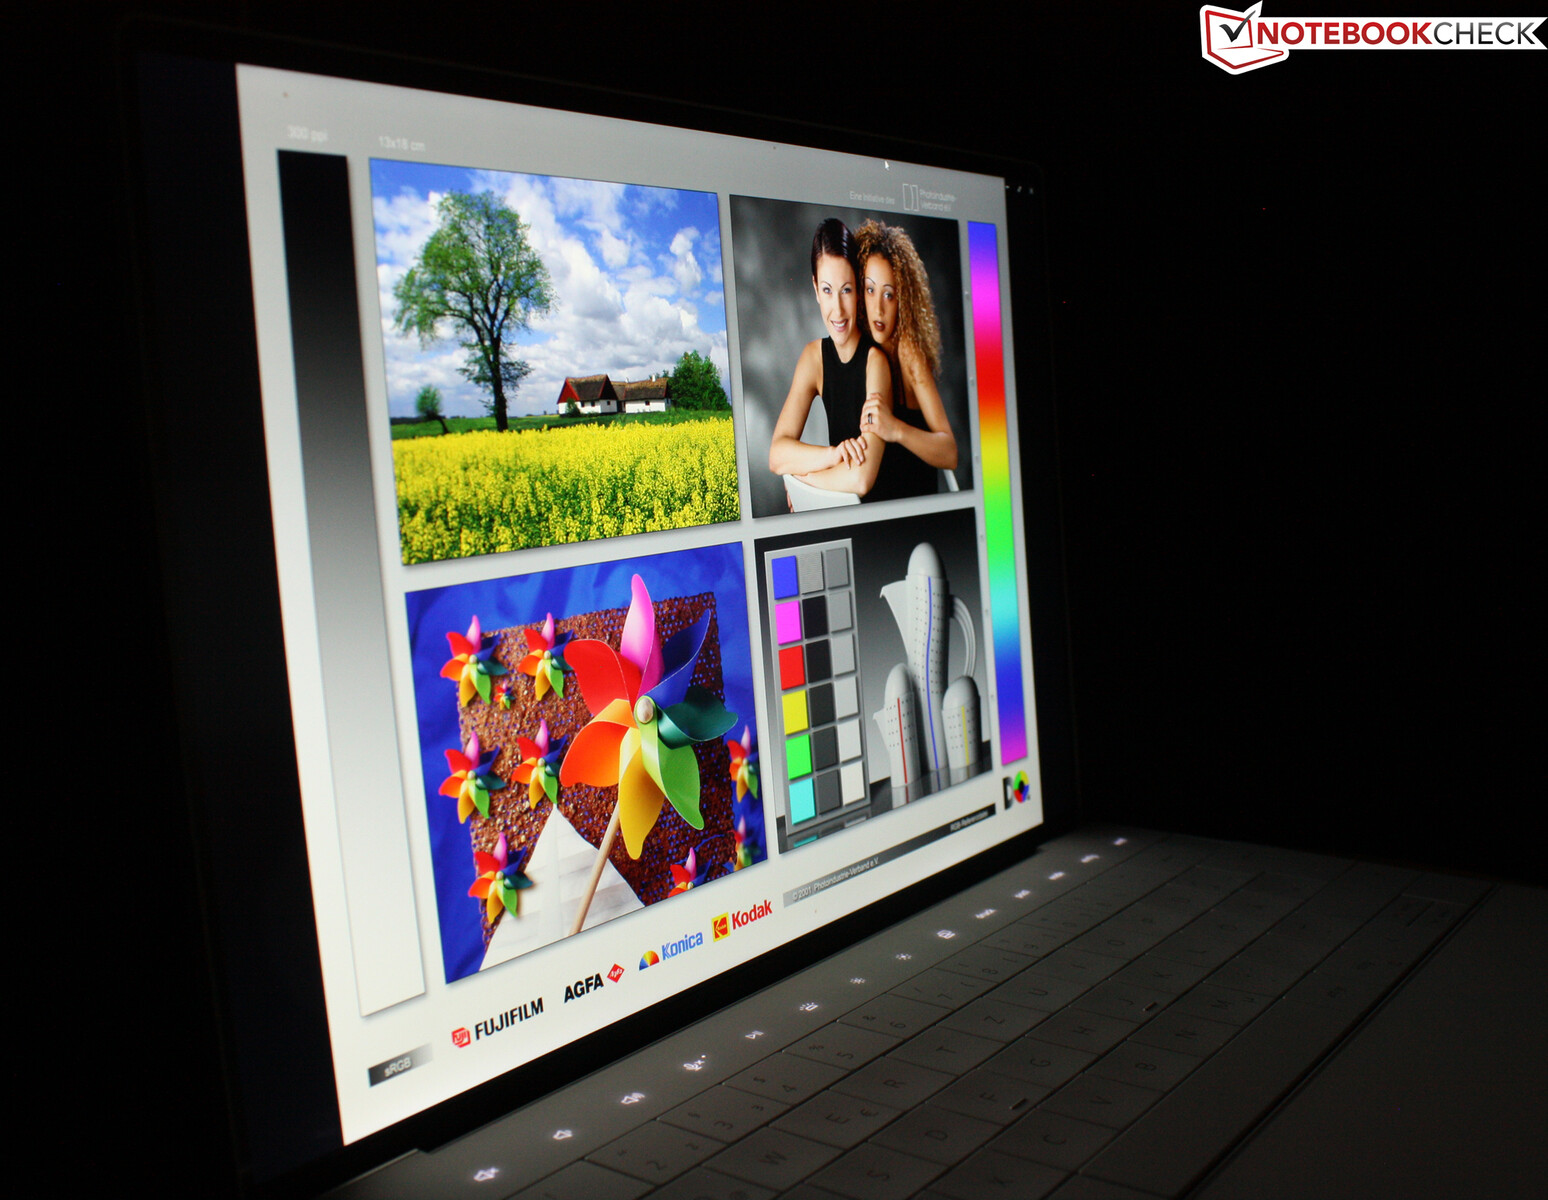
Display - Dell subnotebook with bright panel
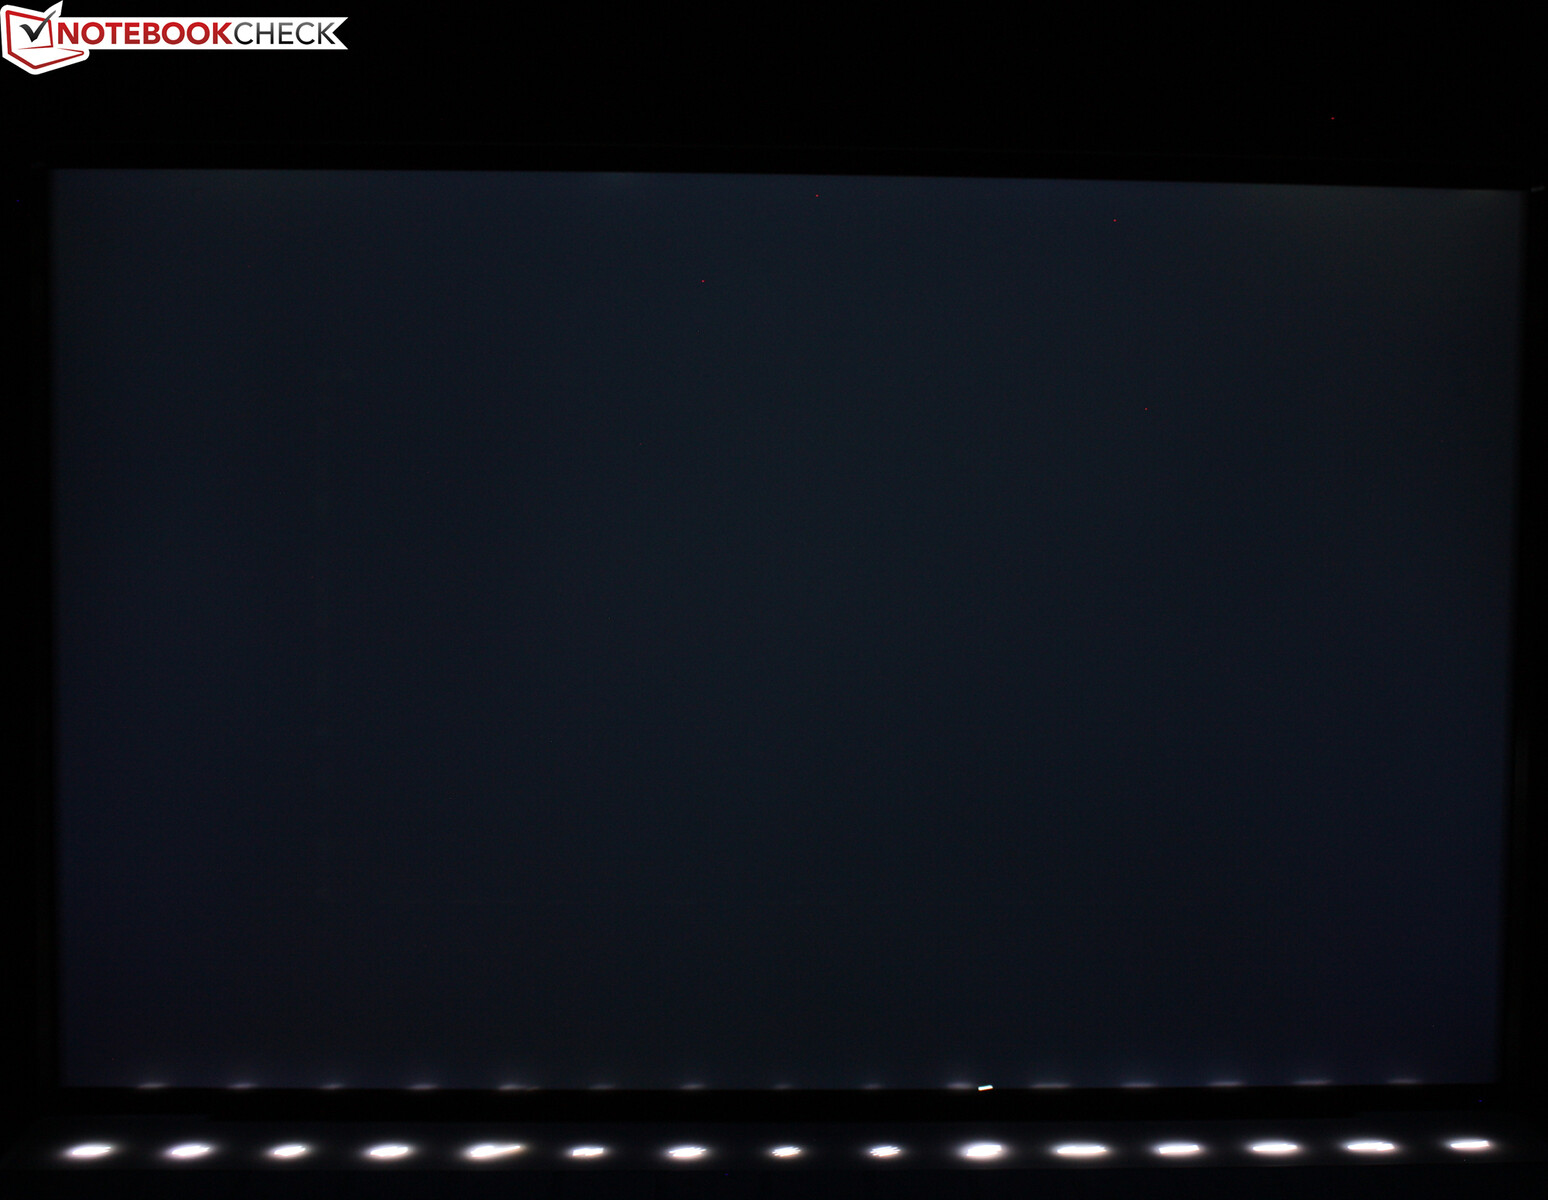
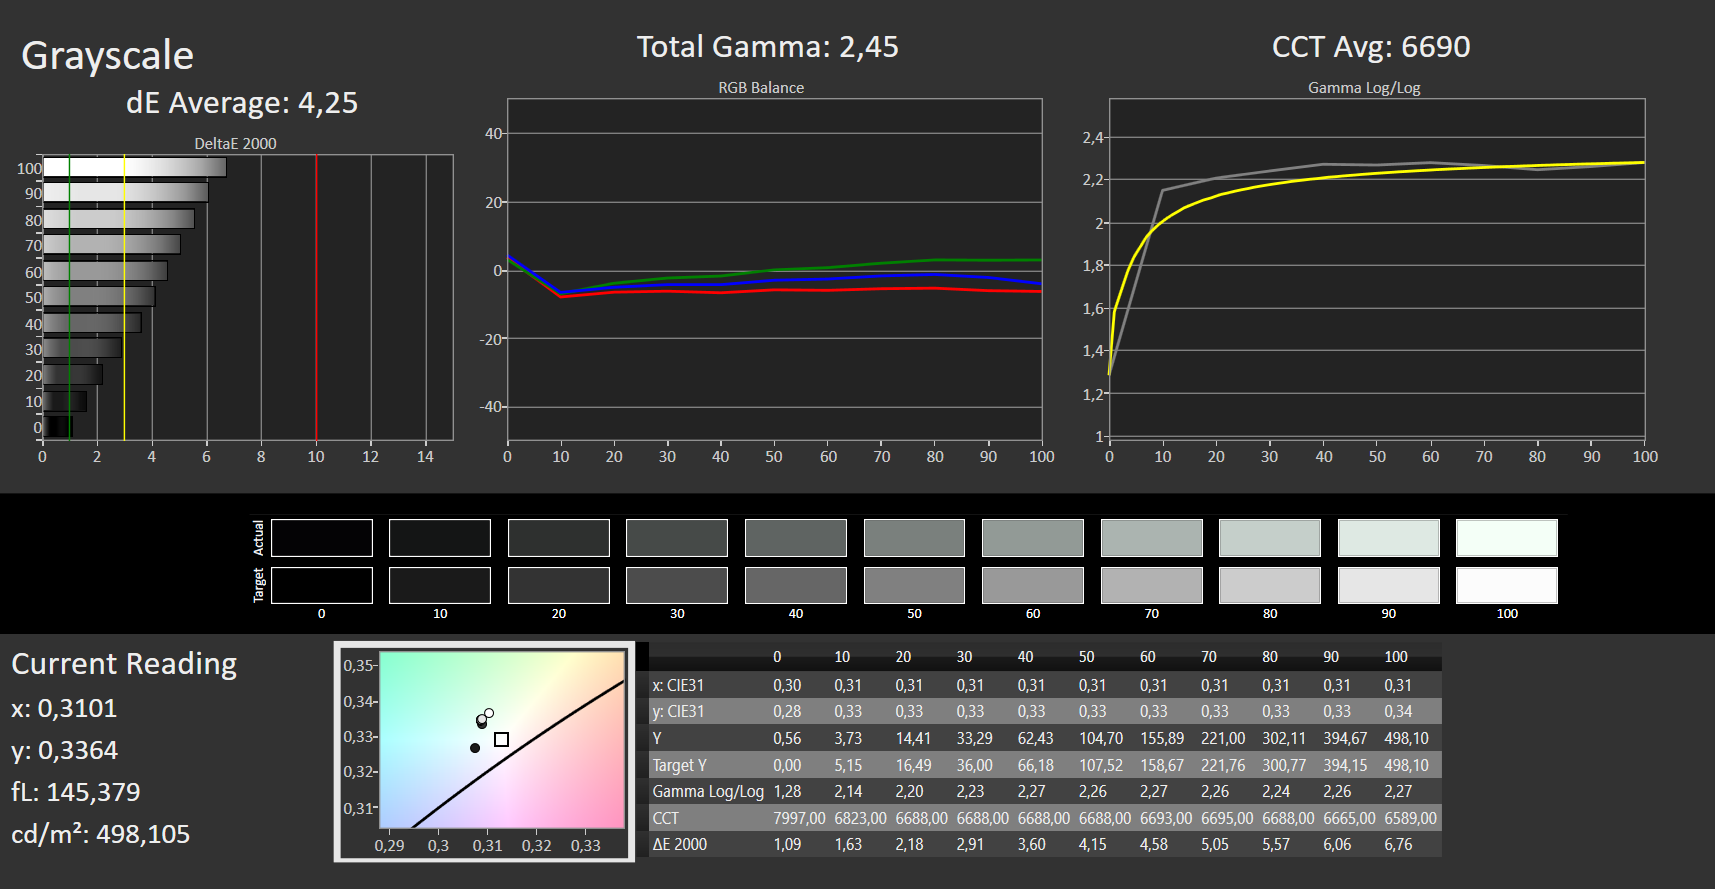
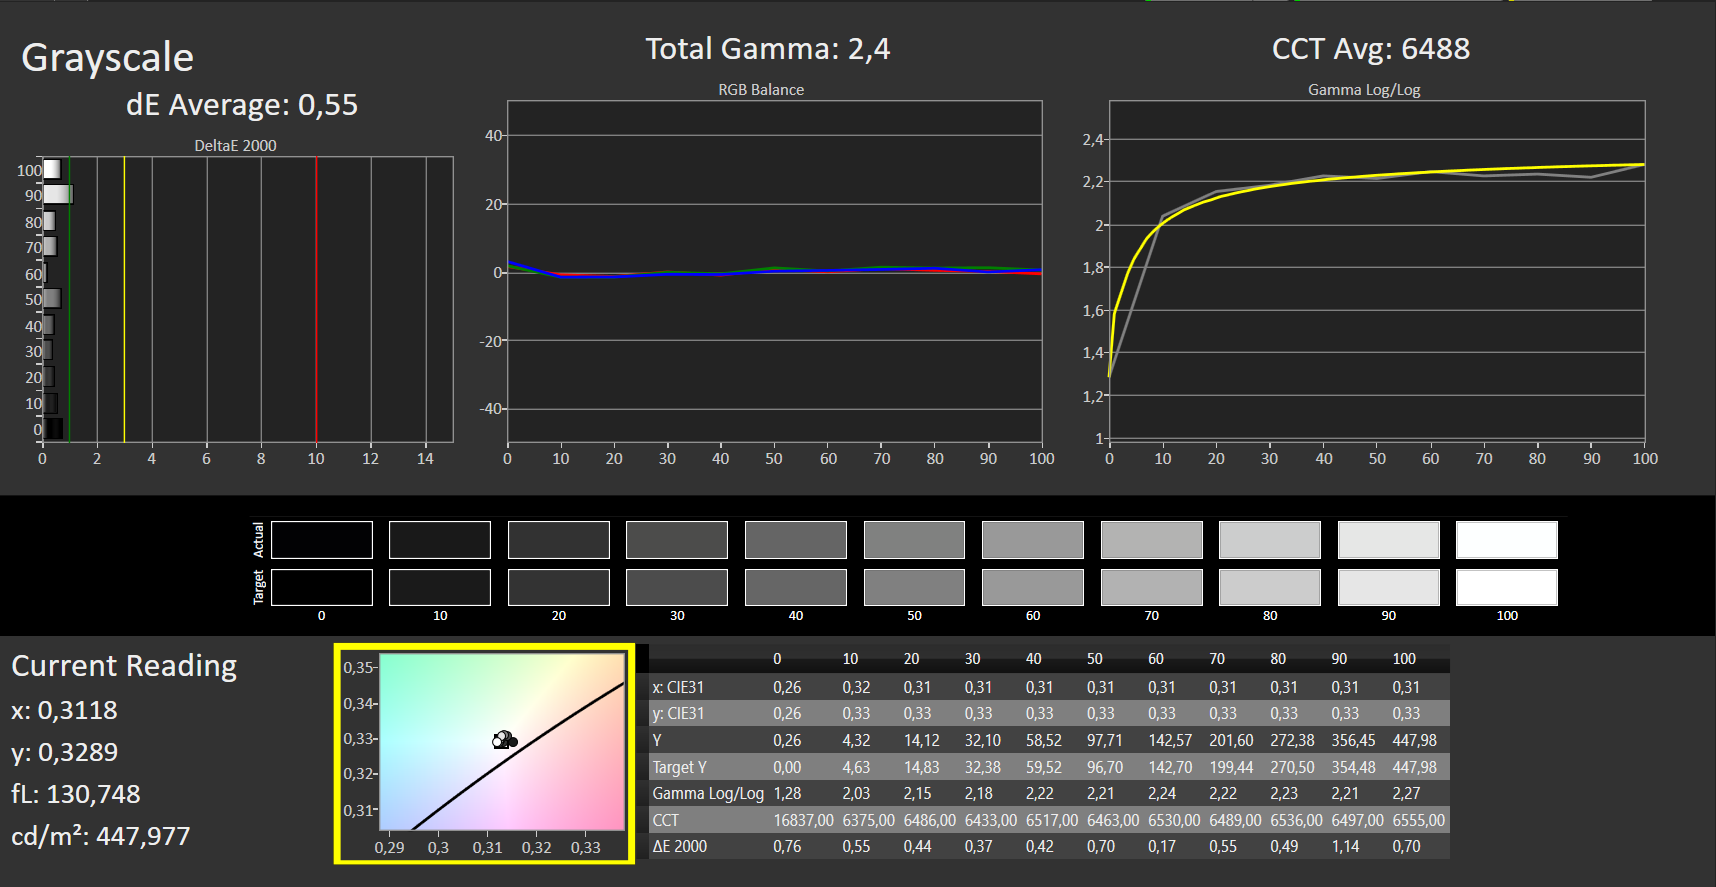
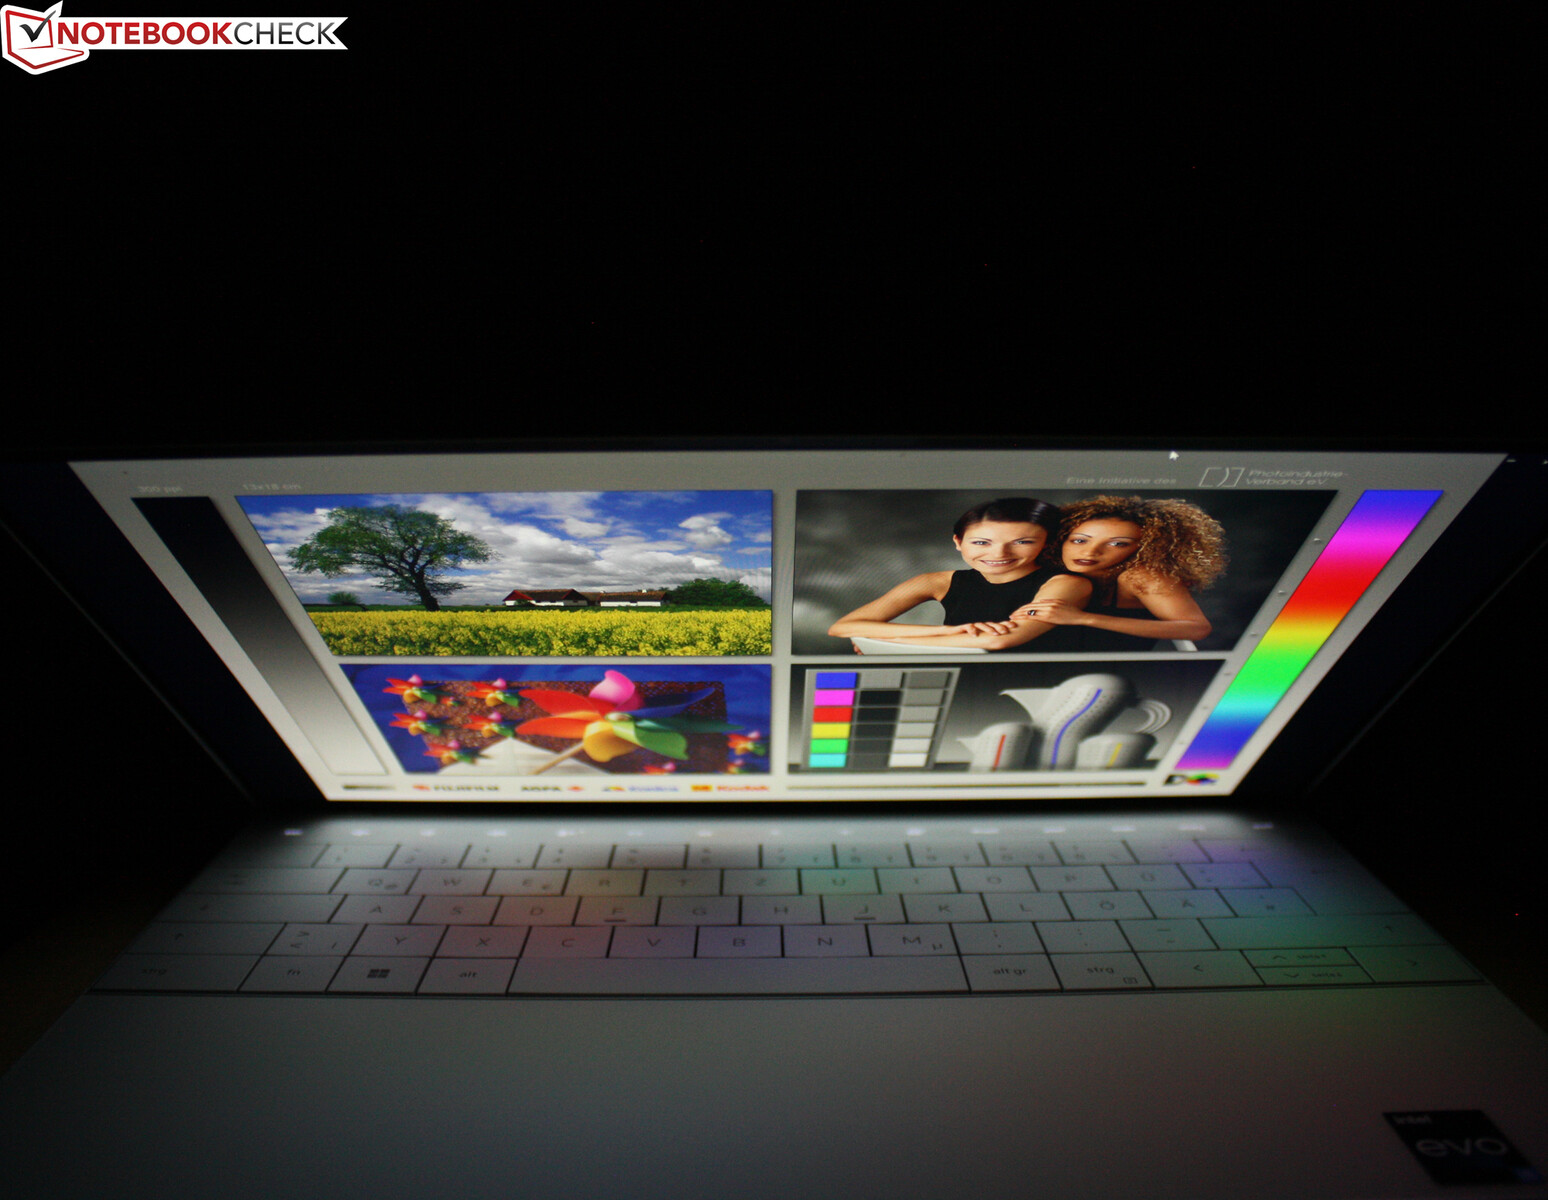
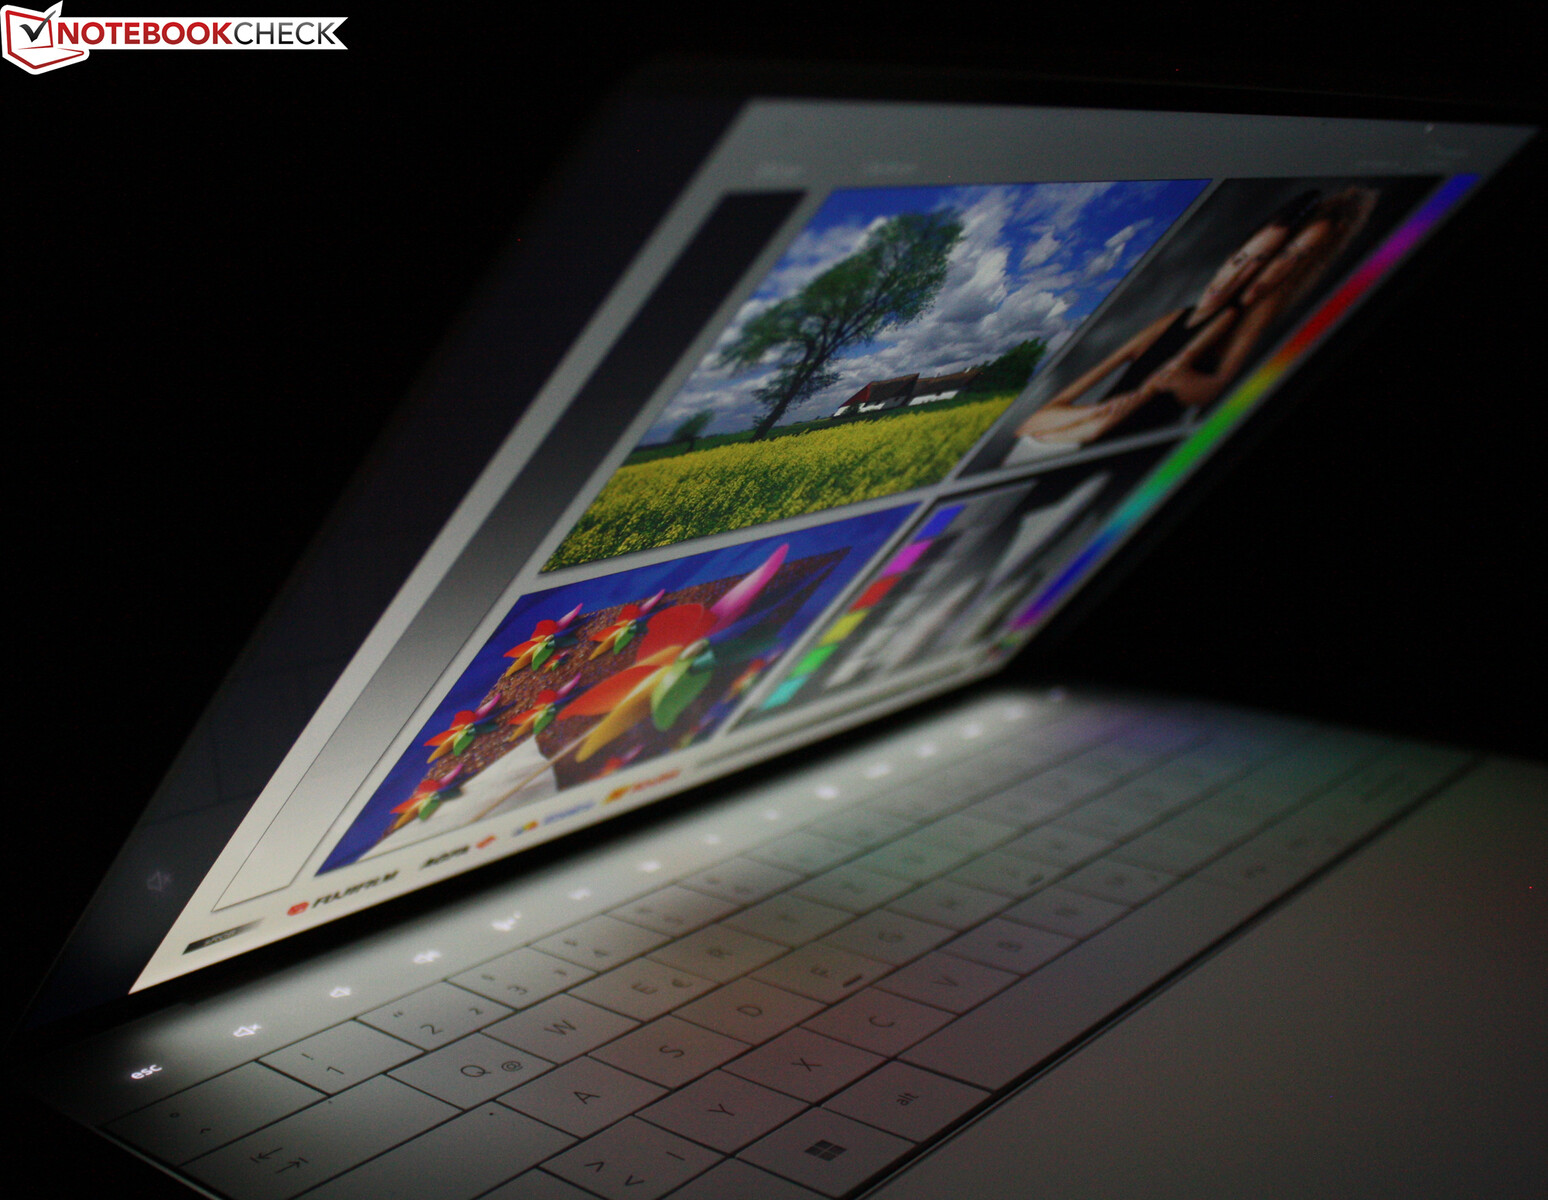
Our XPS Plus 9320 has the most basic panel variant on board, the 1,920x1,200 pixel LQ134N1 from Sharp. It's the same panel as in the XPS 9315 entry-level model, and accordingly, all parameters ranging from contrast to brightness and up to color space are very similar. Screen bleeding is marginally visible on the top left edge when using a black background and full brightness. The brightness is high at 460 cd/m² (average), and we find the manufacturer's specification of 500 cd/m² to be true (max 498 cd/m²).
The 4K panel in the Plus version with the i7 (Sharp LQ134R1) had an identical brightness of 473 cd/m² (average) in our measurements, but it had a higher contrast. 1,764:1 instead of 940:1; that's an argument in favor of the 4K panel. There's an alternative OLED panel for the Plus version, but we haven't had the chance to review it yet.
Brightness is slightly decreased on battery power, dropping by 78 cd/m² (center: 420 cd/m²). The XPS 13 Plus doesn't use PWM to lower brightness levels. The three screenshots show a homogeneous line at 100%, 50% and 0% brightness.
| |||||||||||||||||||||||||
Brightness Distribution: 85 %
Center on Battery: 420 cd/m²
Contrast: 940:1 (Black: 0.53 cd/m²)
ΔE ColorChecker Calman: 3.65 | ∀{0.5-29.43 Ø4.78}
calibrated: 2.16
ΔE Greyscale Calman: 4.25 | ∀{0.09-98 Ø5}
71% AdobeRGB 1998 (Argyll 3D)
99% sRGB (Argyll 3D)
69% Display P3 (Argyll 3D)
Gamma: 2.45
CCT: 6690 K
| Dell XPS 13 Plus 9320 i5-1240p Sharp SHP1548 LQ134N1, IPS, 1920x1200, 13.4" | Dell XPS 13 9315, i5-1230U Sharp SHP1548 LQ134N1, IPS, 1920x1200, 13.4" | Dell XPS 13 Plus 9320 4K LQ134R1, IPS, 3840x2400, 13.4" | Apple MacBook Air 2020 M1 Entry IPS, 2560x1600, 13.3" | Asus Zenbook S 13 OLED SDC4172, OLED, 2880x1800, 13.3" | Lenovo ThinkPad X1 Nano-20UN002UGE MND007ZA1-2, IPS, 2160x1350, 13" | Huawei MateBook 13s i5 11300H TL134GDXP02-0, LTPS, 2520x1680, 13.4" | |
|---|---|---|---|---|---|---|---|
| Display | 0% | 6% | 22% | 28% | 1% | -6% | |
| Display P3 Coverage (%) | 69 | 69 0% | 76.5 11% | 98.6 43% | 99.8 45% | 70.4 2% | 65.2 -6% |
| sRGB Coverage (%) | 99 | 100 1% | 100 1% | 100 1% | 100 1% | 99.9 1% | 92 -7% |
| AdobeRGB 1998 Coverage (%) | 71 | 71 0% | 76 7% | 85.9 21% | 97.8 38% | 72 1% | 67.5 -5% |
| Response Times | 3% | 5% | 4% | 94% | -19% | -5% | |
| Response Time Grey 50% / Grey 80% * (ms) | 45 ? | 40 ? 11% | 38.9 ? 14% | 31 ? 31% | 2.1 ? 95% | 46.8 ? -4% | 44.8 ? -0% |
| Response Time Black / White * (ms) | 21 ? | 22 ? -5% | 21.9 ? -4% | 26.1 ? -24% | 1.68 ? 92% | 28 ? -33% | 22.8 ? -9% |
| PWM Frequency (Hz) | 118000 ? | 240.4 ? | 9804 ? | ||||
| Screen | 10% | 28% | 30% | 215% | 39% | 35% | |
| Brightness middle (cd/m²) | 498 | 466 -6% | 494 -1% | 417 -16% | 336 -33% | 460 -8% | 468 -6% |
| Brightness (cd/m²) | 460 | 442 -4% | 474 3% | 395 -14% | 338 -27% | 434 -6% | 450 -2% |
| Brightness Distribution (%) | 85 | 89 5% | 89 5% | 91 7% | 99 16% | 92 8% | 92 8% |
| Black Level * (cd/m²) | 0.53 | 0.4 25% | 0.28 47% | 0.39 26% | 0.02 96% | 0.27 49% | 0.23 57% |
| Contrast (:1) | 940 | 1165 24% | 1764 88% | 1069 14% | 16800 1687% | 1704 81% | 2035 116% |
| Colorchecker dE 2000 * | 3.65 | 3.03 17% | 3.1 15% | 1.12 69% | 1.8 51% | 1.1 70% | 2 45% |
| Colorchecker dE 2000 max. * | 7.11 | 6.68 6% | 4.2 41% | 2.71 62% | 3.8 47% | 4.5 37% | 5.5 23% |
| Colorchecker dE 2000 calibrated * | 2.16 | 2.34 -8% | 1.5 31% | 0.77 64% | 1.8 17% | 1 54% | 1.5 31% |
| Greyscale dE 2000 * | 4.25 | 3.12 27% | 3.2 25% | 1.7 60% | 0.9 79% | 1.6 62% | 2.6 39% |
| Gamma | 2.45 90% | 2.41 91% | 2.41 91% | 2207 0% | 2.22 99% | 2.2 100% | 2.17 101% |
| CCT | 6690 97% | 6418 101% | 6189 105% | 6870 95% | 6580 99% | 6475 100% | 6511 100% |
| Color Space (Percent of AdobeRGB 1998) (%) | 65.7 | ||||||
| Color Space (Percent of sRGB) (%) | 99.9 | ||||||
| Total Average (Program / Settings) | 4% /
7% | 13% /
20% | 19% /
25% | 112% /
157% | 7% /
22% | 8% /
20% |
* ... smaller is better
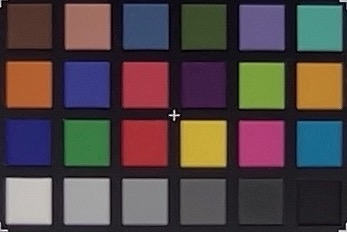
We notice two things during our analysis with the professional CalMAN software (X-Rite i1 Pro 2): 100% of sRGB is covered. In addition, there's a Delta E of over 4.0 for the grayscale and just under 4 for colors. This makes a calibration highly recommendable, as it eliminates the slight color impact with gray. The effort of performing a calibration is rewarded with an excellent Delta E of under 0.5. If you have the same display configuration (Sharp LQ134N1), you can enhance your Dell laptop by using the color profile provided in the box above.

Display Response Times
| ↔ Response Time Black to White | ||
|---|---|---|
| 21 ms ... rise ↗ and fall ↘ combined | ↗ 8 ms rise |  |
| ↘ 13 ms fall | ||
| The screen shows good response rates in our tests, but may be too slow for competitive gamers. In comparison, all tested devices range from 0.1 (minimum) to 240 (maximum) ms. » 45 % of all devices are better. This means that the measured response time is similar to the average of all tested devices (20.2 ms). | ||
| ↔ Response Time 50% Grey to 80% Grey | ||
| 45 ms ... rise ↗ and fall ↘ combined | ↗ 20 ms rise |  |
| ↘ 25 ms fall | ||
| The screen shows slow response rates in our tests and will be unsatisfactory for gamers. In comparison, all tested devices range from 0.165 (minimum) to 636 (maximum) ms. » 76 % of all devices are better. This means that the measured response time is worse than the average of all tested devices (31.6 ms). | ||
Screen Flickering / PWM (Pulse-Width Modulation)
| Screen flickering / PWM not detected | ≤ 100 % brightness setting |    | |
In comparison: 53 % of all tested devices do not use PWM to dim the display. If PWM was detected, an average of 8095 (minimum: 5 - maximum: 343500) Hz was measured. | |||
The anti-reflective Full HD panel comes into its own in the sun with its 400-nit brightness, but dull reflections are hard to avoid in sunlight.
Performance - Less sustained power with the Intel i5
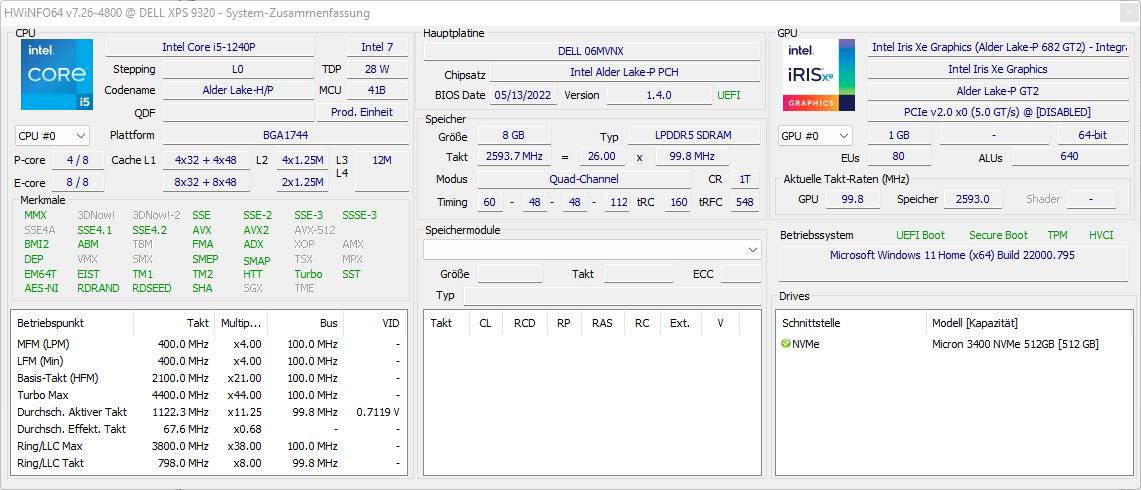
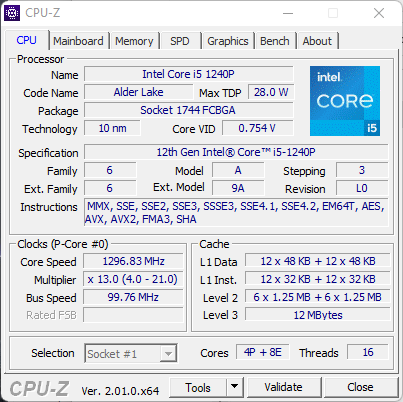
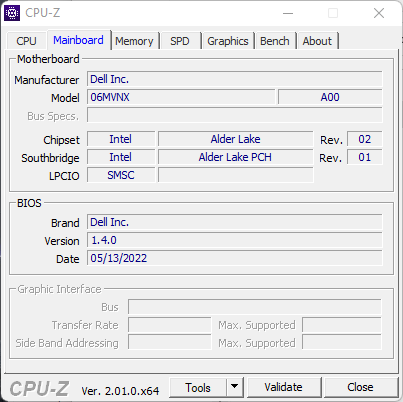
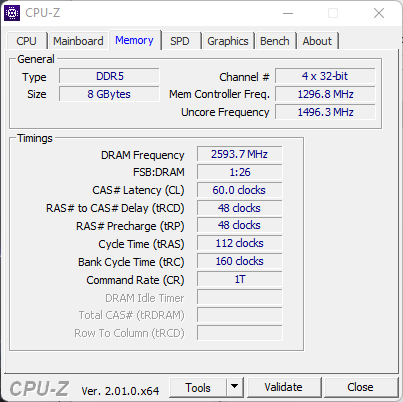
The XPS 13 Plus is exclusively equipped with Alder Lake P processors, i.e. with the Core i5-1240P and Core i7-1260P (4 performance and 8 efficiency cores in each case), or alternatively with the Core i7-1280P that has two additional performance cores. Users can choose between 8, 16 or 32 GB of RAM (LPDDR5-5200); the 32 GB of RAM is only available in combination with one of the i7 CPUs. Our test device has to manage with 8 GB of LPDDR5 memory; RAM is integrated, but connected in dual-channel mode. A 512 GB M.2 SSD from Micron rounds out the package. The SSD is slotted in.
Test conditions
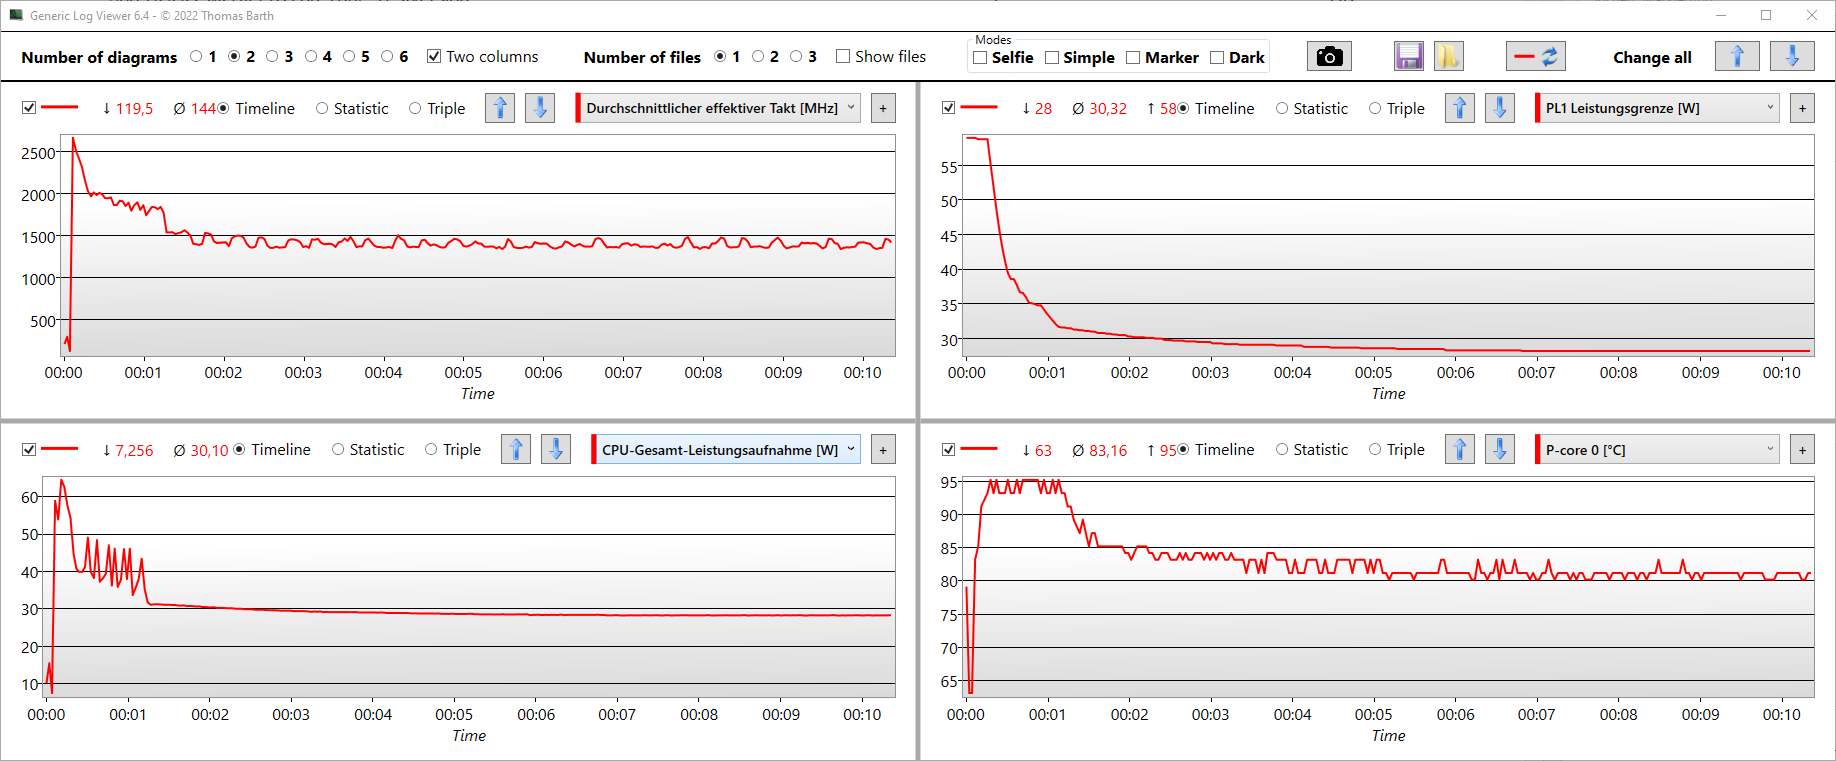
Dell provides four different performance profiles in the preinstalled Power Manager (Optimized, Quiet, Ultra Performance and Cool), but we won't look at the Cool profile any further. We performed the following benchmarks and measurements using the Ultra Performance mode. With its two fans, the cooling performance of the XPS 13 Plus is pretty good for a compact device. In everyday use and during short-term peak load, the device is often silent even in this mode. The two fans are a bit louder under maximum CPU load, but performance is also decent in return. The processor can theoretically consume up to 64 watts in all three modes, but only Ultra Performance mode is able to maintain the PL1 performance limit (59 watts) starting with Cinebench R15.
Processor
With its 4 performance and 8 efficiency cores, the Core i5-1240P ranks in the top field in terms of performance as our CPU performance rating shows below. The 1260P is at the top, followed by the Ryzen 7 6800U. The P-cores run at up to 4.4 GHz, but this is only achieved under single-core load. This is exactly the kind of load that is still important in everyday use, which is why a look at the single-core results is advisable. The Alder Lake P chips are slightly ahead here (Cinebench), followed by the AMD 6800U once again. Depending on the benchmark, though, there are also sharp deviations from this like the Apple M1 shows in the Blender test.
We ran the Cinebench R15 Multi benchmark under the three performance modes. In Ultra Performance (red), a PL1 of 59 watts is allowed, and the clock rate of 3.0 GHz is also the highest. The Optimized mode lowers the PL1 to 56 watts, as does the Quiet mode. However, the clock speed begins to undergo gradual throttling after only 5 seconds in Quiet mode, which is why the PL1 then drops to just under 50 watts (PL2: 48 watts), while the clock speed drops accordingly to 2.5 GHz.
In the Cinebench R15 Multi loop, the clock rate increases to 3.0 GHz before dropping to 2.5 GHz along with a drop in total power consumption. Since the P-cores are already heating up to 95 °C (~203 °F), the clock speed is continuously reduced in all subsequent runs of the R15 loop, which is why the scores drop as well. The score is no longer 1,591 points after about 20 runs, but only 1,213 points. This is a loss of 24%. The i5-1230U in the entry-level XPS lags far behind by around 500 points. Once again, the AMD competition proves to be solid and can't be knocked off the throne. The Asus Zenbook S13 OLED leads the R15 chart.
Cinebench's Multi loop once again confirms the weak point of the Alder Lake processors. At first, multi-core performance is practically on par with the current AMD Ryzen 7 6800U, which consumes significantly less power with a maximum of 30 watts. Subsequently, the i5/i7 in the XPS 13 Plus settles at 34 watts, but it delivers less performance than the 6800U in the ZenBook S 13 at 25 watts.
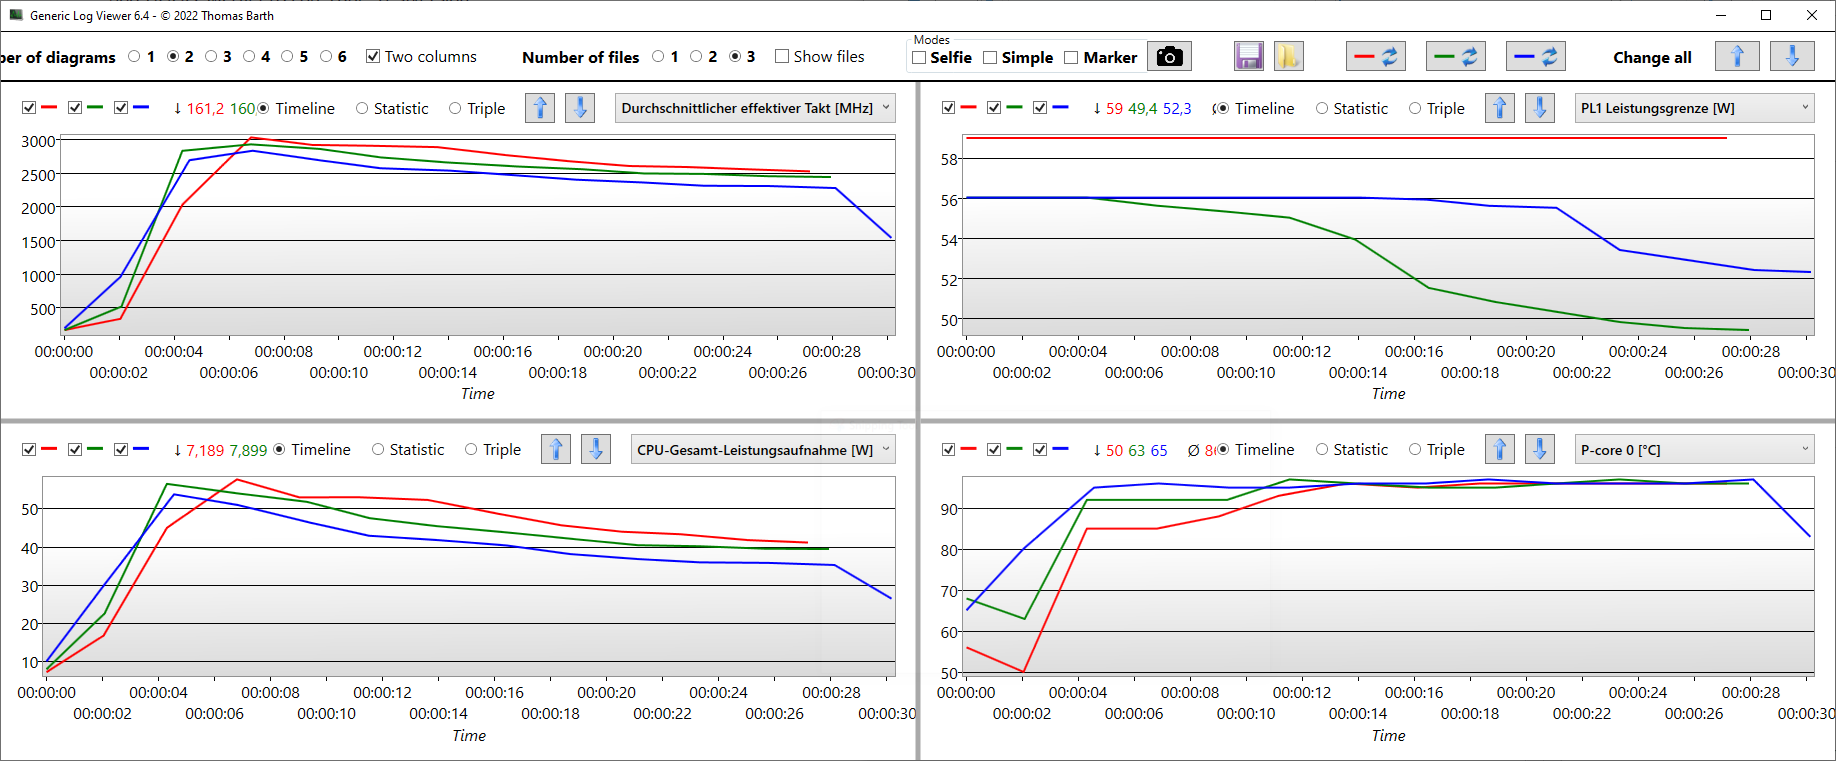
Cinebench R15 Multi endurance test
Cinebench R15: CPU Single 64Bit | CPU Multi 64Bit
Cinebench R20: CPU (Multi Core) | CPU (Single Core)
Cinebench R23: Multi Core | Single Core
Blender: v2.79 BMW27 CPU
7-Zip 18.03: 7z b 4 | 7z b 4 -mmt1
LibreOffice : 20 Documents To PDF
R Benchmark 2.5: Overall mean
HWBOT x265 Benchmark v2.2: 4k Preset
| CPU Performance rating | |
| Average of class Subnotebook | |
| Dell XPS 13 Plus 9320 4K | |
| Asus Zenbook S 13 OLED | |
| Dell XPS 13 Plus 9320 i5-1240p | |
| Average Intel Core i5-1240P | |
| Apple MacBook Air 2020 M1 Entry -1! | |
| Huawei MateBook 13s i5 11300H | |
| Lenovo ThinkPad X1 Nano-20UN002UGE -1! | |
| Cinebench R15 / CPU Single 64Bit | |
| Average of class Subnotebook (72.4 - 322, n=69, last 2 years) | |
| Dell XPS 13 Plus 9320 4K | |
| Asus Zenbook S 13 OLED | |
| Dell XPS 13 Plus 9320 i5-1240p | |
| Apple MacBook Air 2020 M1 Entry | |
| Lenovo ThinkPad X1 Nano-20UN002UGE | |
| Huawei MateBook 13s i5 11300H | |
| Average Intel Core i5-1240P (91.8 - 243, n=18) | |
| Cinebench R15 / CPU Multi 64Bit | |
| Average of class Subnotebook (327 - 3345, n=69, last 2 years) | |
| Asus Zenbook S 13 OLED | |
| Dell XPS 13 Plus 9320 4K | |
| Dell XPS 13 Plus 9320 4K | |
| Dell XPS 13 Plus 9320 i5-1240p | |
| Average Intel Core i5-1240P (407 - 2007, n=19) | |
| Apple MacBook Air 2020 M1 Entry | |
| Huawei MateBook 13s i5 11300H | |
| Huawei MateBook 13s i5 11300H | |
| Lenovo ThinkPad X1 Nano-20UN002UGE | |
| Cinebench R20 / CPU (Multi Core) | |
| Average of class Subnotebook (579 - 8541, n=69, last 2 years) | |
| Asus Zenbook S 13 OLED | |
| Dell XPS 13 Plus 9320 4K | |
| Dell XPS 13 Plus 9320 i5-1240p | |
| Average Intel Core i5-1240P (763 - 4456, n=16) | |
| Huawei MateBook 13s i5 11300H | |
| Apple MacBook Air 2020 M1 Entry | |
| Lenovo ThinkPad X1 Nano-20UN002UGE | |
| Cinebench R20 / CPU (Single Core) | |
| Average of class Subnotebook (128 - 826, n=69, last 2 years) | |
| Dell XPS 13 Plus 9320 4K | |
| Dell XPS 13 Plus 9320 i5-1240p | |
| Asus Zenbook S 13 OLED | |
| Average Intel Core i5-1240P (251 - 653, n=16) | |
| Lenovo ThinkPad X1 Nano-20UN002UGE | |
| Huawei MateBook 13s i5 11300H | |
| Apple MacBook Air 2020 M1 Entry | |
| Cinebench R23 / Multi Core | |
| Average of class Subnotebook (1555 - 21812, n=74, last 2 years) | |
| Asus Zenbook S 13 OLED | |
| Dell XPS 13 Plus 9320 4K | |
| Dell XPS 13 Plus 9320 i5-1240p | |
| Average Intel Core i5-1240P (277 - 11556, n=20) | |
| Apple MacBook Air 2020 M1 Entry | |
| Lenovo ThinkPad X1 Nano-20UN002UGE | |
| Huawei MateBook 13s i5 11300H | |
| Cinebench R23 / Single Core | |
| Average of class Subnotebook (358 - 2165, n=75, last 2 years) | |
| Dell XPS 13 Plus 9320 4K | |
| Dell XPS 13 Plus 9320 i5-1240p | |
| Apple MacBook Air 2020 M1 Entry | |
| Asus Zenbook S 13 OLED | |
| Average Intel Core i5-1240P (640 - 1689, n=18) | |
| Huawei MateBook 13s i5 11300H | |
| Blender / v2.79 BMW27 CPU | |
| Apple MacBook Air 2020 M1 Entry | |
| Lenovo ThinkPad X1 Nano-20UN002UGE | |
| Huawei MateBook 13s i5 11300H | |
| Average Intel Core i5-1240P (285 - 1926, n=16) | |
| Dell XPS 13 Plus 9320 i5-1240p | |
| Average of class Subnotebook (159 - 2271, n=72, last 2 years) | |
| Dell XPS 13 Plus 9320 4K | |
| Asus Zenbook S 13 OLED | |
| 7-Zip 18.03 / 7z b 4 | |
| Asus Zenbook S 13 OLED | |
| Average of class Subnotebook (11668 - 77867, n=69, last 2 years) | |
| Dell XPS 13 Plus 9320 4K | |
| Dell XPS 13 Plus 9320 i5-1240p | |
| Apple MacBook Air 2020 M1 Entry | |
| Average Intel Core i5-1240P (7254 - 47002, n=16) | |
| Huawei MateBook 13s i5 11300H | |
| Lenovo ThinkPad X1 Nano-20UN002UGE | |
| 7-Zip 18.03 / 7z b 4 -mmt1 | |
| Average of class Subnotebook (2643 - 6442, n=71, last 2 years) | |
| Apple MacBook Air 2020 M1 Entry | |
| Asus Zenbook S 13 OLED | |
| Dell XPS 13 Plus 9320 4K | |
| Huawei MateBook 13s i5 11300H | |
| Dell XPS 13 Plus 9320 i5-1240p | |
| Lenovo ThinkPad X1 Nano-20UN002UGE | |
| Average Intel Core i5-1240P (2197 - 5320, n=16) | |
| LibreOffice / 20 Documents To PDF | |
| Dell XPS 13 Plus 9320 i5-1240p | |
| Average Intel Core i5-1240P (46.4 - 120.5, n=16) | |
| Average of class Subnotebook (38.5 - 220, n=68, last 2 years) | |
| Asus Zenbook S 13 OLED | |
| Lenovo ThinkPad X1 Nano-20UN002UGE | |
| Huawei MateBook 13s i5 11300H | |
| Dell XPS 13 Plus 9320 4K | |
| Apple MacBook Air 2020 M1 Entry | |
| R Benchmark 2.5 / Overall mean | |
| Apple MacBook Air 2020 M1 Entry | |
| Lenovo ThinkPad X1 Nano-20UN002UGE | |
| Huawei MateBook 13s i5 11300H | |
| Average Intel Core i5-1240P (0.4987 - 1.236, n=16) | |
| Asus Zenbook S 13 OLED | |
| Average of class Subnotebook (0.403 - 1.456, n=70, last 2 years) | |
| Dell XPS 13 Plus 9320 i5-1240p | |
| Dell XPS 13 Plus 9320 4K | |
| HWBOT x265 Benchmark v2.2 / 4k Preset | |
| Average of class Subnotebook (0.97 - 25.1, n=69, last 2 years) | |
| Asus Zenbook S 13 OLED | |
| Dell XPS 13 Plus 9320 4K | |
| Dell XPS 13 Plus 9320 i5-1240p | |
| Average Intel Core i5-1240P (1.99 - 12.9, n=16) | |
| Huawei MateBook 13s i5 11300H | |
| Lenovo ThinkPad X1 Nano-20UN002UGE | |
* ... smaller is better
AIDA64: FP32 Ray-Trace | FPU Julia | CPU SHA3 | CPU Queen | FPU SinJulia | FPU Mandel | CPU AES | CPU ZLib | FP64 Ray-Trace | CPU PhotoWorxx
| Performance rating | |
| Average of class Subnotebook | |
| Asus Zenbook S 13 OLED | |
| Huawei MateBook 13s i5 11300H | |
| Dell XPS 13 Plus 9320 4K | |
| Dell XPS 13 Plus 9320 i5-1240p | |
| Average Intel Core i5-1240P | |
| Lenovo ThinkPad X1 Nano-20UN002UGE | |
| AIDA64 / FP32 Ray-Trace | |
| Average of class Subnotebook (1135 - 32888, n=68, last 2 years) | |
| Asus Zenbook S 13 OLED | |
| Huawei MateBook 13s i5 11300H | |
| Lenovo ThinkPad X1 Nano-20UN002UGE | |
| Average Intel Core i5-1240P (2405 - 9694, n=16) | |
| Dell XPS 13 Plus 9320 4K | |
| Dell XPS 13 Plus 9320 i5-1240p | |
| AIDA64 / FPU Julia | |
| Asus Zenbook S 13 OLED | |
| Average of class Subnotebook (5218 - 123315, n=68, last 2 years) | |
| Huawei MateBook 13s i5 11300H | |
| Average Intel Core i5-1240P (7407 - 49934, n=16) | |
| Lenovo ThinkPad X1 Nano-20UN002UGE | |
| Dell XPS 13 Plus 9320 4K | |
| Dell XPS 13 Plus 9320 i5-1240p | |
| AIDA64 / CPU SHA3 | |
| Average of class Subnotebook (444 - 5287, n=68, last 2 years) | |
| Asus Zenbook S 13 OLED | |
| Huawei MateBook 13s i5 11300H | |
| Lenovo ThinkPad X1 Nano-20UN002UGE | |
| Dell XPS 13 Plus 9320 4K | |
| Dell XPS 13 Plus 9320 i5-1240p | |
| Average Intel Core i5-1240P (415 - 2462, n=16) | |
| AIDA64 / CPU Queen | |
| Asus Zenbook S 13 OLED | |
| Dell XPS 13 Plus 9320 4K | |
| Dell XPS 13 Plus 9320 i5-1240p | |
| Average of class Subnotebook (10579 - 115682, n=68, last 2 years) | |
| Average Intel Core i5-1240P (29405 - 76736, n=16) | |
| Huawei MateBook 13s i5 11300H | |
| Lenovo ThinkPad X1 Nano-20UN002UGE | |
| AIDA64 / FPU SinJulia | |
| Asus Zenbook S 13 OLED | |
| Average of class Subnotebook (744 - 18418, n=68, last 2 years) | |
| Dell XPS 13 Plus 9320 4K | |
| Dell XPS 13 Plus 9320 i5-1240p | |
| Average Intel Core i5-1240P (2135 - 6540, n=16) | |
| Huawei MateBook 13s i5 11300H | |
| Lenovo ThinkPad X1 Nano-20UN002UGE | |
| AIDA64 / FPU Mandel | |
| Asus Zenbook S 13 OLED | |
| Average of class Subnotebook (3341 - 65433, n=68, last 2 years) | |
| Huawei MateBook 13s i5 11300H | |
| Lenovo ThinkPad X1 Nano-20UN002UGE | |
| Average Intel Core i5-1240P (5113 - 23992, n=16) | |
| Dell XPS 13 Plus 9320 i5-1240p | |
| Dell XPS 13 Plus 9320 4K | |
| AIDA64 / CPU AES | |
| Asus Zenbook S 13 OLED | |
| Huawei MateBook 13s i5 11300H | |
| Lenovo ThinkPad X1 Nano-20UN002UGE | |
| Average of class Subnotebook (638 - 161430, n=68, last 2 years) | |
| Average Intel Core i5-1240P (8849 - 90370, n=16) | |
| Dell XPS 13 Plus 9320 i5-1240p | |
| Dell XPS 13 Plus 9320 4K | |
| AIDA64 / CPU ZLib | |
| Average of class Subnotebook (164.9 - 1379, n=68, last 2 years) | |
| Dell XPS 13 Plus 9320 4K | |
| Dell XPS 13 Plus 9320 i5-1240p | |
| Asus Zenbook S 13 OLED | |
| Average Intel Core i5-1240P (101.6 - 812, n=16) | |
| Huawei MateBook 13s i5 11300H | |
| Lenovo ThinkPad X1 Nano-20UN002UGE | |
| AIDA64 / FP64 Ray-Trace | |
| Average of class Subnotebook (610 - 17495, n=68, last 2 years) | |
| Asus Zenbook S 13 OLED | |
| Huawei MateBook 13s i5 11300H | |
| Lenovo ThinkPad X1 Nano-20UN002UGE | |
| Average Intel Core i5-1240P (1154 - 5258, n=16) | |
| Dell XPS 13 Plus 9320 4K | |
| Dell XPS 13 Plus 9320 i5-1240p | |
| AIDA64 / CPU PhotoWorxx | |
| Average of class Subnotebook (6569 - 64588, n=68, last 2 years) | |
| Dell XPS 13 Plus 9320 4K | |
| Dell XPS 13 Plus 9320 i5-1240p | |
| Lenovo ThinkPad X1 Nano-20UN002UGE | |
| Huawei MateBook 13s i5 11300H | |
| Average Intel Core i5-1240P (11873 - 43661, n=16) | |
| Asus Zenbook S 13 OLED | |
System performance
In practice, the XPS 13 Plus is a responsive computer, but it ranks in the lower field in PC Mark 10. Why is that so? The reason is the low score in Essentials, which could be caused by the slow Micron SSD - more on that shortly. The 4K Plus with the Samsung SSD (1 TB) earns considerably more points in the sub-scores. In any case, no XPS Plus can take the lead from the Asus Zenbook S 13 OLED.
CrossMark: Overall | Productivity | Creativity | Responsiveness
| PCMark 10 / Score | |
| Average of class Subnotebook (4920 - 8424, n=56, last 2 years) | |
| Asus Zenbook S 13 OLED | |
| Dell XPS 13 Plus 9320 4K | |
| Average Intel Core i5-1240P, Intel Iris Xe Graphics G7 80EUs (4881 - 5345, n=11) | |
| Huawei MateBook 13s i5 11300H | |
| Dell XPS 13 Plus 9320 i5-1240p | |
| Dell XPS 13 9315, i5-1230U | |
| Lenovo ThinkPad X1 Nano-20UN002UGE | |
| PCMark 10 / Essentials | |
| Asus Zenbook S 13 OLED | |
| Average of class Subnotebook (8552 - 11406, n=56, last 2 years) | |
| Dell XPS 13 Plus 9320 4K | |
| Average Intel Core i5-1240P, Intel Iris Xe Graphics G7 80EUs (8890 - 10652, n=11) | |
| Dell XPS 13 9315, i5-1230U | |
| Huawei MateBook 13s i5 11300H | |
| Lenovo ThinkPad X1 Nano-20UN002UGE | |
| Dell XPS 13 Plus 9320 i5-1240p | |
| PCMark 10 / Productivity | |
| Average of class Subnotebook (5435 - 16132, n=56, last 2 years) | |
| Asus Zenbook S 13 OLED | |
| Dell XPS 13 Plus 9320 4K | |
| Dell XPS 13 Plus 9320 i5-1240p | |
| Average Intel Core i5-1240P, Intel Iris Xe Graphics G7 80EUs (6118 - 7058, n=11) | |
| Dell XPS 13 9315, i5-1230U | |
| Huawei MateBook 13s i5 11300H | |
| Lenovo ThinkPad X1 Nano-20UN002UGE | |
| PCMark 10 / Digital Content Creation | |
| Average of class Subnotebook (5722 - 12442, n=56, last 2 years) | |
| Asus Zenbook S 13 OLED | |
| Dell XPS 13 Plus 9320 4K | |
| Average Intel Core i5-1240P, Intel Iris Xe Graphics G7 80EUs (5169 - 6213, n=11) | |
| Dell XPS 13 Plus 9320 i5-1240p | |
| Huawei MateBook 13s i5 11300H | |
| Lenovo ThinkPad X1 Nano-20UN002UGE | |
| Dell XPS 13 9315, i5-1230U | |
| CrossMark / Overall | |
| Dell XPS 13 Plus 9320 4K | |
| Average of class Subnotebook (365 - 2038, n=69, last 2 years) | |
| Average Intel Core i5-1240P, Intel Iris Xe Graphics G7 80EUs (1392 - 1553, n=7) | |
| Asus Zenbook S 13 OLED | |
| Dell XPS 13 Plus 9320 i5-1240p | |
| Apple MacBook Air 2020 M1 Entry | |
| Huawei MateBook 13s i5 11300H | |
| Dell XPS 13 9315, i5-1230U | |
| CrossMark / Productivity | |
| Dell XPS 13 Plus 9320 4K | |
| Average of class Subnotebook (364 - 1918, n=69, last 2 years) | |
| Asus Zenbook S 13 OLED | |
| Average Intel Core i5-1240P, Intel Iris Xe Graphics G7 80EUs (1393 - 1524, n=7) | |
| Huawei MateBook 13s i5 11300H | |
| Dell XPS 13 Plus 9320 i5-1240p | |
| Dell XPS 13 9315, i5-1230U | |
| Apple MacBook Air 2020 M1 Entry | |
| CrossMark / Creativity | |
| Dell XPS 13 Plus 9320 4K | |
| Average of class Subnotebook (372 - 2396, n=69, last 2 years) | |
| Dell XPS 13 Plus 9320 i5-1240p | |
| Apple MacBook Air 2020 M1 Entry | |
| Average Intel Core i5-1240P, Intel Iris Xe Graphics G7 80EUs (1426 - 1647, n=7) | |
| Asus Zenbook S 13 OLED | |
| Dell XPS 13 9315, i5-1230U | |
| Huawei MateBook 13s i5 11300H | |
| CrossMark / Responsiveness | |
| Huawei MateBook 13s i5 11300H | |
| Dell XPS 13 Plus 9320 4K | |
| Average Intel Core i5-1240P, Intel Iris Xe Graphics G7 80EUs (1267 - 1545, n=7) | |
| Average of class Subnotebook (312 - 1889, n=69, last 2 years) | |
| Dell XPS 13 Plus 9320 i5-1240p | |
| Asus Zenbook S 13 OLED | |
| Dell XPS 13 9315, i5-1230U | |
| Apple MacBook Air 2020 M1 Entry | |
| PCMark 10 Score | 4903 points | |
Help | ||
| AIDA64 / Memory Copy | |
| Average of class Subnotebook (14554 - 109035, n=68, last 2 years) | |
| Dell XPS 13 Plus 9320 i5-1240p | |
| Average Intel Core i5-1240P (23312 - 70537, n=16) | |
| AIDA64 / Memory Read | |
| Average of class Subnotebook (15948 - 127174, n=68, last 2 years) | |
| Dell XPS 13 Plus 9320 i5-1240p | |
| Average Intel Core i5-1240P (18989 - 70553, n=16) | |
| AIDA64 / Memory Write | |
| Average of class Subnotebook (15709 - 117898, n=68, last 2 years) | |
| Dell XPS 13 Plus 9320 i5-1240p | |
| Average Intel Core i5-1240P (23454 - 62496, n=16) | |
DPC latencies
Our standardized latency test (web browsing, 4K YouTube, CPU load) reveals issues; the ACPI driver is causing problems. This was also the case with the XPS 13 Plus i7/4K. Therefore, the XPS 13 Plus is only suitable for using real-time audio applications to a limited extent with the current BIOS version/driver settings.
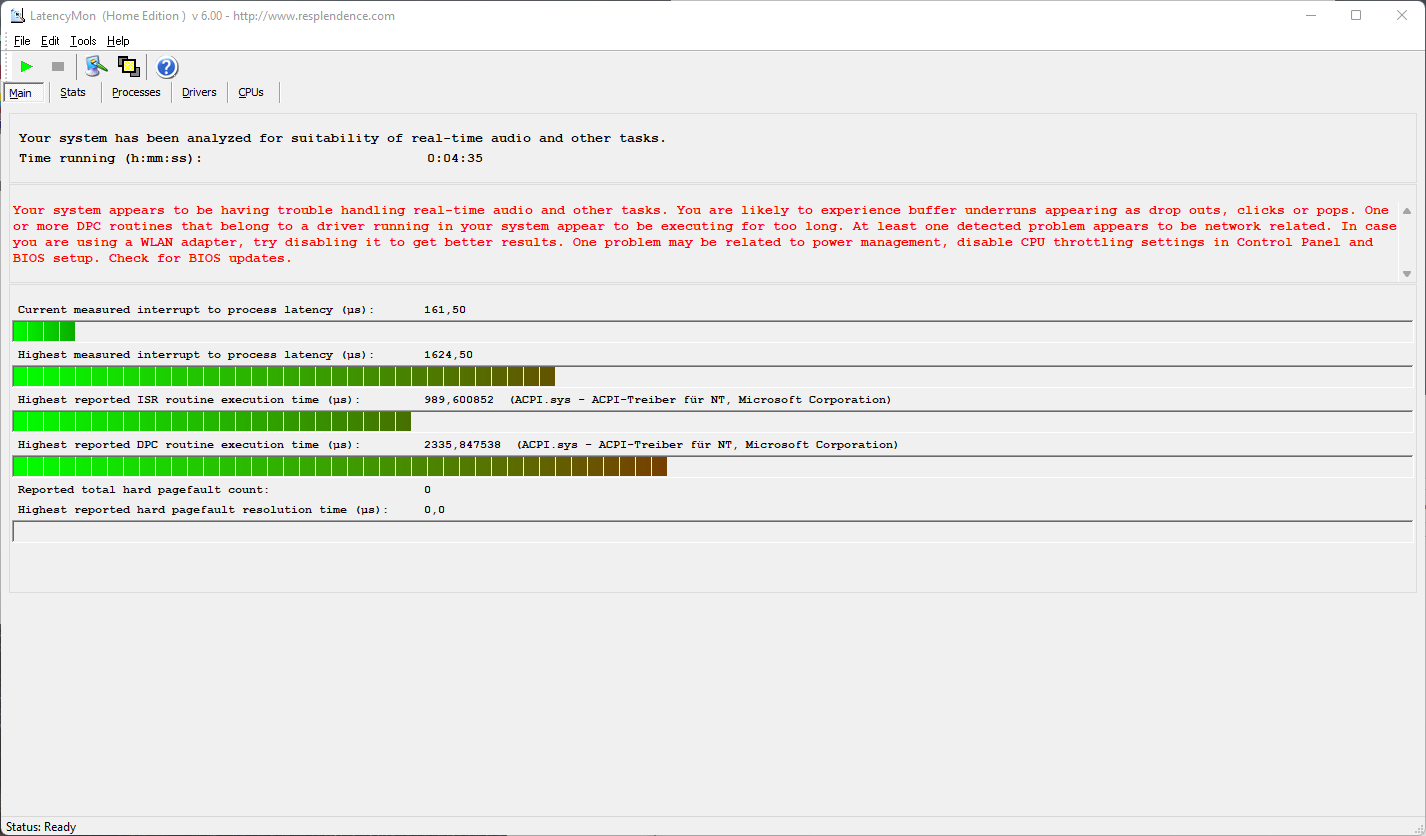
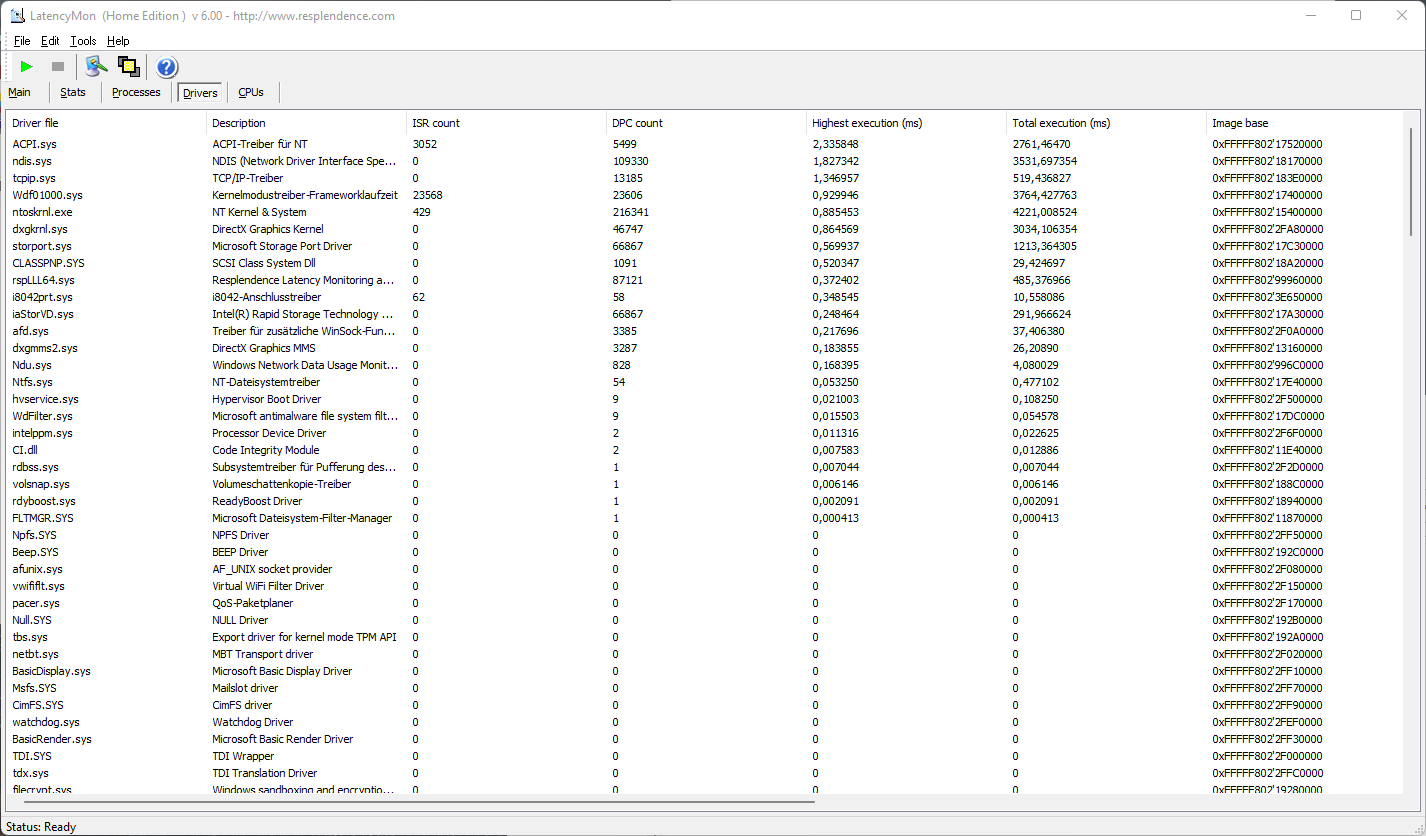
| DPC Latencies / LatencyMon - interrupt to process latency (max), Web, Youtube, Prime95 | |
| Dell XPS 13 Plus 9320 i5-1240p | |
| Lenovo ThinkPad X1 Nano-20UN002UGE | |
| Huawei MateBook 13s i5 11300H | |
| Dell XPS 13 Plus 9320 4K | |
| Asus Zenbook S 13 OLED | |
* ... smaller is better
Storage
The 512 GB Micron 3400 SSD is connected as an M.2 device. As a reminder, the XPS 13 Plus uses M.2 slots, which make it possible to upgrade the SSD later. The plain XPS 13 uses soldered onboard chips. Out of the 512 GB, about 312 GB is available for the user after the first boot.
The Micron 3400 comes in last place in the tests. The Phison and Samsung chips in the competition - but also in the XPS 13 Plus (i7 + 1 TB) - are simply faster. So not every XPS Plus has the best possible hardware on board: The 4K XPS 9320 with the 1 TB Samsung SSD performs better.
For additional comparisons and benchmarks, please refer to our HDD/SSD Benchmarks article.

* ... smaller is better
Continuous load read: DiskSpd Read Loop, Queue Depth 8
Graphics card
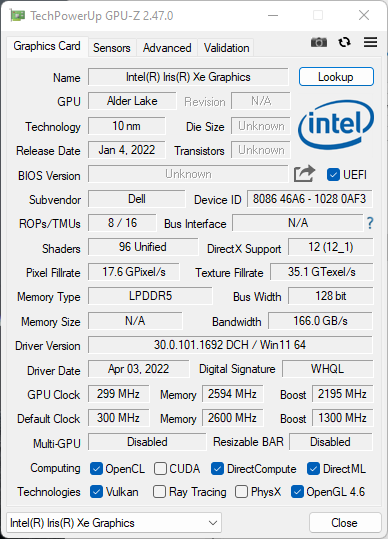
The Iris Xe Graphics G7 80EUs used in the Tiger Lake processors is an old acquaintance; it's also used in the Alder Lake CPUs. Overall, graphics performance is average based on the mixed 3DMark results. The same iGPU showed better results in the XPS 13 9305.
| 3DMark 11 Performance | 5500 points | |
| 3DMark Cloud Gate Standard Score | 10751 points | |
| 3DMark Fire Strike Score | 3722 points | |
| 3DMark Time Spy Score | 1290 points | |
Help | ||
Gaming performance
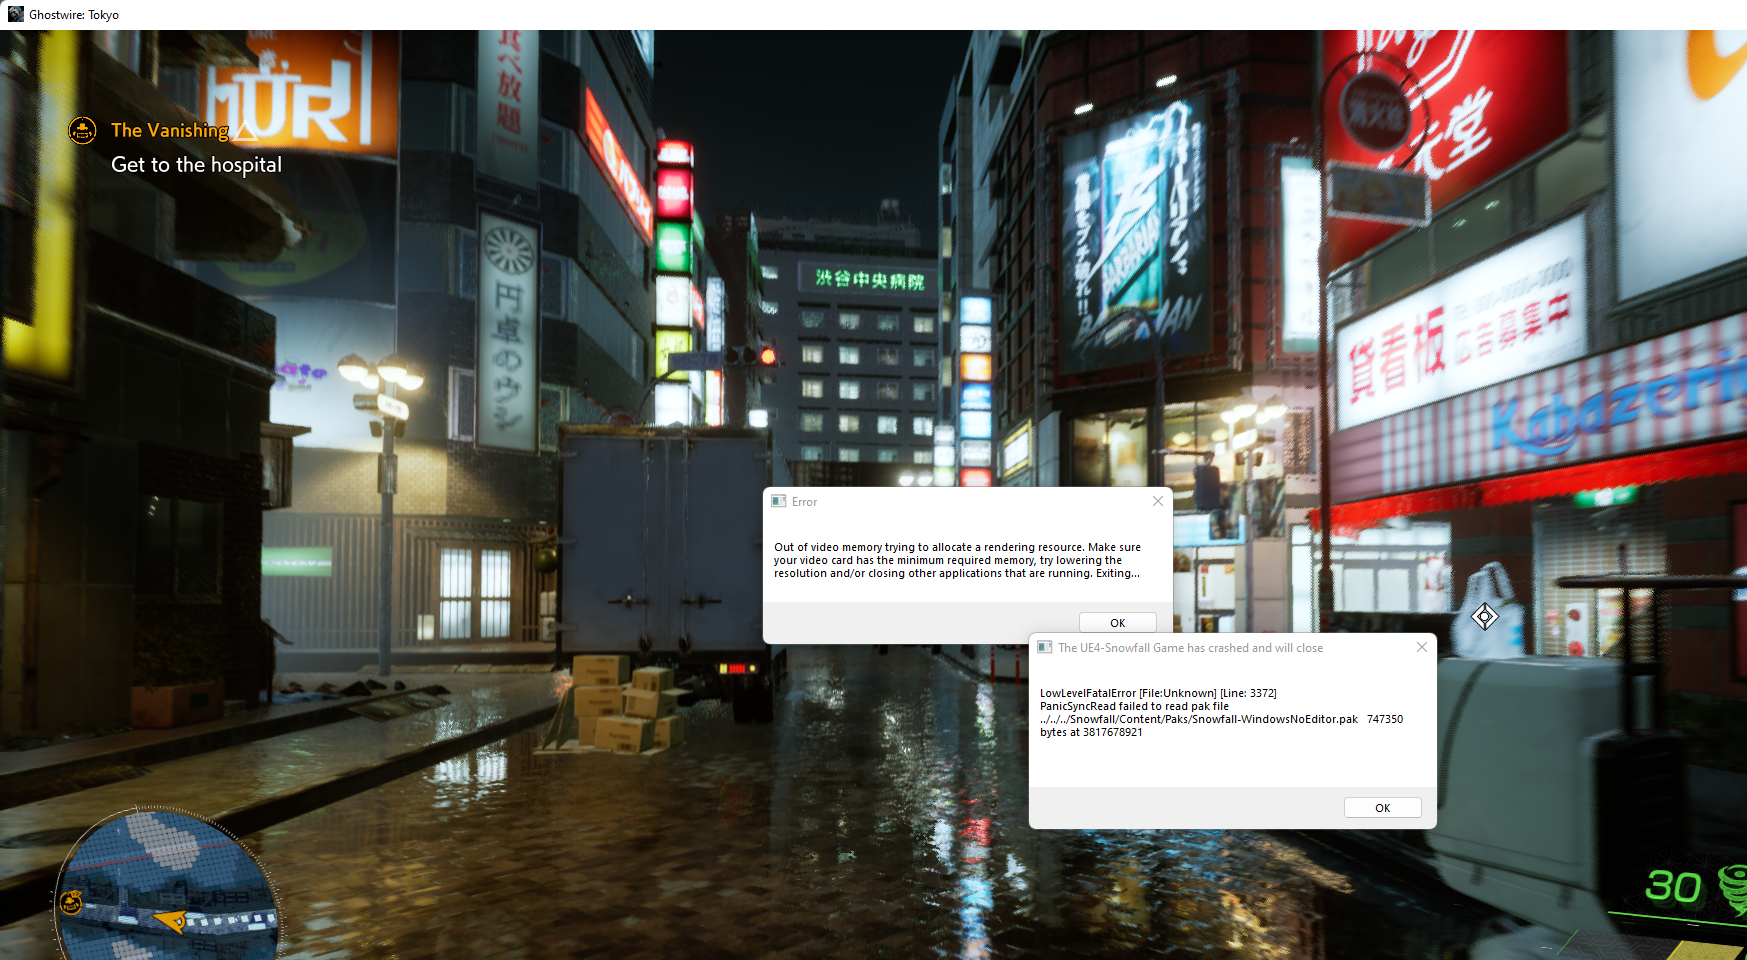
However, the Iris Xe is quite powerful here, although you're usually limited to medium or high details at best, even in simple titles. However, the Radeon 680M iGPU is significantly faster, including in gaming benchmarks. The Iris Xe Graphics G7 is a decent choice for everyday multimedia use, since even high-resolution videos aren't a problem. Graphics performance is only marginally reduced on battery power. Further GPU benchmarks are available here.
| Ghostwire Tokyo - 1280x720 Lowest Settings | |
| Dell XPS 13 Plus 9320 i5-1240p | |
| Average Intel Iris Xe Graphics G7 80EUs (n=1) | |
The Witcher 3 runs smoothly at Full HD and high settings. We use the Ultra setting in Full HD to test the iGPU's stability under load. While 22-23 FPS is no longer playable in this case, it remains constant, which indicates a consistent power output. The GPU clock rate of 1,300 MHz is maintained.
The Witcher 3 FPS diagram
| low | med. | high | ultra | |
|---|---|---|---|---|
| GTA V (2015) | 91 | 32 | ||
| The Witcher 3 (2015) | 75.5 | 48.1 | 31.9 | 13.1 |
| Dota 2 Reborn (2015) | 134.4 | 119.5 | 70.9 | 66.1 |
| Final Fantasy XV Benchmark (2018) | 36.3 | 19.7 | 11.7 | |
| X-Plane 11.11 (2018) | 28.5 | 23.7 | 28.8 | |
| Far Cry 5 (2018) | 61 | 28 | ||
| Strange Brigade (2018) | 67.7 | 30.7 | 24.4 | |
| Ghostwire Tokyo (2022) |
Emissions - Louder than Alder Lake U
Noise emissions
When performing less demanding tasks, the two fans in the XPS 13 Plus are usually deactivated or running at the lowest level at most. This is only audible in absolute silence. The fans turn on more or less often depending on the power mode, with Ultra performance causing them to run most frequently. Nevertheless, they always turn off again in idle usage, even in this mode. When using the Optimized mode, the 13-inch laptop is very quiet, and it can even be taken into environments that are sensitive to noise.
Things get louder under load, both in the Optimized and Ultra Performance modes, which is due to the high power limits. We measure a maximum of 47 dB(A) in the stress test and under high CPU load. That is noticeable, but there are no unpleasant frequencies. If you need the laptop to be less noisy, you can use the Quiet mode, which only produces a maximum of 38 dB(A) even under high load.
If you're looking for quiet, you don't necessarily need an Alder Lake U. The XPS 13 9315 only has a maximum noise level of 40 dB(A). The decisive factor here is to use the corresponding Quiet power mode.
Noise level
| Idle |
| 26.2 / 26.2 / 26.2 dB(A) |
| Load |
| 38.4 / 47.1 dB(A) |
 | ||
30 dB silent 40 dB(A) audible 50 dB(A) loud |
||
min: | ||
| Dell XPS 13 Plus 9320 i5-1240p Iris Xe G7 80EUs, i5-1240P, Micron 3400 MTFDKBA512TFH 512GB | Asus Zenbook S 13 OLED Radeon 680M, R7 6800U, Samsung PM9A1 MZVL21T0HCLR | Lenovo ThinkPad X1 Nano-20UN002UGE Iris Xe G7 96EUs, i7-1160G7, WDC PC SN530 SDBPNPZ-512G | Huawei MateBook 13s i5 11300H Iris Xe G7 80EUs, i5-11300H, Phison Electronics PS5012 | Dell XPS 13 Plus 9320 4K Iris Xe G7 96EUs, i7-1260P, Samsung PM9A1 MZVL21T0HCLR | Dell XPS 13 9315, i5-1230U Iris Xe G7 80EUs, i5-1230U, Micron 3460 256 GB Soldered | |
|---|---|---|---|---|---|---|
| Noise | 10% | 3% | 6% | 4% | 2% | |
| off / environment * (dB) | 26 | 24 8% | 24.9 4% | 24.5 6% | 24.4 6% | 26 -0% |
| Idle Minimum * (dB) | 26.2 | 24 8% | 24.9 5% | 24.5 6% | 24.4 7% | 26 1% |
| Idle Average * (dB) | 26.2 | 24 8% | 26.3 -0% | 24.5 6% | 24.4 7% | 26 1% |
| Idle Maximum * (dB) | 26.2 | 24 8% | 31.8 -21% | 28 -7% | 25.5 3% | 27.5 -5% |
| Load Average * (dB) | 38.4 | 33.1 14% | 34.3 11% | 35.9 7% | 40.4 -5% | 39.5 -3% |
| Load Maximum * (dB) | 47.1 | 41.7 11% | 37.5 20% | 38.6 18% | 45.5 3% | 39.6 16% |
| Witcher 3 ultra * (dB) | 40.2 | 34.3 | 35.9 | 45.5 | 39.6 |
* ... smaller is better
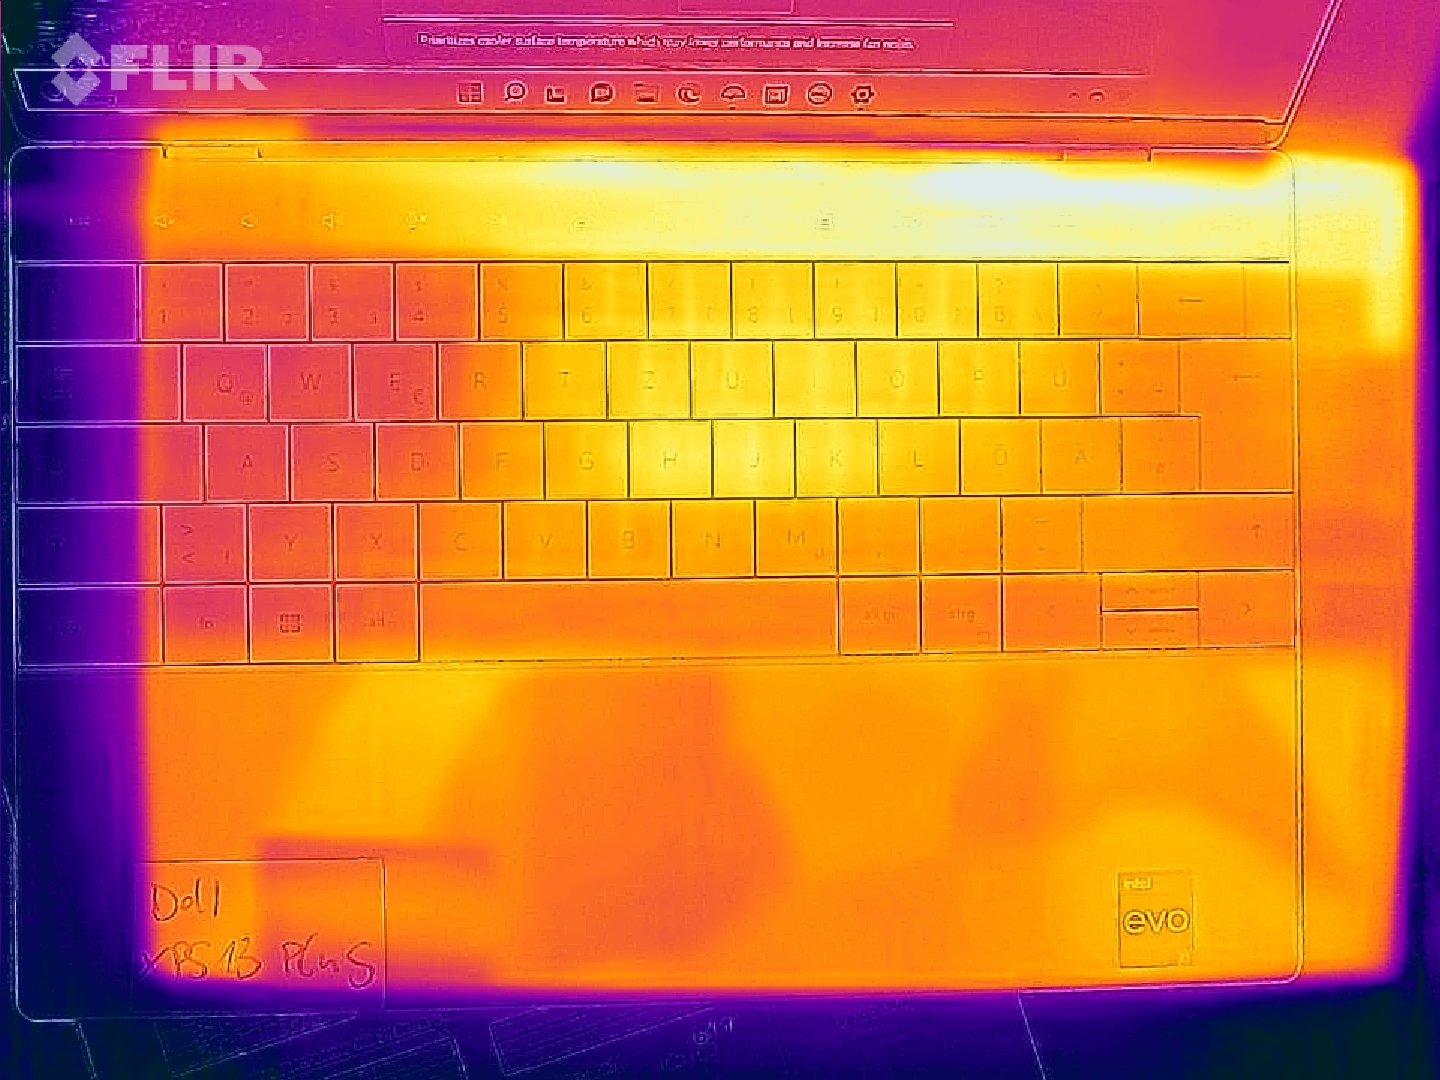
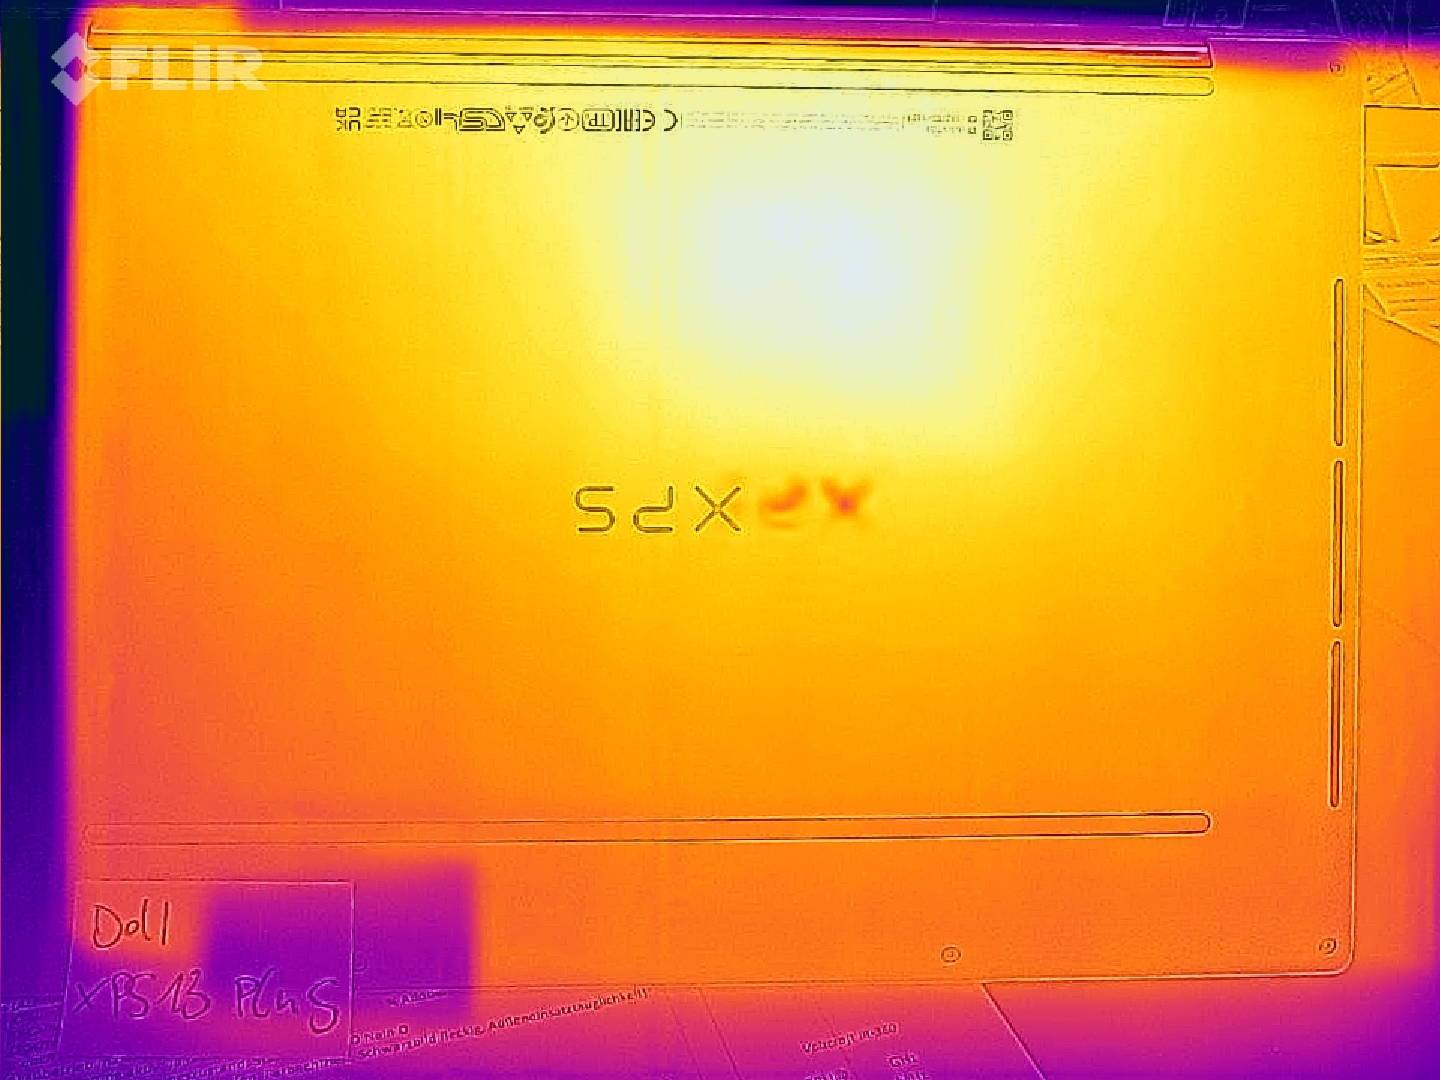
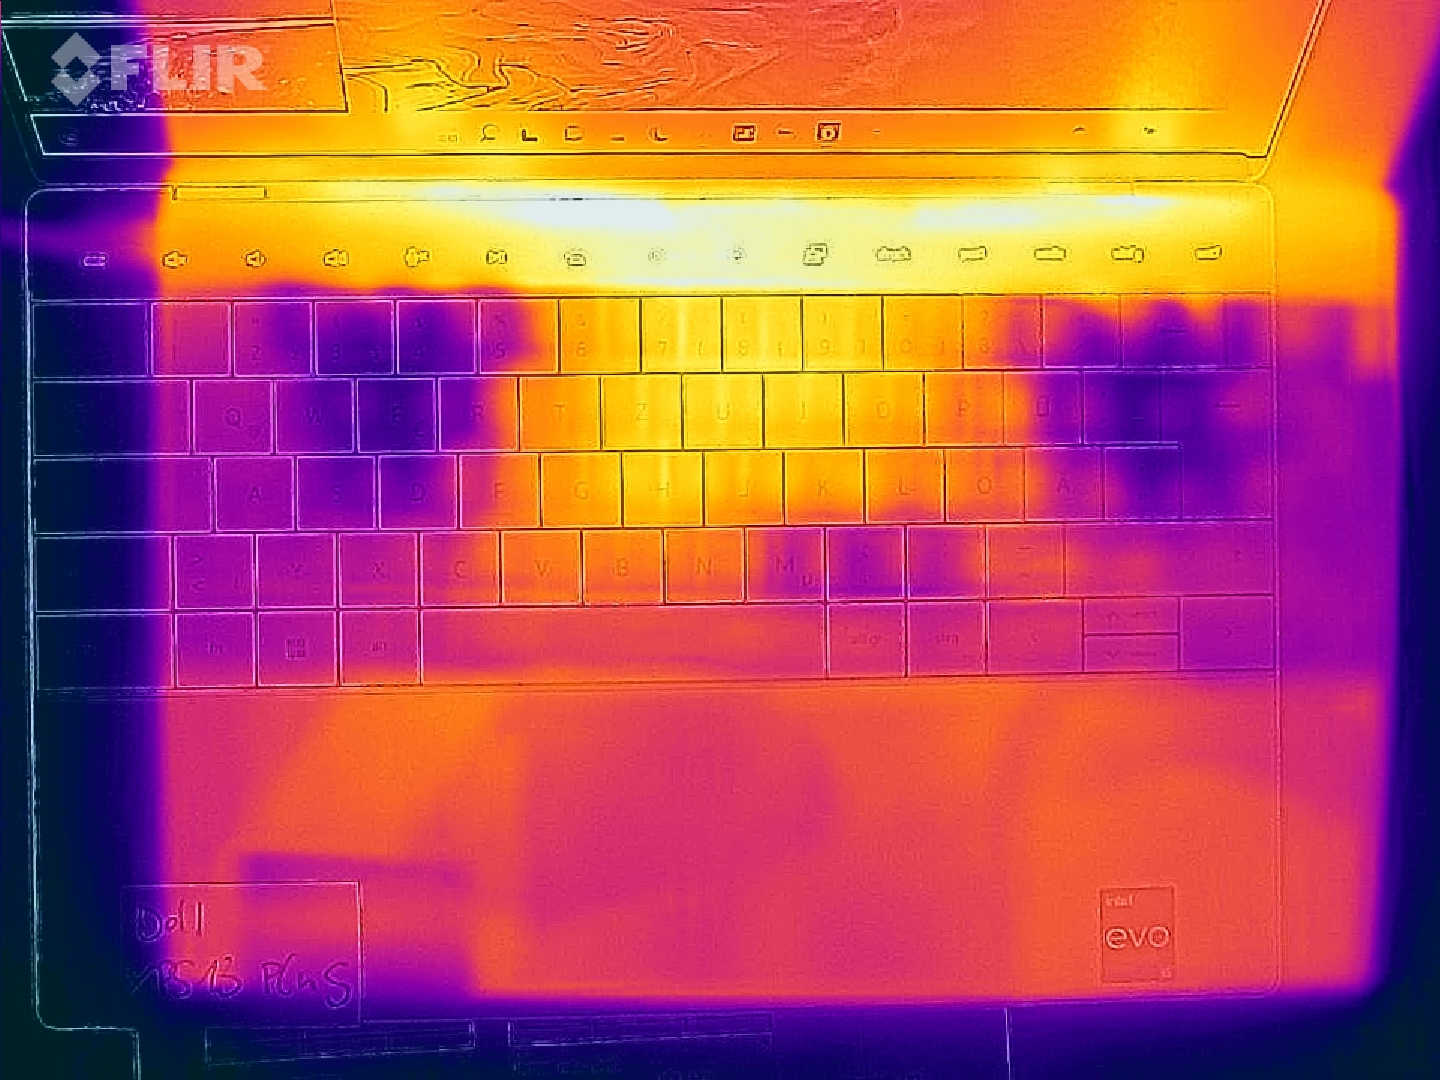
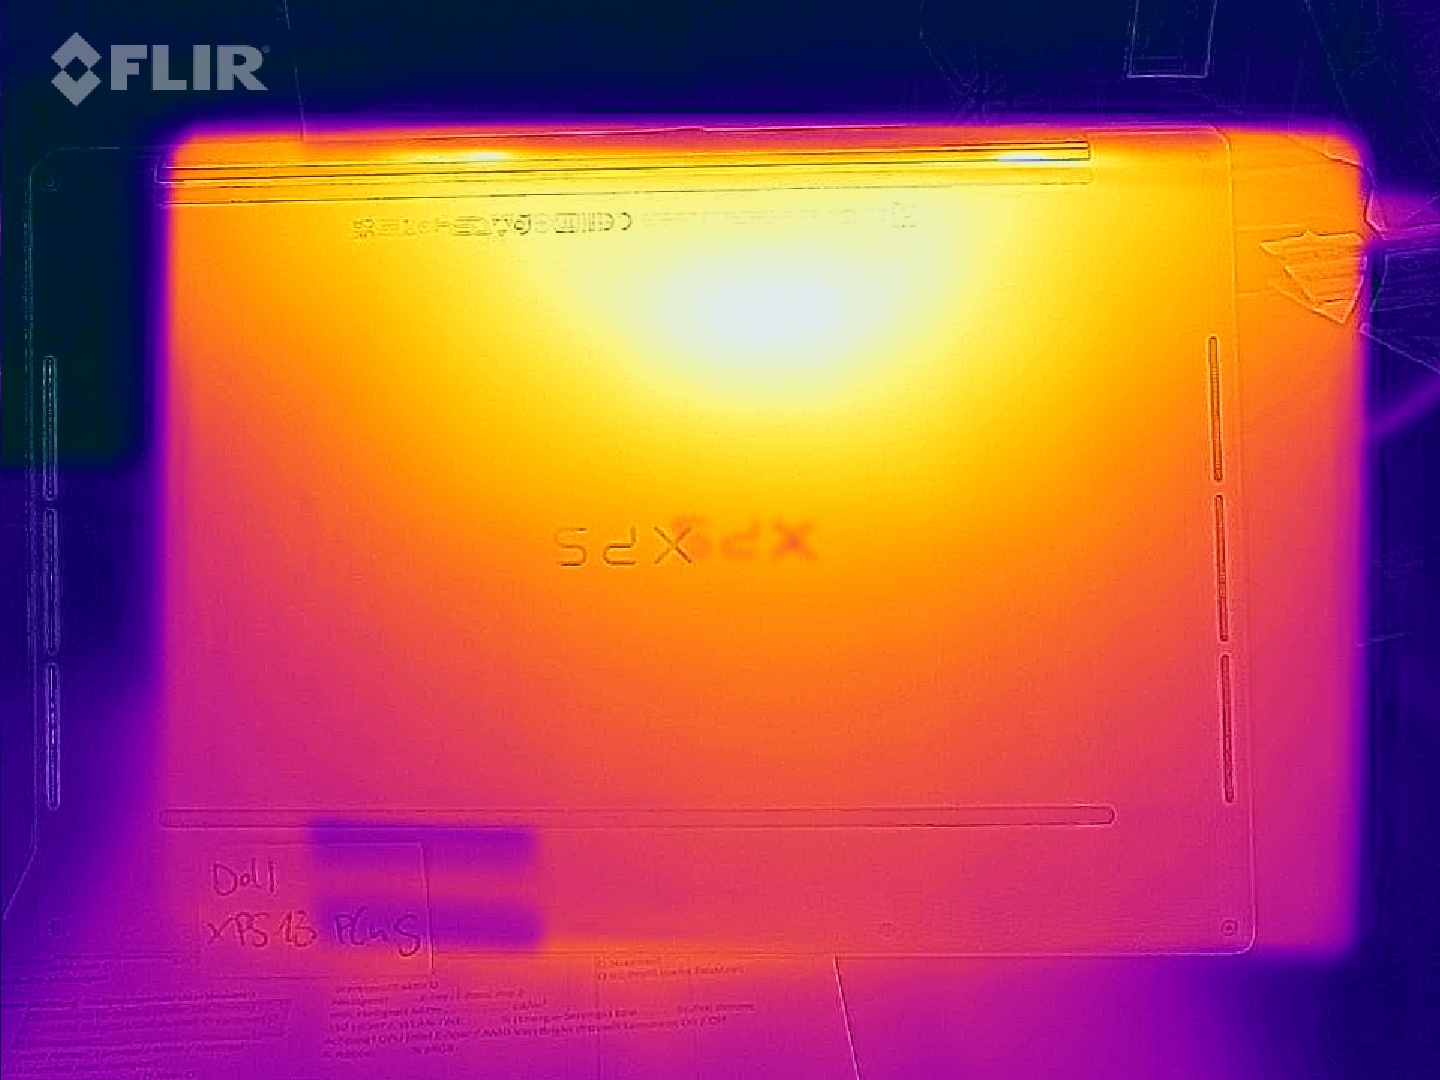
Temperature
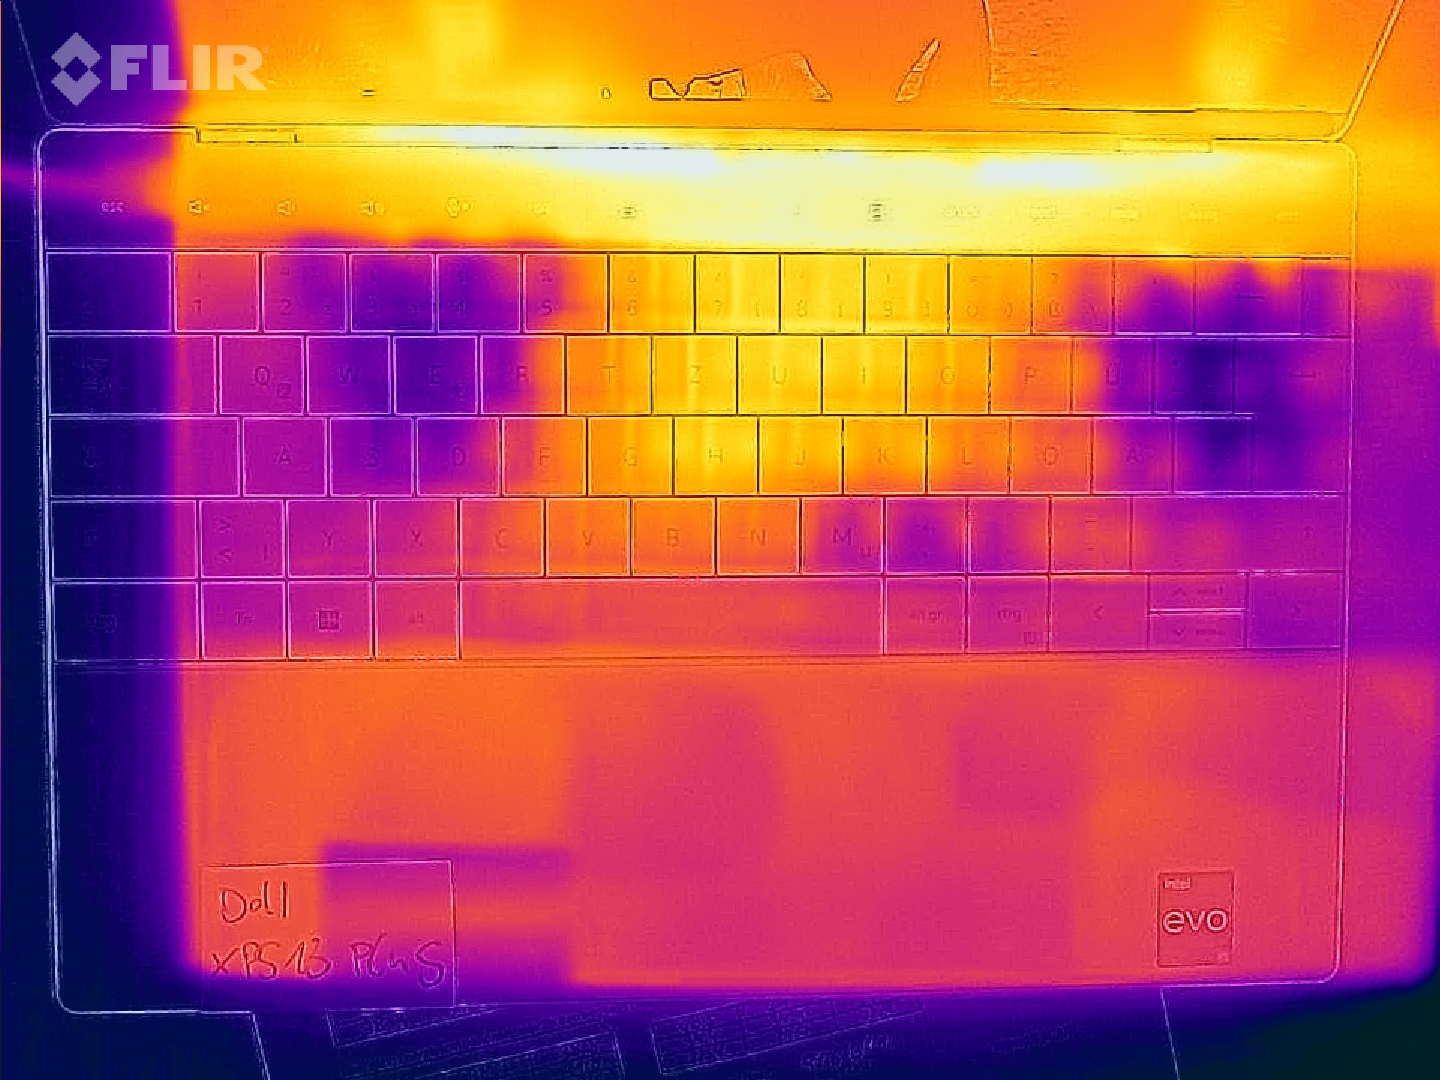
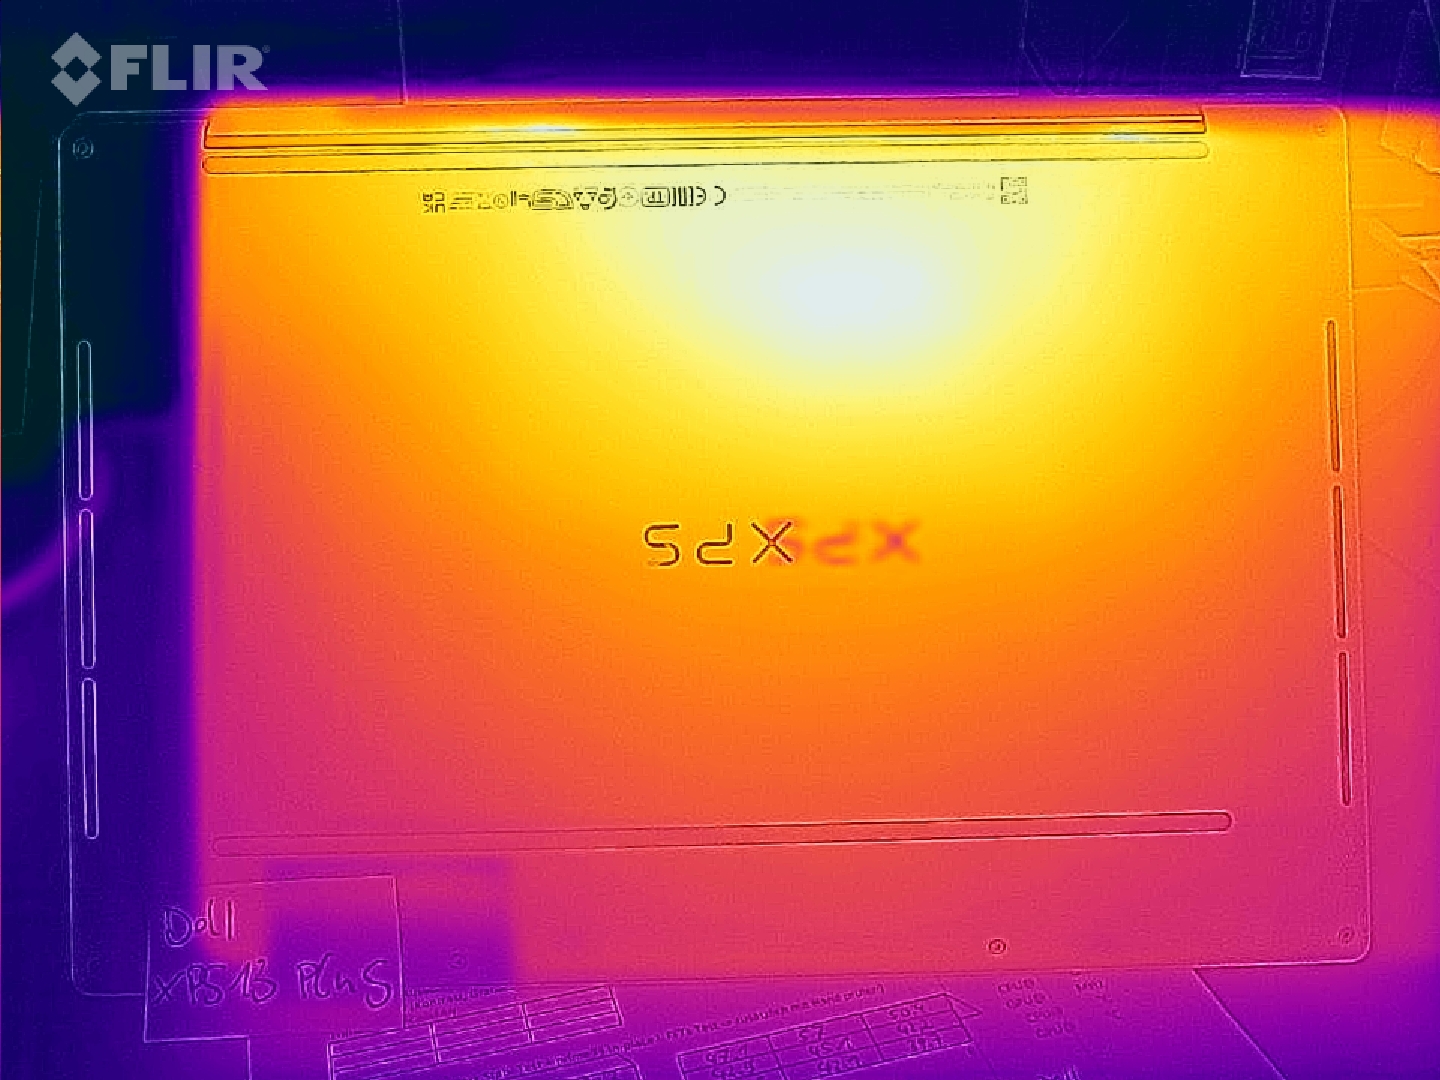
The case maintains a pleasant temperature in everyday use. The 13-incher can be placed on the the lap without issues when on the go. However, the bottom and the upper keyboard area in particular heat up under heavy, continuous load or when gaming. The bottom reaches close to 57 °C (~135 °F) at some points. We believe a flat surface is advisable for air circulation.
The compact 60-watt power adapter gets very warm and reaches 61 °C (~142 °F).
(-) The maximum temperature on the upper side is 47.6 °C / 118 F, compared to the average of 35.9 °C / 97 F, ranging from 21.4 to 59 °C for the class Subnotebook.
(-) The bottom heats up to a maximum of 57 °C / 135 F, compared to the average of 39.3 °C / 103 F
(±) In idle usage, the average temperature for the upper side is 34.2 °C / 94 F, compared to the device average of 30.8 °C / 87 F.
(-) Playing The Witcher 3, the average temperature for the upper side is 39.3 °C / 103 F, compared to the device average of 30.8 °C / 87 F.
(±) The palmrests and touchpad can get very hot to the touch with a maximum of 39.8 °C / 103.6 F.
(-) The average temperature of the palmrest area of similar devices was 28.2 °C / 82.8 F (-11.6 °C / -20.8 F).
| Dell XPS 13 Plus 9320 i5-1240p Intel Core i5-1240P, Intel Iris Xe Graphics G7 80EUs | Apple MacBook Air 2020 M1 Entry Apple M1, Apple M1 7-Core GPU | Asus Zenbook S 13 OLED AMD Ryzen 7 6800U, AMD Radeon 680M | Lenovo ThinkPad X1 Nano-20UN002UGE Intel Core i7-1160G7, Intel Iris Xe Graphics G7 96EUs | Huawei MateBook 13s i5 11300H Intel Core i5-11300H, Intel Iris Xe Graphics G7 80EUs | Dell XPS 13 Plus 9320 4K Intel Core i7-1260P, Intel Iris Xe Graphics G7 96EUs | Dell XPS 13 9315, i5-1230U Intel Core i5-1230U, Intel Iris Xe Graphics G7 80EUs | |
|---|---|---|---|---|---|---|---|
| Heat | 24% | 16% | 26% | 25% | 21% | 14% | |
| Maximum Upper Side * (°C) | 47.6 | 44 8% | 47.9 -1% | 42.2 11% | 42.8 10% | 41.1 14% | 42.3 11% |
| Maximum Bottom * (°C) | 57 | 44 23% | 56.1 2% | 47.5 17% | 46.9 18% | 48.8 14% | 44.9 21% |
| Idle Upper Side * (°C) | 38.8 | 27 30% | 26.8 31% | 24.3 37% | 25.2 35% | 28 28% | 32.5 16% |
| Idle Bottom * (°C) | 41 | 27 34% | 27.3 33% | 25.3 38% | 26 37% | 29.3 29% | 38.2 7% |
* ... smaller is better
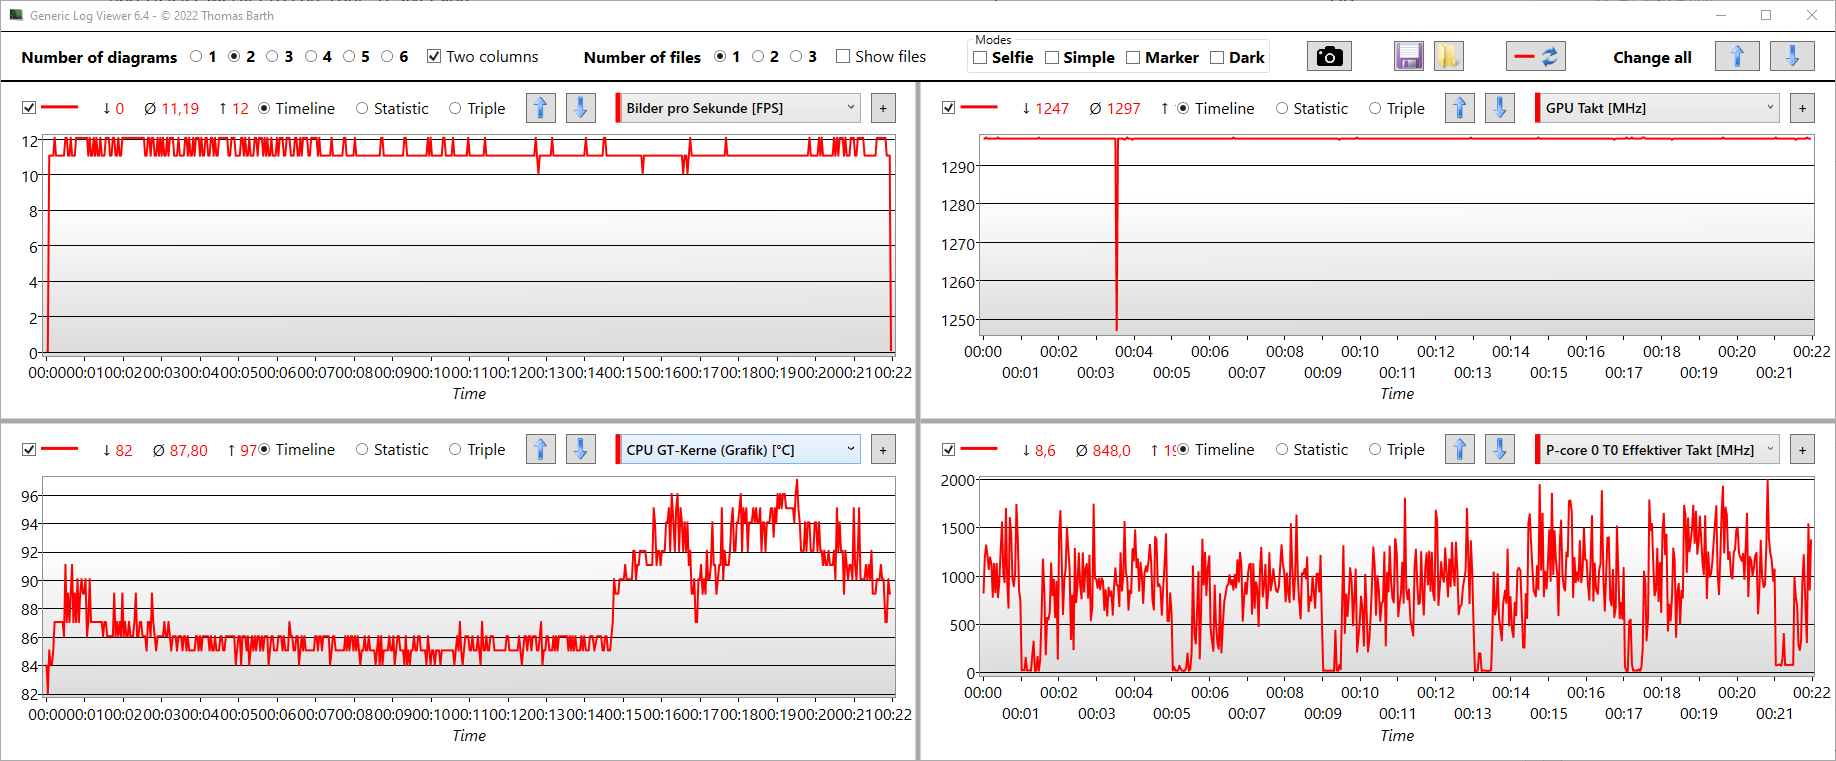
Stress test
The processor's consumption settles at 30 watts in the stress test. Prior to that, around 60 watts can be reached for a few seconds, but this then drops to between 40 and 30 watts in the first minute. This throttling is triggered by the P-core reaching 95 °C (~203 °F). Performance wasn't impacted following the stress test.
Dell XPS 13 Plus 9320 i5-1240p audio analysis
(+) | speakers can play relatively loud (84.36 dB)
Bass 100 - 315 Hz
(±) | reduced bass - on average 13.7% lower than median
(±) | linearity of bass is average (9.4% delta to prev. frequency)
Mids 400 - 2000 Hz
(+) | balanced mids - only 2.4% away from median
(+) | mids are linear (4.9% delta to prev. frequency)
Highs 2 - 16 kHz
(±) | higher highs - on average 6.2% higher than median
(+) | highs are linear (3.3% delta to prev. frequency)
Overall 100 - 16.000 Hz
(+) | overall sound is linear (13.8% difference to median)
Compared to same class
» 24% of all tested devices in this class were better, 6% similar, 70% worse
» The best had a delta of 5%, average was 18%, worst was 53%
Compared to all devices tested
» 15% of all tested devices were better, 4% similar, 81% worse
» The best had a delta of 4%, average was 24%, worst was 134%
Asus Zenbook S 13 OLED audio analysis
(±) | speaker loudness is average but good (76.5 dB)
Bass 100 - 315 Hz
(±) | reduced bass - on average 12.6% lower than median
(±) | linearity of bass is average (11.1% delta to prev. frequency)
Mids 400 - 2000 Hz
(±) | higher mids - on average 5.8% higher than median
(+) | mids are linear (4.7% delta to prev. frequency)
Highs 2 - 16 kHz
(+) | balanced highs - only 2.6% away from median
(+) | highs are linear (5.3% delta to prev. frequency)
Overall 100 - 16.000 Hz
(+) | overall sound is linear (14.7% difference to median)
Compared to same class
» 30% of all tested devices in this class were better, 5% similar, 65% worse
» The best had a delta of 5%, average was 18%, worst was 53%
Compared to all devices tested
» 19% of all tested devices were better, 4% similar, 77% worse
» The best had a delta of 4%, average was 24%, worst was 134%
Energy management
Energy consumption
We conduct a stress test with Prime95 and FurMark (Ultra Performance). The system is allowed 63 watts for one minute, after which the clock rate is slowly reduced; power consumption drops from 56 to 49 watts over time (1:00 to 3:00).
Overloading the 60-watt power adapter can have an impact on the charging time: The battery only charges very slowly during a stress test; energy is rationed here. The previously drained battery was only charged to 18% after an hour. This makes it difficult to stress the device and also charge the battery at the same time.
Many compact laptops with Alder Lake P CPUs have this problem. However, since this situation always occurs for a very short time only, the effects are minor in practice. The battery doesn't drain, either. The budget XPS 13 model with Alder Lake U doesn't have this problem, despite its small 45-watt power adapter. Although the stress test also manages 47 watts in that case, it's only for a few seconds. The system only needs a constant 26 watts after that and no longer 40 to 45 watts. The chart showing the energy consumption during The Witcher 3 / Stress test presents a comparison with the energy-saving Alder Lake U XPS.
| Off / Standby | |
| Idle | |
| Load |
|
Key:
min: | |
| Dell XPS 13 Plus 9320 i5-1240p i5-1240P, Iris Xe G7 80EUs, Micron 3400 MTFDKBA512TFH 512GB, IPS, 1920x1200, 13.4" | Apple MacBook Air 2020 M1 Entry M1, M1 7-Core GPU, Apple SSD AP0256Q, IPS, 2560x1600, 13.3" | Asus Zenbook S 13 OLED R7 6800U, Radeon 680M, Samsung PM9A1 MZVL21T0HCLR, OLED, 2880x1800, 13.3" | Lenovo ThinkPad X1 Nano-20UN002UGE i7-1160G7, Iris Xe G7 96EUs, WDC PC SN530 SDBPNPZ-512G, IPS, 2160x1350, 13" | Huawei MateBook 13s i5 11300H i5-11300H, Iris Xe G7 80EUs, Phison Electronics PS5012, LTPS, 2520x1680, 13.4" | Dell XPS 13 Plus 9320 4K i7-1260P, Iris Xe G7 96EUs, Samsung PM9A1 MZVL21T0HCLR, IPS, 3840x2400, 13.4" | Dell XPS 13 9315, i5-1230U i5-1230U, Iris Xe G7 80EUs, Micron 3460 256 GB Soldered, IPS, 1920x1200, 13.4" | Average Intel Iris Xe Graphics G7 80EUs | Average of class Subnotebook | |
|---|---|---|---|---|---|---|---|---|---|
| Power Consumption | 56% | 22% | 40% | 23% | 2% | 47% | 30% | 28% | |
| Idle Minimum * (Watt) | 10 | 1.9 81% | 4.8 52% | 3.3 67% | 4.2 58% | 7 30% | 3.6 64% | 4.47 ? 55% | 4.01 ? 60% |
| Idle Average * (Watt) | 12.3 | 6.4 48% | 8.7 29% | 5.7 54% | 8.1 34% | 11 11% | 6.8 45% | 7.37 ? 40% | 6.87 ? 44% |
| Idle Maximum * (Watt) | 15.5 | 7 55% | 10.1 35% | 9.1 41% | 9 42% | 11.4 26% | 6.8 56% | 9.24 ? 40% | 8.49 ? 45% |
| Load Average * (Watt) | 43 | 25 42% | 45.6 -6% | 29.6 31% | 41.7 3% | 59.7 -39% | 24 44% | 36.6 ? 15% | 44.4 ? -3% |
| Witcher 3 ultra * (Watt) | 43.1 | 42.4 2% | 27.7 36% | 40.1 7% | 49.4 -15% | 23.6 45% | |||
| Load Maximum * (Watt) | 62.8 | 30.3 52% | 49.5 21% | 55.1 12% | 68 -8% | 63 -0% | 47 25% | 61.7 ? 2% | 67.9 ? -8% |
* ... smaller is better
Energy consumption during The Witcher 3 / Stress test
Energy consumption with an external monitor
Battery life
Dell increased the battery capacity to 55 Wh in the Plus version, but battery life is still shorter than in the Full HD 9305 predecessor due to the increased power consumption. The latter could last 554 minutes, but now it's only 480. The XPS 13 Plus lags behind the competition with these 8 hours: The MacBook Air 2020 M1 Entry doubles this, and even the powerful Asus Zenbook S 13 OLED lasts over an hour longer (550 minutes). A battery-life champion from Dell is only available in the form of the XPS 13 9315 with Alder Lake U.
The battery runtime is significantly decreased at full brightness. Instead of 150 cd/m², 420 cd/m² is used, which leads to 6 hours. The high Power Limits of 59 and 48 watts, respectively, are reflected in the short load runtime of 96 minutes (Battery Eater Classic). In this case, the 146 minutes of the Asus Zenbook S 13 OLED show that the R7 6800U, which is about as powerful, handles energy more efficiently - but it also has a beefier 67 Wh battery.
The 55 watt hours take 1:30 hours to charge to 80%. It takes 2:40 hours to reach 100%.
| Dell XPS 13 Plus 9320 i5-1240p i5-1240P, Iris Xe G7 80EUs, 55 Wh | Apple MacBook Air 2020 M1 Entry M1, M1 7-Core GPU, 49.9 Wh | Asus Zenbook S 13 OLED R7 6800U, Radeon 680M, 67 Wh | Lenovo ThinkPad X1 Nano-20UN002UGE i7-1160G7, Iris Xe G7 96EUs, 48.2 Wh | Huawei MateBook 13s i5 11300H i5-11300H, Iris Xe G7 80EUs, 60 Wh | Dell XPS 13 Plus 9320 4K i7-1260P, Iris Xe G7 96EUs, 55 Wh | Dell XPS 13 9315, i5-1230U i5-1230U, Iris Xe G7 80EUs, 51 Wh | Dell XPS 13 9305 Core i5 FHD i5-1135G7, Iris Xe G7 80EUs, 52 Wh | Average of class Subnotebook | |
|---|---|---|---|---|---|---|---|---|---|
| Battery runtime | 100% | 33% | 12% | 9% | -17% | 74% | 48% | 45% | |
| WiFi v1.3 (h) | 8 | 16 100% | 9.2 15% | 9.9 24% | 9.4 18% | 6.9 -14% | 14.8 85% | 9.2 15% | 13.4 ? 68% |
| Load (h) | 1.6 | 2.4 50% | 1.6 0% | 1.6 0% | 1.3 -19% | 2.6 63% | 2.9 81% | 1.929 ? 21% | |
| H.264 (h) | 15.2 | 15.4 | 11 | 11 | 16.7 ? | ||||
| Reader / Idle (h) | 25.4 | 30.7 ? |
Pros
Cons
Verdict - The i7 together with the 1 TB Samsung SSD are the best choice for performance
Which is the right XPS 13 for me? If you're looking for cutting-edge performance in a subnotebook format, you'll inevitably gravitate towards the Alder Lake P variant in the form of an XPS 13 Plus.
Choosing the Core i7-1260P promises a performance increase of a good 10% according to benchmarks. This applies to the pure processing power, but also to the system performance. Furthermore, the Core i7 delivers a plus of 18% under continuous load compared to the Core i5, which throttled more noticeably in the Cinebench loop.
System performance (PCMarks) benefits from the fast 1 TB Samsung SSD in the Core i7 test system, while Dell equipped the i5 Plus model with a slower 512 GB Micron drive. However, customers don't have a say when it comes to the SSD manufacturer. The extra cost for the one-terabyte SSD, the Core i7-1260P and 16 GB of RAM is 300 Euros (~$307). This sounds fair.
Could the UHD+ touchscreen tip the scales? Probably not, because apart from the higher resolution and better contrast, it doesn't cover the P3 color space, which can be important for professional use. In addition, it can be ordered with any processor, including the Core i5.
In short, the Core i7 combined with the 1 TB SSD from Samsung is exactly the right Dell product for performance geeks.
But does the XPS 13 Plus have a good price-performance ratio? Users who want to squeeze the best possible performance out of a 13-inch laptop (PCMark, R15 loop and CPU tests) - and at an attractive price - might want to take a look at the Asus Zenbook S 13 OLED, which is expected to be available starting at 1,300 Euros (~$1,332). It comes with the P3 color space, a 512 GB SSD (Samsung), 16 GB of RAM and, of course, a 3.5 mm combo audio jack. The Zenbook S 13 OLED received a 90% rating. The lack of Thunderbolt 4 ports is probably the biggest drawback.
Not far behind and with an even higher rating - although with a bit less processing power - is the Apple MacBook Air 2020 M1 Entry. Despite the passive cooling, it offers sufficient performance while being more efficient in the process, but the display doesn't support HDR. We also reviewed the new MacBook Air 2022 M2, which is an entry-level version with the Apple M2 processor.
Price and availability
The Dell XPS 13 Plus 9320 in the configuration with the Core i5-1240p, a 512 GB SSD, 8 GB of RAM, and a Full HD display can currently be found in Dell's online store for $1,299. Dell also lets you customize the device to your needs.
Dell XPS 13 Plus 9320 i5-1240p
- 08/10/2022 v7 (old)
Sebastian Jentsch
Price comparison

