 Deutsch
 English
 Español
 Français
 Italiano
 Nederlands
 Polski
 Português
 Русский
 Türkçe
 Svenska
 Chinese
 Magyar
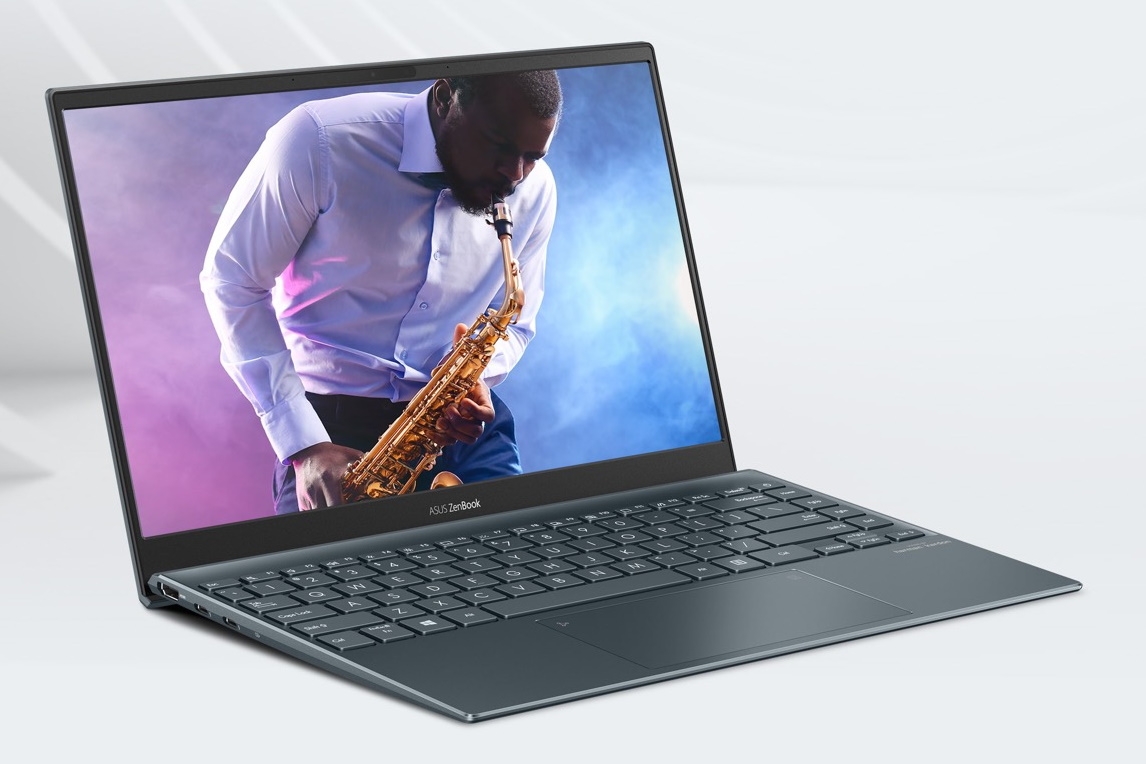
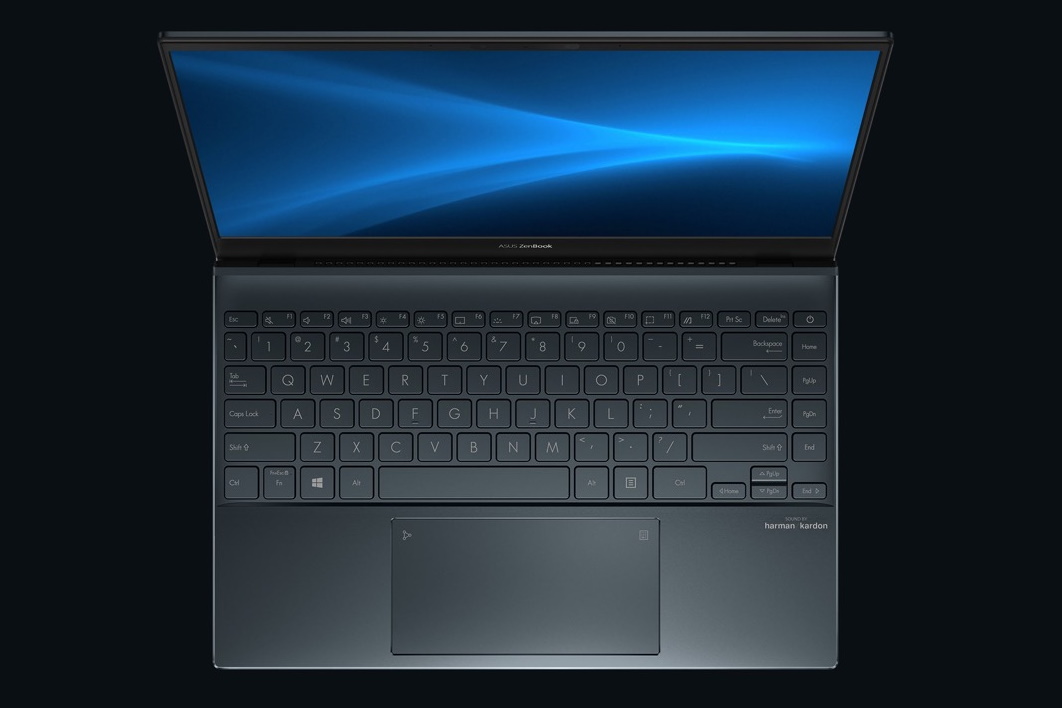
Asus ZenBook 13 laptop review: Core i7-1165G7 versus Ryzen 7 5800U. Which one is the better ZenBook?

We reviewed the ultra-light and ultra-thin Asus ZenBook 13 UX325JA predecessor last August, and it received a strong score of 88%. So how does the successor improve on that? On the one hand, the CPU has been updated. Instead of the Ice Lake Core i7-1065G7, a potentially more powerful and more energy-efficient Core i7-1165G7, including updated G7 Graphics, now runs in the 13-inch subnotebook. On the other hand, Asus should address the few points of criticism such as the weak contrast of the actually bright display. Furthermore, Asus has also released a ZenBook 13 with an AMD CPU and GPU this year, which we also just reviewed. We take a look at which version has the upper hand and whether Asus has worked on the few points of criticism.
Apart from the predecessor and the current AMD version, the competitors include other lightweight subnotebooks like the Lenovo Yoga Slim 7i Carbon, the HP Spectre x360 14 (13.5-inch), or the Apple MacBook Air Late 2020 (13.3-inch, M1 CPU).
Since this is mostly a CPU/GPU and a display update, we'll skip the sections concerning the case, connectivity, input devices, and maintenance unless there's something new to report. These sections can be found in the review of the predecessor or in the current review of the AMD version.
Possible contenders in comparison
Rating | Date | Model | Weight | Height | Size | Resolution | Best Price |
|---|---|---|---|---|---|---|---|
| 88.9 % | 05/2021 | Asus ZenBook 13 UX325EA i7-1165G7, Iris Xe G7 96EUs | 1.2 kg | 13.9 mm | 13.30" | 1920x1080 | |
| 87.5 % | 08/2020 | Asus ZenBook 13 UX325JA i7-1065G7, Iris Plus Graphics G7 (Ice Lake 64 EU) | 1.1 kg | 13.9 mm | 13.30" | 1920x1080 | |
| 88.5 % | 05/2021 | Asus ZenBook 13 UM325S R7 5800U, Vega 8 | 1.2 kg | 13.9 mm | 13.30" | 1920x1080 | |
| 87.6 % | 03/2021 | Lenovo Yoga Slim 7i Carbon 13 ITL i7-1165G7, Iris Xe G7 96EUs | 975 g | 15 mm | 13.30" | 2560x1600 | |
| 89.4 % | 12/2020 | HP Spectre x360 14t-ea000 i7-1165G7, Iris Xe G7 96EUs | 1.3 kg | 17.2 mm | 13.50" | 1920x1280 | |
| 91.1 % | 12/2020 | Apple MacBook Air Late 2020 (M1, 8 Core GPU, 8 GB RAM) M1, M1 8-Core GPU | 1.3 kg | 16.1 mm | 13.30" | 2560x1600 |
Case - Weak hinges
The weak hinges were already mentioned in the review of the Ryzen ZenBook, but the author didn't find them particularly annoying. However, this needs to be contradicted here. They are already very annoying when the device is placed on the lap, because the screen always tends to tilt backwards. The hinges should have a much firmer grip.
The dimensions are exactly the same as the predecessor or the AMD version; the former was 100 grams lighter, while the Intel and AMD variants only differ by a few grams. All rivals are thicker and mostly also deeper (3:2 displays in some cases), but they're sometimes a bit less wide in return.
In terms of weight, the Lenovo is even lighter at under 1 kg, while the remaining third-party rivals are about 100 grams heavier.
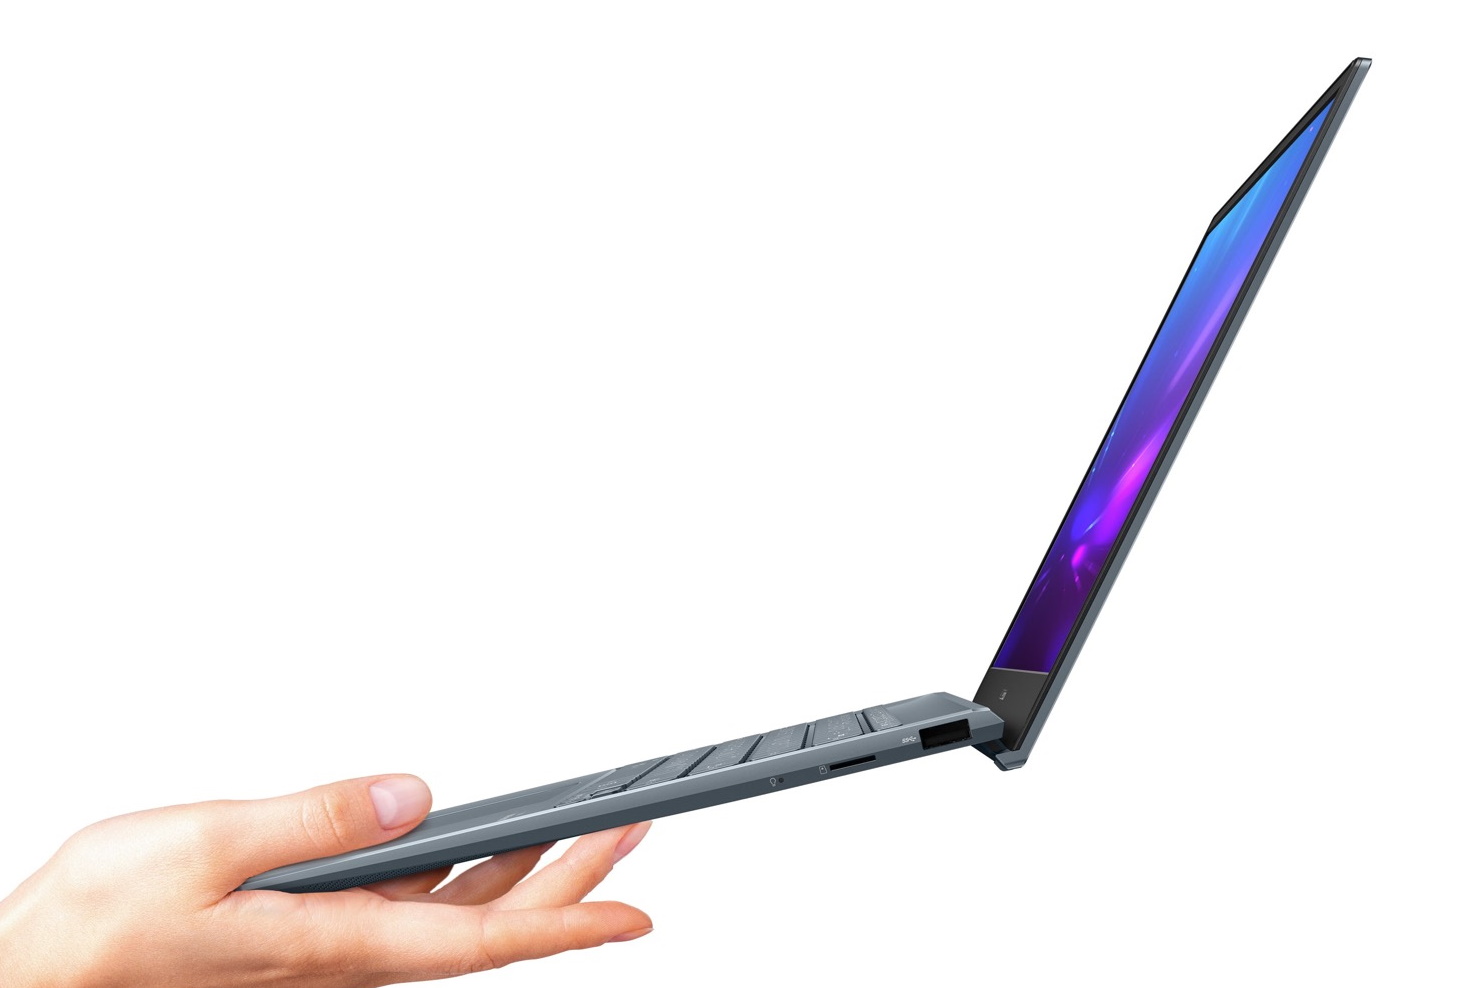

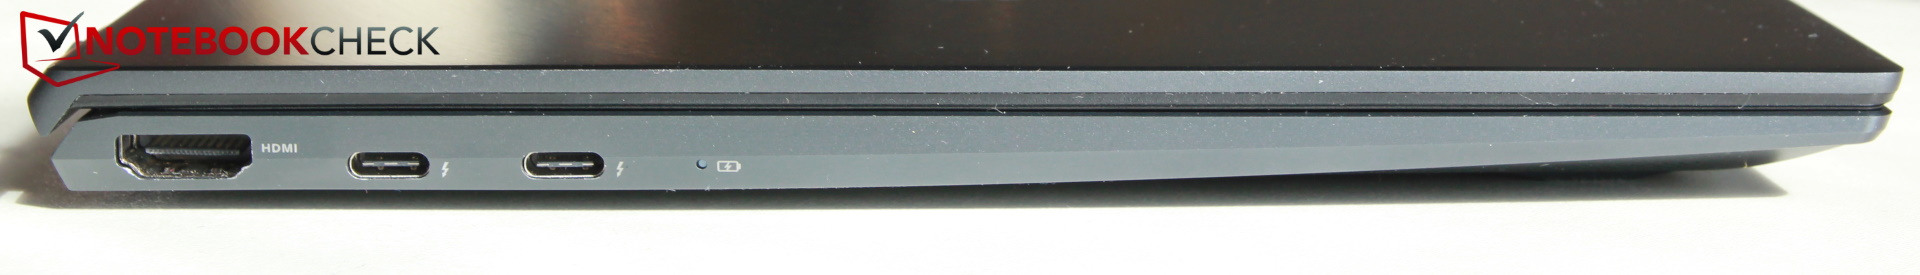
Connectivity - 2x Thunderbolt 4

SD card reader
Unfortunately, the built-in card reader only supports small microSD cards, and the speeds are rather low, which is typical for subnotebooks. The HP Spectre proves that it's also possible to be faster in this class, since its reader copies and reads data more than twice as fast.
| SD Card Reader | |
| average JPG Copy Test (av. of 3 runs) | |
| HP Spectre x360 14t-ea000 (Toshiba Exceria Pro M501 microSDXC 32GB) | |
| Asus ZenBook 13 UX325EA (Toshiba Exceria Pro M501 microSDXC 64GB) | |
| Asus ZenBook 13 UX325JA (Toshiba Exceria Pro M501 microSDXC 64GB) | |
| Average of class Subnotebook (18.9 - 193.9, n=17, last 2 years) | |
| maximum AS SSD Seq Read Test (1GB) | |
| HP Spectre x360 14t-ea000 (Toshiba Exceria Pro M501 microSDXC 32GB) | |
| Asus ZenBook 13 UX325EA (Toshiba Exceria Pro M501 microSDXC 64GB) | |
| Asus ZenBook 13 UX325JA (Toshiba Exceria Pro M501 microSDXC 64GB) | |
| Average of class Subnotebook (23.6 - 239, n=17, last 2 years) | |
Communication
The Intel AX201 Wi-Fi 6 module has become a standard module. The ZenBook's transmission rates for downloading data are excellent, but the upload speed leaves room for improvement.
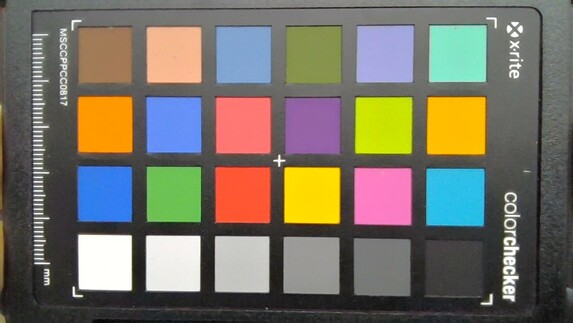
Webcam


Security
TPM is on board, but ASUS has decided against a fingerprint sensor in favor of Face Login via the IR webcam.
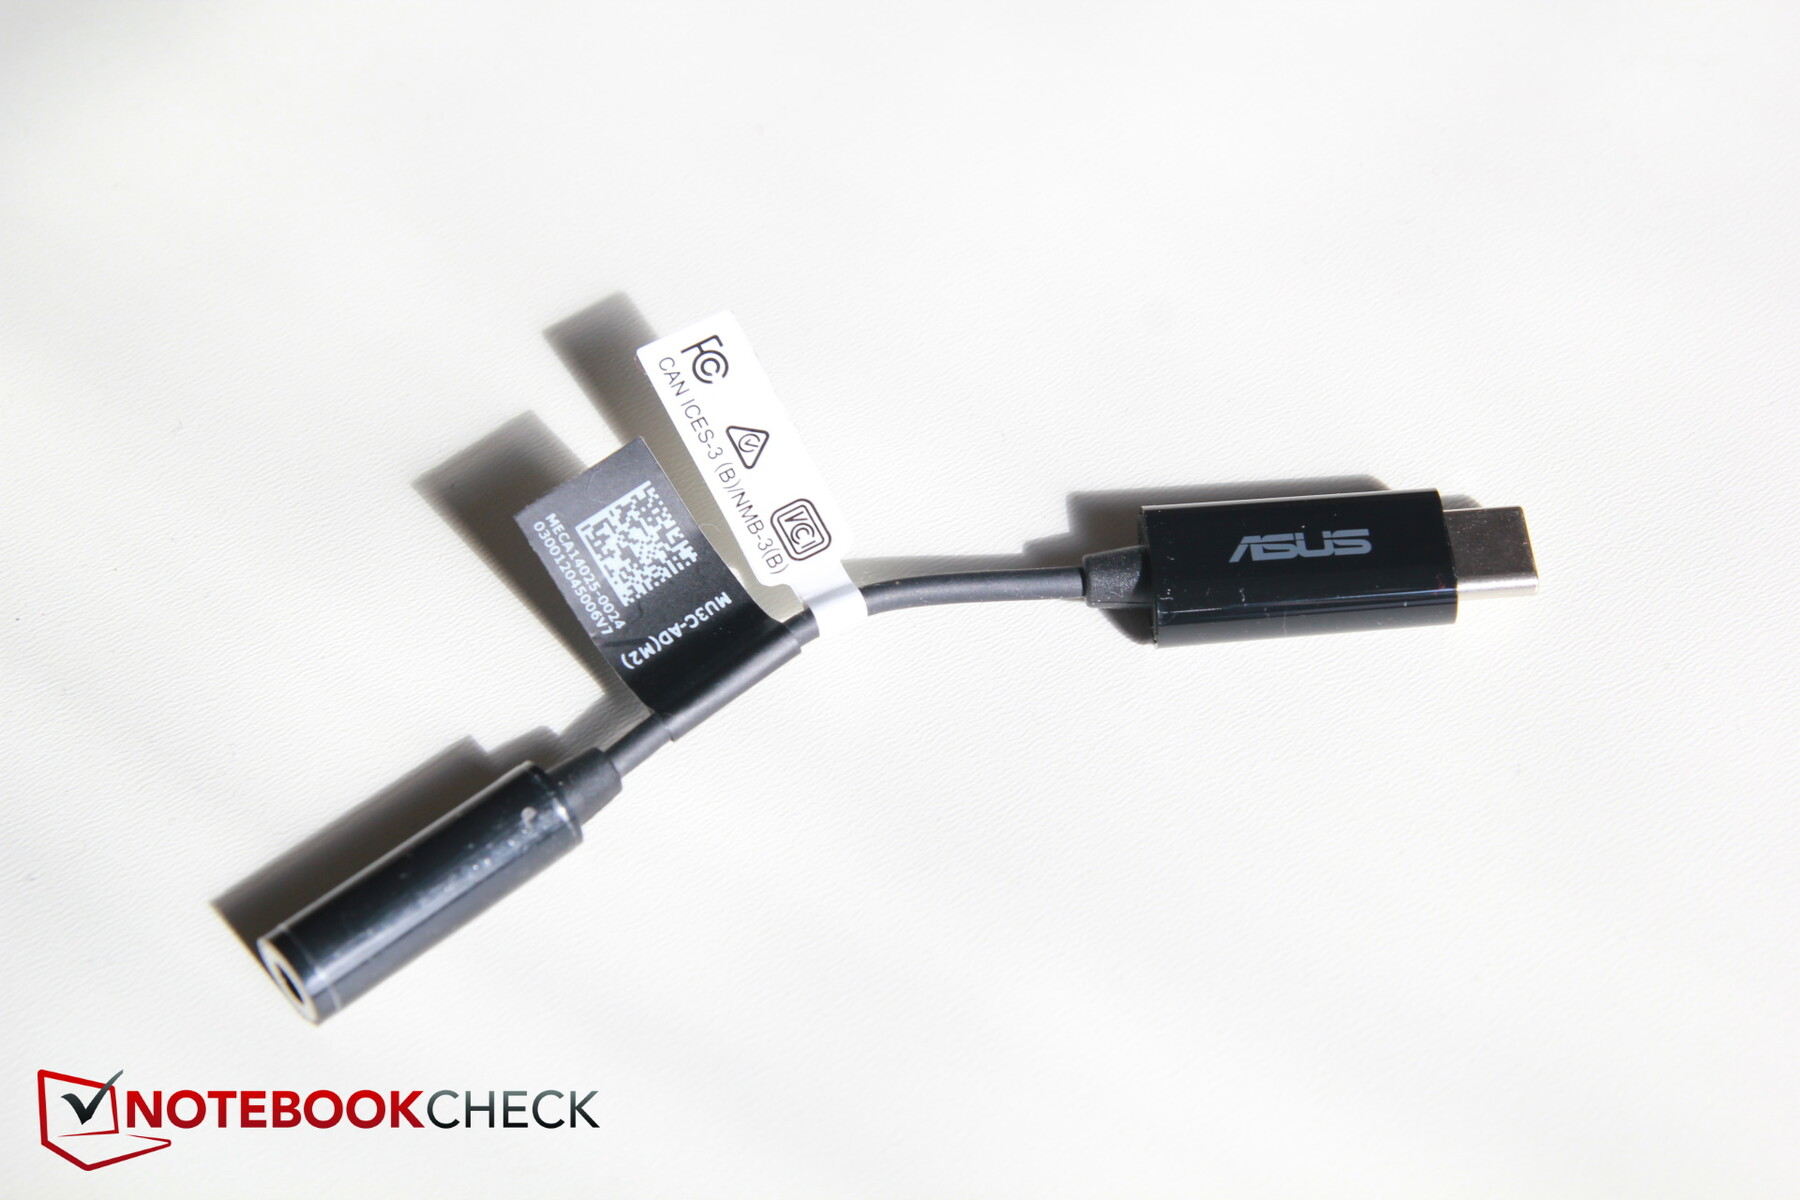
Accessories
Two adapters are included in the box as accessories. A USB-C adapter can be used to connect headphones and other external audio devices to an audio jack. In addition, there's a USB-A to RJ45 adapter for wired Internet connections. However, unlike with the AMD version, a case/sleeve is not included here.

Warranty
The manufacturer grants a two-year warranty.

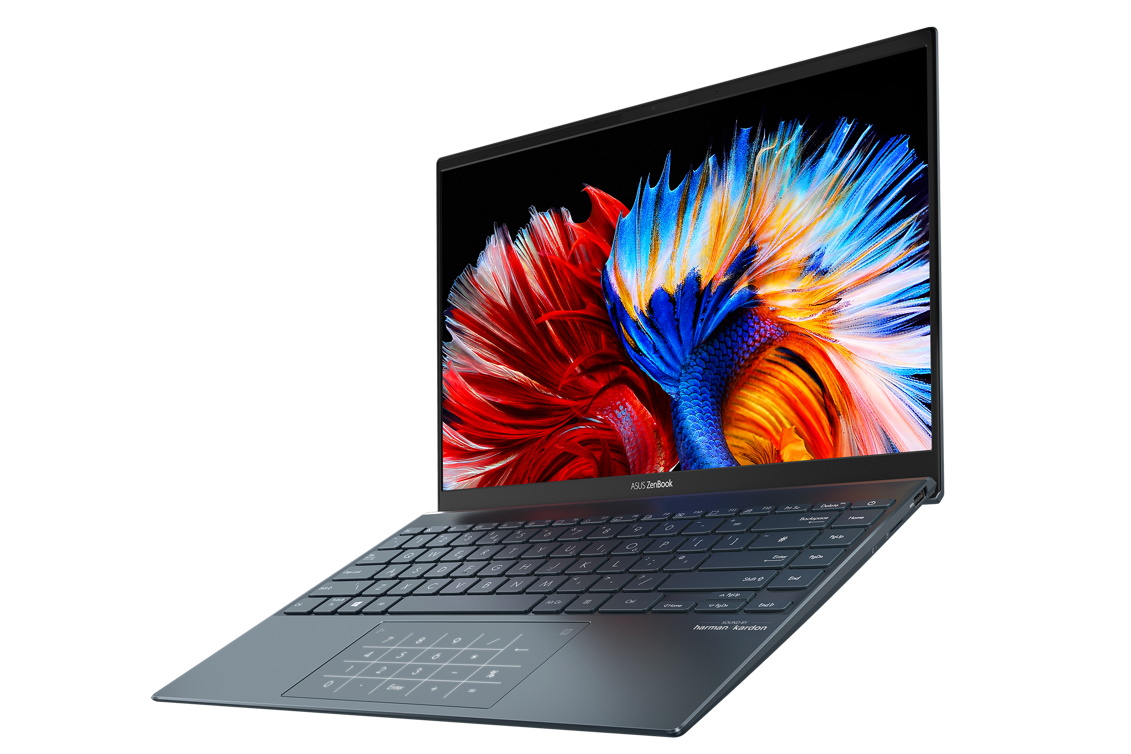
Display - Good OLED with uneven brightness distribution

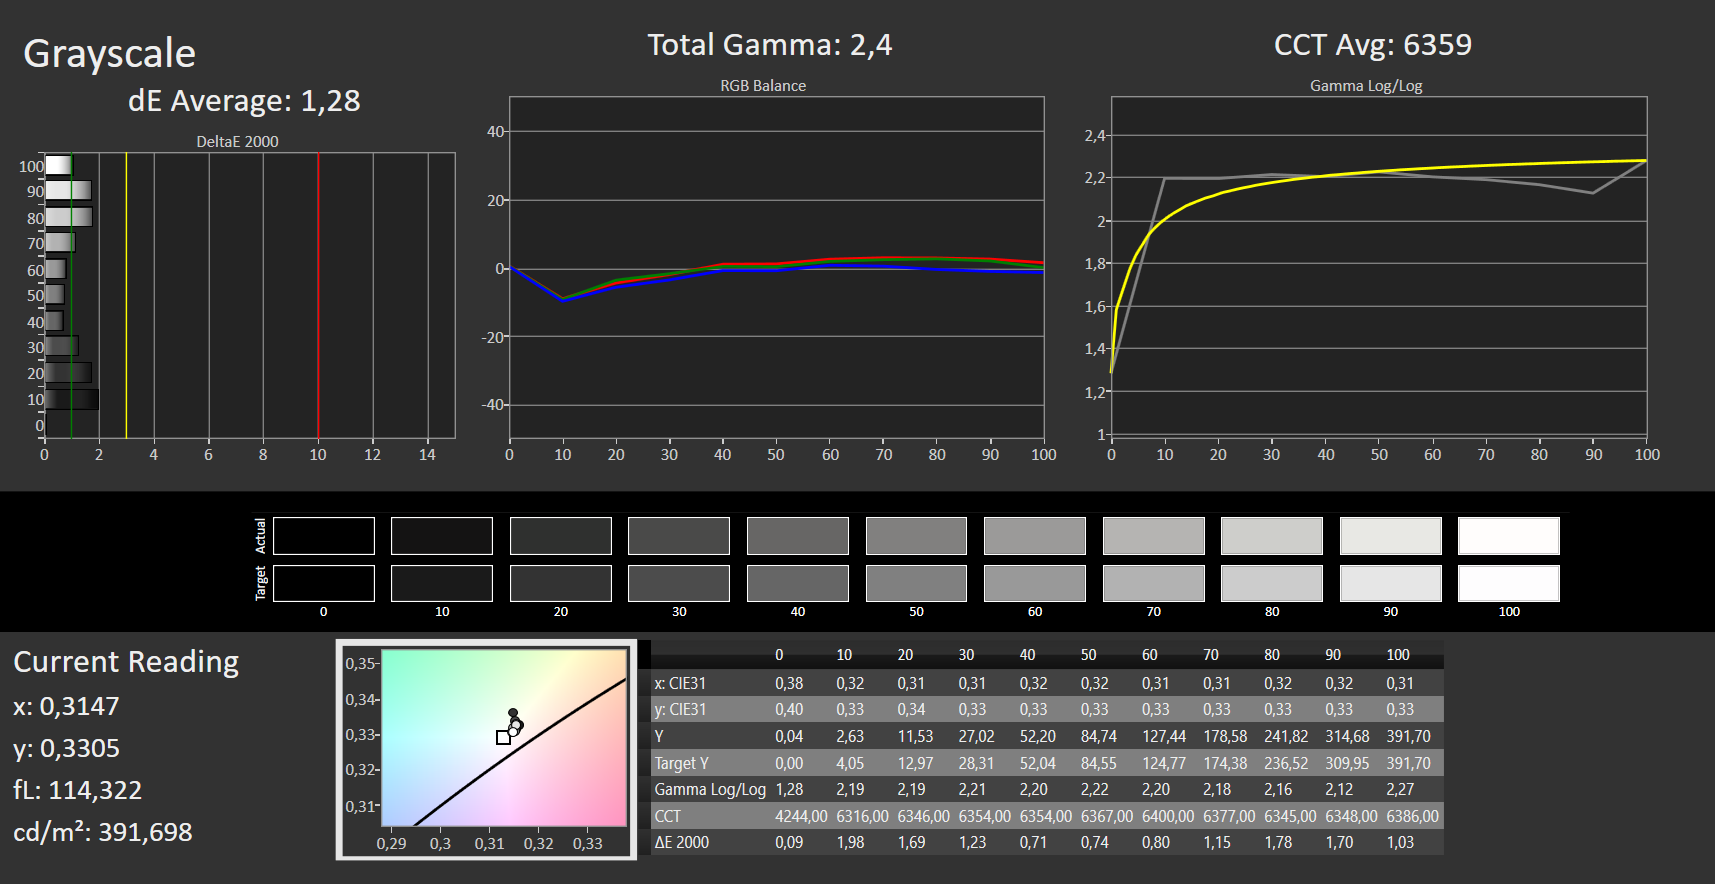
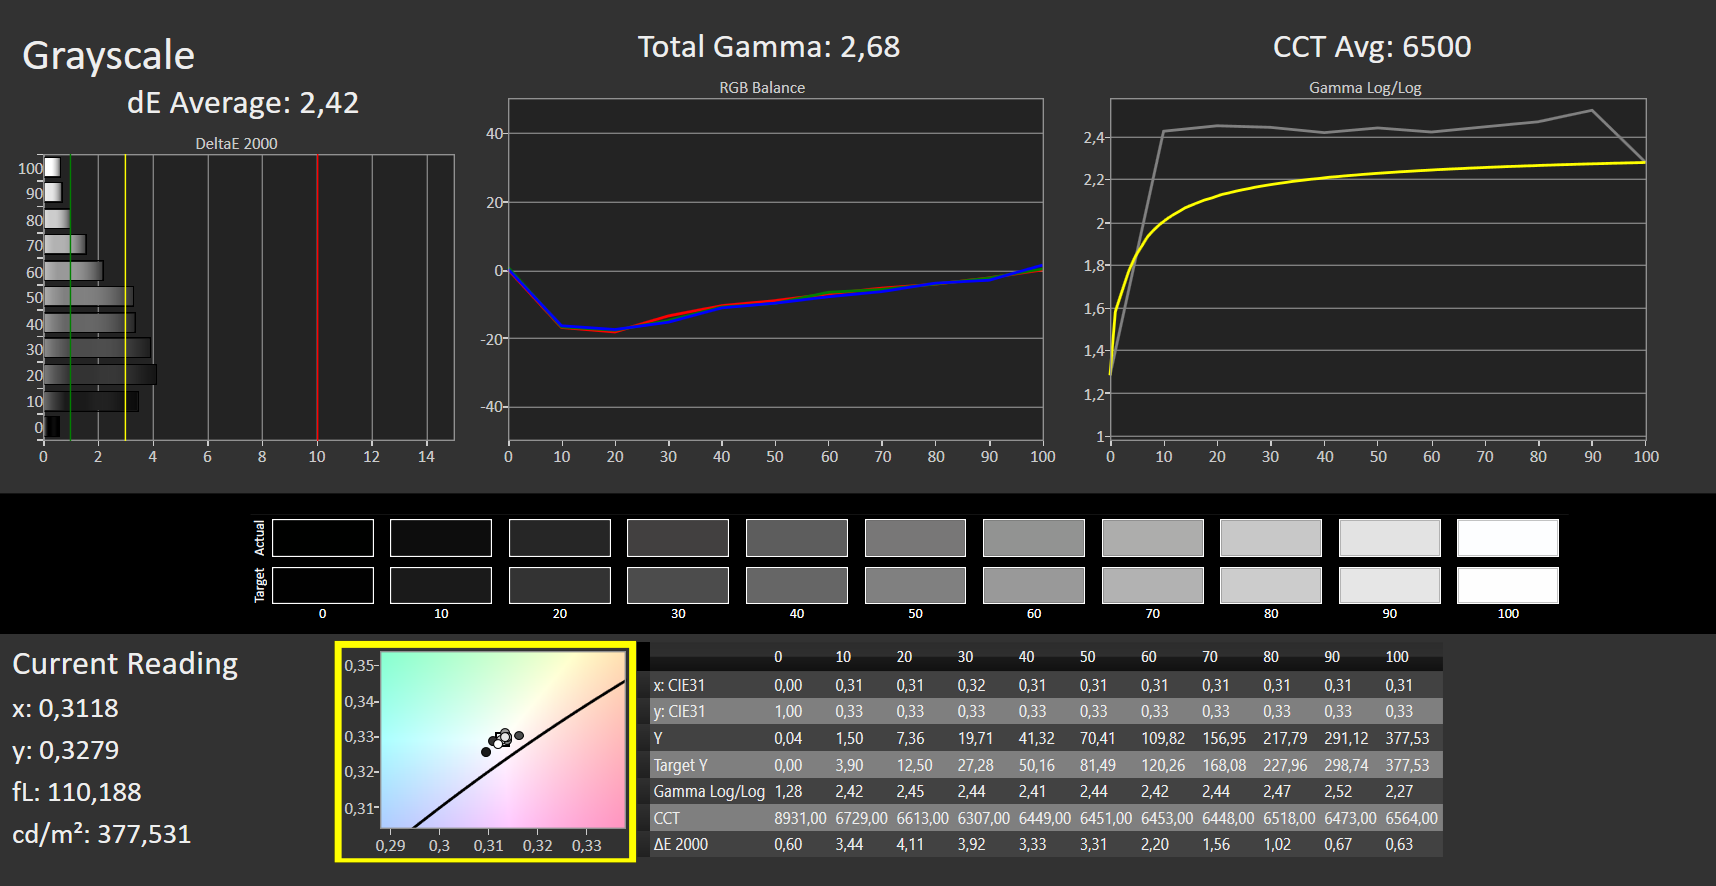
A glossy Full HD OLED panel from Samsung has been installed. The SDC4155 model's rates are only slightly different from those of the Samsung SDC4158 found in the AMD version of the ZenBook. The main difference between both panels is the poor brightness distribution in the display at hand. Here, the brightness ranges from 268 nits (lower right corner) to 406 nits (upper left corner), which might be a flaw in our specific test unit. The average brightness of 368 nits is acceptable.
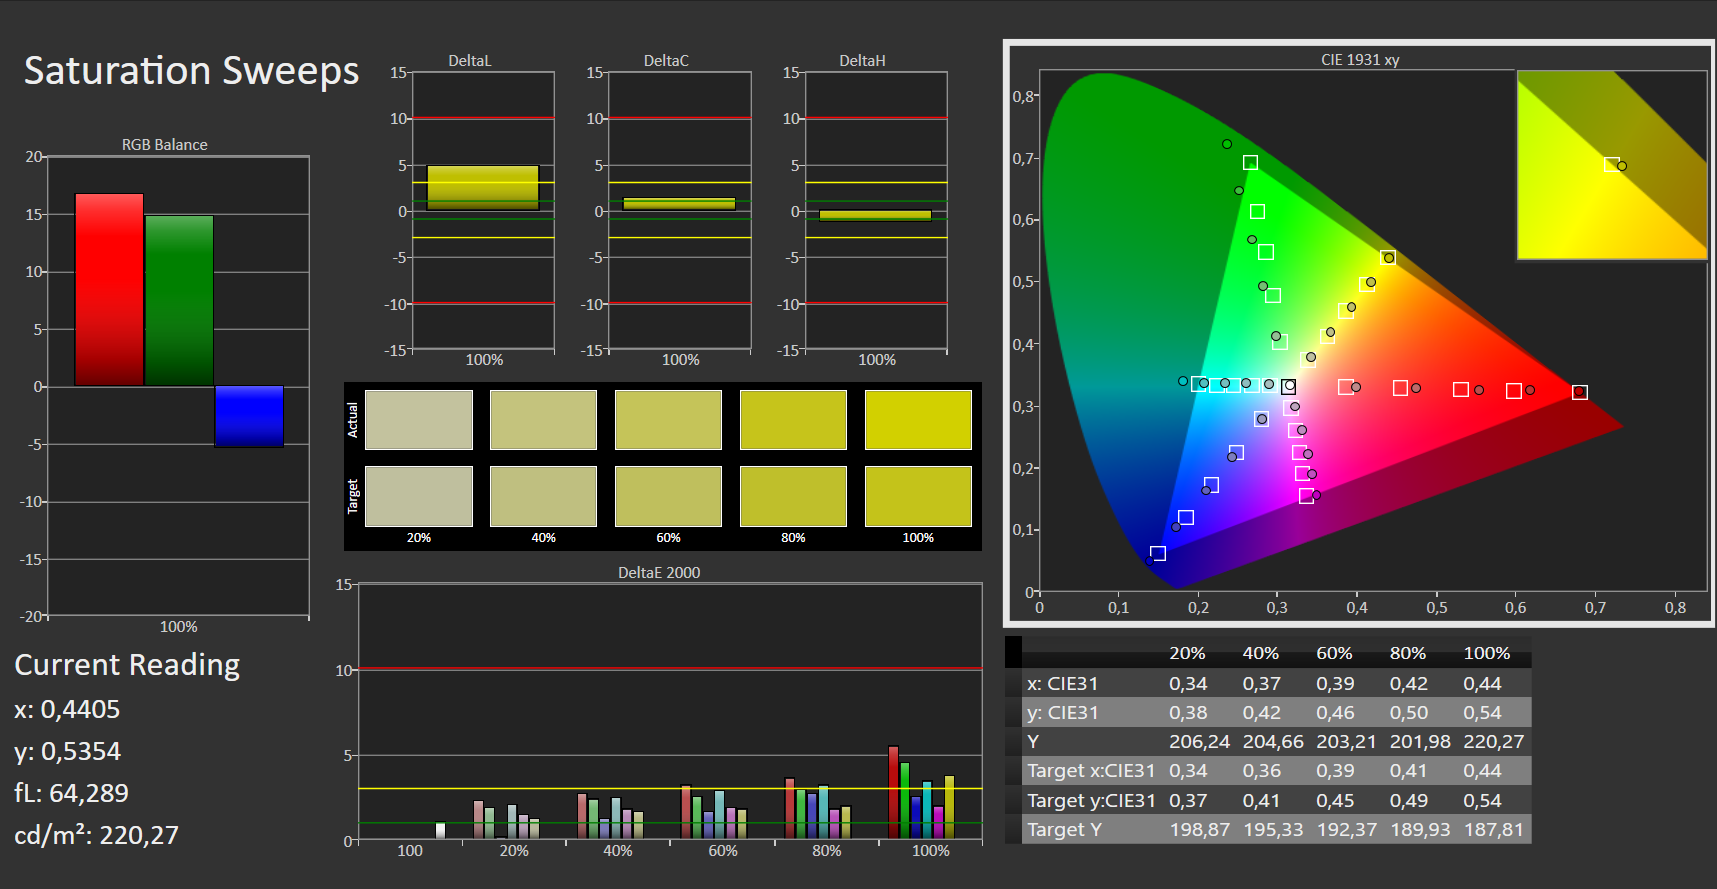
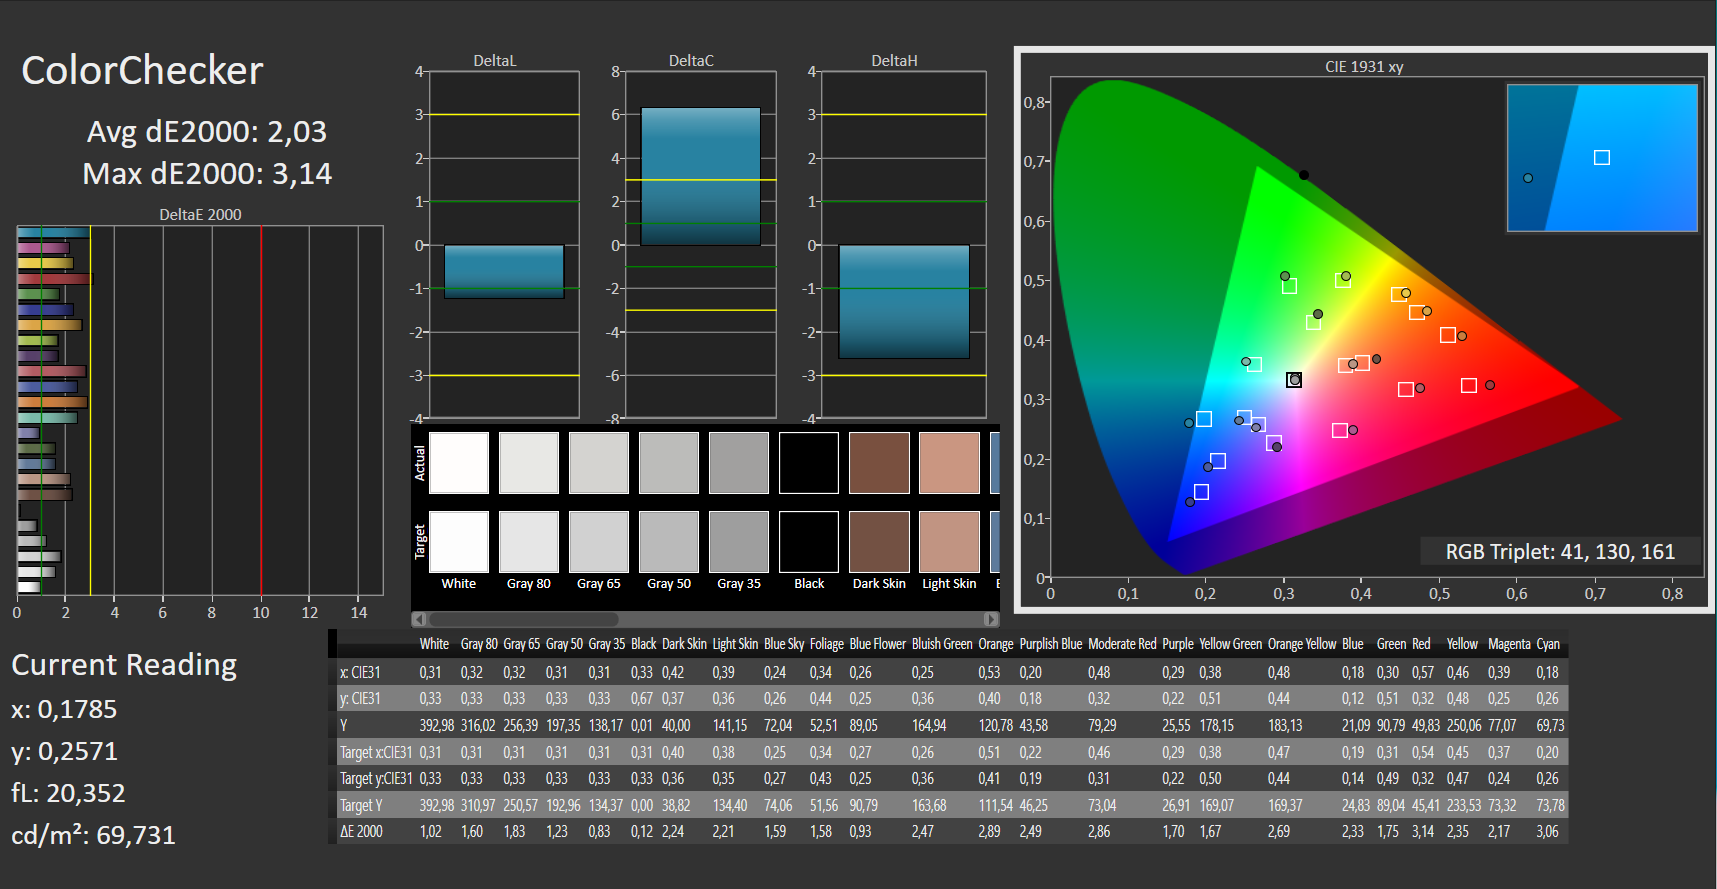
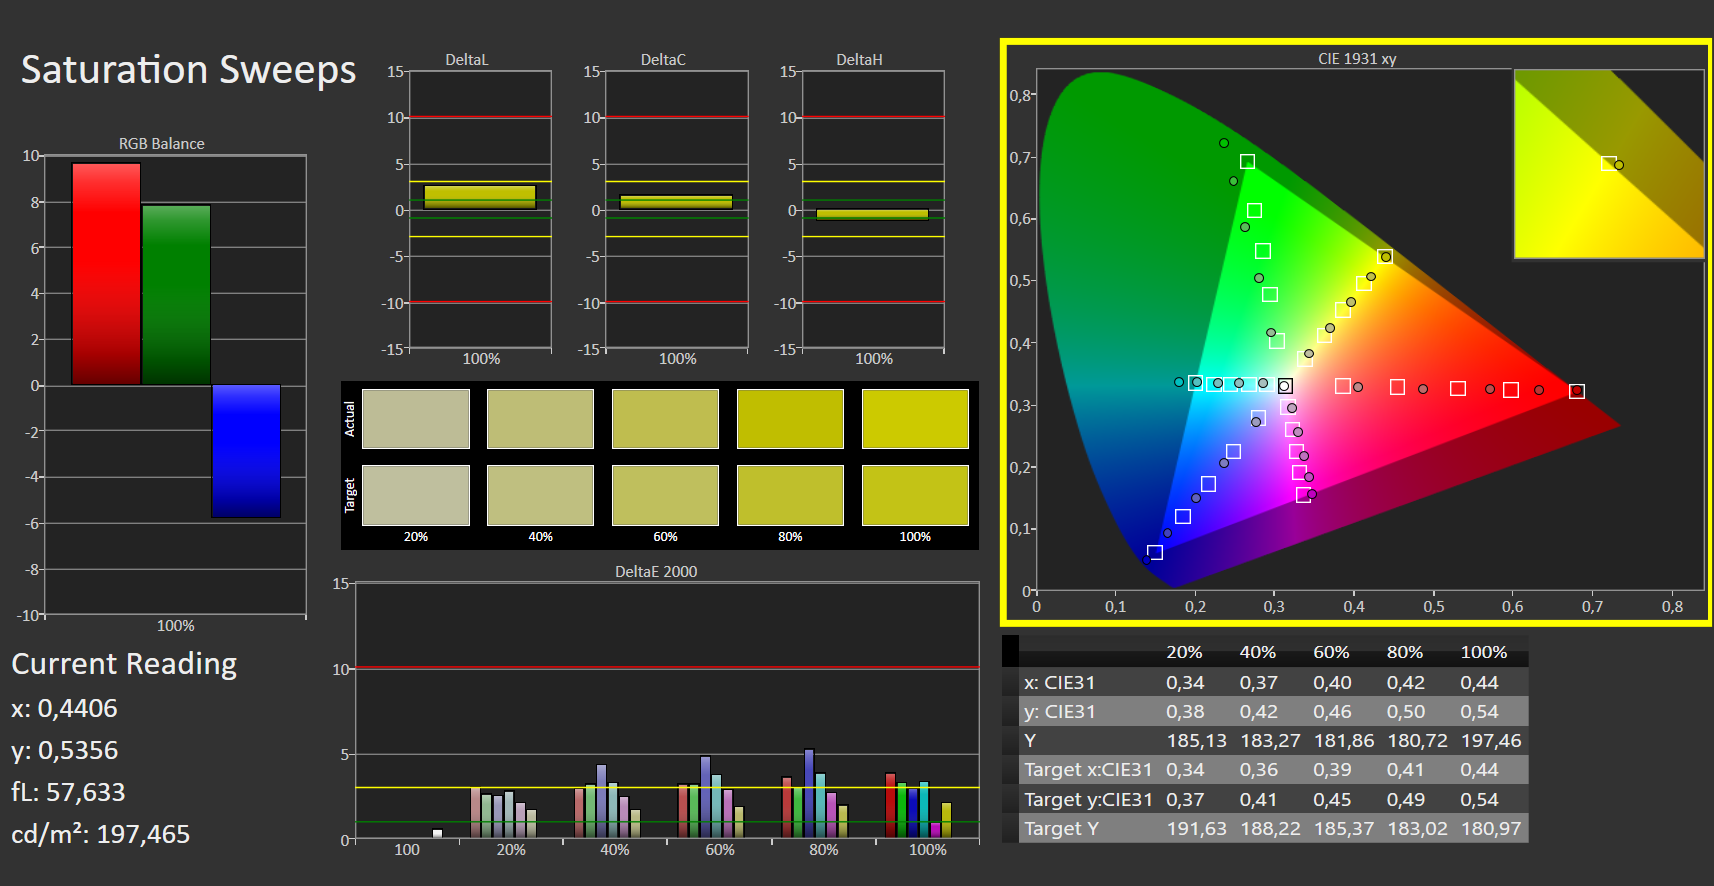
In exchange, the display is calibrated much better out of the box; we only measure minor color deviations and a new calibration hardly results in any improvements. Since OLEDs have an optimal black level, their contrast ratios are also excellent. In addition, there is no screen bleeding at all.
The OLED panel also offers good color-space coverage, since it fully reproduces the sRGB space and even covers 87% of the AdobeRGB one. According to Asus, DCI-P3 is fully reproduced as well, and in addition, the display is Pantone certified.
PWM is used for brightness control starting at brightness levels of 90% and below. The applied frequency of a mere 60 Hz is very low and can consequently be bothersome for sensitive users.


| |||||||||||||||||||||||||
Brightness Distribution: 66 %
Center on Battery: 390 cd/m²
Contrast: ∞:1 (Black: 0 cd/m²)
ΔE Color 2.03 | 0.5-29.43 Ø5, calibrated: 3.1
ΔE Greyscale 1.28 | 0.57-98 Ø5.3
100% sRGB (Argyll 1.6.3 3D)
87% AdobeRGB 1998 (Argyll 1.6.3 3D)
97.5% AdobeRGB 1998 (Argyll 2.2.0 3D)
100% sRGB (Argyll 2.2.0 3D)
99.9% Display P3 (Argyll 2.2.0 3D)
Gamma: 2.4
| Asus ZenBook 13 UX325EA Samsung SDC4155 (ATNA33XC09-0), OLED, 1920x1080, 13.30 | Asus ZenBook 13 UX325JA Sharp LQ133M1JW40, IPS, 1920x1080, 13.30 | Asus ZenBook 13 UM325S Samsung (SDC4158), OLED, 1920x1080, 13.30 | Lenovo Yoga Slim 7i Carbon 13 ITL N133GCA-GQ1, a-SI IPS LED, 2560x1600, 13.30 | HP Spectre x360 14t-ea000 LG Philips LGD0663, IPS, 1920x1280, 13.50 | Apple MacBook Air Late 2020 (M1, 8 Core GPU, 8 GB RAM) IPS, 2560x1600, 13.30 | |
|---|---|---|---|---|---|---|
| Display | -25% | 1% | -23% | -22% | ||
| Display P3 Coverage | 99.9 | 63.8 -36% | 99.9 0% | 65.1 -35% | 65.8 -34% | |
| sRGB Coverage | 100 | 94.5 -5% | 100 0% | 97.1 -3% | 98.2 -2% | |
| AdobeRGB 1998 Coverage | 97.5 | 64.9 -33% | 99.7 2% | 66.6 -32% | 67.9 -30% | |
| Response Times | -961% | -67% | -1380% | -2440% | ||
| Response Time Grey 50% / Grey 80% * | 2 ? | 47 ? -2250% | 4 ? -100% | 38.4 ? -1820% | 62 ? -3000% | |
| Response Time Black / White * | 2 ? | 21 ? -950% | 4 ? -100% | 20.8 ? -940% | 39.6 ? -1880% | |
| PWM Frequency | 60 ? | 250 ? 317% | 60 ? 0% | |||
| Screen | -21% | -22% | -11% | -24% | ||
| Brightness middle | 390 | 435 12% | 370 -5% | 325 -17% | 443.5 14% | |
| Brightness | 368 | 404 10% | 378 3% | 297 -19% | 394 7% | |
| Brightness Distribution | 66 | 83 26% | 96 45% | 83 26% | 78 18% | |
| Black Level * | 0.565 | 0.05 | 0.26 | 0.17 | ||
| Colorchecker dE 2000 * | 2.03 | 2.66 -31% | 4.33 -113% | 2.2 -8% | 2.7 -33% | |
| Colorchecker dE 2000 max. * | 3.14 | 4.73 -51% | 7.04 -124% | 3.5 -11% | 4.36 -39% | |
| Colorchecker dE 2000 calibrated * | 3.1 | 1.19 62% | 4.14 -34% | 0.6 81% | 2.61 16% | |
| Greyscale dE 2000 * | 1.28 | 3.65 -185% | 0.92 28% | 2.8 -119% | 3.4 -166% | |
| Gamma | 2.4 92% | 2.34 94% | 2.38 92% | 2.05 107% | 2.09 105% | |
| CCT | 6359 102% | 7109 91% | 6394 102% | 6452 101% | 6144 106% | |
| Color Space (Percent of AdobeRGB 1998) | 87 | 60 -31% | 89.4 3% | 61.3 -30% | 62.1 -29% | |
| Color Space (Percent of sRGB) | 100 | 95 -5% | 100 0% | 97 -3% | 98.5 -1% | |
| Contrast | 770 | 7400 | 1250 | 2609 | ||
| Total Average (Program / Settings) | -336% /
-210% | -29% /
-26% | -471% /
-209% | -829% /
-369% |
* ... smaller is better
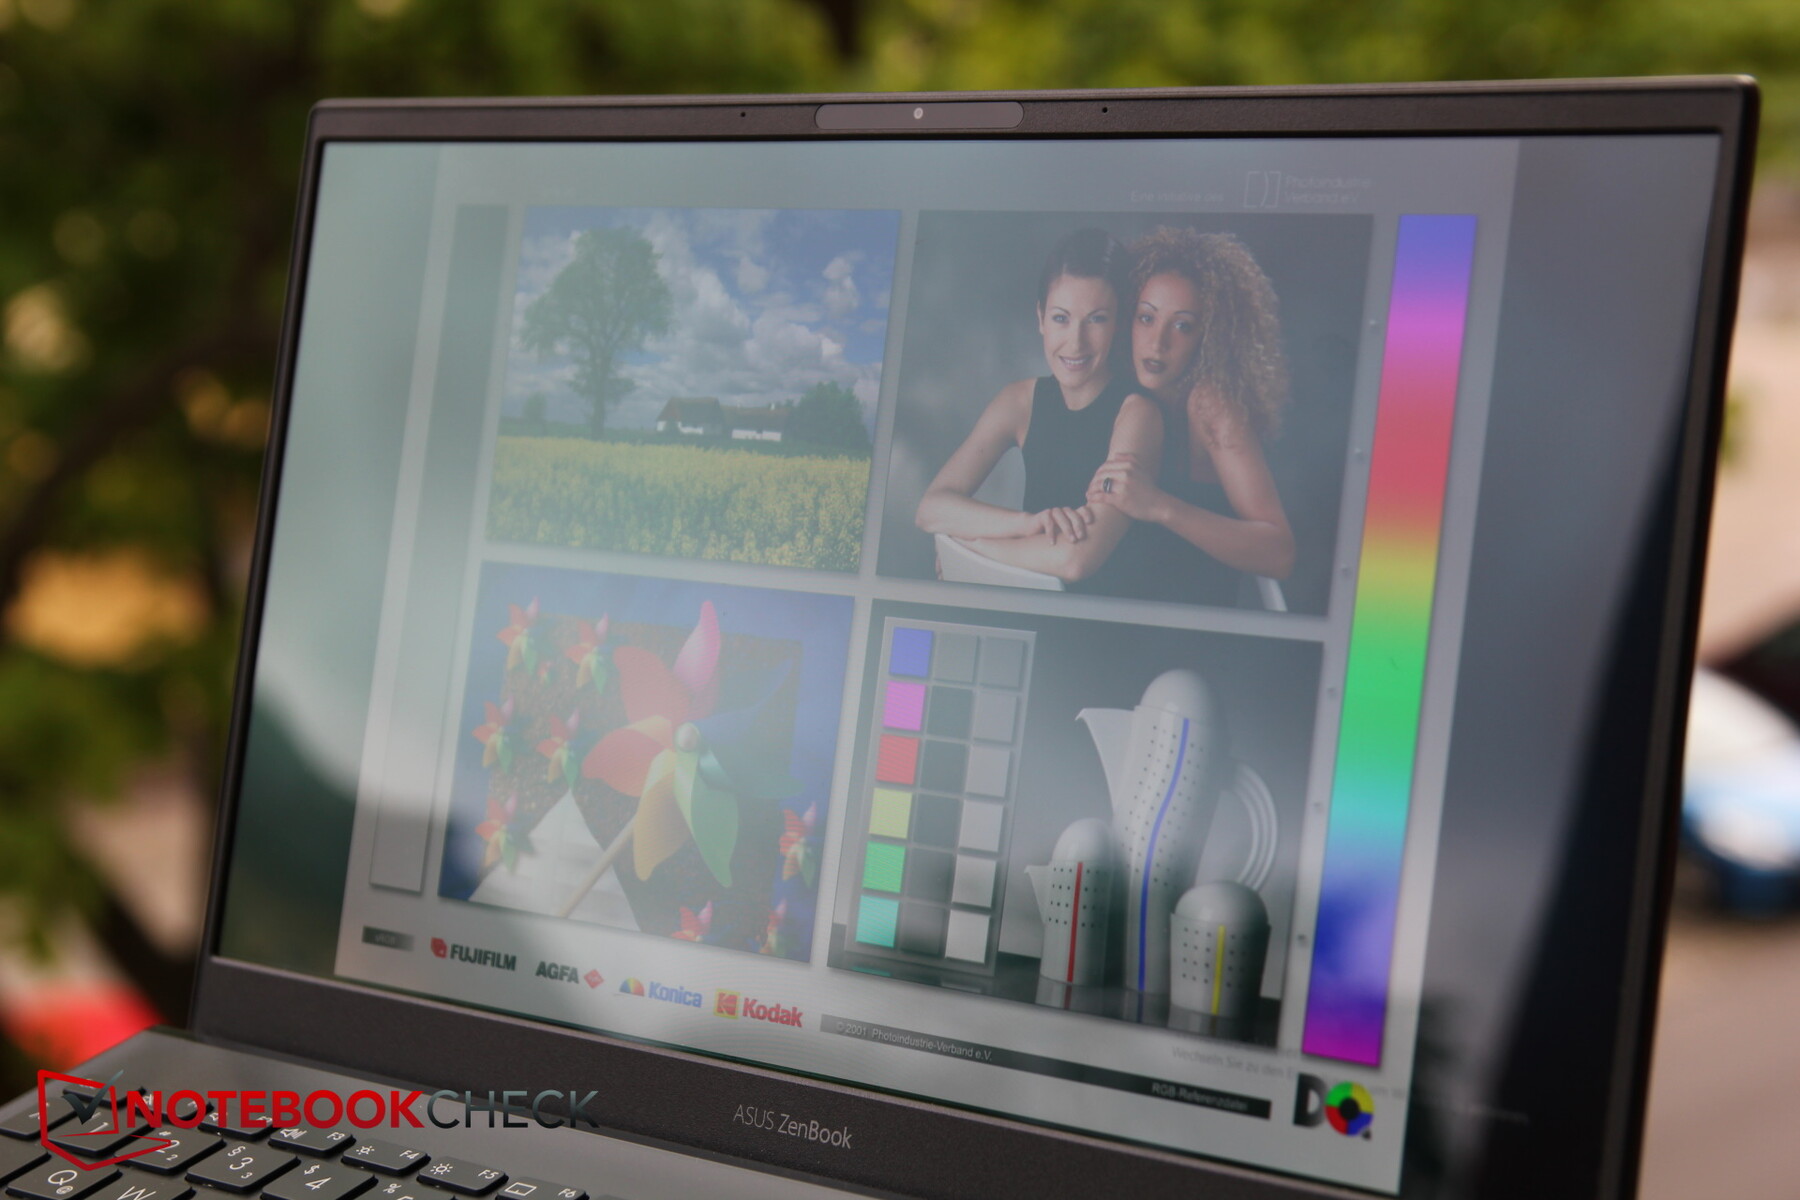
The strong reflections caused by the glossy surface are particularly annoying in outdoor use. The decent brightness and especially the good contrast ratio minimize this shortcoming to some extent, so that working in the shade is perfectly possible. However, content can only be recognized with difficulty in the sun.

Display Response Times
| ↔ Response Time Black to White | ||
|---|---|---|
| 2 ms ... rise ↗ and fall ↘ combined | ↗ 1 ms rise |  |
| ↘ 1 ms fall | ||
| The screen shows very fast response rates in our tests and should be very well suited for fast-paced gaming. In comparison, all tested devices range from 0.1 (minimum) to 240 (maximum) ms. » 6 % of all devices are better. This means that the measured response time is better than the average of all tested devices (21.5 ms). | ||
| ↔ Response Time 50% Grey to 80% Grey | ||
| 2 ms ... rise ↗ and fall ↘ combined | ↗ 1 ms rise |  |
| ↘ 1 ms fall | ||
| The screen shows very fast response rates in our tests and should be very well suited for fast-paced gaming. In comparison, all tested devices range from 0.2 (minimum) to 636 (maximum) ms. » 5 % of all devices are better. This means that the measured response time is better than the average of all tested devices (33.7 ms). | ||
Screen Flickering / PWM (Pulse-Width Modulation)
| Screen flickering / PWM detected | 60 Hz | ≤ 90 % brightness setting |   |
The display backlight flickers at 60 Hz (worst case, e.g., utilizing PWM) Flickering detected at a brightness setting of 90 % and below. There should be no flickering or PWM above this brightness setting. The frequency of 60 Hz is very low, so the flickering may cause eyestrain and headaches after extended use. In comparison: 53 % of all tested devices do not use PWM to dim the display. If PWM was detected, an average of 17853 (minimum: 5 - maximum: 3846000) Hz was measured. | |||
The OLED display is very viewing-angle stable, and it outshines some IPS panels in more ways than just this. Even under extreme viewing angles, the screen content is barely distorted.

Performance - Hopeless CPU, excellent GPU
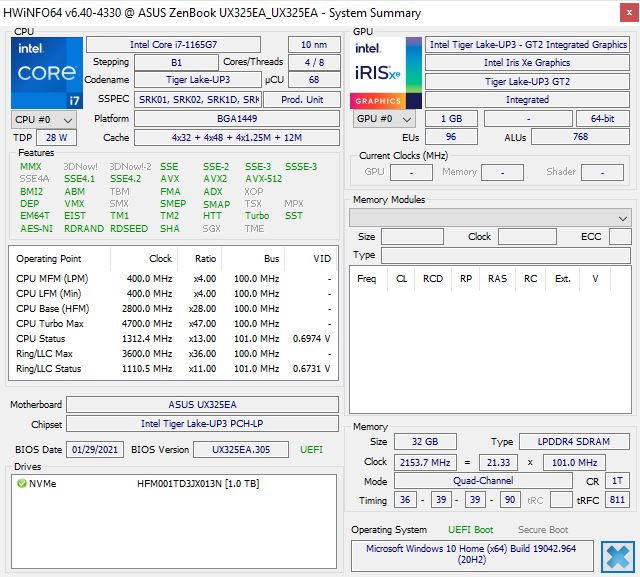
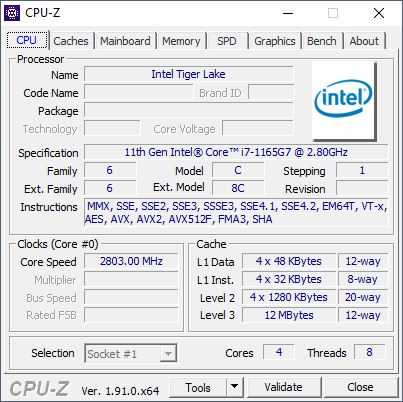
The 13-inch subnotebook can be equipped with an Intel Core i7-1165G7 (4 cores, 8 threads, G7 Graphics with 96 EUs) or with a weaker Intel Core i3-1115G4 (2 cores, 4 threads, G4 Graphics with 48 EUs). In our test model, the stronger of the two Intel processors competes against the AMD model with the AMD Ryzen 7 5800U (8 cores, 16 threads, RX Vega 8 with 8 CUs). In view of the number of cores, this is actually an unfair comparison, but Intel doesn't offer anything better. In return, our test model has a generous 32 GB of RAM instead of only 16 GB, and a 1 TB SSD serves as mass storage drive. With the still quite good processor and the strong internal GPU, the small device is also capable of handling tasks that are more computationally intensive.
To achieve the best results in our benchmark tests, we set the fan to performance mode using the MyAsus software. The manufacturer's software can be used to adjust some important system settings.


Processor
The Intel Core i7-1165G7 is an energy-efficient quad-core processor based on the current Tiger Lake architecture. It has a base clock speed of 2.8 GHz and boosts to a Turbo clock speed of up to 4.7 GHz (4.1 GHz on all cores).
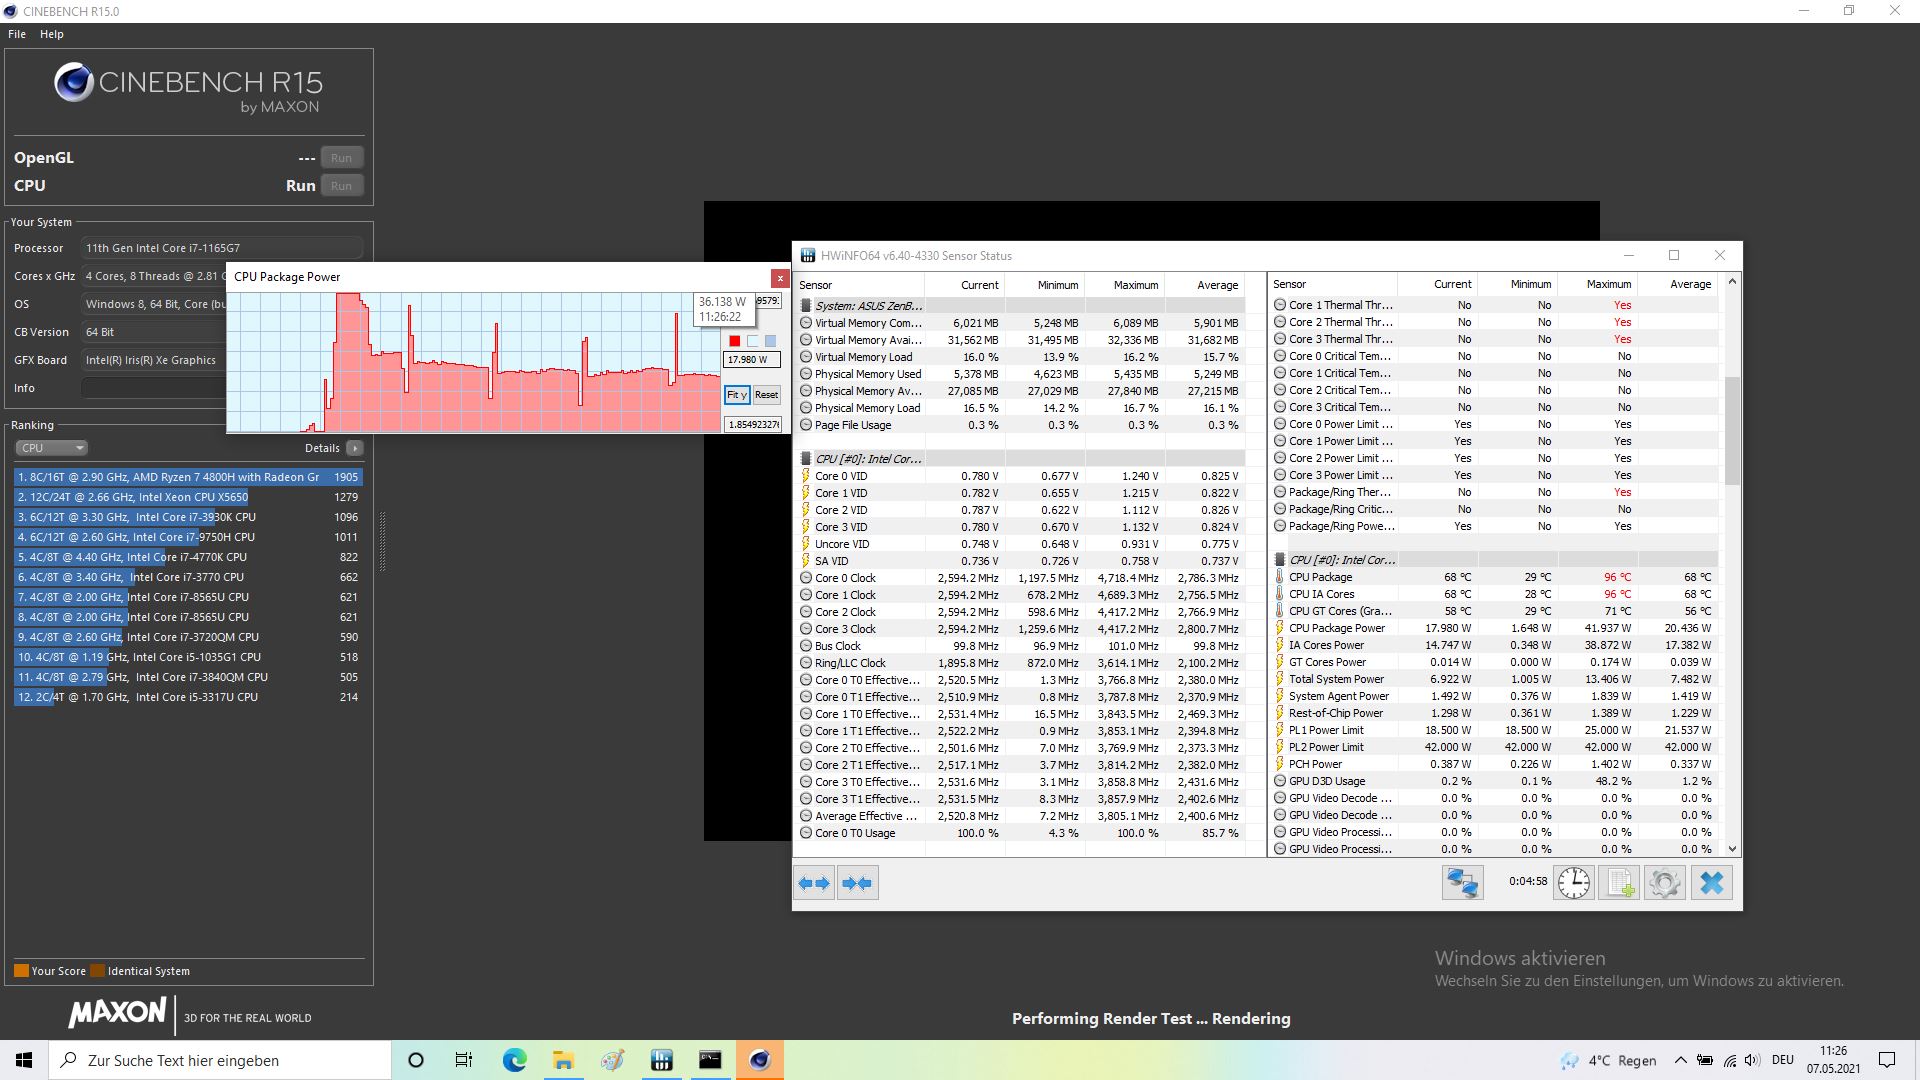
In the Cinebench R15 loop, performance drops continuously after the first, strong run (860 points) and stabilizes at around 615 points after a few runs. In the first run, the TDP briefly reaches 42 watts, but it quickly drops to around 20 watts for the rest of the run. Both values drop in subsequent runs. Instead of 42 watts, the initial TDP is only 36 watts, and there's sometimes no increase at all from the 20 watts, with the latter only being 16 instead of 20 watts towards the end.
Compared with the predecessor, where the new Intel Core i7-1165G7 replaces the Core-i7-1065G7, a multithread gain of about 17% is achieved in the Cinebench R15 benchmark. But the Ryzen 7 in the AMD model is almost twice as fast here! A bitter defeat for Intel, at least in the multithread category. The two rivals are closer to each other in the single-core test, and the AMD model only wins by 6% here. Compared with the other competitors that use the same CPU, the ZenBook ranks in the middle, the HP Spectre is slightly faster, and the Lenovo Yoga Slim slightly slower. The M1 in the MacBook is about 50% faster in the Cinebench R23 multithread test, while the Ryzen processor is still 60% faster here.
On battery power, a new Cinebench R15 run resulted in a score of 795 points instead of the 860 points when plugged in (first run).
Cinebench R20: CPU (Single Core) | CPU (Multi Core)
Cinebench R15: CPU Single 64Bit | CPU Multi 64Bit
Blender: v2.79 BMW27 CPU
7-Zip 18.03: 7z b 4 -mmt1 | 7z b 4
Geekbench 5.5: Single-Core | Multi-Core
HWBOT x265 Benchmark v2.2: 4k Preset
LibreOffice : 20 Documents To PDF
R Benchmark 2.5: Overall mean
| Cinebench R23 / Single Core | |
| Average of class Subnotebook (598 - 1934, n=68, last 2 years) | |
| Apple MacBook Air Late 2020 (M1, 8 Core GPU, 8 GB RAM) | |
| Asus ZenBook 13 UM325S | |
| Average Intel Core i7-1165G7 (1110 - 1539, n=59) | |
| Asus ZenBook 13 UX325EA | |
| Lenovo Yoga Slim 7i Carbon 13 ITL | |
| Cinebench R23 / Multi Core | |
| Average of class Subnotebook (2485 - 16201, n=68, last 2 years) | |
| Asus ZenBook 13 UM325S | |
| Apple MacBook Air Late 2020 (M1, 8 Core GPU, 8 GB RAM) | |
| Average Intel Core i7-1165G7 (2525 - 6862, n=64) | |
| Asus ZenBook 13 UX325EA | |
| Lenovo Yoga Slim 7i Carbon 13 ITL | |
| Cinebench R20 / CPU (Single Core) | |
| Average of class Subnotebook (216 - 738, n=64, last 2 years) | |
| Lenovo Yoga Slim 7i Carbon 13 ITL | |
| Asus ZenBook 13 UM325S | |
| Average Intel Core i7-1165G7 (442 - 589, n=81) | |
| HP Spectre x360 14t-ea000 | |
| Asus ZenBook 13 UX325EA | |
| Asus ZenBook 13 UX325JA | |
| Cinebench R20 / CPU (Multi Core) | |
| Average of class Subnotebook (810 - 6314, n=64, last 2 years) | |
| Asus ZenBook 13 UM325S | |
| HP Spectre x360 14t-ea000 | |
| Average Intel Core i7-1165G7 (1060 - 2657, n=81) | |
| Lenovo Yoga Slim 7i Carbon 13 ITL | |
| Asus ZenBook 13 UX325EA | |
| Asus ZenBook 13 UX325JA | |
| Cinebench R15 / CPU Single 64Bit | |
| Average of class Subnotebook (91.8 - 280, n=62, last 2 years) | |
| Asus ZenBook 13 UM325S | |
| Lenovo Yoga Slim 7i Carbon 13 ITL | |
| Asus ZenBook 13 UX325EA | |
| Average Intel Core i7-1165G7 (115 - 230, n=78) | |
| HP Spectre x360 14t-ea000 | |
| Asus ZenBook 13 UX325JA | |
| Cinebench R15 / CPU Multi 64Bit | |
| Average of class Subnotebook (514 - 2581, n=70, last 2 years) | |
| Asus ZenBook 13 UM325S | |
| HP Spectre x360 14t-ea000 | |
| Asus ZenBook 13 UX325EA | |
| Average Intel Core i7-1165G7 (553 - 1027, n=86) | |
| Lenovo Yoga Slim 7i Carbon 13 ITL | |
| Asus ZenBook 13 UX325JA | |
| Blender / v2.79 BMW27 CPU | |
| Asus ZenBook 13 UX325JA | |
| Asus ZenBook 13 UX325EA | |
| Lenovo Yoga Slim 7i Carbon 13 ITL | |
| Average Intel Core i7-1165G7 (468 - 1138, n=80) | |
| HP Spectre x360 14t-ea000 | |
| Average of class Subnotebook (201 - 1600, n=66, last 2 years) | |
| Asus ZenBook 13 UM325S | |
| 7-Zip 18.03 / 7z b 4 -mmt1 | |
| Asus ZenBook 13 UM325S | |
| Average of class Subnotebook (2197 - 6403, n=58, last 2 years) | |
| Asus ZenBook 13 UX325EA | |
| Lenovo Yoga Slim 7i Carbon 13 ITL | |
| Average Intel Core i7-1165G7 (4478 - 5507, n=80) | |
| HP Spectre x360 14t-ea000 | |
| Asus ZenBook 13 UX325JA | |
| 7-Zip 18.03 / 7z b 4 | |
| Average of class Subnotebook (16223 - 67444, n=57, last 2 years) | |
| Asus ZenBook 13 UM325S | |
| Average Intel Core i7-1165G7 (15347 - 27405, n=80) | |
| HP Spectre x360 14t-ea000 | |
| Asus ZenBook 13 UX325EA | |
| Lenovo Yoga Slim 7i Carbon 13 ITL | |
| Asus ZenBook 13 UX325JA | |
| Geekbench 5.5 / Single-Core | |
| Apple MacBook Air Late 2020 (M1, 8 Core GPU, 8 GB RAM) | |
| Average of class Subnotebook (672 - 2350, n=65, last 2 years) | |
| Asus ZenBook 13 UX325EA | |
| Lenovo Yoga Slim 7i Carbon 13 ITL | |
| Average Intel Core i7-1165G7 (1302 - 1595, n=77) | |
| HP Spectre x360 14t-ea000 | |
| Asus ZenBook 13 UM325S | |
| Asus ZenBook 13 UX325JA | |
| Geekbench 5.5 / Multi-Core | |
| Average of class Subnotebook (4274 - 12580, n=65, last 2 years) | |
| Apple MacBook Air Late 2020 (M1, 8 Core GPU, 8 GB RAM) | |
| Asus ZenBook 13 UM325S | |
| Lenovo Yoga Slim 7i Carbon 13 ITL | |
| Asus ZenBook 13 UX325EA | |
| HP Spectre x360 14t-ea000 | |
| Average Intel Core i7-1165G7 (3078 - 5926, n=77) | |
| Asus ZenBook 13 UX325JA | |
| HWBOT x265 Benchmark v2.2 / 4k Preset | |
| Average of class Subnotebook (1.5 - 19.4, n=56, last 2 years) | |
| Asus ZenBook 13 UM325S | |
| Average Intel Core i7-1165G7 (1.39 - 8.47, n=80) | |
| HP Spectre x360 14t-ea000 | |
| Lenovo Yoga Slim 7i Carbon 13 ITL | |
| Asus ZenBook 13 UX325EA | |
| Asus ZenBook 13 UX325JA | |
| LibreOffice / 20 Documents To PDF | |
| Asus ZenBook 13 UX325EA | |
| Asus ZenBook 13 UM325S | |
| Average of class Subnotebook (40.1 - 120.5, n=57, last 2 years) | |
| Asus ZenBook 13 UX325JA | |
| HP Spectre x360 14t-ea000 | |
| Lenovo Yoga Slim 7i Carbon 13 ITL | |
| Average Intel Core i7-1165G7 (21.5 - 88.1, n=78) | |
| R Benchmark 2.5 / Overall mean | |
| Asus ZenBook 13 UX325JA | |
| HP Spectre x360 14t-ea000 | |
| Average Intel Core i7-1165G7 (0.552 - 1.002, n=80) | |
| Lenovo Yoga Slim 7i Carbon 13 ITL | |
| Asus ZenBook 13 UX325EA | |
| Asus ZenBook 13 UM325S | |
| Average of class Subnotebook (0.4397 - 1.236, n=57, last 2 years) | |
* ... smaller is better
System performance
The laptop performs exactly as expected in PCMark 10, which means that its performance corresponds to that of an average Core i7-1165G7.
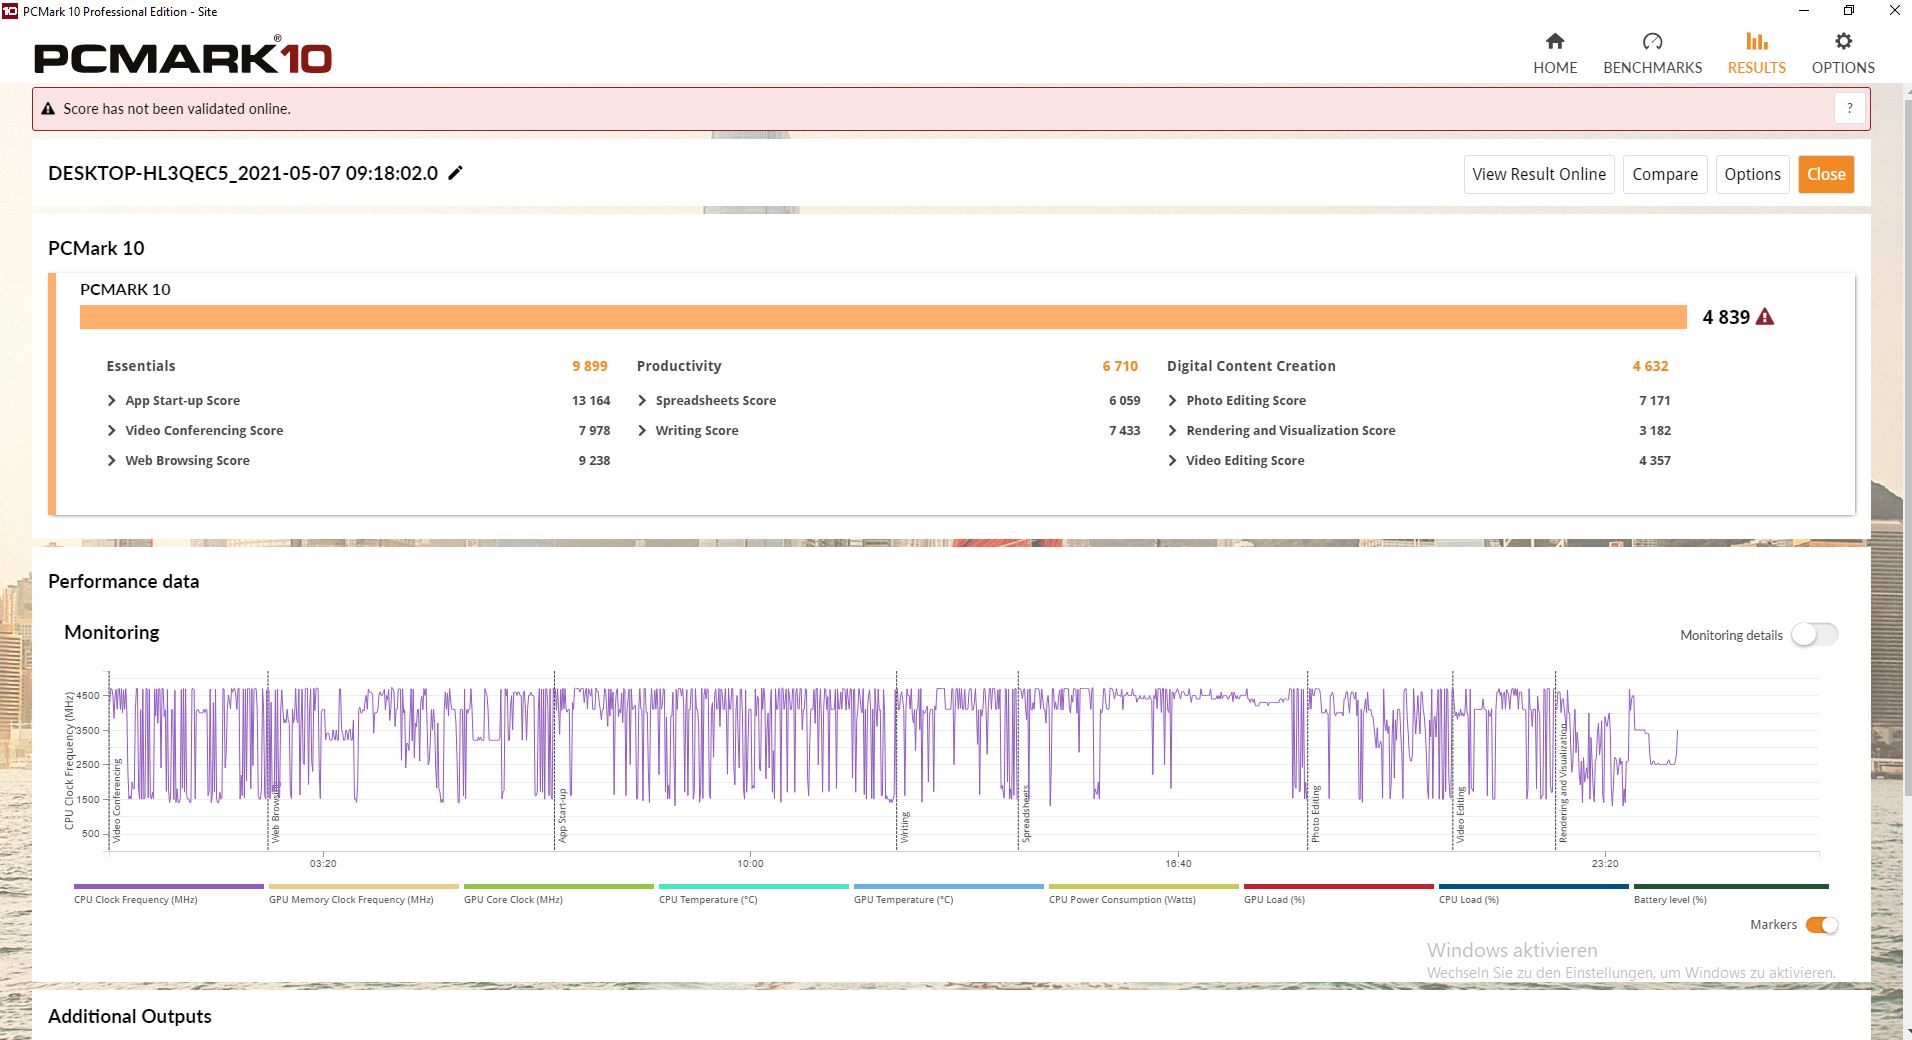
| PCMark 10 Score | 4839 points | |
Help | ||
DPC latencies
Opening multiple browser tabs is no problem for the ZenBook, and even YouTube playback of our 4K/60 fps test video is mastered by the Zen laptop without latency issues or dropped frames. However, the Zen laptop's resources aren't enough for the subsequent 10 seconds of Prime95, and minor latencies set in. The predecessor had considerably more serious problems in this regard, though.


| DPC Latencies / LatencyMon - interrupt to process latency (max), Web, Youtube, Prime95 | |
| Asus ZenBook 13 UX325JA | |
| HP Spectre x360 14t-ea000 | |
| Lenovo Yoga Slim 7i Carbon 13 ITL | |
| Asus ZenBook 13 UX325EA | |
| Asus ZenBook 13 UM325S | |
* ... smaller is better
Storage
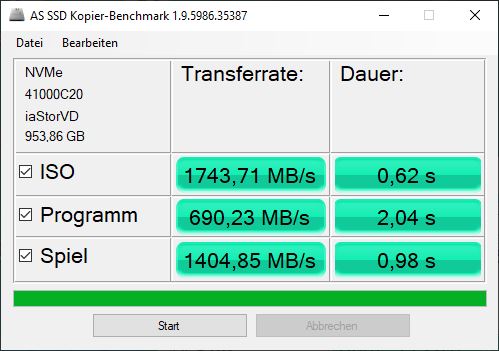
The NVMe SSD with 1 TB of storage space for data ranks 25th in our SSD/HDD database, so it should rather be regarded as a mid-range model. Furthermore, the same model also performs slightly better in the AMD ZenBook. Nevertheless, it's roughly on par with the Samsung PM981a SSD in the Yoga or the Spectre in our tests.


| Asus ZenBook 13 UX325EA SK Hynix HFM001TD3JX013N | Asus ZenBook 13 UX325JA Intel SSD 660p 1TB SSDPEKNW010T8 | Asus ZenBook 13 UM325S SK Hynix HFM001TD3JX013N | Lenovo Yoga Slim 7i Carbon 13 ITL Samsung SSD PM981a MZVLB512HBJQ | HP Spectre x360 14t-ea000 Samsung SSD PM981a MZVLB512HBJQ | Average SK Hynix HFM001TD3JX013N | |
|---|---|---|---|---|---|---|
| CrystalDiskMark 5.2 / 6 | -14% | 18% | 6% | -1% | 26% | |
| Write 4K | 115.9 | 139.7 21% | 151.6 31% | 139.5 20% | 82.2 -29% | 155.8 ? 34% |
| Read 4K | 44.69 | 56.4 26% | 63.2 41% | 36.38 -19% | 45.7 2% | 57 ? 28% |
| Write Seq | 1916 | 1265 -34% | 2292 20% | 1977 3% | 2000 4% | 3943 ? 106% |
| Read Seq | 1991 | 1492 -25% | 2073 4% | 2207 11% | 2206 11% | 2180 ? 9% |
| Write 4K Q32T1 | 436.1 | 402.5 -8% | 505 16% | 510 17% | 451.2 3% | 452 ? 4% |
| Read 4K Q32T1 | 346 | 329.3 -5% | 413.5 20% | 387.8 12% | 351 1% | 447 ? 29% |
| Write Seq Q32T1 | 2958 | 1786 -40% | 3137 6% | 2986 1% | 2982 1% | 2859 ? -3% |
| Read Seq Q32T1 | 3455 | 1923 -44% | 3604 4% | 3540 2% | 3529 2% | 3515 ? 2% |
| Write 4K Q8T8 | 488.9 | 791 ? | ||||
| Read 4K Q8T8 | 1276 | 1649 ? | ||||
| AS SSD | -44% | 15% | 9% | -11% | 6% | |
| Seq Read | 2635 | 1587 -40% | 2916 11% | 2861 9% | 2188 -17% | 2839 ? 8% |
| Seq Write | 1524 | 938 -38% | 1566 3% | 1321 -13% | 1320 -13% | 1917 ? 26% |
| 4K Read | 58 | 51 -12% | 56 -3% | 52.5 -9% | 53.5 -8% | 53 ? -9% |
| 4K Write | 143.8 | 141.9 -1% | 159.8 11% | 196.7 37% | 123.7 -14% | 127.3 ? -11% |
| 4K-64 Read | 1014 | 576 -43% | 1011 0% | 1153 14% | 1010 0% | 1369 ? 35% |
| 4K-64 Write | 1342 | 584 -56% | 2136 59% | 1807 35% | 1808 35% | 1939 ? 44% |
| Access Time Read * | 0.038 | 0.083 -118% | 0.028 26% | 0.064 -68% | 0.055 -45% | 0.0468 ? -23% |
| Access Time Write * | 0.028 | 0.04 -43% | 0.028 -0% | 0.018 36% | 0.076 -171% | 0.0532 ? -90% |
| Score Read | 1336 | 785 -41% | 1359 2% | 1491 12% | 1282 -4% | 1706 ? 28% |
| Score Write | 1638 | 820 -50% | 2452 50% | 2136 30% | 2063 26% | 2258 ? 38% |
| Score Total | 3615 | 1990 -45% | 4451 23% | 4322 20% | 3970 10% | 4797 ? 33% |
| Copy ISO MB/s | 1744 | 1311 -25% | 1983 14% | 1644 -6% | 1908 ? 9% | |
| Copy Program MB/s | 690 | 310.3 -55% | 792 15% | 920 33% | 665 ? -4% | |
| Copy Game MB/s | 1405 | 801 -43% | 1457 4% | 1725 23% | 1349 ? -4% | |
| Total Average (Program / Settings) | -29% /
-33% | 17% /
16% | 8% /
8% | -6% /
-7% | 16% /
13% |
* ... smaller is better

Continuous load read: DiskSpd Read Loop, Queue Depth 8
Graphics card
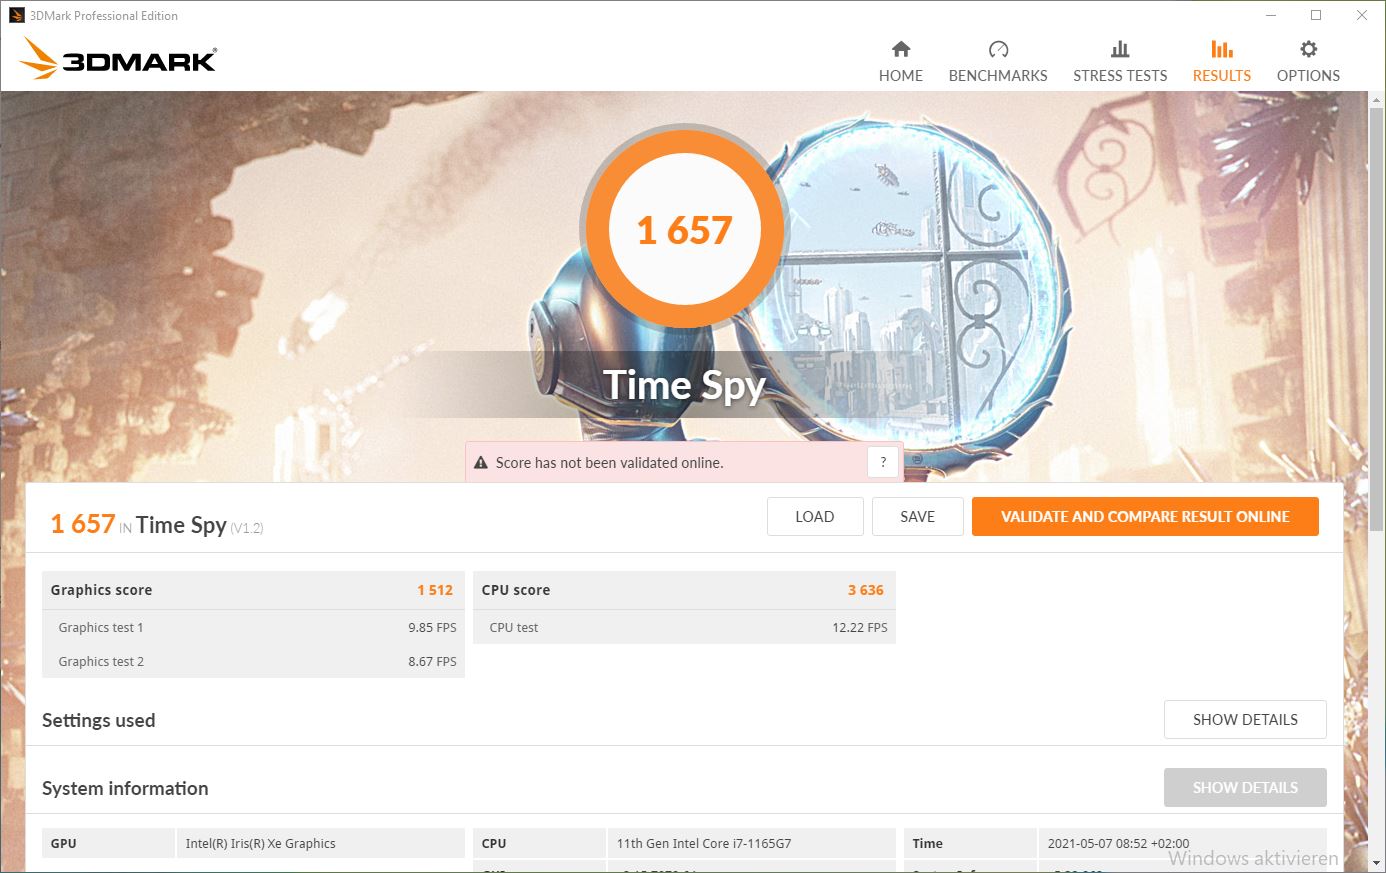
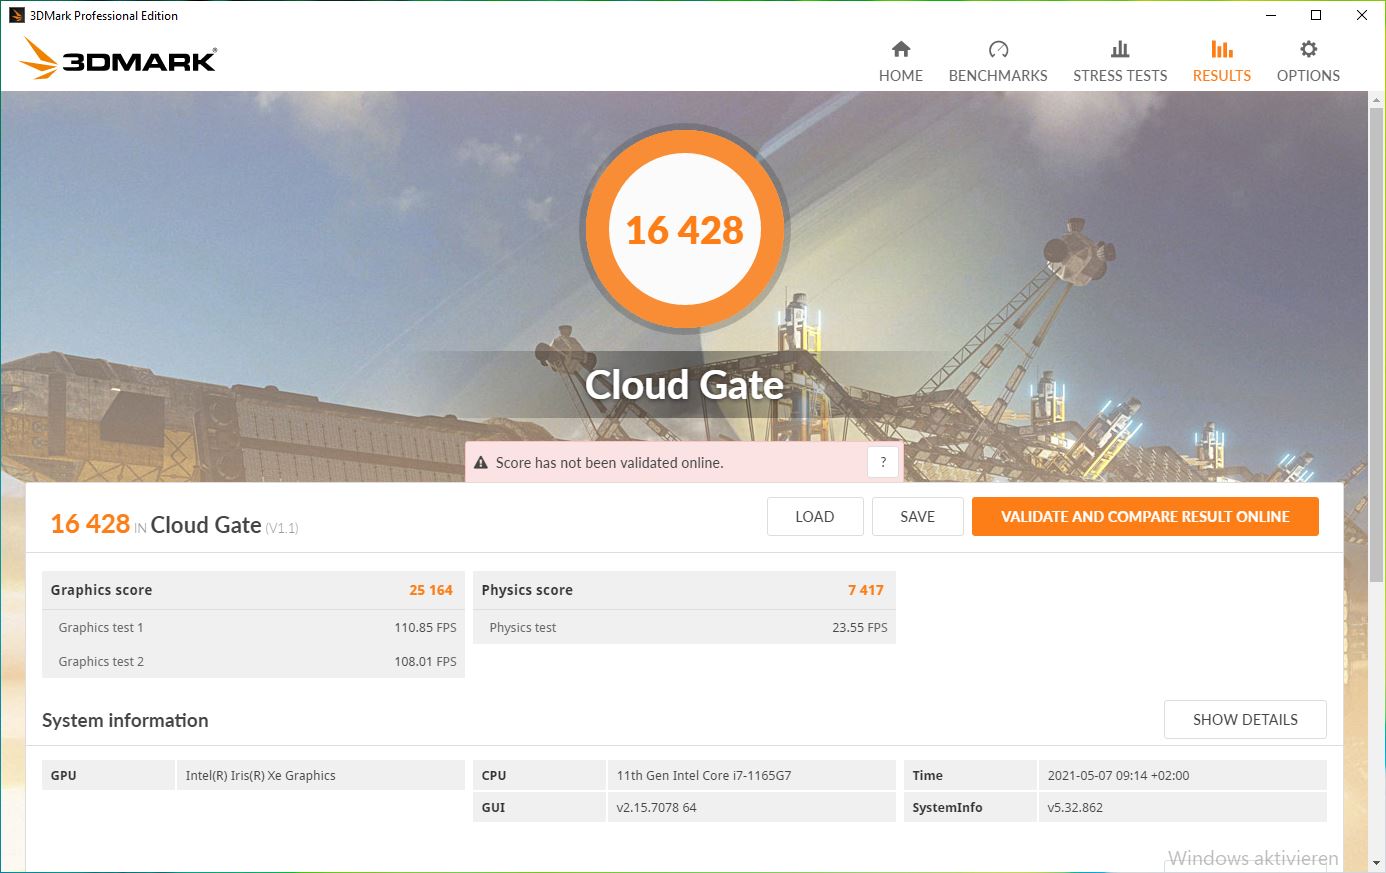
The Intel Iris Xe Graphics G7 96EUs internal graphics card is responsible for graphics processing. It's currently Intel's most powerful internal GPU. In the 3DMark benchmarks, it's 40% to 60% faster than the G7 graphics of the predecessor, and it can finally beat the AMD ZenBook in terms of performance for once, but the lead is rather narrow across all tests. Our ZenBook is on par with the performance of the Yoga and the Spectre here.
On battery power, graphics performance is throttled by about 16% in 3DMark 11.


| 3DMark 11 Performance | 6994 points | |
| 3DMark Cloud Gate Standard Score | 16428 points | |
| 3DMark Fire Strike Score | 4714 points | |
| 3DMark Time Spy Score | 1657 points | |
Help | ||
Gaming performance
Although gaming is possible with the ZenBook, the results vary quite a bit. For example, the internal Intel GPU performs about 4% above an average G7 from our database in The Witcher 3 and consequently beats the assembled competition. In DOTA 2 Reborn or X-Plane, on the other hand, it falls a bit short and leaves the top positions to the competition. The MacBook Air is about 20% faster in Shadow of the Tomb Raider.
Overall, you can play most games at medium resolutions and details with the ZenBook. However, when it comes to modern and very demanding games (see Shadow of the Tomb Raider), there might only be enough power to play at the minimum settings.
| The Witcher 3 | |
| 1366x768 Medium Graphics & Postprocessing | |
| Average of class Subnotebook (29 - 264, n=46, last 2 years) | |
| Asus ZenBook 13 UX325EA | |
| Average Intel Iris Xe Graphics G7 96EUs (21.4 - 74.1, n=181) | |
| Lenovo Yoga Slim 7i Carbon 13 ITL | |
| HP Spectre x360 14t-ea000 | |
| 1920x1080 High Graphics & Postprocessing (Nvidia HairWorks Off) | |
| Average of class Subnotebook (11.2 - 92, n=56, last 2 years) | |
| Asus ZenBook 13 UX325EA | |
| HP Spectre x360 14t-ea000 | |
| Average Intel Iris Xe Graphics G7 96EUs (10.6 - 45.9, n=186) | |
| Lenovo Yoga Slim 7i Carbon 13 ITL | |
| 1920x1080 Ultra Graphics & Postprocessing (HBAO+) | |
| Average of class Subnotebook (8 - 44.2, n=57, last 2 years) | |
| Asus ZenBook 13 UX325EA | |
| Average Intel Iris Xe Graphics G7 96EUs (8.79 - 20.1, n=176) | |
| HP Spectre x360 14t-ea000 | |
| Rise of the Tomb Raider | |
| 1024x768 Lowest Preset | |
| Average Intel Iris Xe Graphics G7 96EUs (46 - 85.5, n=5) | |
| Asus ZenBook 13 UX325EA | |
| 1366x768 Medium Preset AF:2x | |
| Asus ZenBook 13 UX325EA | |
| Average Intel Iris Xe Graphics G7 96EUs (35.1 - 49, n=5) | |
| 1920x1080 High Preset AA:FX AF:4x | |
| Asus ZenBook 13 UX325EA | |
| Average Intel Iris Xe Graphics G7 96EUs (19.9 - 28.2, n=5) | |
| low | med. | high | ultra | |
| The Witcher 3 (2015) | 85.4 | 54.5 | 30.15 | 14.2 |
| Dota 2 Reborn (2015) | 65.4 | 65.9 | 49.1 | 47.2 |
| Rise of the Tomb Raider (2016) | 67.2 | 43.8 | 27.5 | 21.5 |
| X-Plane 11.11 (2018) | 26.9 | 33.9 | 30.5 | |
| Shadow of the Tomb Raider (2018) | 50 | 22 | 21 | 18 |
Emissions - Slightly louder under load
Noise emissions
The fans remain silent under most light workloads of everyday use such as browsing the web or streaming video. However, the device gets a bit louder than the competition under load but never irritatingly loud.
This only applies to the fan's standard mode, though, where the laptop dynamically adjusts the fan speed depending on the load. If you switch to performance mode, the fans initially turn on even in idle usage, but they also turn off later. However, they become active again when browsing or streaming videos.
Therefore, if you don't need maximum performance, you should leave the fan in standard mode to work more quietly. When the fans are completely silent, we can hear a slight coil buzz coming from the ZenBook, but only when we hold it close to our ear.
Noise Level
| Idle |
| 26 / 26 / 30.5 dB(A) |
| Load |
| 43.9 / 43.9 dB(A) |
 | ||
30 dB silent 40 dB(A) audible 50 dB(A) loud |
||
min: | ||
| Asus ZenBook 13 UX325EA Iris Xe G7 96EUs, i7-1165G7, SK Hynix HFM001TD3JX013N | Asus ZenBook 13 UX325JA Iris Plus Graphics G7 (Ice Lake 64 EU), i7-1065G7, Intel SSD 660p 1TB SSDPEKNW010T8 | Asus ZenBook 13 UM325S Vega 8, R7 5800U, SK Hynix HFM001TD3JX013N | Lenovo Yoga Slim 7i Carbon 13 ITL Iris Xe G7 96EUs, i7-1165G7, Samsung SSD PM981a MZVLB512HBJQ | HP Spectre x360 14t-ea000 Iris Xe G7 96EUs, i7-1165G7, Samsung SSD PM981a MZVLB512HBJQ | |
|---|---|---|---|---|---|
| Noise | -2% | -2% | 0% | 10% | |
| off / environment * | 26 | 30.1 -16% | 29.6 -14% | 28.7 -10% | 25.8 1% |
| Idle Minimum * | 26 | 30.1 -16% | 30.5 -17% | 28.7 -10% | 25.9 -0% |
| Idle Average * | 26 | 30.1 -16% | 30.5 -17% | 28.7 -10% | 25.9 -0% |
| Idle Maximum * | 30.5 | 30.1 1% | 30.5 -0% | 30.6 -0% | 25.9 15% |
| Load Average * | 43.9 | 32.7 26% | 35.7 19% | 37.3 15% | 26.4 40% |
| Load Maximum * | 43.9 | 38.5 12% | 37.2 15% | 37.3 15% | 41.5 5% |
| Witcher 3 ultra * | 38.6 | 37.3 | 36.9 |
* ... smaller is better
Temperature
The ZenBook always stays pleasantly cool in idle usage, but the AMD version heats up noticeably here. Under load, the Intel ZenBook can heat up to 47 °C (~117 °F) at the bottom, while it's much cooler at the top at a maximum of 39 °C (~102 °F). The AMD version is a bit more balanced in this respect; overall, both devices are equally warm under load.
The hot spot is in the central area towards the display, where the air vents are found. The palm rests and large parts of the keyboard don't get particularly warm even under load.
(+) The maximum temperature on the upper side is 39.3 °C / 103 F, compared to the average of 35.9 °C / 97 F, ranging from 21.4 to 59 °C for the class Subnotebook.
(-) The bottom heats up to a maximum of 47.3 °C / 117 F, compared to the average of 39.4 °C / 103 F
(+) In idle usage, the average temperature for the upper side is 24.1 °C / 75 F, compared to the device average of 30.7 °C / 87 F.
(+) Playing The Witcher 3, the average temperature for the upper side is 31.3 °C / 88 F, compared to the device average of 30.7 °C / 87 F.
(+) The palmrests and touchpad are cooler than skin temperature with a maximum of 28.6 °C / 83.5 F and are therefore cool to the touch.
(±) The average temperature of the palmrest area of similar devices was 28.3 °C / 82.9 F (-0.3 °C / -0.6 F).
| Asus ZenBook 13 UX325EA Iris Xe G7 96EUs, i7-1165G7, SK Hynix HFM001TD3JX013N | Asus ZenBook 13 UX325JA Iris Plus Graphics G7 (Ice Lake 64 EU), i7-1065G7, Intel SSD 660p 1TB SSDPEKNW010T8 | Asus ZenBook 13 UM325S Vega 8, R7 5800U, SK Hynix HFM001TD3JX013N | Lenovo Yoga Slim 7i Carbon 13 ITL Iris Xe G7 96EUs, i7-1165G7, Samsung SSD PM981a MZVLB512HBJQ | HP Spectre x360 14t-ea000 Iris Xe G7 96EUs, i7-1165G7, Samsung SSD PM981a MZVLB512HBJQ | Apple MacBook Air Late 2020 (M1, 8 Core GPU, 8 GB RAM) M1 8-Core GPU, M1, Apple SSD AP0512 | |
|---|---|---|---|---|---|---|
| Heat | 0% | -14% | -2% | -6% | 7% | |
| Maximum Upper Side * | 39.3 | 39.7 -1% | 42.6 -8% | 43.2 -10% | 40.4 -3% | 42.9 -9% |
| Maximum Bottom * | 47.3 | 39.9 16% | 43.6 8% | 49.7 -5% | 52.8 -12% | 43.7 8% |
| Idle Upper Side * | 25.9 | 28.7 -11% | 36 -39% | 25.4 2% | 27.2 -5% | 23.5 9% |
| Idle Bottom * | 27.8 | 28.5 -3% | 32.8 -18% | 26.6 4% | 29.2 -5% | 22.9 18% |
* ... smaller is better
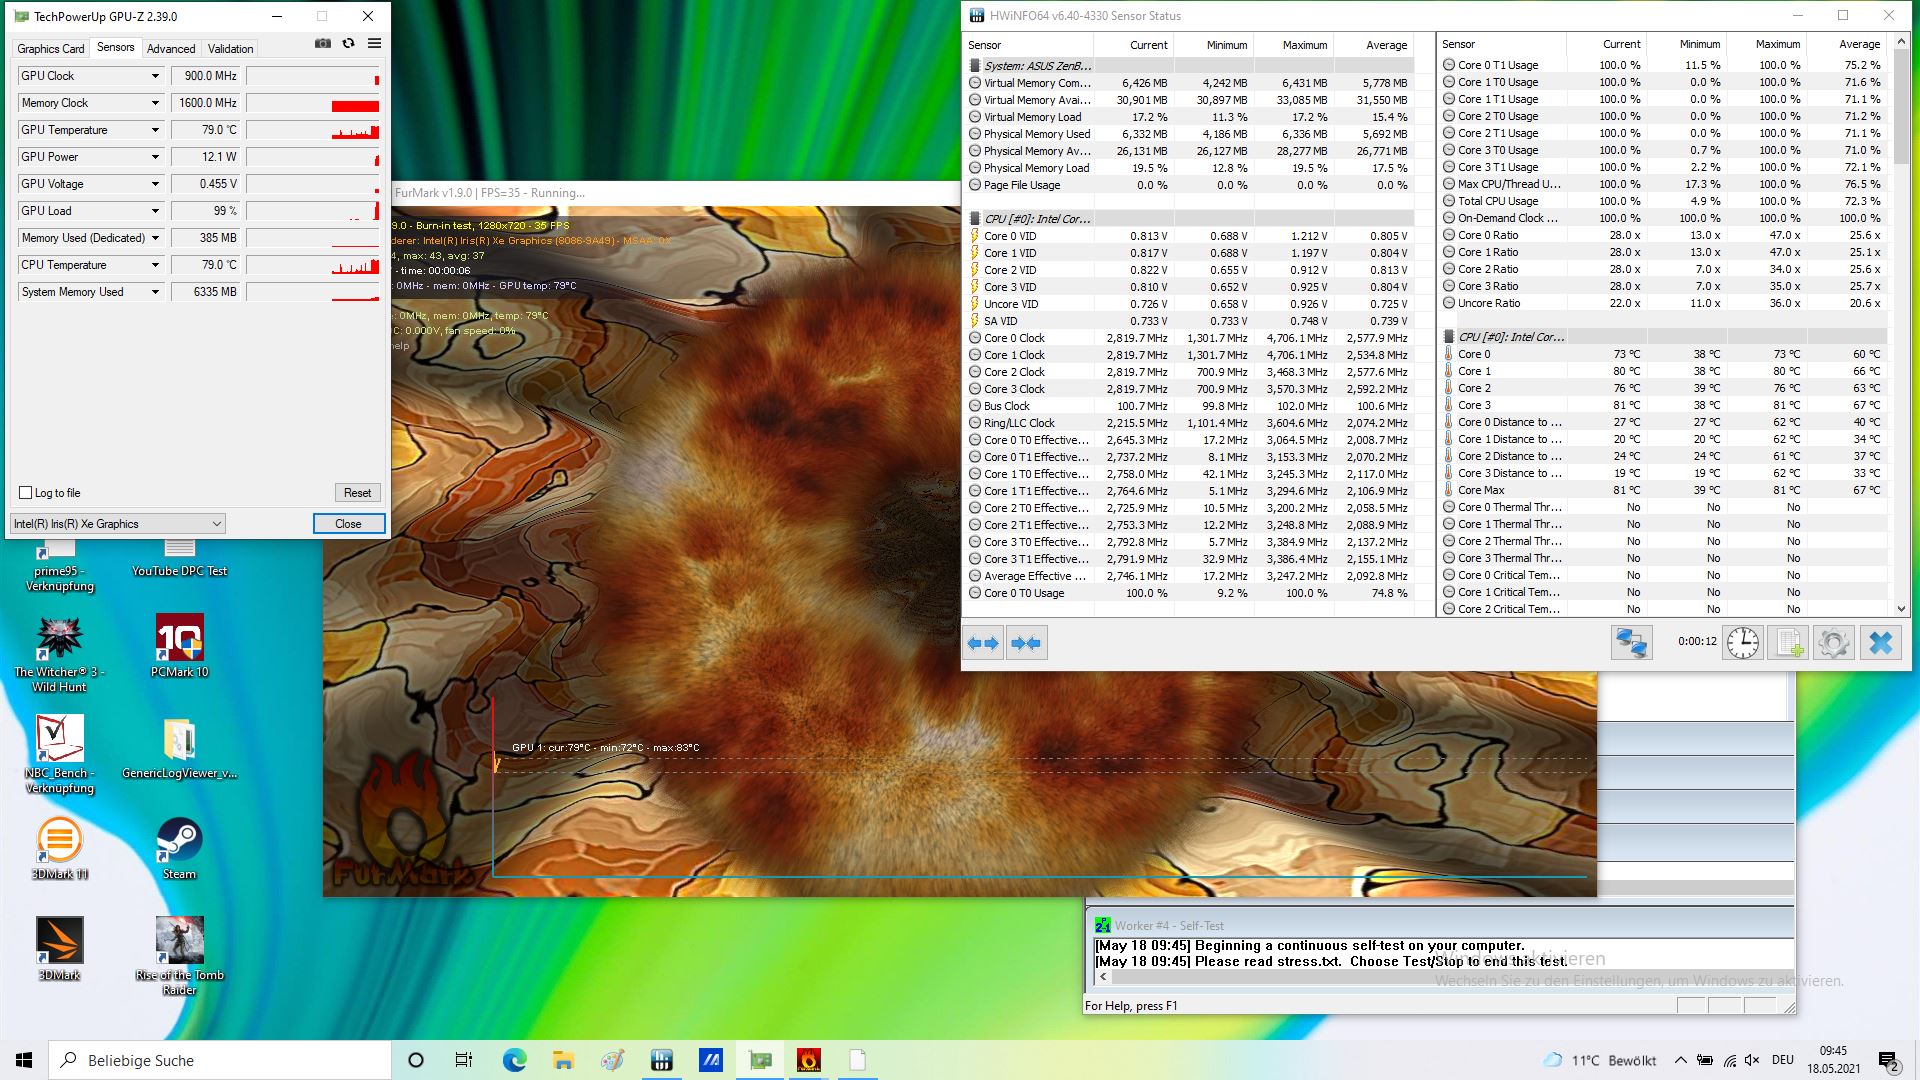
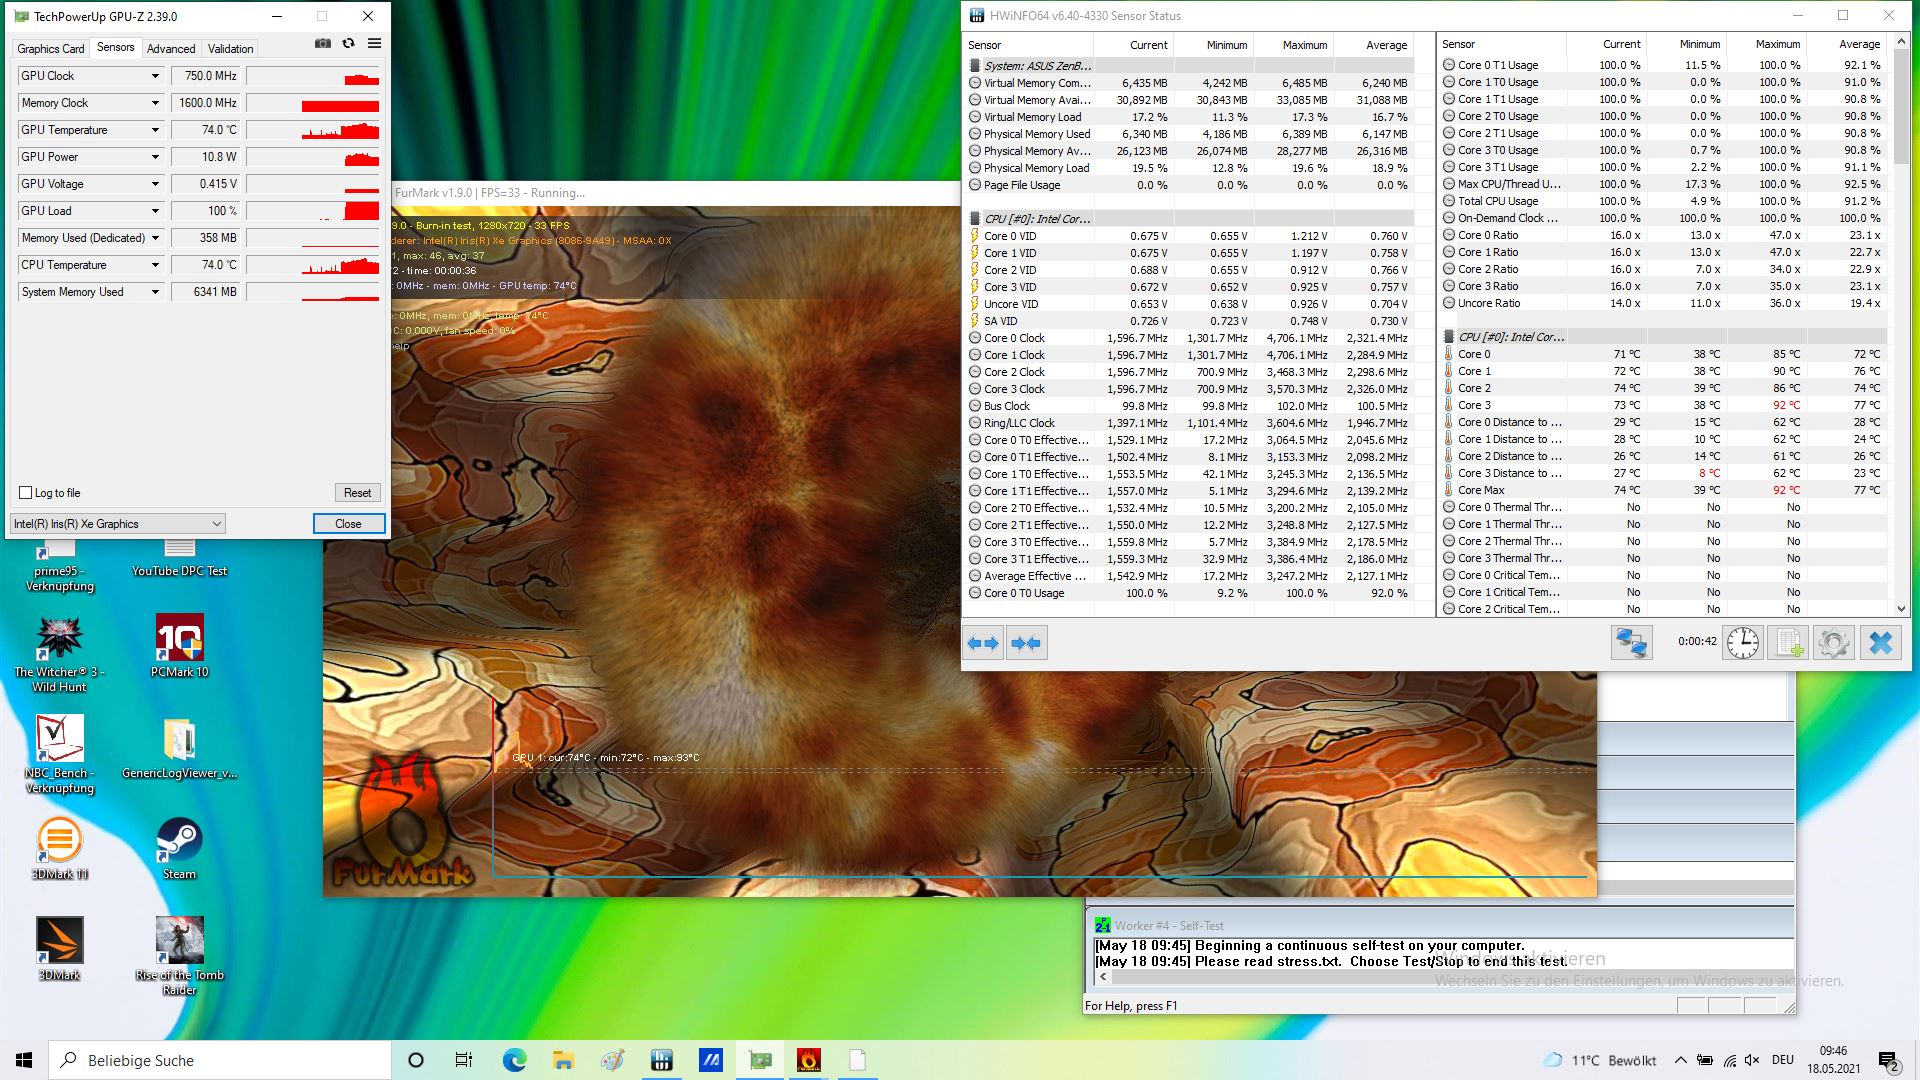
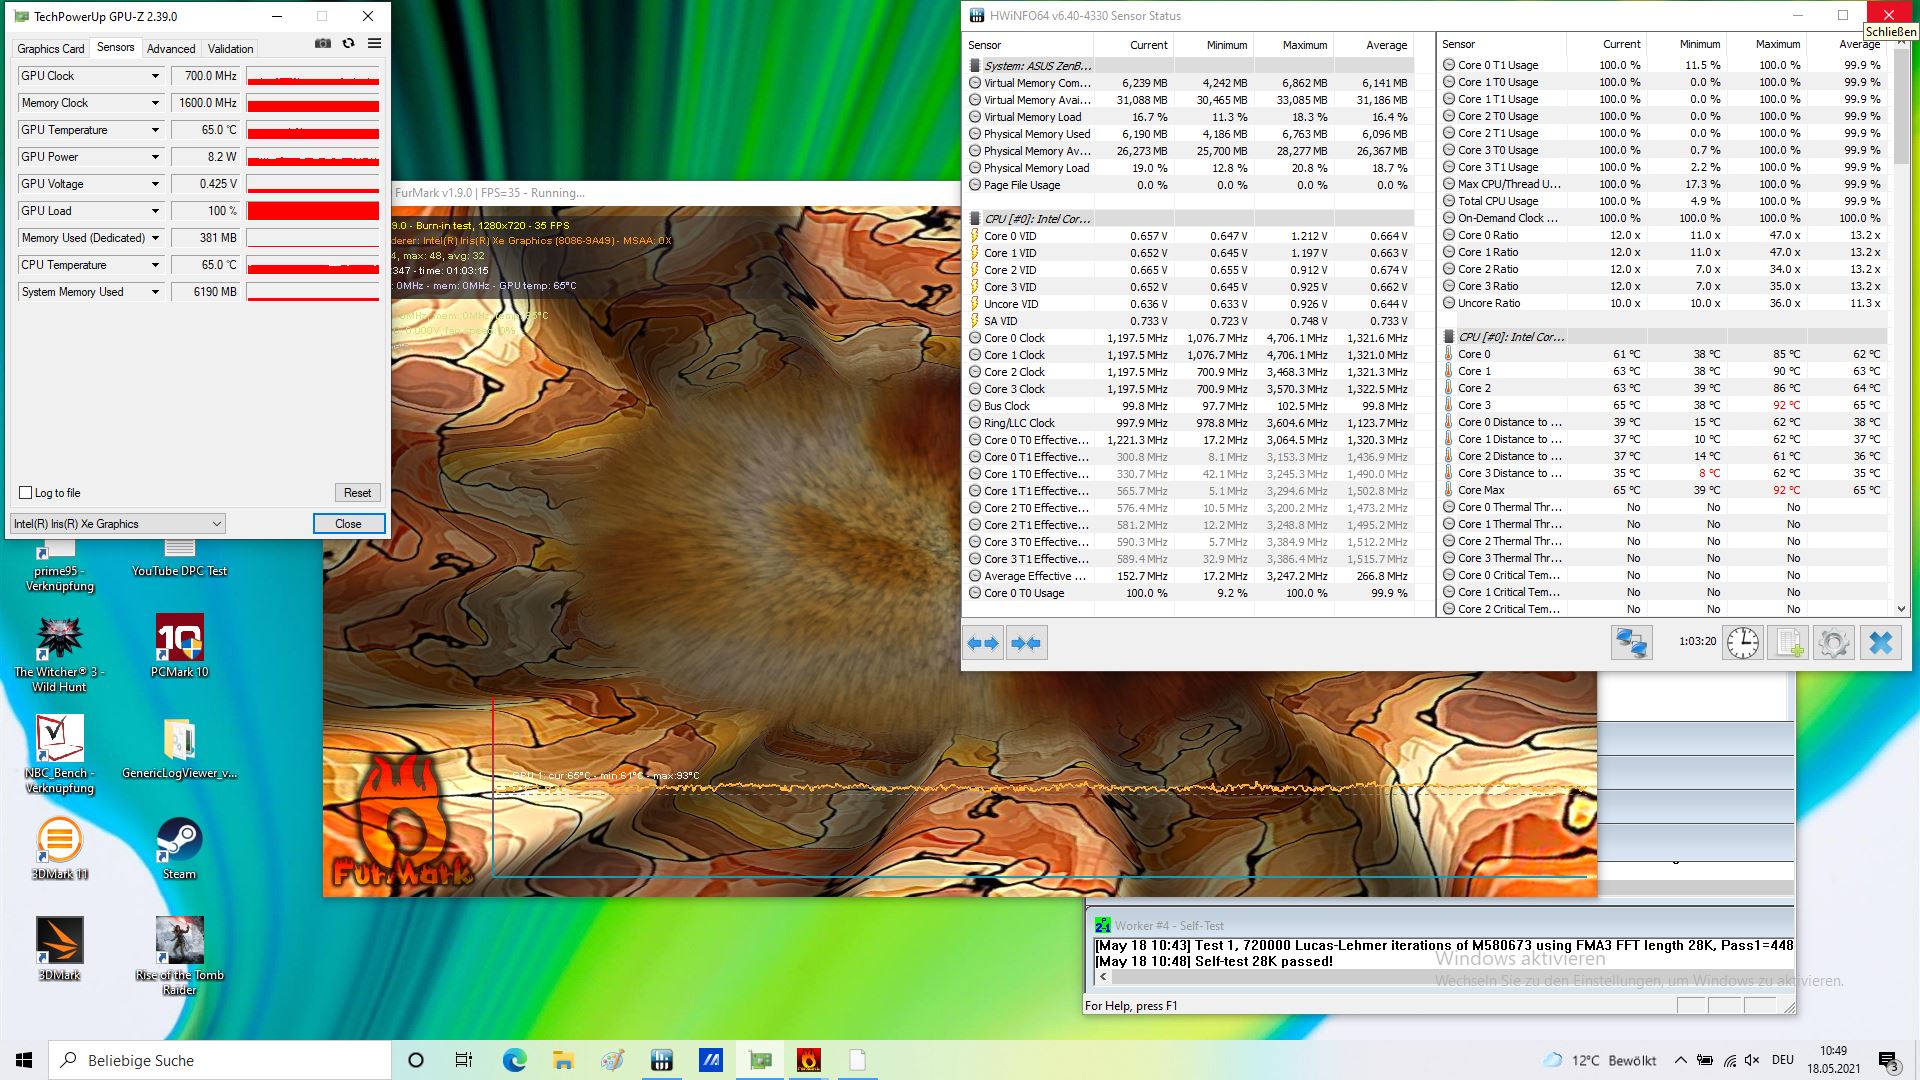
In the stress test using Prime95 and FurMark, the cores briefly reach clock speeds of about 2.7 GHz and consequently fall below the base clock rate of 2.8 GHz right at the beginning. Afterwards, thermal throttling sets in quite early. As soon as a core temperature of only about 75 °C (~167 °F) is reached, the clock speed gradually decreases in the following seconds and minutes and finally stabilizes between 1.2 and 1.4 GHz and core temperatures of around 65 °C (~149 °F).
The GPU rates start between 900 and 950 MHz and later stabilize at clock speeds between 600 and 700 MHz. The memory clock rate remains constant at 1.6 GHz.
As a result, the AMD version makes the better impression under stress as well; its clock rates remain at a slightly higher level. In the case of the Intel ZenBook, performance is limited very early and very drastically in favor of a low core temperature.
A new 3DMark 11 run didn't reveal any performance losses caused by the previous stress.

Speakers
The stereo speakers are dominated by mids and highs that are balanced and reproduced with clarity. Bass is hardly to be expected due to the small form factor alone, and the speakers could be a bit louder overall.
The ZenBook doesn't have a native audio jack input, but Asus includes a USB-C to audio jack adapter.
Asus ZenBook 13 UX325EA audio analysis
(±) | speaker loudness is average but good (79.4 dB)
Bass 100 - 315 Hz
(-) | nearly no bass - on average 18.1% lower than median
(±) | linearity of bass is average (13.4% delta to prev. frequency)
Mids 400 - 2000 Hz
(+) | balanced mids - only 3.1% away from median
(+) | mids are linear (4.8% delta to prev. frequency)
Highs 2 - 16 kHz
(+) | balanced highs - only 4.1% away from median
(+) | highs are linear (5.9% delta to prev. frequency)
Overall 100 - 16.000 Hz
(+) | overall sound is linear (14.2% difference to median)
Compared to same class
» 22% of all tested devices in this class were better, 5% similar, 73% worse
» The best had a delta of 5%, average was 19%, worst was 53%
Compared to all devices tested
» 14% of all tested devices were better, 3% similar, 83% worse
» The best had a delta of 4%, average was 25%, worst was 134%
Apple MacBook 12 (Early 2016) 1.1 GHz audio analysis
(+) | speakers can play relatively loud (83.6 dB)
Bass 100 - 315 Hz
(±) | reduced bass - on average 11.3% lower than median
(±) | linearity of bass is average (14.2% delta to prev. frequency)
Mids 400 - 2000 Hz
(+) | balanced mids - only 2.4% away from median
(+) | mids are linear (5.5% delta to prev. frequency)
Highs 2 - 16 kHz
(+) | balanced highs - only 2% away from median
(+) | highs are linear (4.5% delta to prev. frequency)
Overall 100 - 16.000 Hz
(+) | overall sound is linear (10.2% difference to median)
Compared to same class
» 5% of all tested devices in this class were better, 2% similar, 93% worse
» The best had a delta of 5%, average was 19%, worst was 53%
Compared to all devices tested
» 3% of all tested devices were better, 1% similar, 96% worse
» The best had a delta of 4%, average was 25%, worst was 134%
Energy management - Energy-efficient Intel ZenBook
Energy consumption
Energy consumption has hardly changed compared to the predecessor. The new model consumes a bit more in idle usage but a bit less under average load levels in return, and consumption is identical under maximum load.
The AMD ZenBook consumes considerably more, but it's performance is correspondingly significantly better as well, at least when it comes to the CPU. However, the idle consumption in particular is higher than that of the Intel counterpart. The Yoga and the Spectre consume significantly more power under higher workloads, so the Intel ZenBook is comparatively efficient here, but it's not a performance monster, either.
The 65-watt USB-C power adapter has ample reserves with a maximum consumption of 36 watts. In addition, the power adapter is plugged directly into the power outlet, from where only one cable leads to the laptop instead of the usual two. This allows it to be a bit shorter than the combined power cord length of laptops that have proprietary charging ports.
The device still draws 0.35 watts from the power outlet when turned off and 0.7 watts in standby.
| Off / Standby | |
| Idle | |
| Load |
|
| Asus ZenBook 13 UX325EA i7-1165G7, Iris Xe G7 96EUs, SK Hynix HFM001TD3JX013N, OLED, 1920x1080, 13.30 | Asus ZenBook 13 UX325JA i7-1065G7, Iris Plus Graphics G7 (Ice Lake 64 EU), Intel SSD 660p 1TB SSDPEKNW010T8, IPS, 1920x1080, 13.30 | Asus ZenBook 13 UM325S R7 5800U, Vega 8, SK Hynix HFM001TD3JX013N, OLED, 1920x1080, 13.30 | Lenovo Yoga Slim 7i Carbon 13 ITL i7-1165G7, Iris Xe G7 96EUs, Samsung SSD PM981a MZVLB512HBJQ, a-SI IPS LED, 2560x1600, 13.30 | HP Spectre x360 14t-ea000 i7-1165G7, Iris Xe G7 96EUs, Samsung SSD PM981a MZVLB512HBJQ, IPS, 1920x1280, 13.50 | Average Intel Iris Xe Graphics G7 96EUs | Average of class Subnotebook | |
|---|---|---|---|---|---|---|---|
| Power Consumption | 5% | -47% | -33% | -6% | -51% | -48% | |
| Idle Minimum * | 3.6 | 2.4 33% | 7.4 -106% | 4.3 -19% | 3 17% | 5.3 ? -47% | 4.86 ? -35% |
| Idle Average * | 6.3 | 4.6 27% | 10.4 -65% | 7.1 -13% | 5.1 19% | 8.49 ? -35% | 8.31 ? -32% |
| Idle Maximum * | 7.6 | 9 -18% | 11.1 -46% | 9.8 -29% | 6.4 16% | 10.7 ? -41% | 10.4 ? -37% |
| Load Average * | 31 | 36 -16% | 35.7 -15% | 41.8 -35% | 39.6 -28% | 45 ? -45% | 46.3 ? -49% |
| Load Maximum * | 36 | 36 -0% | 37.2 -3% | 60.9 -69% | 56.2 -56% | 67 ? -86% | 66.7 ? -85% |
| Witcher 3 ultra * | 27 | 41 | 39.6 |
* ... smaller is better
Battery life
The battery size remains unchanged from the predecessor at 67 Wh. We use the fan's standard mode instead of the performance mode for the battery tests.
Compared to its class, over 10 hours of browsing the web on Wi-Fi or watching videos is okay. The AMD version and the HP Spectre last similarly long, while the Lenovo Yoga lasts less due to its slightly smaller battery. However, the predecessor lasted noticeably longer. Since the "old" ZenBook 13 has the same battery size and consumes a similar amount (see above), this is a bit surprising. You can probably get even longer runtimes by using the fan's energy-saving mode found in the MyAsus software.
| Asus ZenBook 13 UX325EA i7-1165G7, Iris Xe G7 96EUs, 67 Wh | Asus ZenBook 13 UX325JA i7-1065G7, Iris Plus Graphics G7 (Ice Lake 64 EU), 67 Wh | Asus ZenBook 13 UM325S R7 5800U, Vega 8, 67 Wh | Lenovo Yoga Slim 7i Carbon 13 ITL i7-1165G7, Iris Xe G7 96EUs, 50 Wh | HP Spectre x360 14t-ea000 i7-1165G7, Iris Xe G7 96EUs, 66 Wh | Apple MacBook Air Late 2020 (M1, 8 Core GPU, 8 GB RAM) M1, M1 8-Core GPU, 49.9 Wh | Average of class Subnotebook | |
|---|---|---|---|---|---|---|---|
| Battery Runtime | 31% | 4% | -25% | -5% | 46% | -3% | |
| H.264 | 614 | 992 62% | 592 -4% | 559 -9% | 794 ? 29% | ||
| WiFi v1.3 | 640 | 827 29% | 551 -14% | 480 -25% | 707 10% | 933 46% | 629 ? -2% |
| Witcher 3 ultra | 190 | ||||||
| Load | 182 | 184 1% | 234 29% | 106 -42% | 145 -20% | 115.4 ? -37% | |
| Reader / Idle | 1597 | 1394 | 2185 | 1252 ? |
Pros
Cons
Verdict - AMD or Intel?


There is no clear recommendation for the Intel or the AMD version, as both have their advantages and disadvantages. The AMD processor really has a significantly higher CPU performance and also operates a bit more quietly under load. In return, the Intel SoC offers a bit more graphics performance and is more energy-efficient, especially in idle usage. And finally, AMD still doesn't offer Thunderbolt. Moreover, we were surprised by the poor brightness distribution of the OLED display in our test unit, since this wasn't an issue in the review of the AMD version.
Otherwise, both versions share many plus points such as the color-accurate display, the low weight and the compact design, and the good input devices with the optional number pad in the touchpad. The weak hinges and the non-expandable RAM deserve criticism. In addition, the Intel CPU is heavily throttled under load, but it runs quite cool and smooth as a result, but it's also louder than the AMD ZenBook.
The Asus ZenBook 13 is a great laptop both in the Intel and AMD versions, where the positive aspects outweigh the negative ones. The Intel version remains cooler, is a bit more energy-efficient, and offers Thunderbolt 4 as well as a slightly higher graphics performance. In return, the AMD model is unbeatably ahead in terms of CPU performance and is still a bit quieter under load.
Price and availability
Luckily, the Intel model's availability is better than that of the AMD counterpart. For example, you can find the ZenBook 13 with the Intel Core i7-1165G7, 16 GB of RAM, and a 512 GB SSD on Amazon for $1,097.
Asus ZenBook 13 UX325EA
-
08/31/2022 v7
Christian Hintze
More articles related to this device
Asus ZenBook 13 UX325EA (ZenBook 13 Series)Related Articles

Pricecompare

