

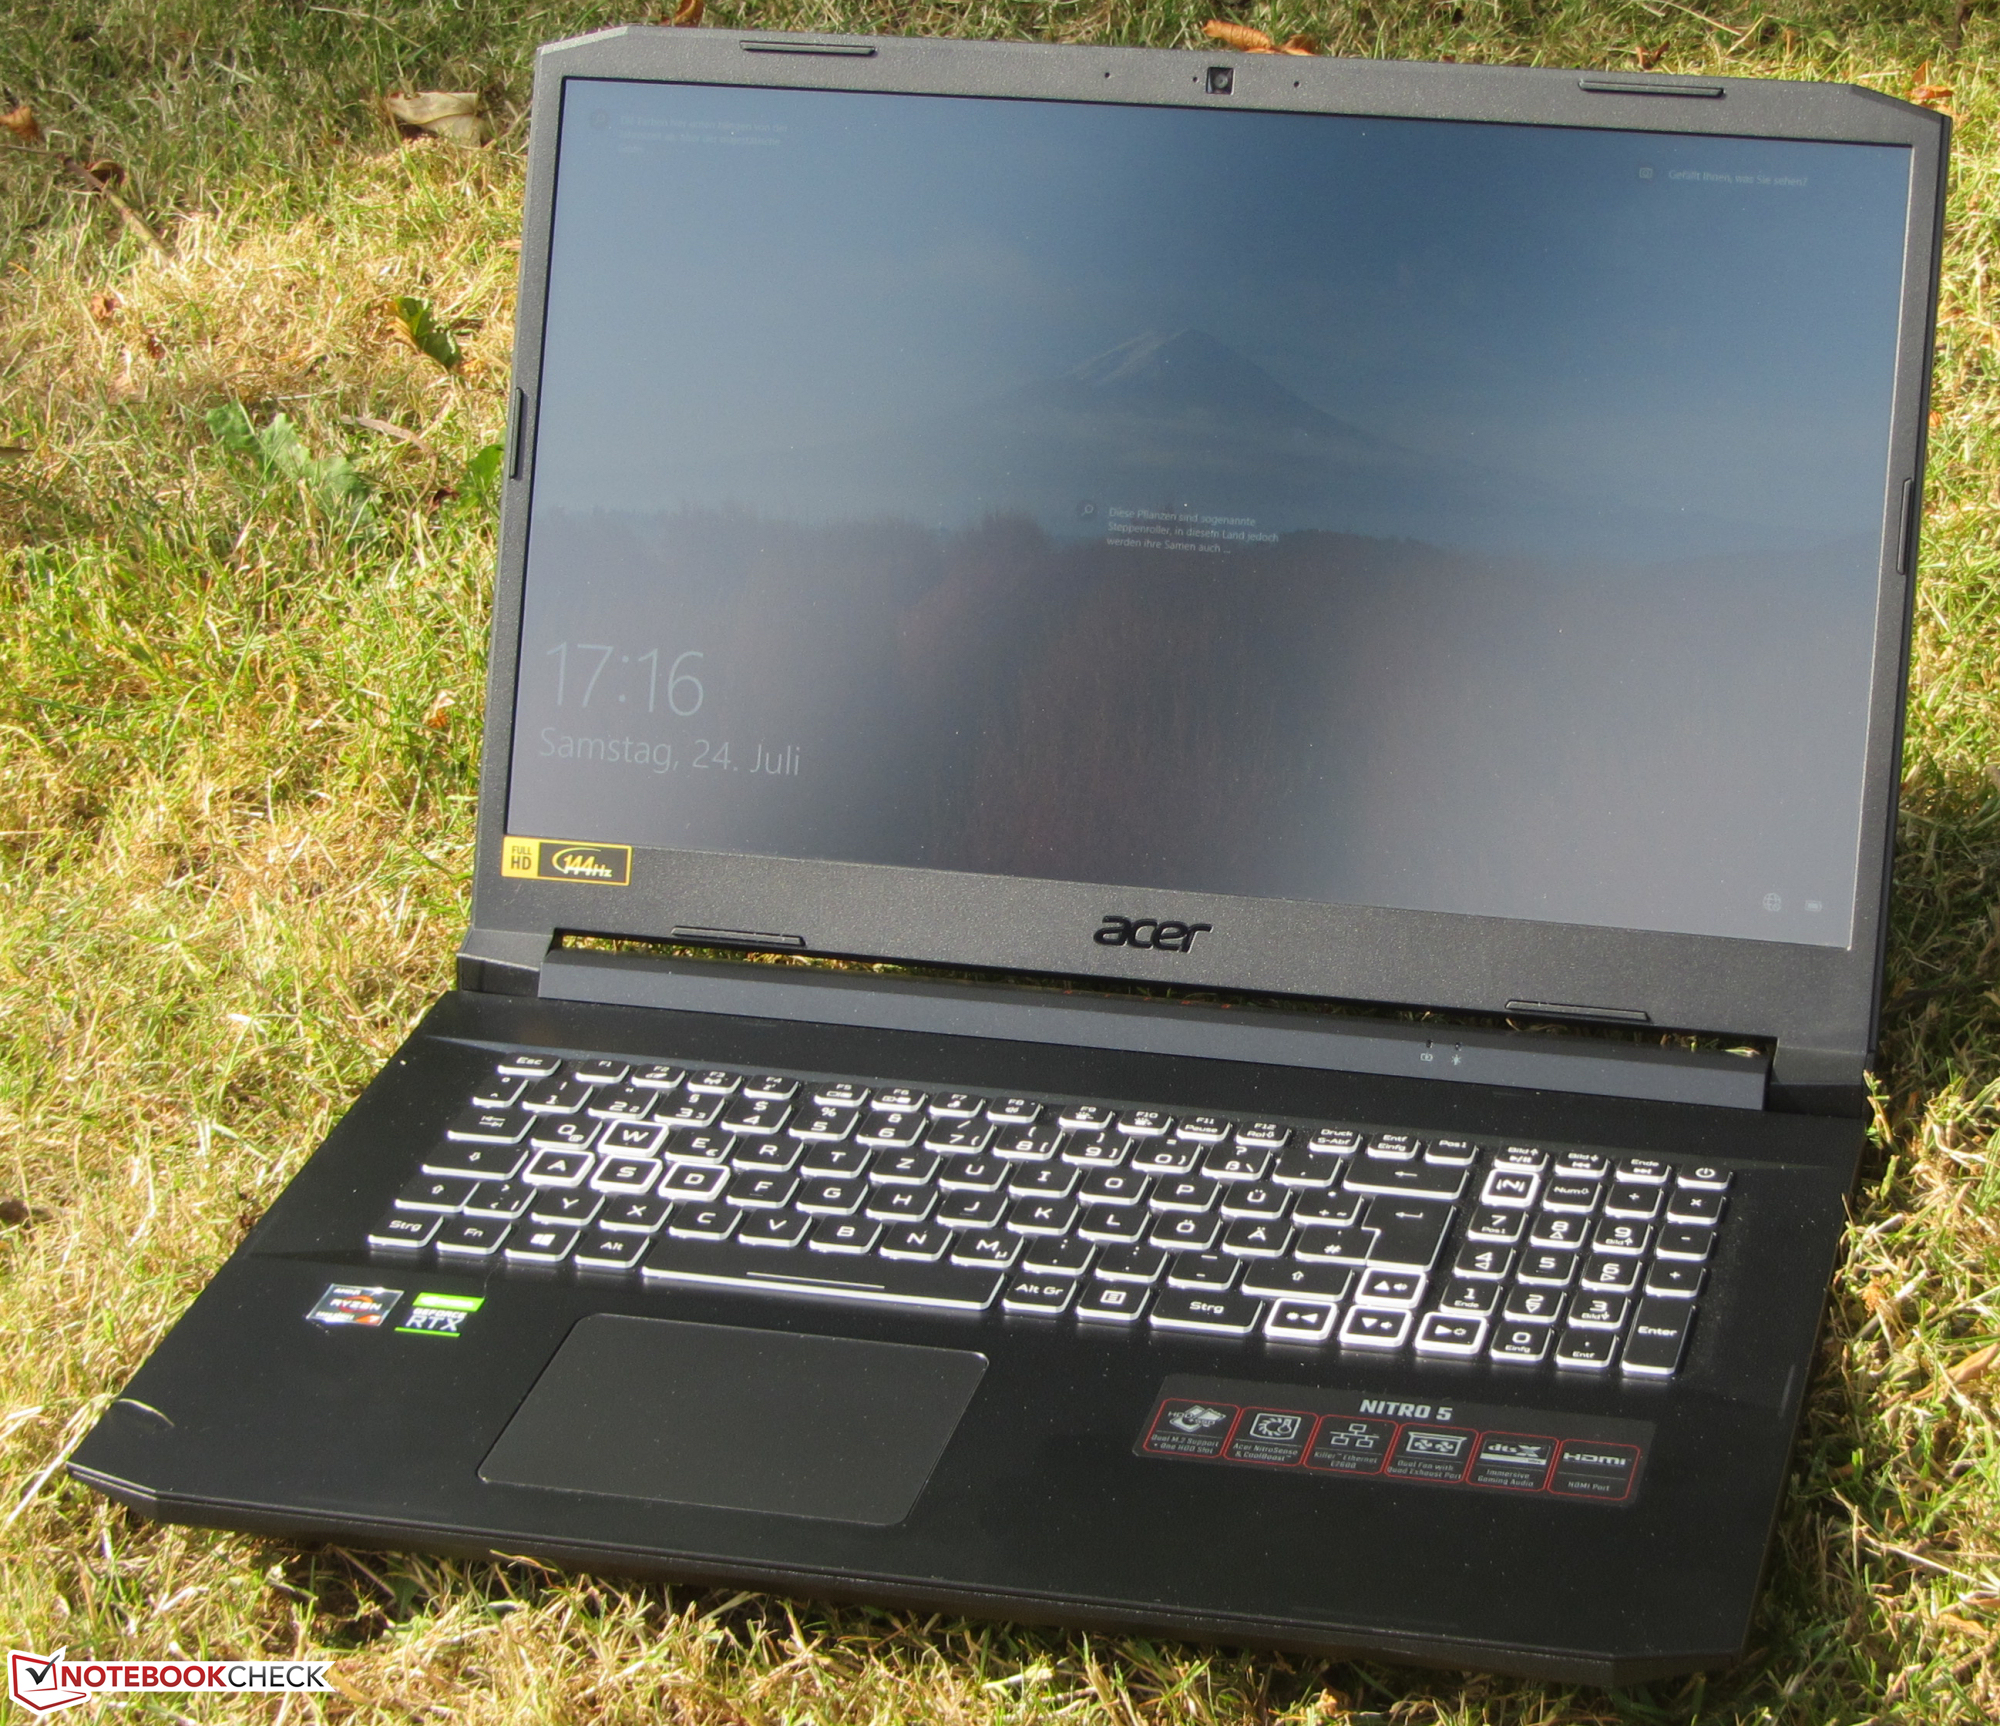
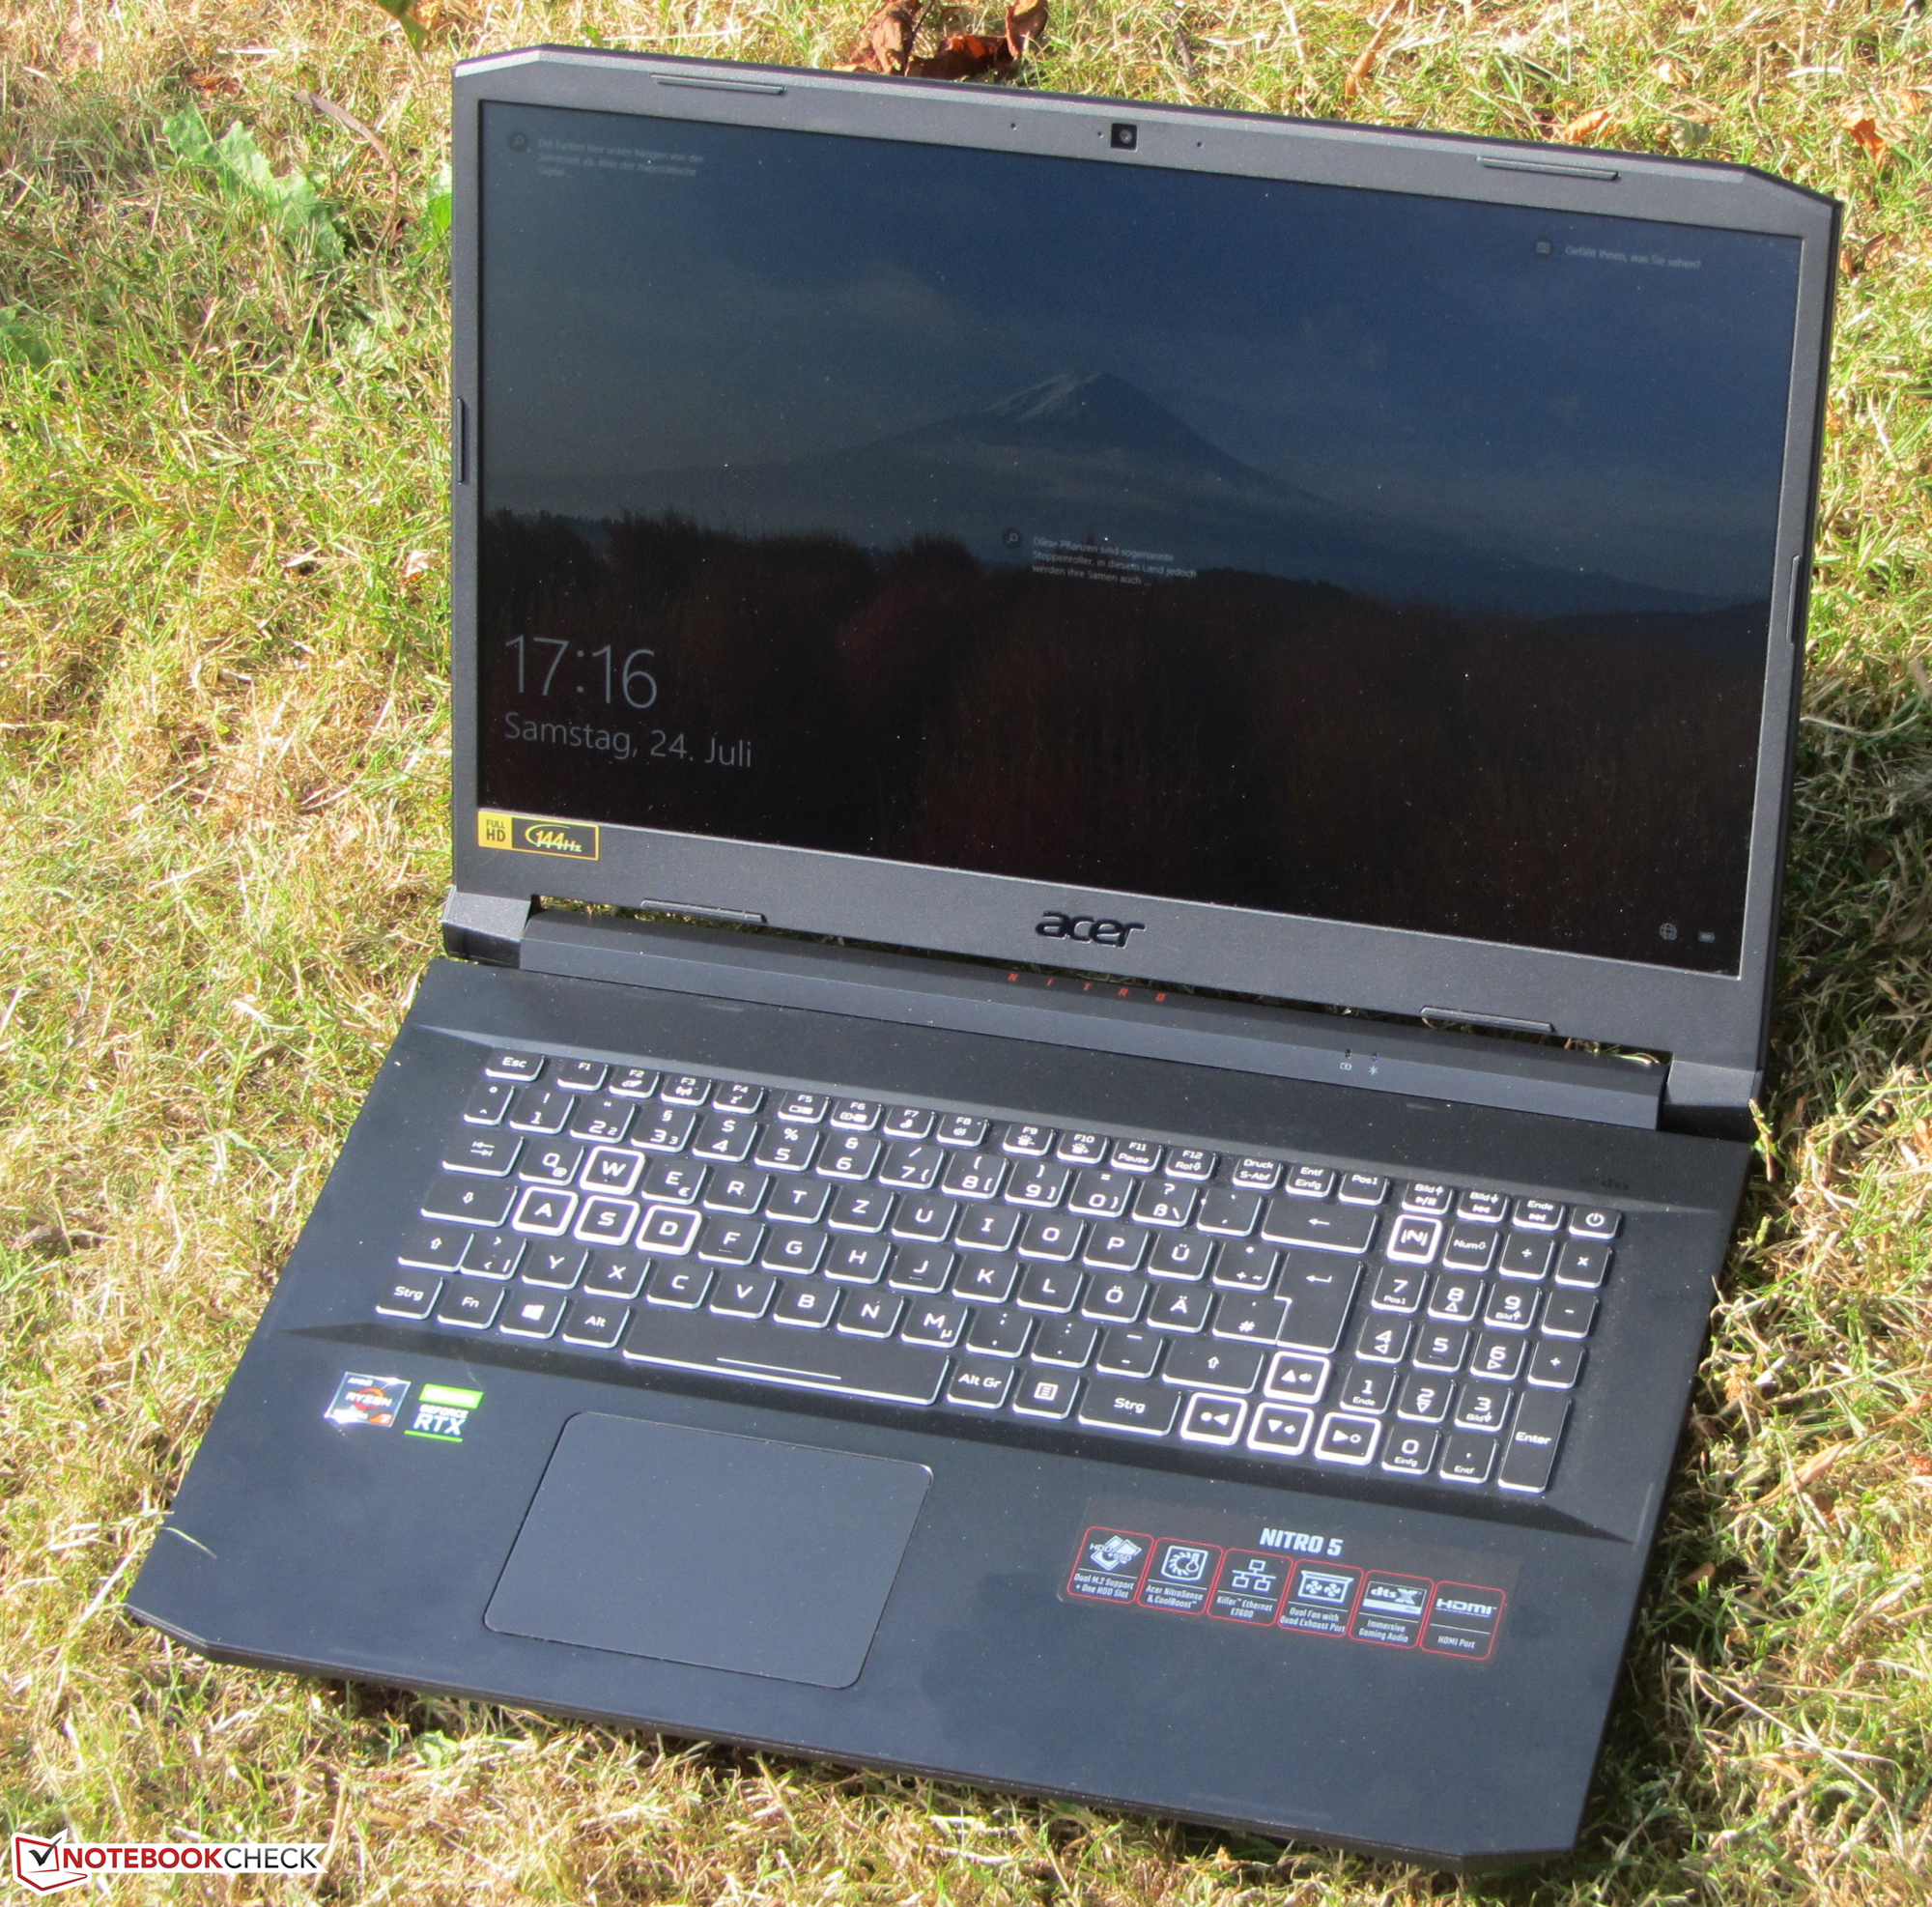
Acer Nitro 5 AN517-41 in review: RTX 3080 can only develop to a limited extent

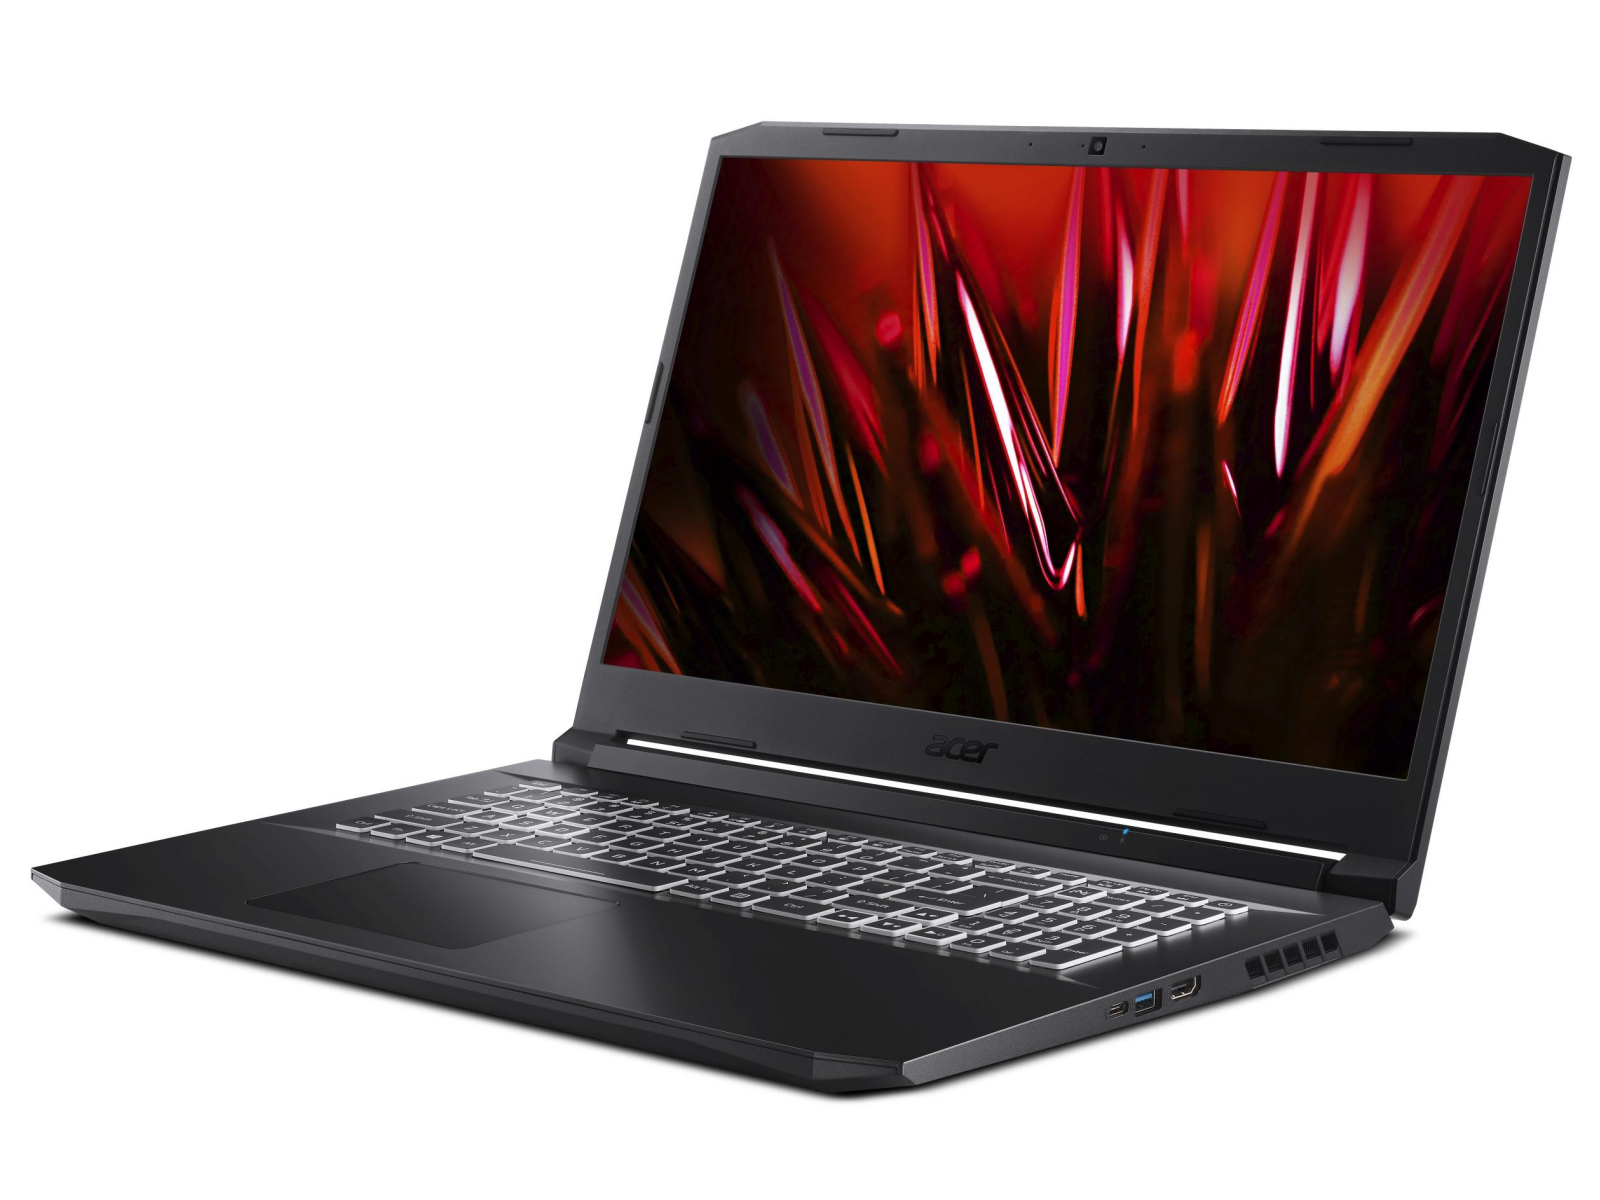
Acer's 17.3-inch gaming notebook is powered by a Ryzen 7-5800H APU and a GeForce RTX-3080 Laptop GPU. The configuration variant we have is available for just under 2,000 Euros (~$2359). The competitors include devices like the Medion Erazer Beast X25, the MSI GP76 Leopard 10UG and the Schenker XMG Neo 17.
Since we have already tested a sister model with the same construction, we will not go into the case, the equipment, the input devices, the speakers and the screen in this review. The corresponding information can be found in the Review of the RTX-3070 Nitro 5.
Possible competitors in comparison
Rating | Date | Model | Weight | Height | Size | Resolution | Price |
|---|---|---|---|---|---|---|---|
| 82 % v7 (old) | 08 / 2021 | Acer Nitro 5 AN517-41-R9S5 R7 5800H, GeForce RTX 3080 Laptop GPU | 2.7 kg | 24.9 mm | 17.30" | 1920x1080 | |
| 85.1 % v7 (old) | 03 / 2021 | MSI GP76 Leopard 10UG i7-10750H, GeForce RTX 3070 Laptop GPU | 2.9 kg | 26 mm | 17.30" | 1920x1080 | |
| 85.1 % v7 (old) | 01 / 2021 | SCHENKER XMG Neo 17 (Early 2021, RTX 3070, 5800H) R7 5800H, GeForce RTX 3070 Laptop GPU | 2.5 kg | 27 mm | 17.30" | 2560x1440 | |
| 85 % v7 (old) | 07 / 2021 | Medion Erazer Beast X25 R9 5900HX, GeForce RTX 3080 Laptop GPU | 2.3 kg | 23 mm | 17.30" | 1920x1080 |
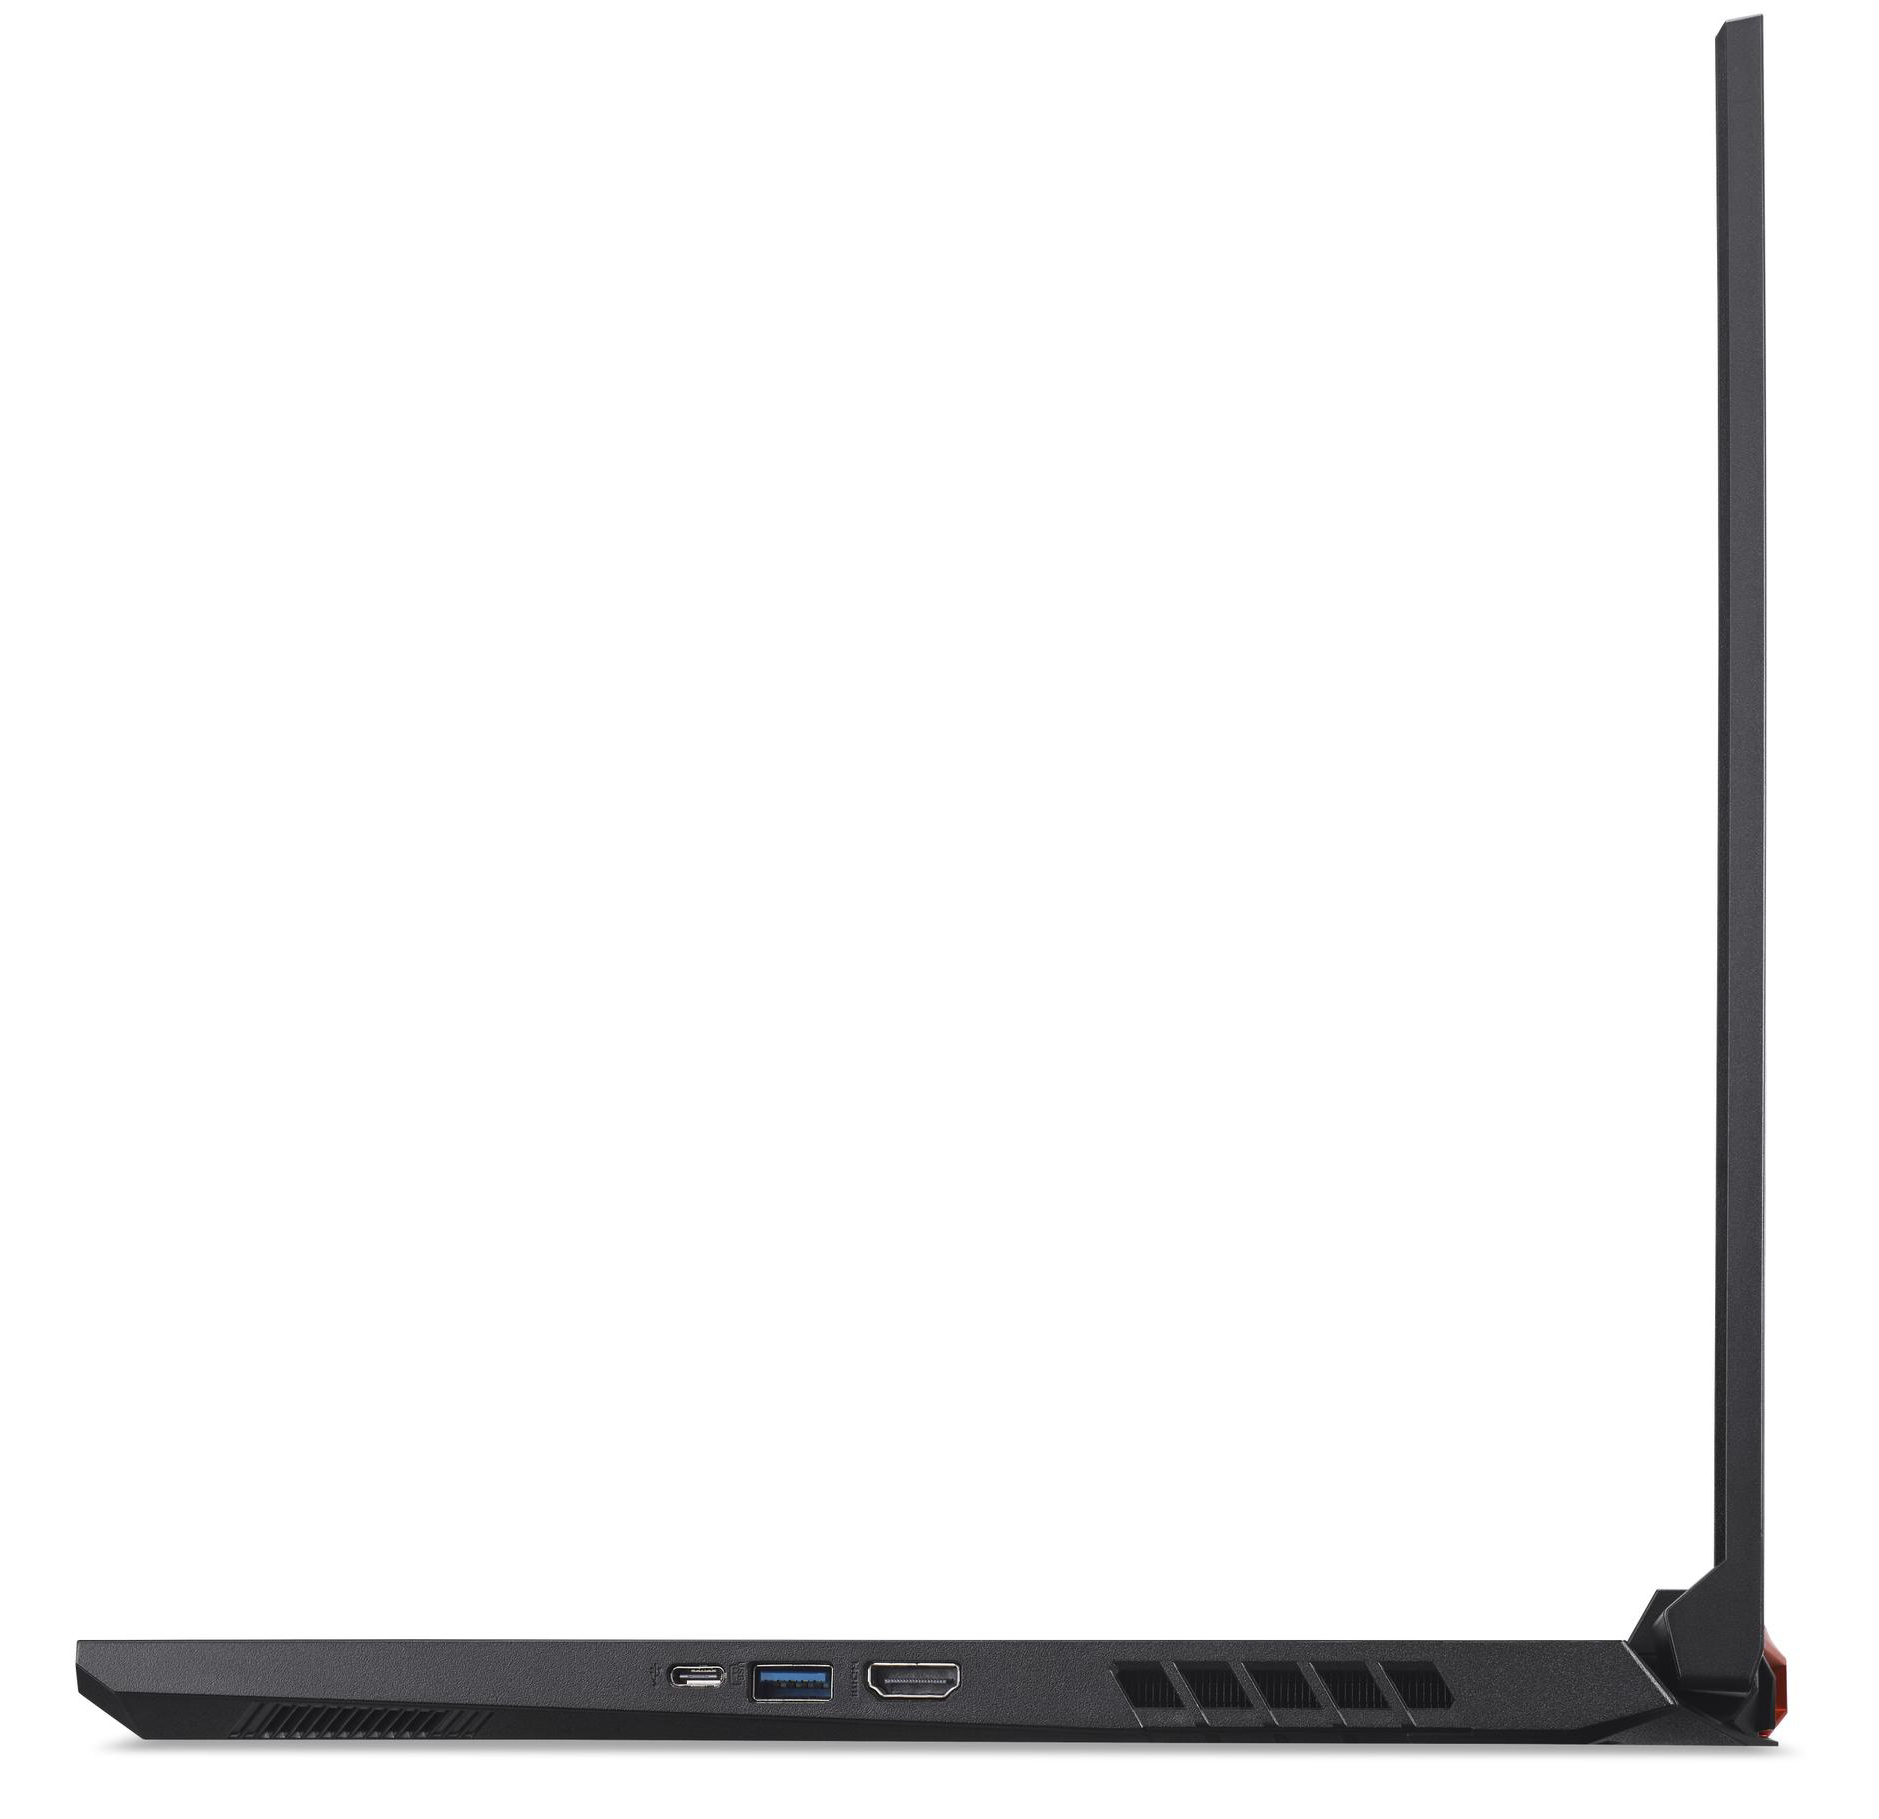
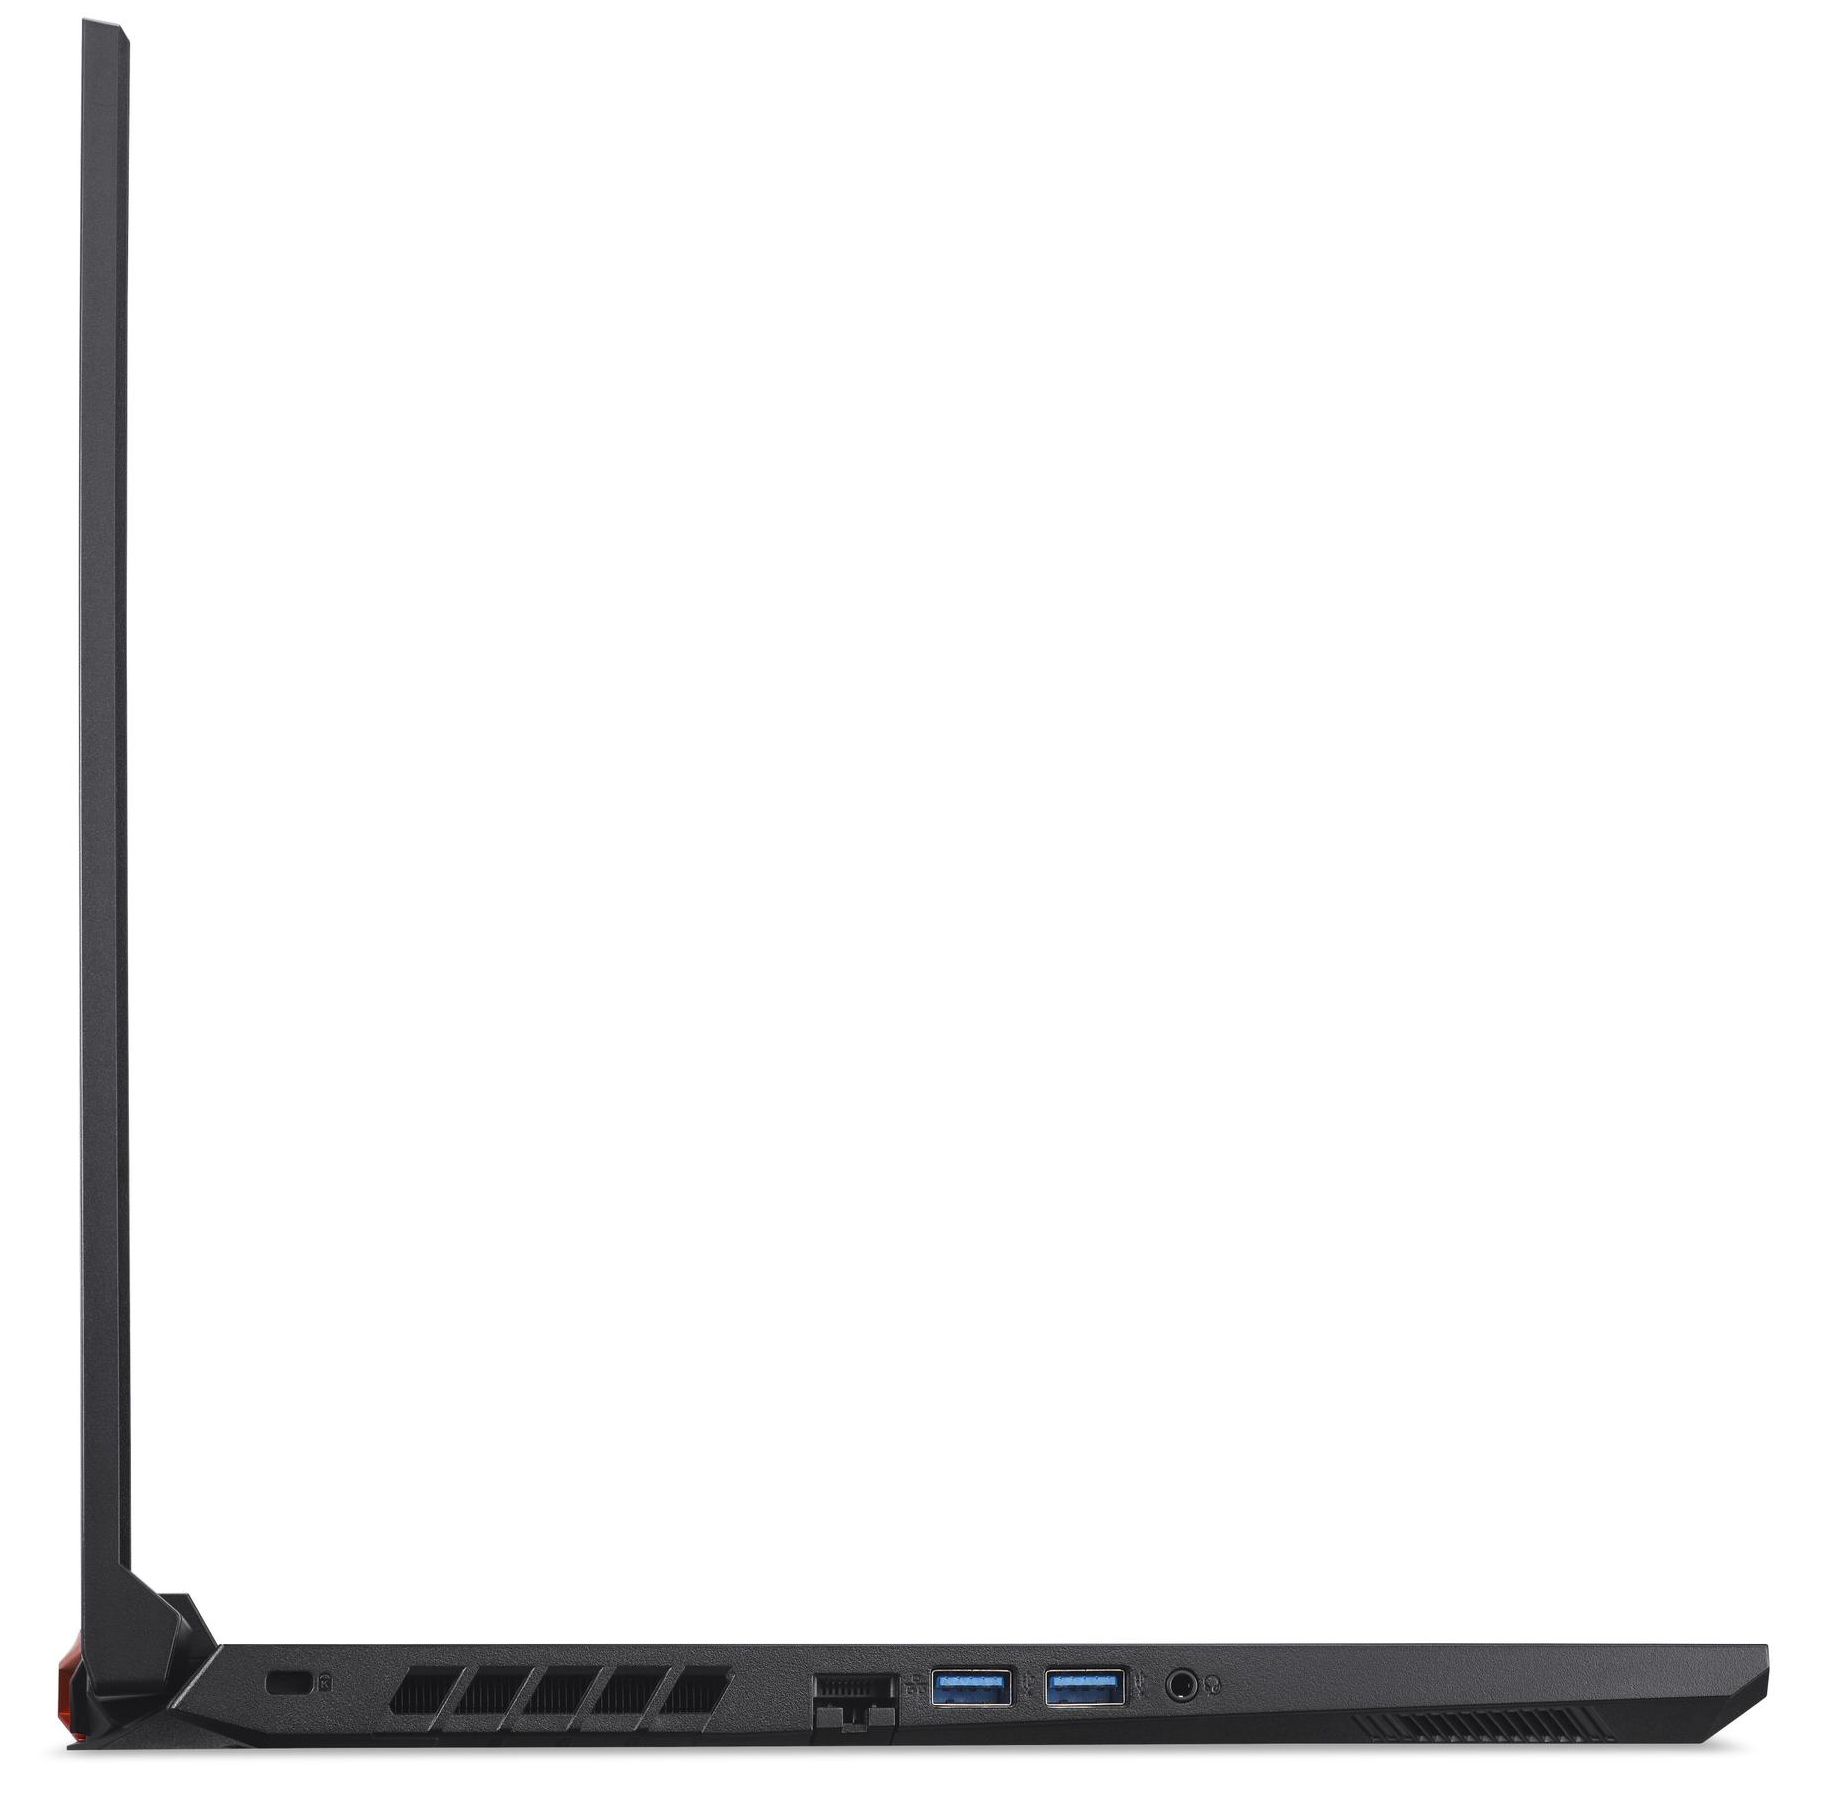
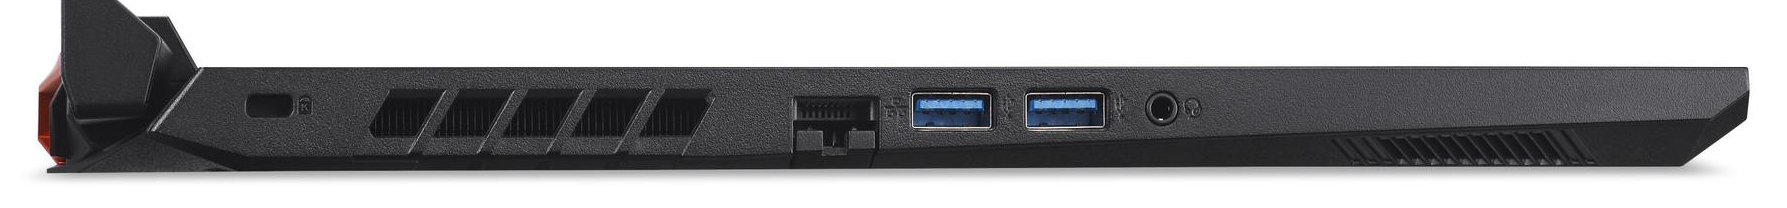
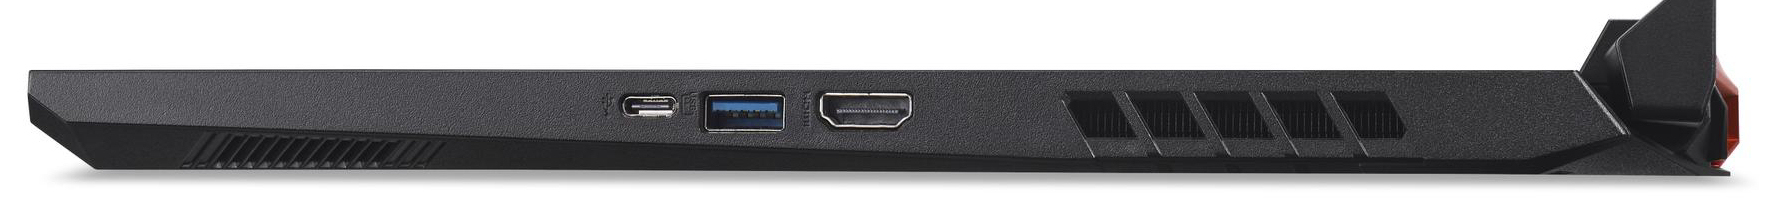
Connection equipment


 GeForce RTX 3070 Laptop GPU, R7 5800H, Samsung SSD 970 EVO Plus 500GB")
 GeForce RTX 3070 Laptop GPU, R7 5800H, Samsung SSD 970 EVO Plus 500GB")


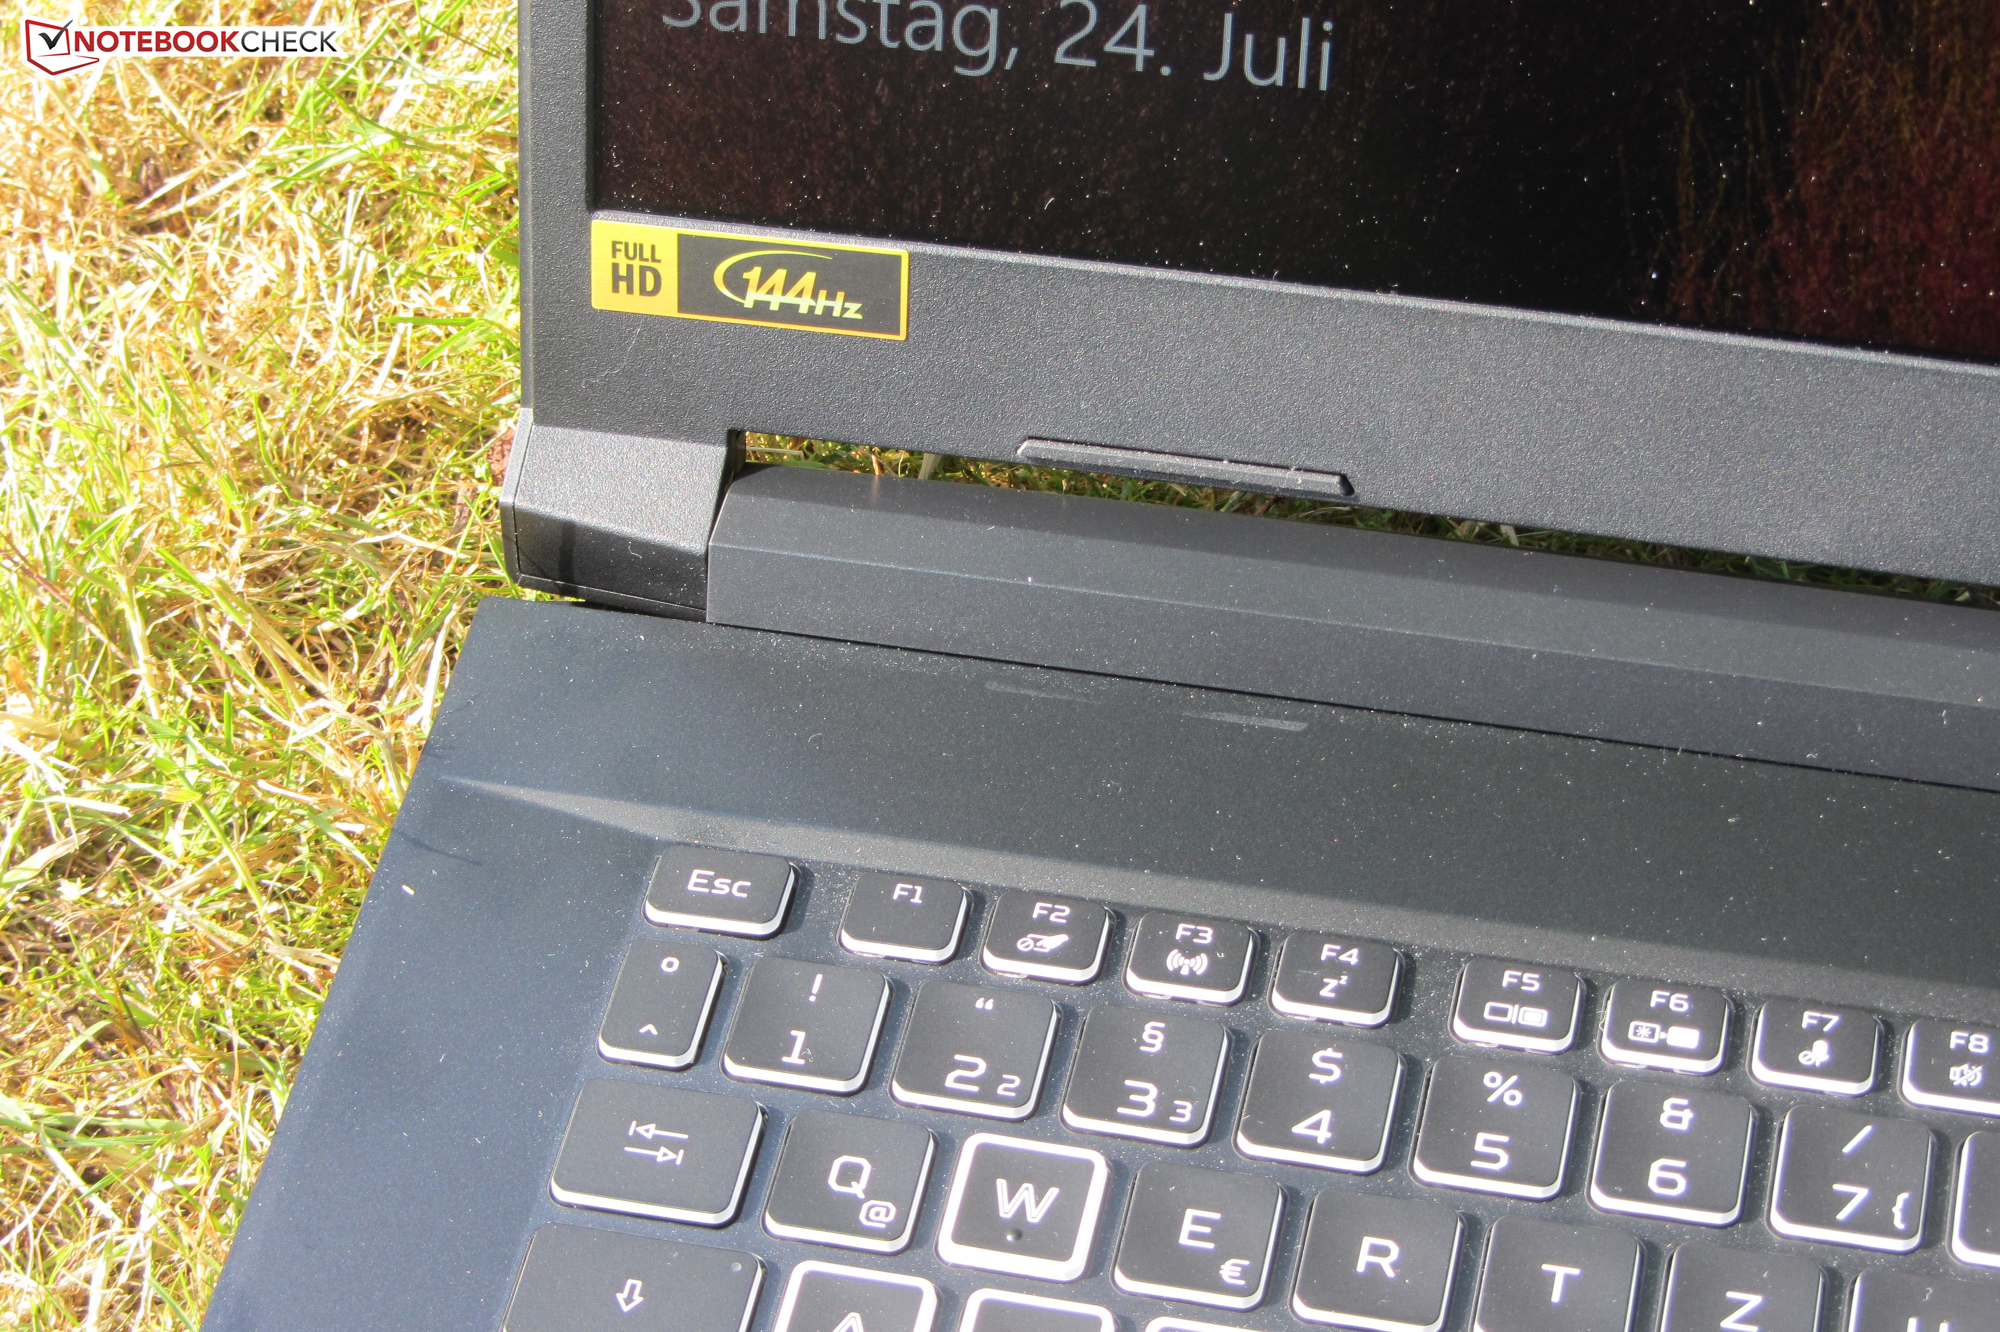
Display - 144 Hz IPS
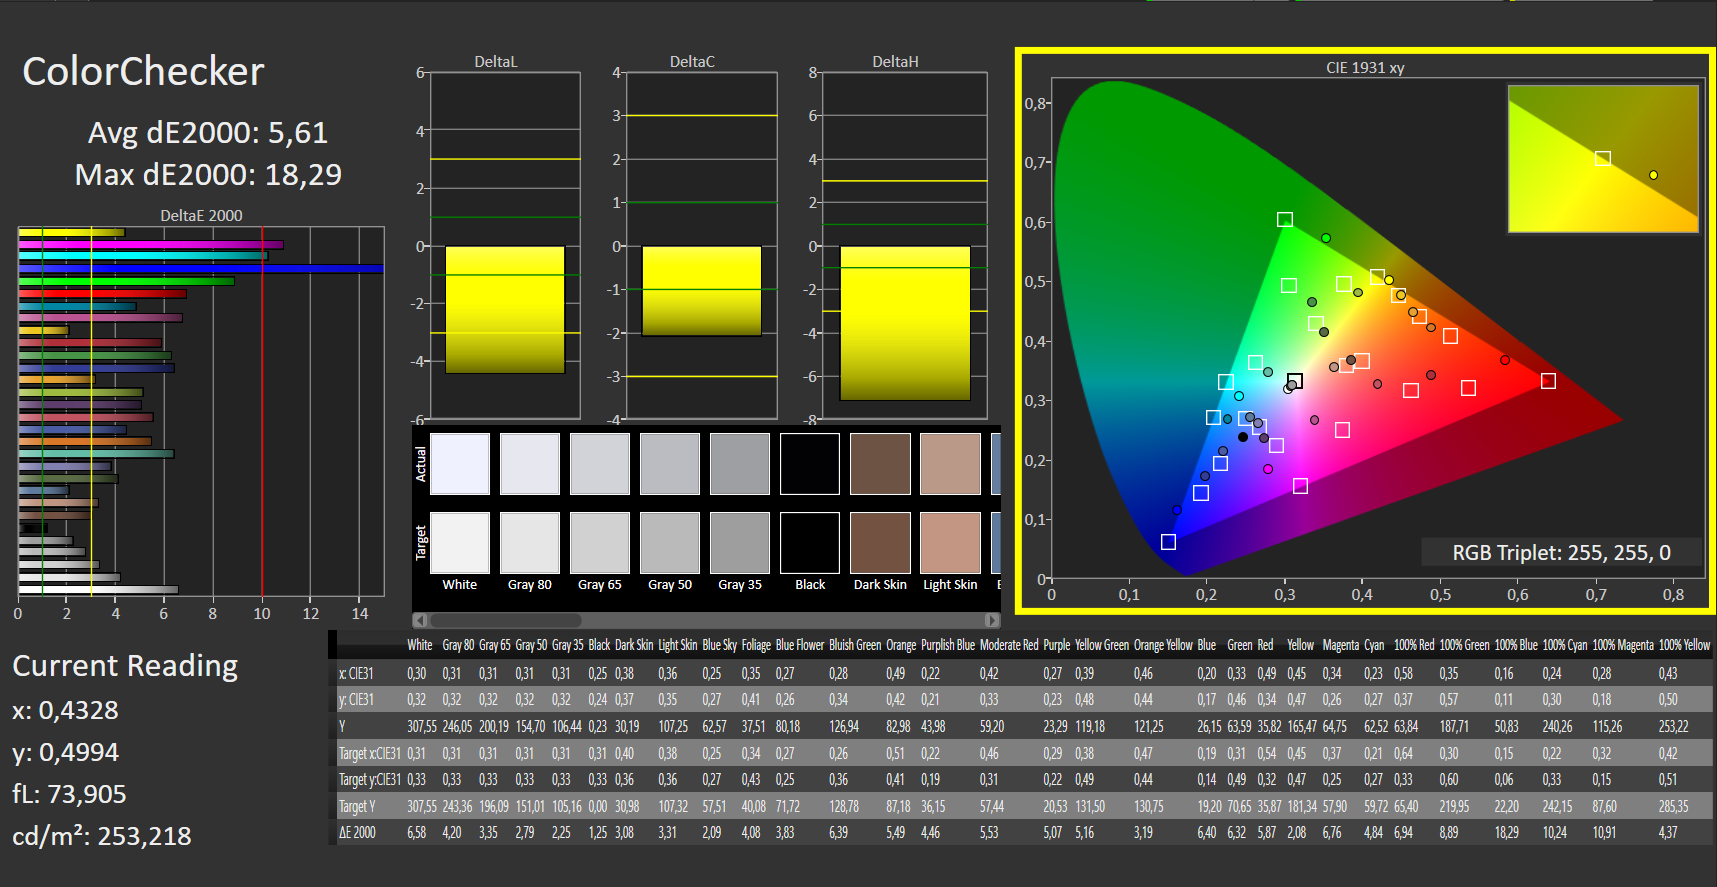
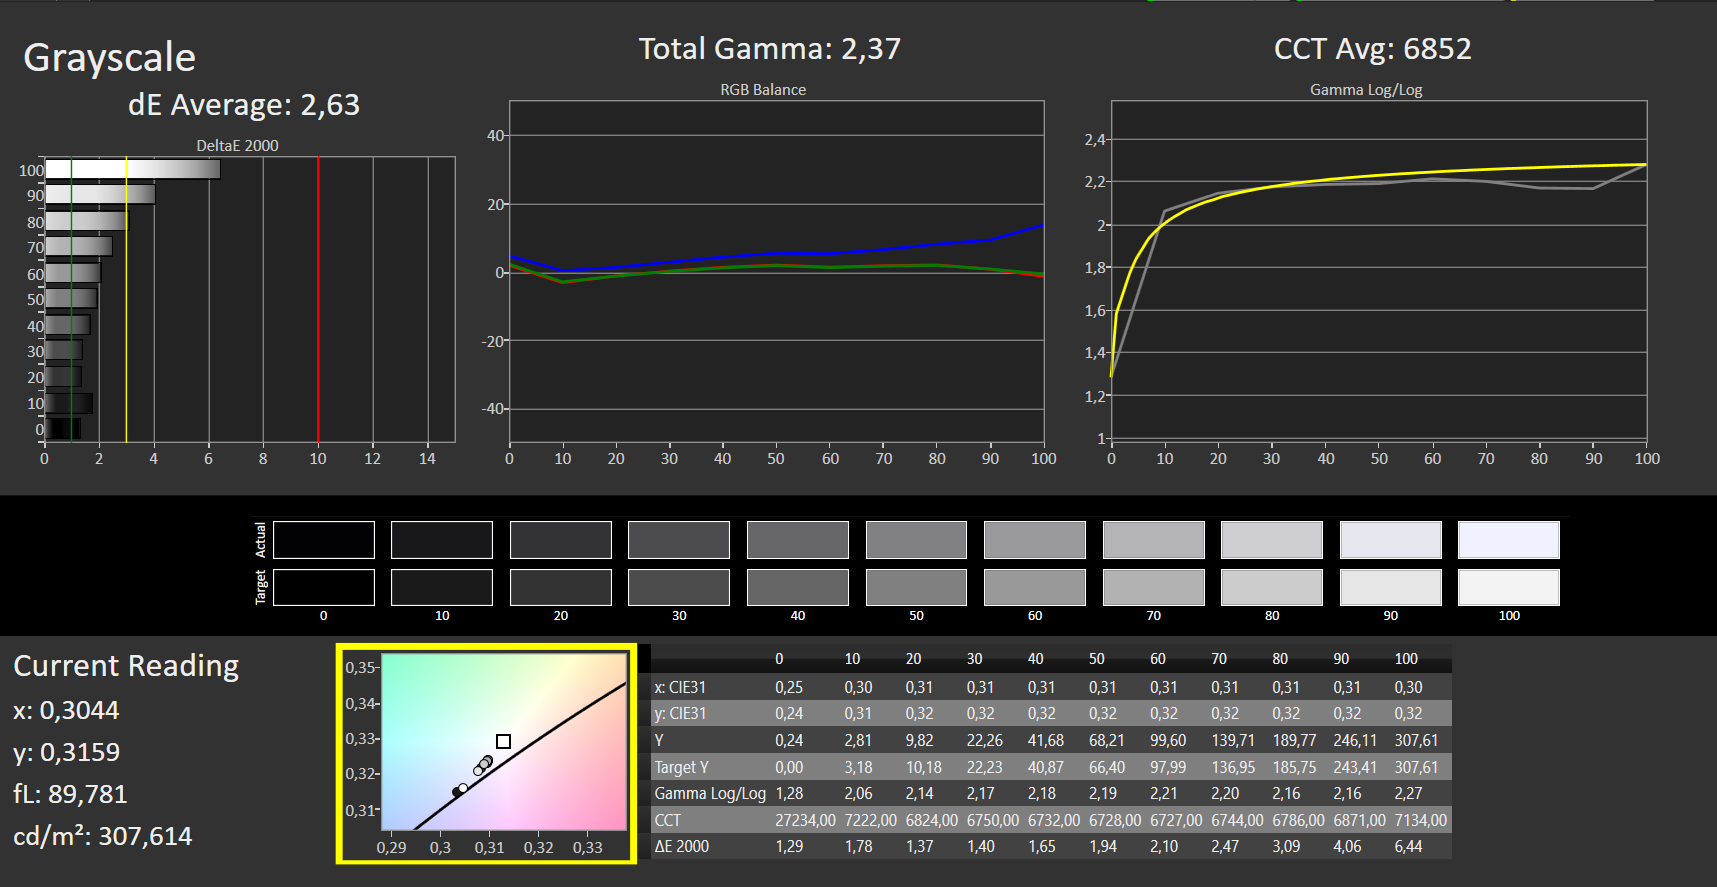
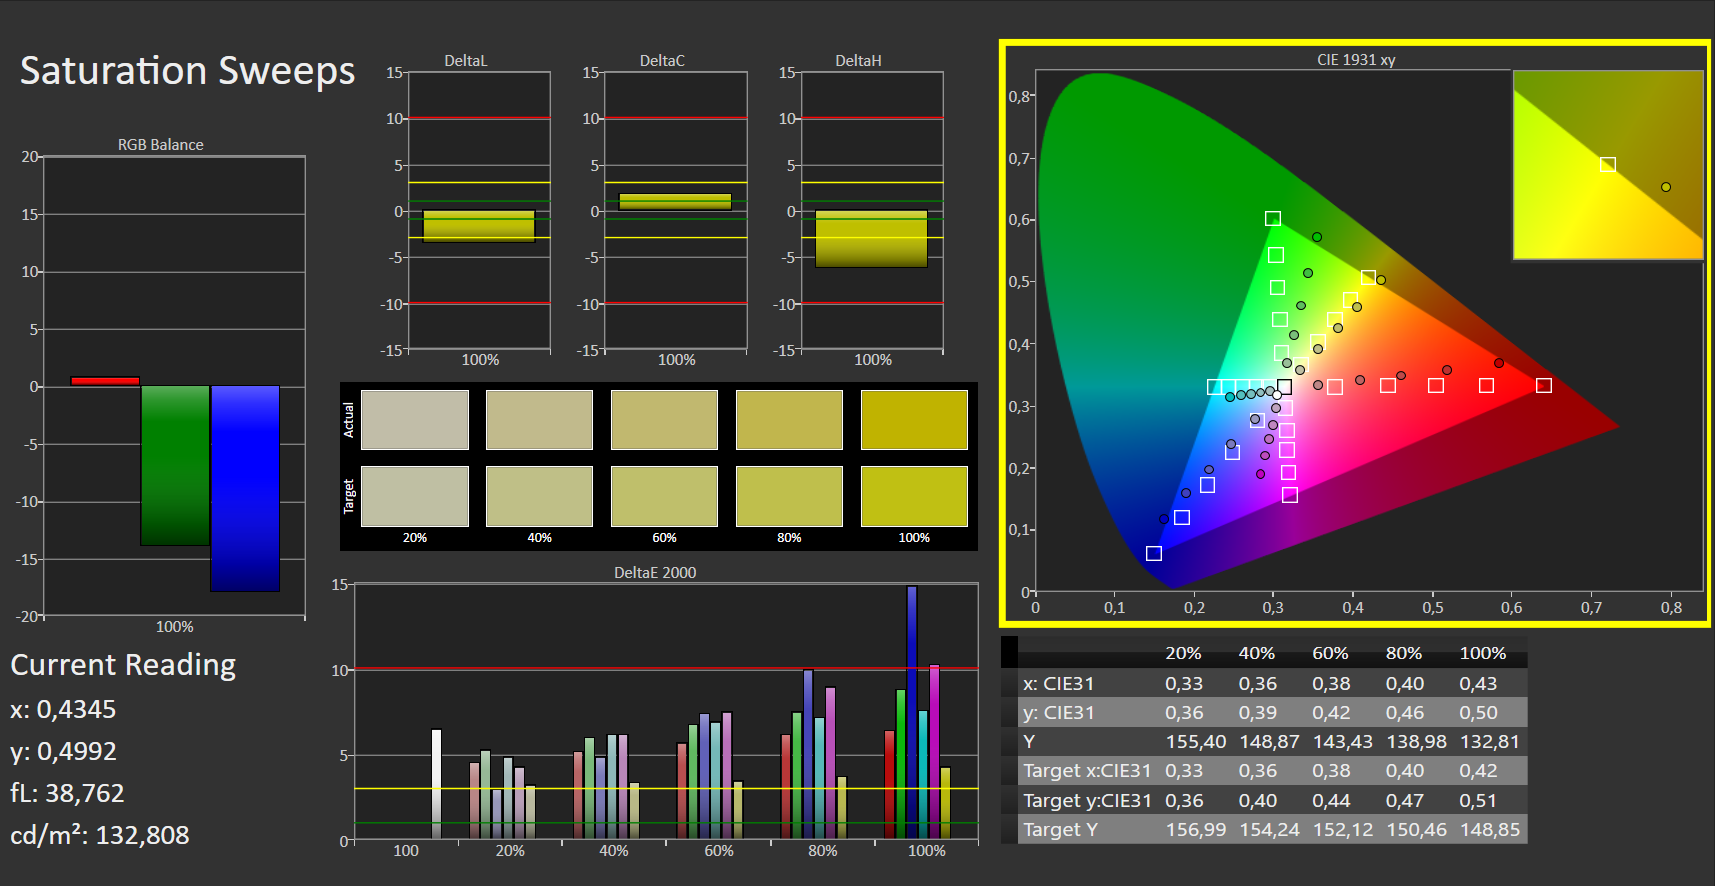
While the contrast (1,279:1) of the viewing-angle stable, responsive 17.3-inch screen (FHD, IPS, 144 Hz) meets the target (> 1,000:1), the average brightness (263.9 cd/m²) is too low. We consider values beyond 300 cd/m² to be good. The color reproduction in the state of delivery is decent.
This is the same panel that is also used in the RTX-3070 sister model. Nevertheless, the measured values differ slightly - a normal condition. Two identical screens never match completely.
| |||||||||||||||||||||||||
Brightness Distribution: 76 %
Center on Battery: 307 cd/m²
Contrast: 1279:1 (Black: 0.24 cd/m²)
ΔE ColorChecker Calman: 5.61 | ∀{0.5-29.43 Ø4.81}
ΔE Greyscale Calman: 2.63 | ∀{0.09-98 Ø5.1}
55% sRGB (Argyll 1.6.3 3D)
35% AdobeRGB 1998 (Argyll 1.6.3 3D)
37.9% AdobeRGB 1998 (Argyll 3D)
55.3% sRGB (Argyll 3D)
36.7% Display P3 (Argyll 3D)
Gamma: 2.37
CCT: 6852 K
| Acer Nitro 5 AN517-41-R9S5 BOE NV173FHM-NX4, IPS, 1920x1080, 17.3" | Acer Nitro 5 AN517-41-R5Z7 BOE NV173FHM-NX4, IPS, 1920x1080, 17.3" | MSI GP76 Leopard 10UG Chi Mei CMN176E, IPS, 1920x1080, 17.3" | SCHENKER XMG Neo 17 (Early 2021, RTX 3070, 5800H) BOE NE173QHM-NY2 (BOE0977), IPS, 2560x1440, 17.3" | Medion Erazer Beast X25 BOE NE173FHM-NZ1 (BOE0884), IPS, 1920x1080, 17.3" | |
|---|---|---|---|---|---|
| Display | 0% | 76% | 87% | 87% | |
| Display P3 Coverage (%) | 36.7 | 36.7 0% | 64.7 76% | 70.5 92% | 70.4 92% |
| sRGB Coverage (%) | 55.3 | 55.3 0% | 96.4 74% | 99.5 80% | 99.8 80% |
| AdobeRGB 1998 Coverage (%) | 37.9 | 37.9 0% | 66.9 77% | 71.8 89% | 71.6 89% |
| Response Times | 0% | 41% | 18% | 55% | |
| Response Time Grey 50% / Grey 80% * (ms) | 18 ? | 18 ? -0% | 7.4 ? 59% | 16.8 ? 7% | 9.2 ? 49% |
| Response Time Black / White * (ms) | 14 ? | 14 ? -0% | 10.8 ? 23% | 10 ? 29% | 5.6 ? 60% |
| PWM Frequency (Hz) | 24510 ? | ||||
| Screen | -9% | 29% | 31% | 10% | |
| Brightness middle (cd/m²) | 307 | 282 -8% | 328 7% | 410 34% | 329 7% |
| Brightness (cd/m²) | 264 | 255 -3% | 314 19% | 381 44% | 315 19% |
| Brightness Distribution (%) | 76 | 85 12% | 87 14% | 88 16% | 88 16% |
| Black Level * (cd/m²) | 0.24 | 0.24 -0% | 0.29 -21% | 0.37 -54% | 0.33 -38% |
| Contrast (:1) | 1279 | 1175 -8% | 1131 -12% | 1108 -13% | 997 -22% |
| Colorchecker dE 2000 * | 5.61 | 5.91 -5% | 1.93 66% | 2.55 55% | 2.03 64% |
| Colorchecker dE 2000 max. * | 18.29 | 10.98 40% | 4.94 73% | 4.33 76% | 5.5 70% |
| Greyscale dE 2000 * | 2.63 | 5.85 -122% | 2.8 -6% | 3.4 -29% | 3.5 -33% |
| Gamma | 2.37 93% | 2.32 95% | 2.18 101% | 2.275 97% | 2.223 99% |
| CCT | 6852 95% | 7372 88% | 7023 93% | 6637 98% | 6526 100% |
| Color Space (Percent of AdobeRGB 1998) (%) | 35 | 35 0% | 67 91% | 72 106% | |
| Color Space (Percent of sRGB) (%) | 55 | 55 0% | 89 62% | 95 73% | |
| Colorchecker dE 2000 calibrated * | 0.68 | 1.28 | 0.82 | ||
| Total Average (Program / Settings) | -3% /
-6% | 49% /
40% | 45% /
40% | 51% /
35% |
* ... smaller is better
Display Response Times
| ↔ Response Time Black to White | ||
|---|---|---|
| 14 ms ... rise ↗ and fall ↘ combined | ↗ 7 ms rise |  |
| ↘ 7 ms fall | ||
| The screen shows good response rates in our tests, but may be too slow for competitive gamers. In comparison, all tested devices range from 0.1 (minimum) to 240 (maximum) ms. » 33 % of all devices are better. This means that the measured response time is better than the average of all tested devices (20.4 ms). | ||
| ↔ Response Time 50% Grey to 80% Grey | ||
| 18 ms ... rise ↗ and fall ↘ combined | ↗ 8 ms rise |  |
| ↘ 10 ms fall | ||
| The screen shows good response rates in our tests, but may be too slow for competitive gamers. In comparison, all tested devices range from 0.165 (minimum) to 636 (maximum) ms. » 30 % of all devices are better. This means that the measured response time is better than the average of all tested devices (31.9 ms). | ||
Screen Flickering / PWM (Pulse-Width Modulation)
| Screen flickering / PWM not detected |  | ||
In comparison: 53 % of all tested devices do not use PWM to dim the display. If PWM was detected, an average of 8260 (minimum: 5 - maximum: 343500) Hz was measured. | |||
Performance - RTX-3080 with low TGP
With the Nitro 5 AN517-41, Acer has a 17.3-inch gaming notebook in its lineup that brings every current game smoothly to the screen and also cuts a good figure in all other application areas.
Test conditions
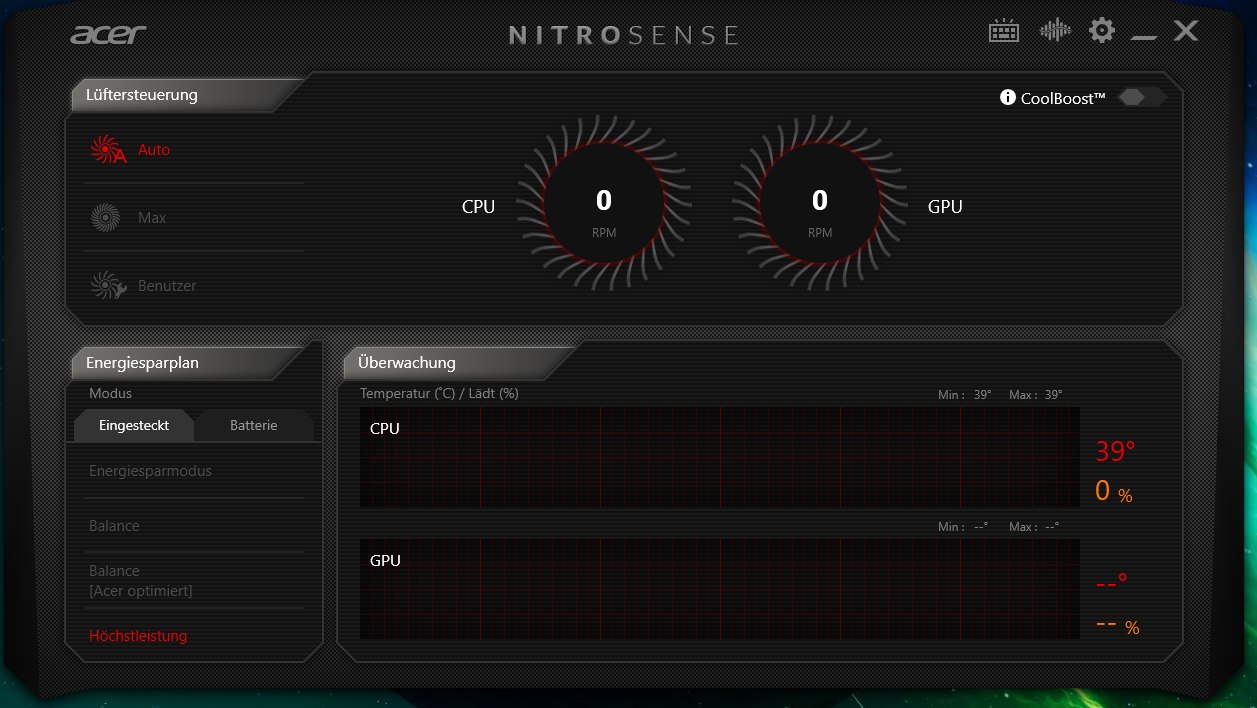
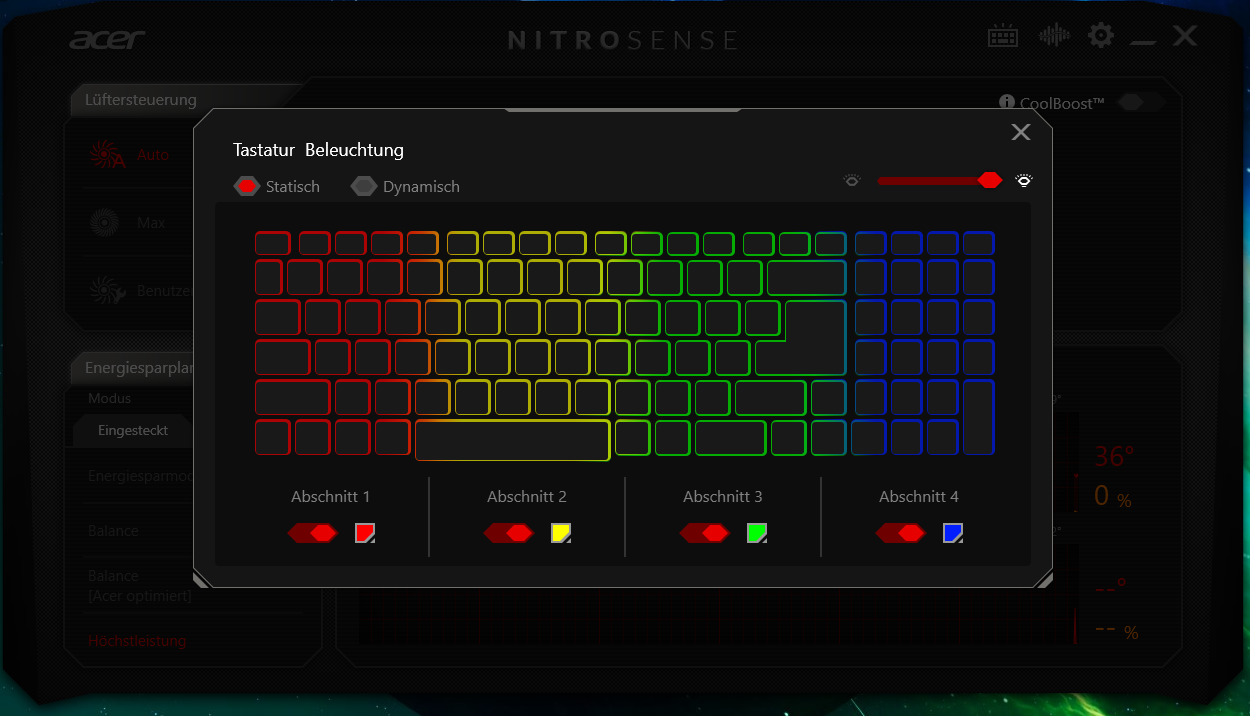
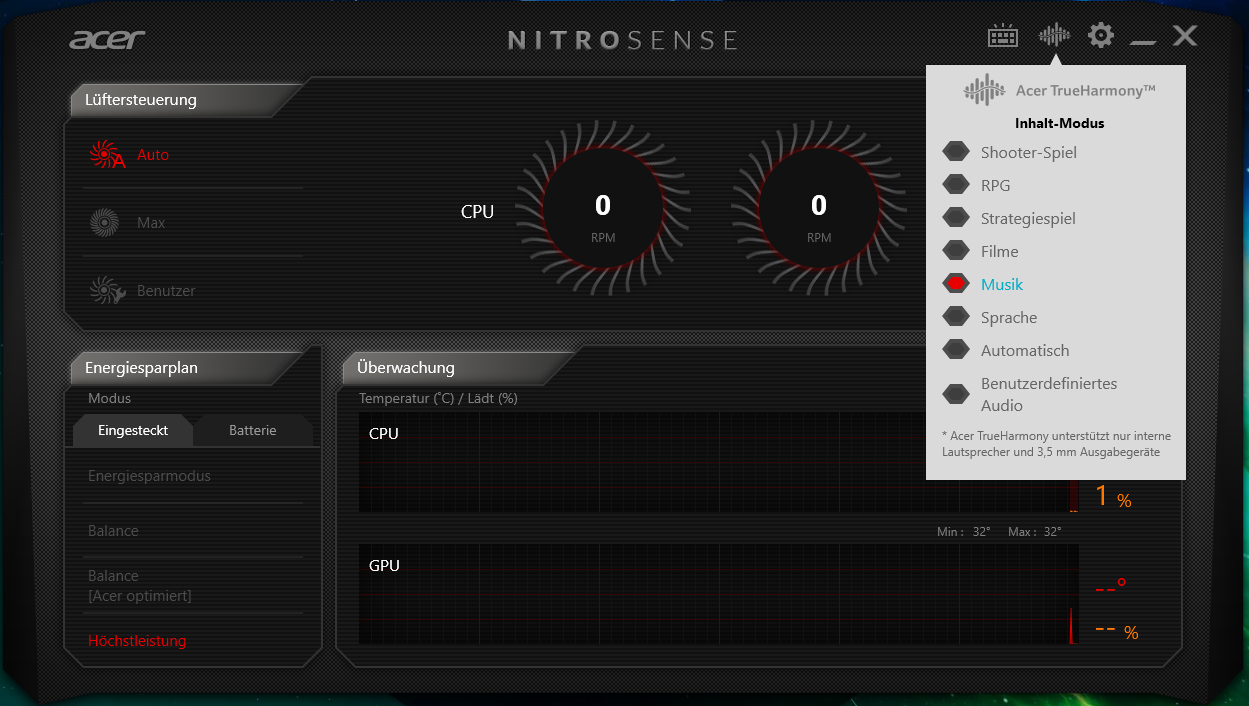
The pre-installed NitroSense software offers various performance profiles and allows influencing the two fans. We performed all benchmarks with the performance profile "High Performance" and used the automatic fan control. The performance profiles correspond to the standard Windows 10 profiles.
Processor
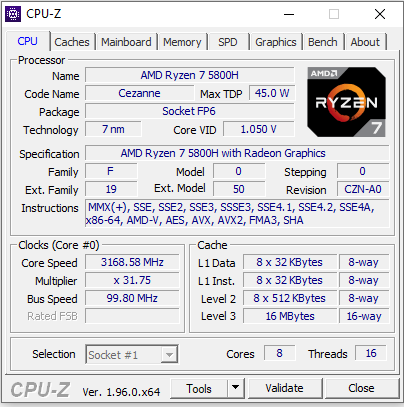
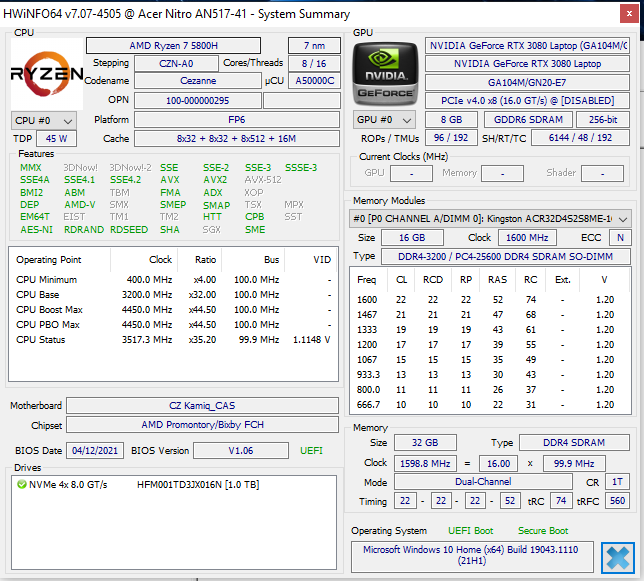
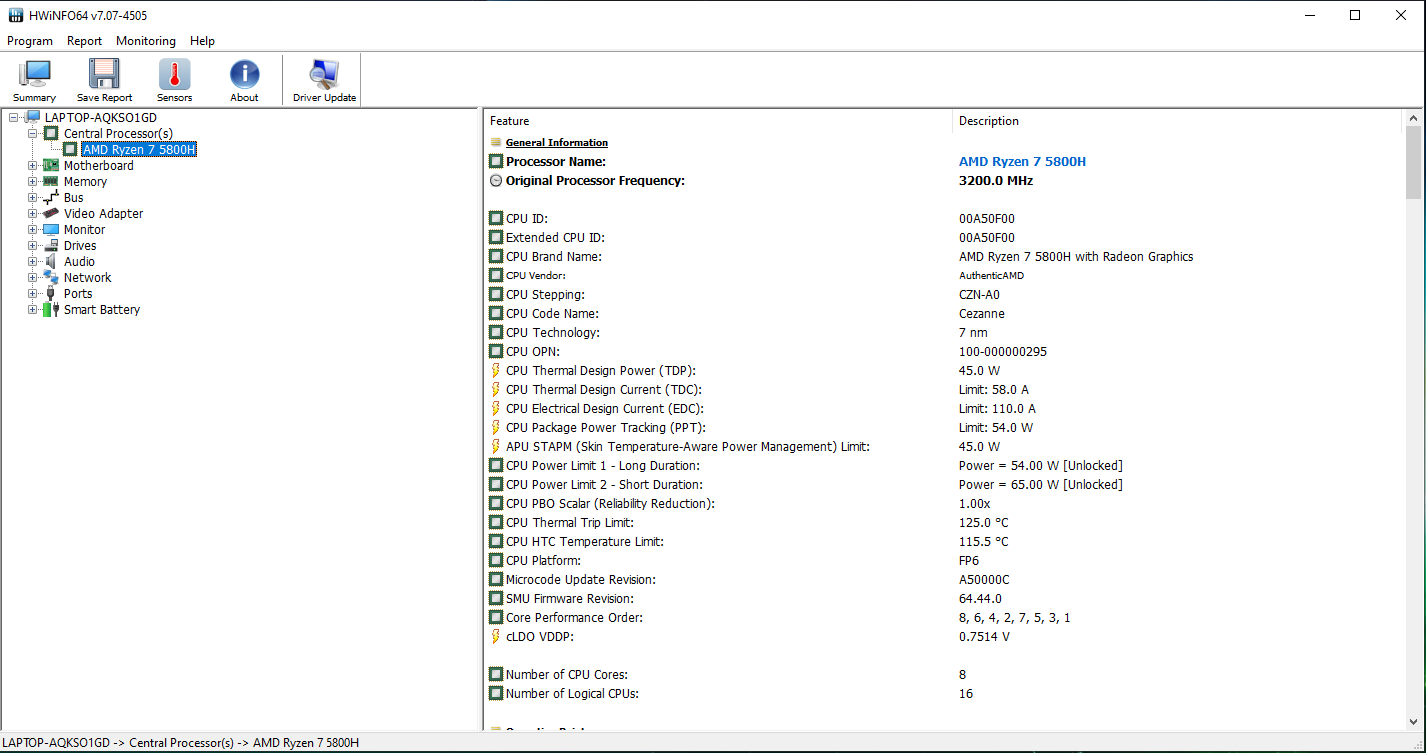
The CPU part of the Ryzen 7-5800H APU (Cezanne) consists of an eight-core processor that operates with a base clock of 3.2 GHz. An increase up to 4.4 GHz is possible via Turbo. Simultaneous multithreading (two threads per core) is supported.
The CPU tests of the Cinebench R15 benchmark are processed with 3.7 GHz (mains operation) and 3.2 to 4.4 GHz (single-thread). The clock rates are 1.9 GHz (multi-thread) and 1.5 to 1.9 GHz (single-thread) in battery mode.
We check whether the CPU Turbo is also used permanently in mains operation by running the multi-thread test of the Cinebench R15 benchmark in a loop for at least 30 minutes. The Turbo is used on a low level.
Cinebench R15 Multi Endurance test
* ... smaller is better
System performance
The system works smoothly. Problems did not occur. The hardware offers enough computing power even for applications beyond gaming. This is not least confirmed by the good PCMark results.
| PCMark 8 Home Score Accelerated v2 | 5252 points | |
| PCMark 8 Creative Score Accelerated v2 | 6230 points | |
| PCMark 8 Work Score Accelerated v2 | 6177 points | |
| PCMark 10 Score | 6758 points | |
Help | ||
| PCMark 10 / Score | |
| Average of class Gaming (5776 - 9852, n=119, last 2 years) | |
| SCHENKER XMG Neo 17 (Early 2021, RTX 3070, 5800H) | |
| Medion Erazer Beast X25 | |
| Acer Nitro 5 AN517-41-R9S5 | |
| Average AMD Ryzen 7 5800H, NVIDIA GeForce RTX 3080 Laptop GPU (n=1) | |
| Acer Nitro 5 AN517-41-R5Z7 | |
| MSI GP76 Leopard 10UG | |
| PCMark 10 / Essentials | |
| Average of class Gaming (9057 - 12600, n=121, last 2 years) | |
| Acer Nitro 5 AN517-41-R9S5 | |
| Average AMD Ryzen 7 5800H, NVIDIA GeForce RTX 3080 Laptop GPU (n=1) | |
| Acer Nitro 5 AN517-41-R5Z7 | |
| SCHENKER XMG Neo 17 (Early 2021, RTX 3070, 5800H) | |
| Medion Erazer Beast X25 | |
| MSI GP76 Leopard 10UG | |
| PCMark 10 / Productivity | |
| Average of class Gaming (6662 - 14612, n=119, last 2 years) | |
| Medion Erazer Beast X25 | |
| Acer Nitro 5 AN517-41-R9S5 | |
| Average AMD Ryzen 7 5800H, NVIDIA GeForce RTX 3080 Laptop GPU (n=1) | |
| Acer Nitro 5 AN517-41-R5Z7 | |
| SCHENKER XMG Neo 17 (Early 2021, RTX 3070, 5800H) | |
| MSI GP76 Leopard 10UG | |
| PCMark 10 / Digital Content Creation | |
| Average of class Gaming (7440 - 19351, n=119, last 2 years) | |
| SCHENKER XMG Neo 17 (Early 2021, RTX 3070, 5800H) | |
| Medion Erazer Beast X25 | |
| Acer Nitro 5 AN517-41-R5Z7 | |
| Acer Nitro 5 AN517-41-R9S5 | |
| Average AMD Ryzen 7 5800H, NVIDIA GeForce RTX 3080 Laptop GPU (n=1) | |
| MSI GP76 Leopard 10UG | |
DPC latencies
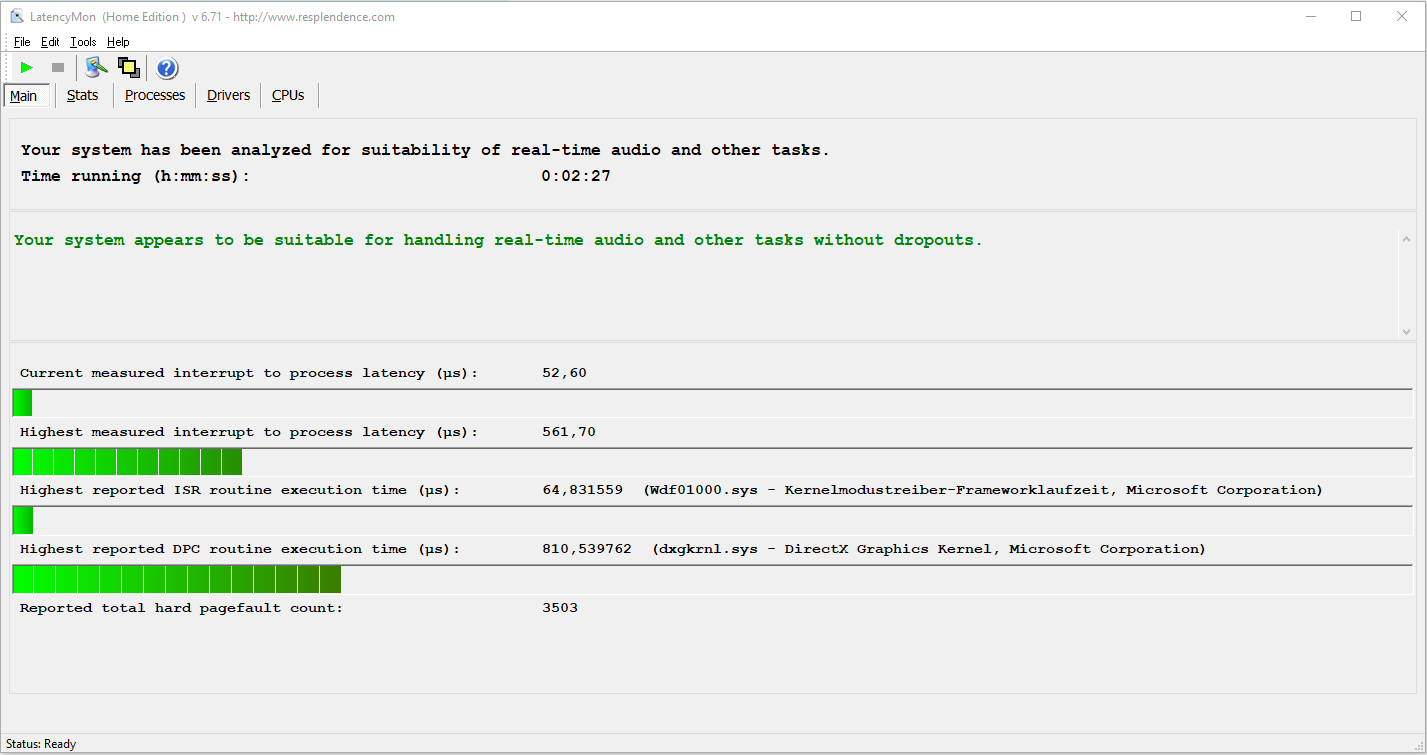
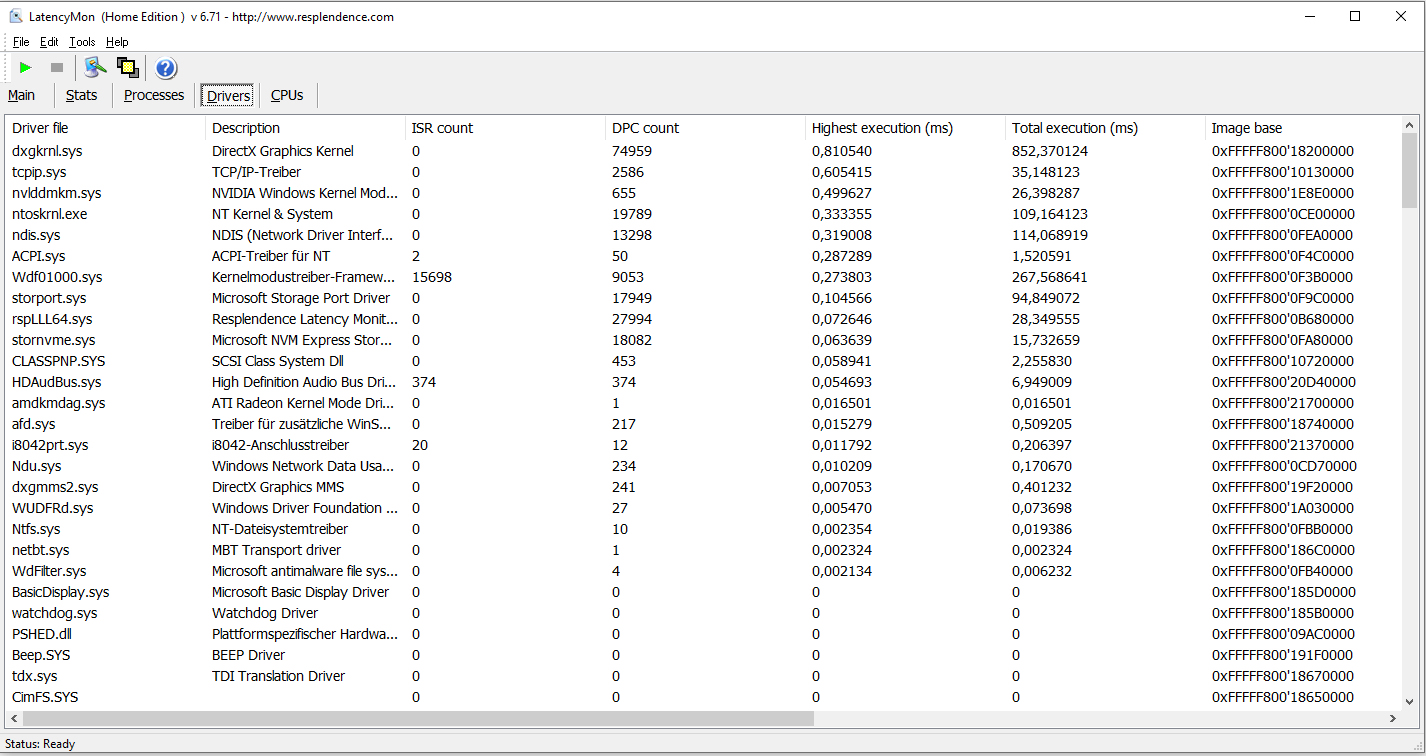
| DPC Latencies / LatencyMon - interrupt to process latency (max), Web, Youtube, Prime95 | |
| SCHENKER XMG Neo 17 (Early 2021, RTX 3070, 5800H) | |
| Acer Nitro 5 AN517-41-R5Z7 | |
| MSI GP76 Leopard 10UG | |
| Medion Erazer Beast X25 | |
| Acer Nitro 5 AN517-41-R9S5 | |
* ... smaller is better
Mass storage
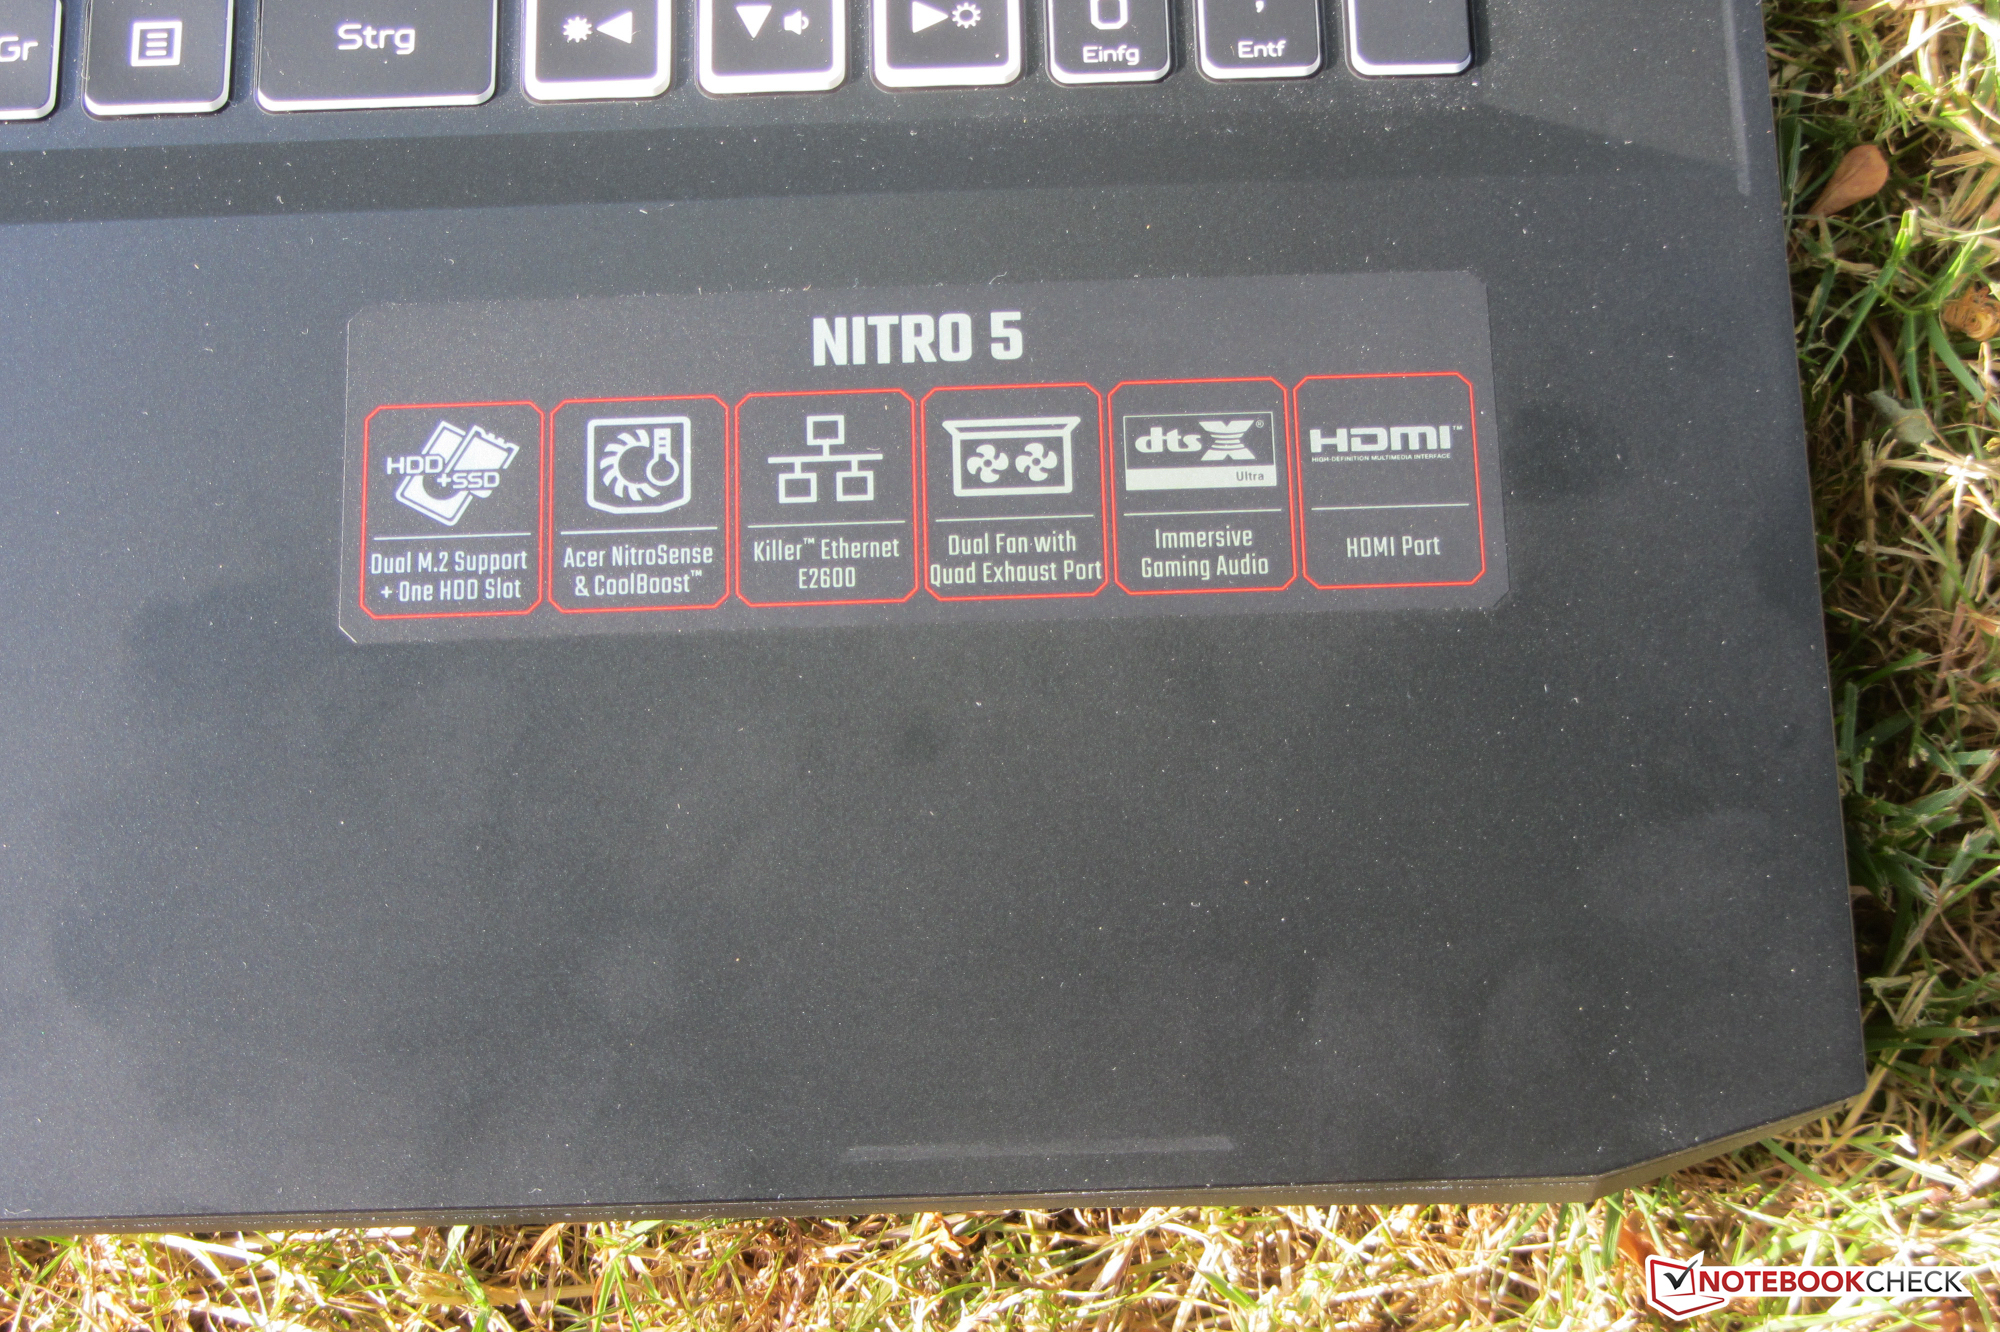
An NVMe SSD (M.2-2280) from SK Hynix serves as the system drive. It provides 1 TB of storage space and delivers good transfer rates. The notebook also has room for a second M.2-2280 SSD (NVMe) and a 2.5-inch storage device (SATA slot, screws and mounting frame included).

| Acer Nitro 5 AN517-41-R9S5 SK Hynix BC711 1TB HFM001TD3JX016N | MSI GP76 Leopard 10UG Kingston OM8PCP3512F-AB | SCHENKER XMG Neo 17 (Early 2021, RTX 3070, 5800H) Samsung SSD 970 EVO Plus 500GB | Acer Nitro 5 AN517-41-R5Z7 SK Hynix BC711 1TB HFM001TD3JX016N | Medion Erazer Beast X25 Samsung PM9A1 MZVL22T0HBLB | Average SK Hynix BC711 1TB HFM001TD3JX016N | Average of class Gaming | |
|---|---|---|---|---|---|---|---|
| CrystalDiskMark 5.2 / 6 | -35% | 12% | 1% | -1% | 1% | 50% | |
| Write 4K (MB/s) | 133.4 | 143.7 8% | 206.1 54% | 146.7 10% | 129.7 -3% | 140.1 ? 5% | 212 ? 59% |
| Read 4K (MB/s) | 64.7 | 45.1 -30% | 53 -18% | 63.7 -2% | 62.4 -4% | 64.2 ? -1% | 74.6 ? 15% |
| Write Seq (MB/s) | 2934 | 978 -67% | 3018 3% | 2954 1% | 2436 -17% | 2944 ? 0% | 4033 ? 37% |
| Read Seq (MB/s) | 2364 | 1163 -51% | 2575 9% | 1974 -16% | 2354 0% | 2169 ? -8% | 3798 ? 61% |
| Write 4K Q32T1 (MB/s) | 438.4 | 519 18% | 535 22% | 496.9 13% | 512 17% | 468 ? 7% | 582 ? 33% |
| Read 4K Q32T1 (MB/s) | 516 | 302.7 -41% | 608 18% | 549 6% | 436.2 -15% | 533 ? 3% | 732 ? 42% |
| Write Seq Q32T1 (MB/s) | 3083 | 981 -68% | 3242 5% | 3062 -1% | 3541 15% | 3073 ? 0% | 5106 ? 66% |
| Read Seq Q32T1 (MB/s) | 3584 | 1983 -45% | 3617 1% | 3580 0% | 3568 0% | 3582 ? 0% | 6732 ? 88% |
| AS SSD | -46% | 1% | -5% | -8% | -3% | 27% | |
| Seq Read (MB/s) | 2974 | 1659 -44% | 3020 2% | 2891 -3% | 2591 -13% | 2933 ? -1% | 5279 ? 78% |
| Seq Write (MB/s) | 2733 | 921 -66% | 2631 -4% | 2692 -2% | 1900 -30% | 2713 ? -1% | 3993 ? 46% |
| 4K Read (MB/s) | 55.7 | 51 -8% | 60.3 8% | 52.6 -6% | 53.9 -3% | 54.2 ? -3% | 68.2 ? 22% |
| 4K Write (MB/s) | 134 | 120.1 -10% | 171.6 28% | 134.9 1% | 112.6 -16% | 134.5 ? 0% | 218 ? 63% |
| 4K-64 Read (MB/s) | 1854 | 463.5 -75% | 1410 -24% | 1845 0% | 1335 -28% | 1850 ? 0% | 1807 ? -3% |
| 4K-64 Write (MB/s) | 2165 | 909 -58% | 2324 7% | 2142 -1% | 2966 37% | 2154 ? -1% | 2749 ? 27% |
| Access Time Read * (ms) | 0.179 | 0.045 | 0.038 | 0.05669 ? | |||
| Access Time Write * (ms) | 0.028 | 0.032 -14% | 0.024 14% | 0.028 -0% | 0.036 -29% | 0.028 ? -0% | 0.04159 ? -49% |
| Score Read (Points) | 2207 | 680 -69% | 1773 -20% | 2186 -1% | 1648 -25% | 2197 ? 0% | 2402 ? 9% |
| Score Write (Points) | 2573 | 1121 -56% | 2759 7% | 2546 -1% | 3269 27% | 2560 ? -1% | 3363 ? 31% |
| Score Total (Points) | 5899 | 2130 -64% | 5429 -8% | 5842 -1% | 5733 -3% | 5871 ? 0% | 6936 ? 18% |
| Copy ISO MB/s (MB/s) | 2260 | 2130 -6% | 2195 ? -3% | 3048 ? 35% | |||
| Copy Program MB/s (MB/s) | 677 | 642 -5% | 660 ? -3% | 950 ? 40% | |||
| Copy Game MB/s (MB/s) | 1493 | 821 -45% | 1157 ? -23% | 2087 ? 40% | |||
| Total Average (Program / Settings) | -41% /
-41% | 7% /
6% | -2% /
-3% | -5% /
-5% | -1% /
-1% | 39% /
36% |
* ... smaller is better
Continuous load read: DiskSpd Read Loop, Queue Depth 8
Graphics card
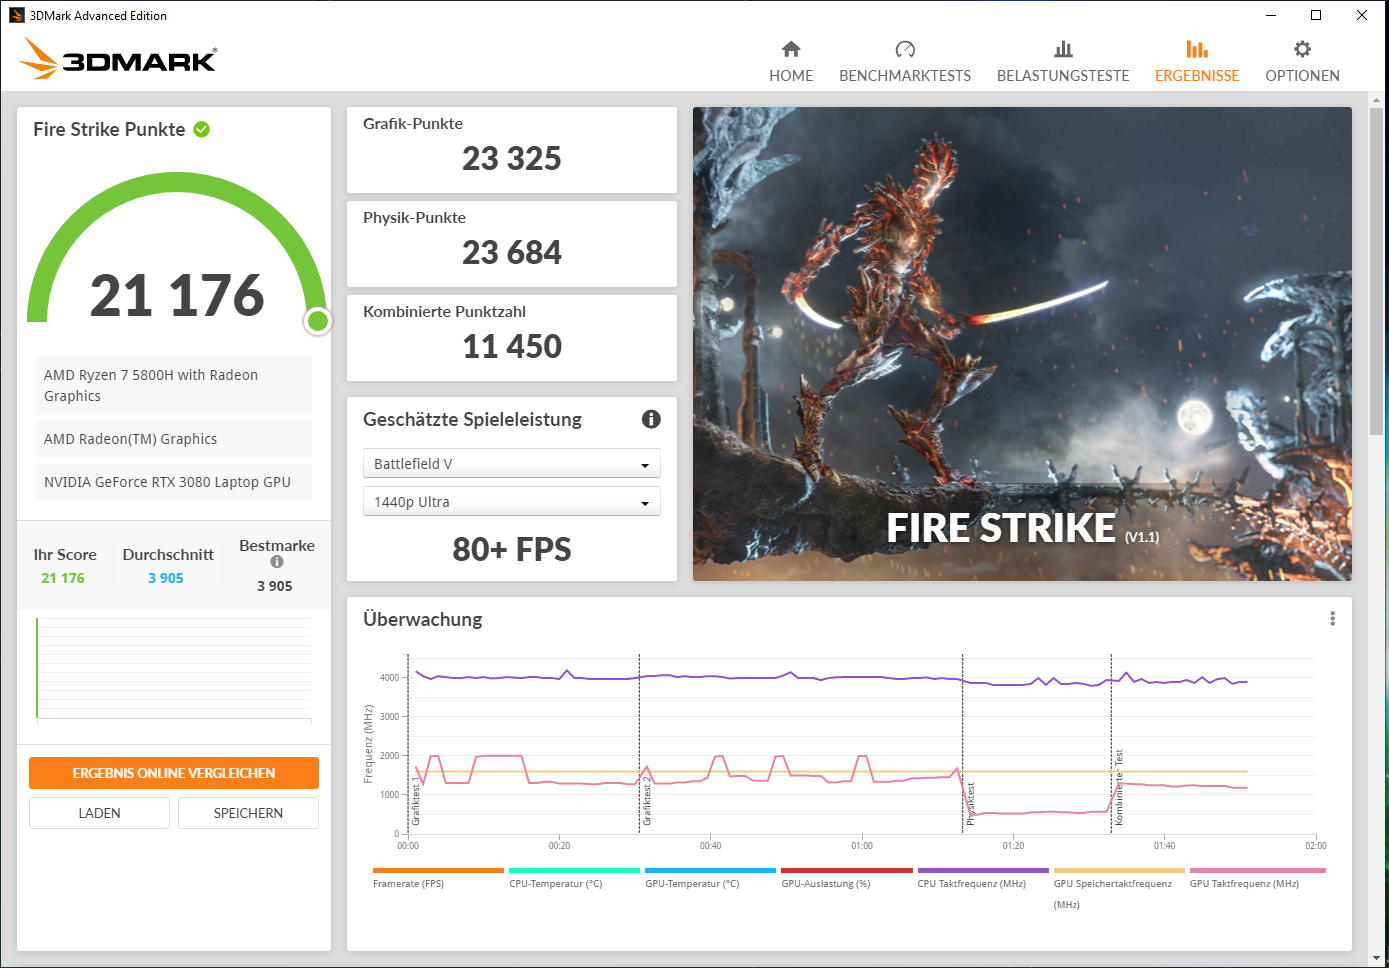
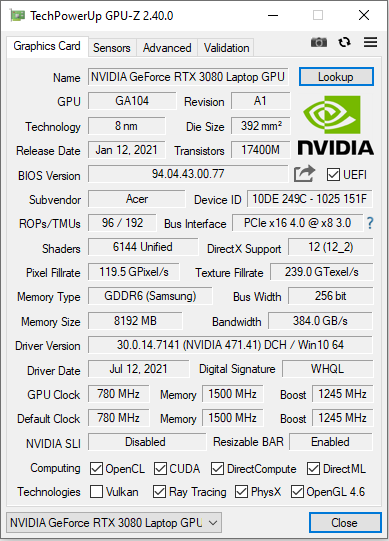
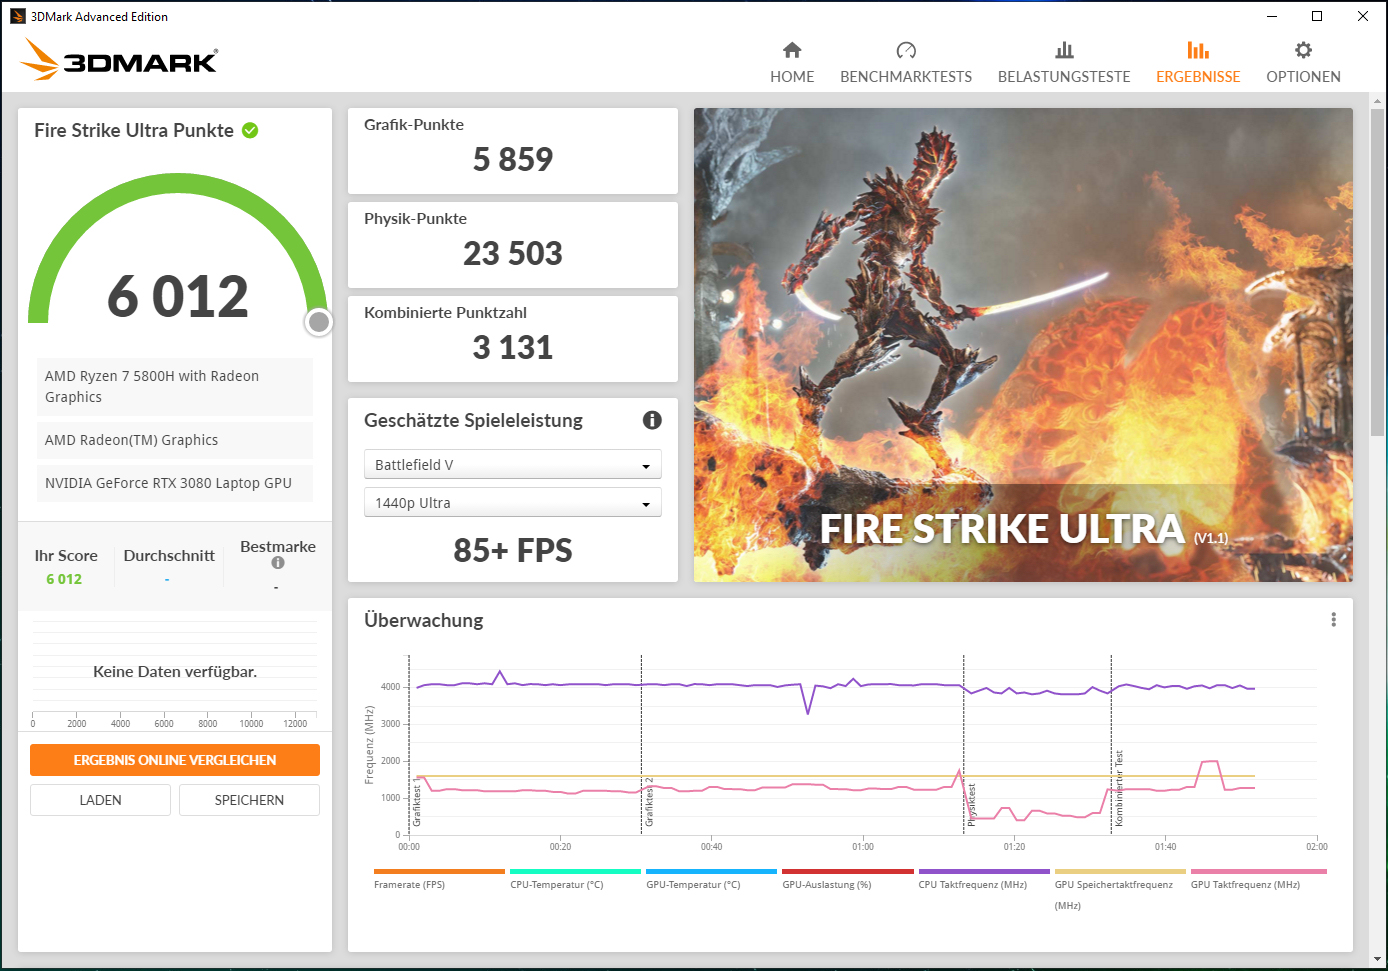
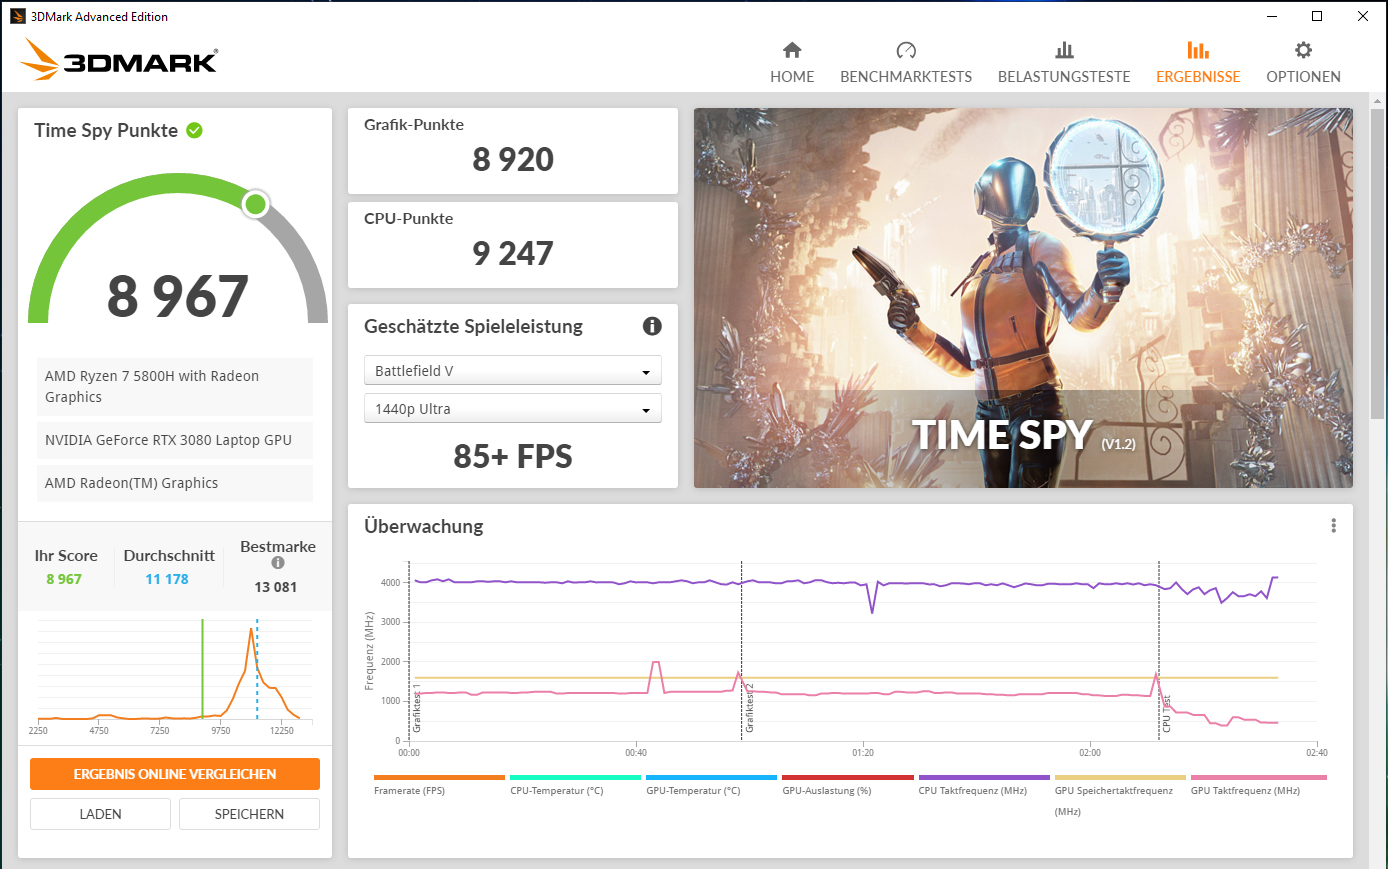
The actual performance of an RTX-3000 graphics core largely depends on the maximum TGP that a notebook manufacturer chooses within the limits defined by Nvidia. Acer grants the GeForce RTX-3080 Laptop GPU (Overview of all RTX-3080 laptops including the TGPs) a maximum TGP of 100 watts.
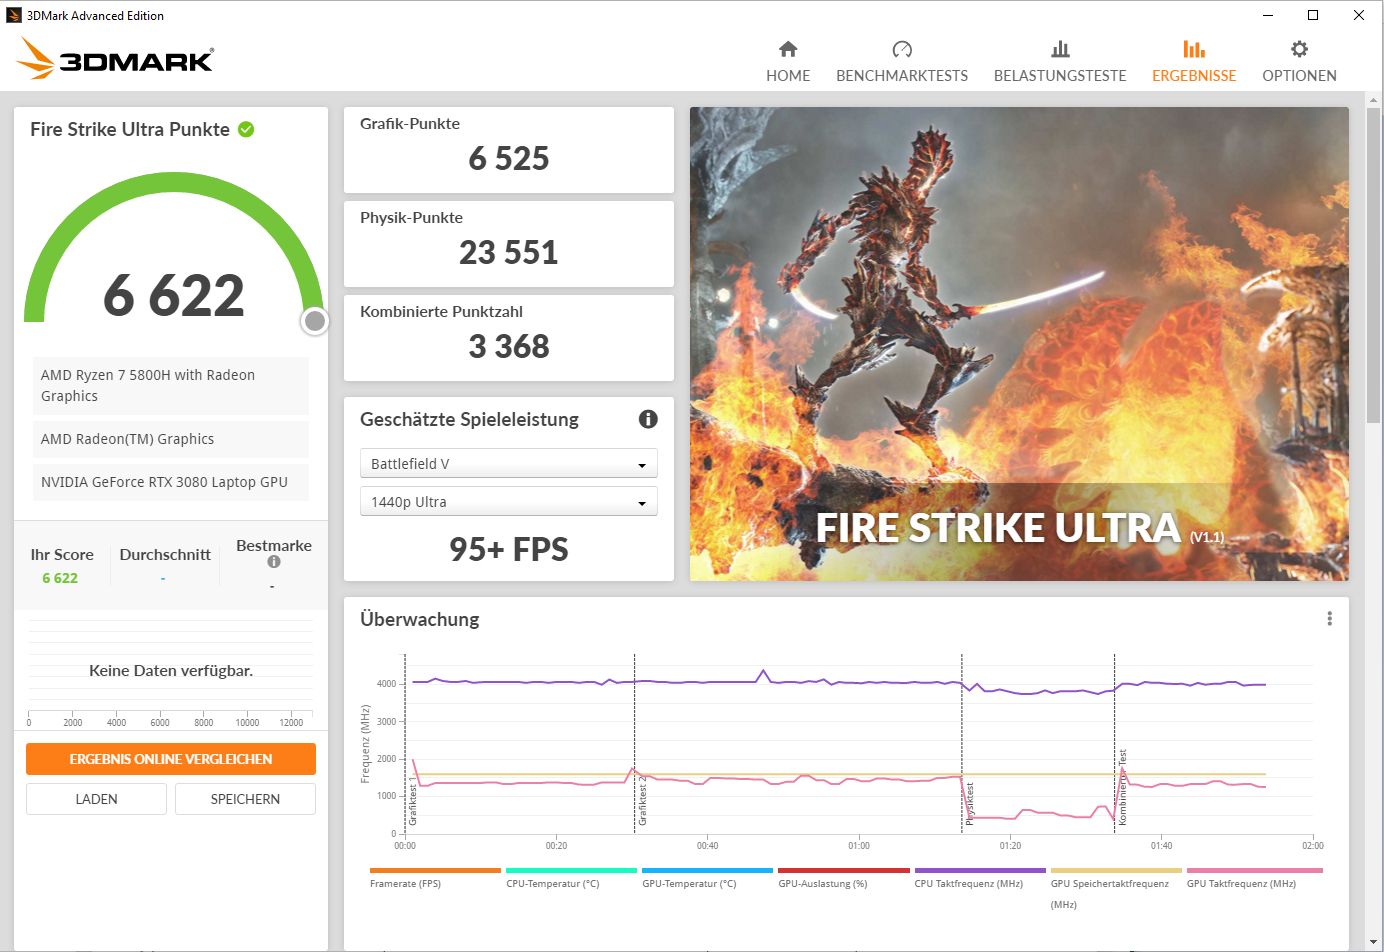
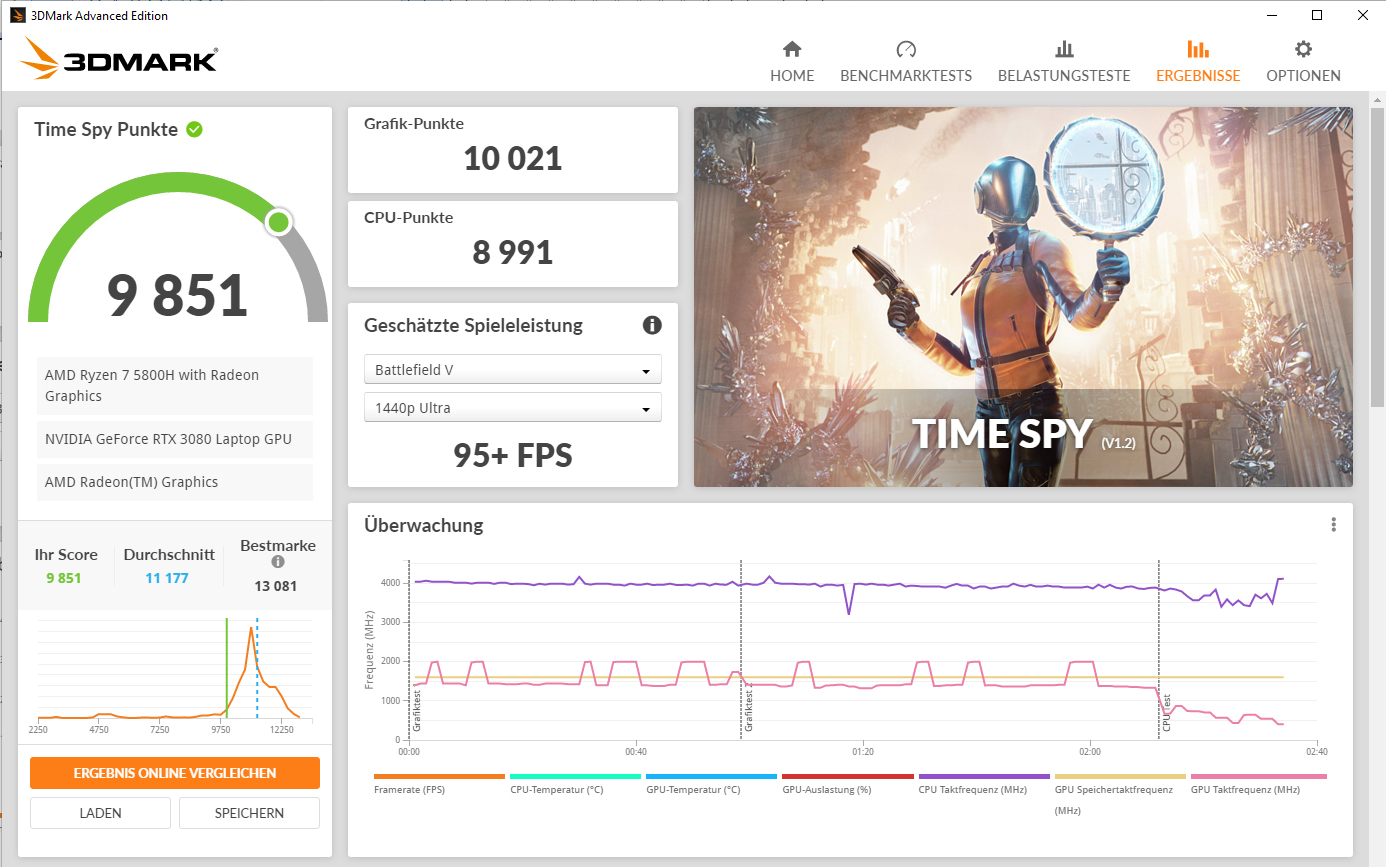
The GPU partially delivers the lowest benchmark results that we have determined with the RTX-3080 so far. There is potential for improvement: A firmware update increases the GPU performance a bit and brings the results closer to the RTX-3080 average. The update does not increase the TGP. Presumably, Acer has moved the temperature limits up - at least the Witcher 3 test shows that.
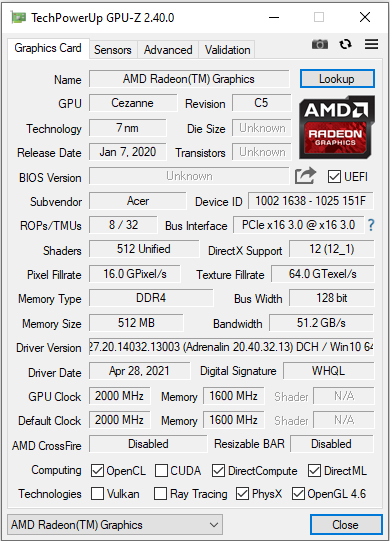
The RTX-3080 can fall back on fast GDDR6 graphics memory (8,192 MB). The processor-integrated Vega-8 graphics core is active and the notebook works with Nvidia's Optimus switching graphics solution.
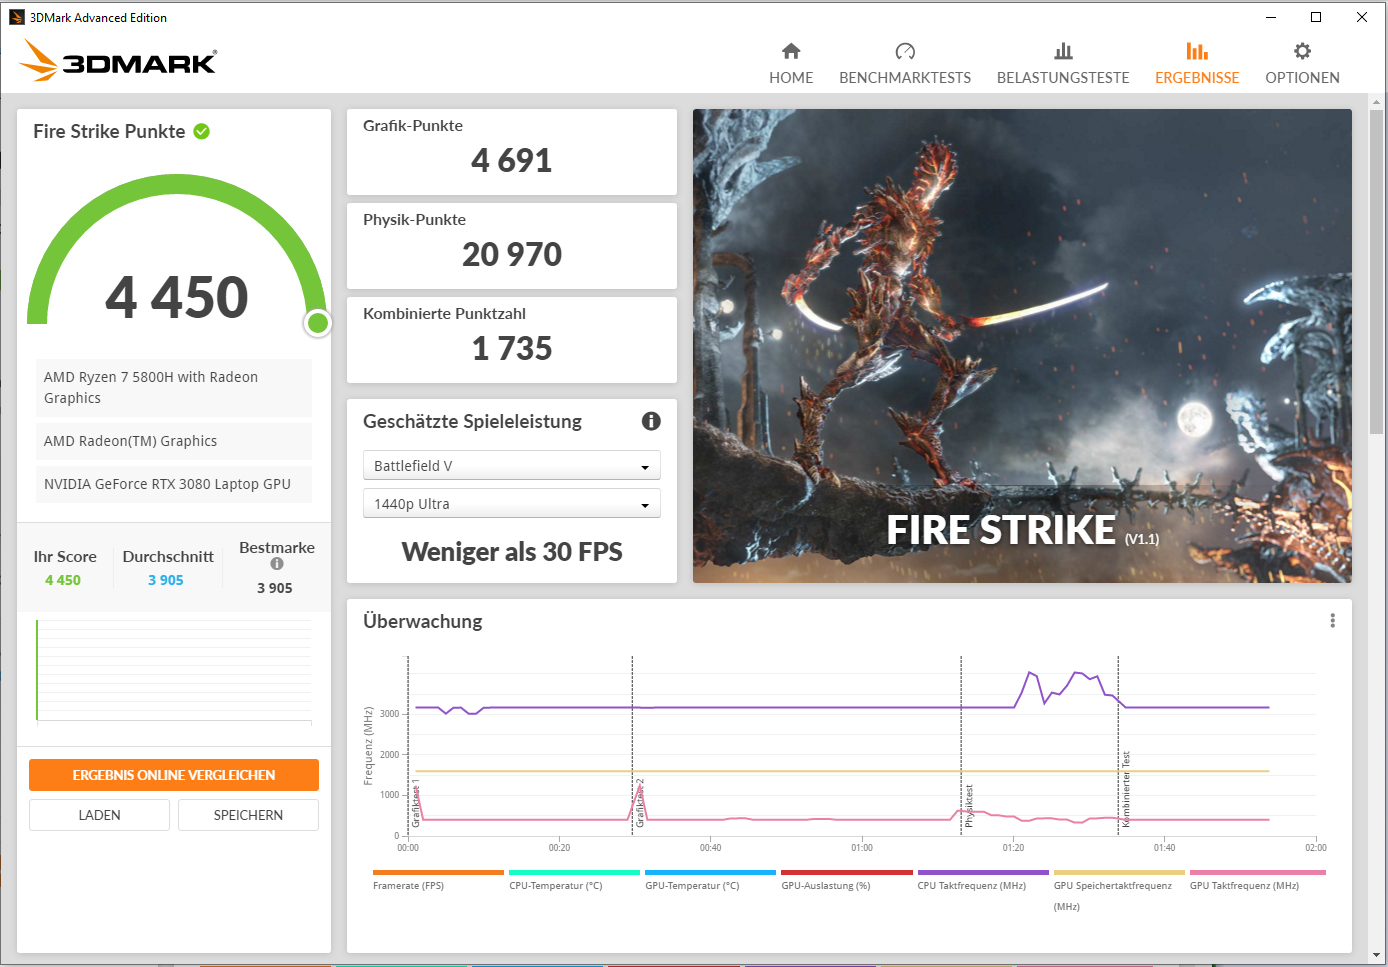
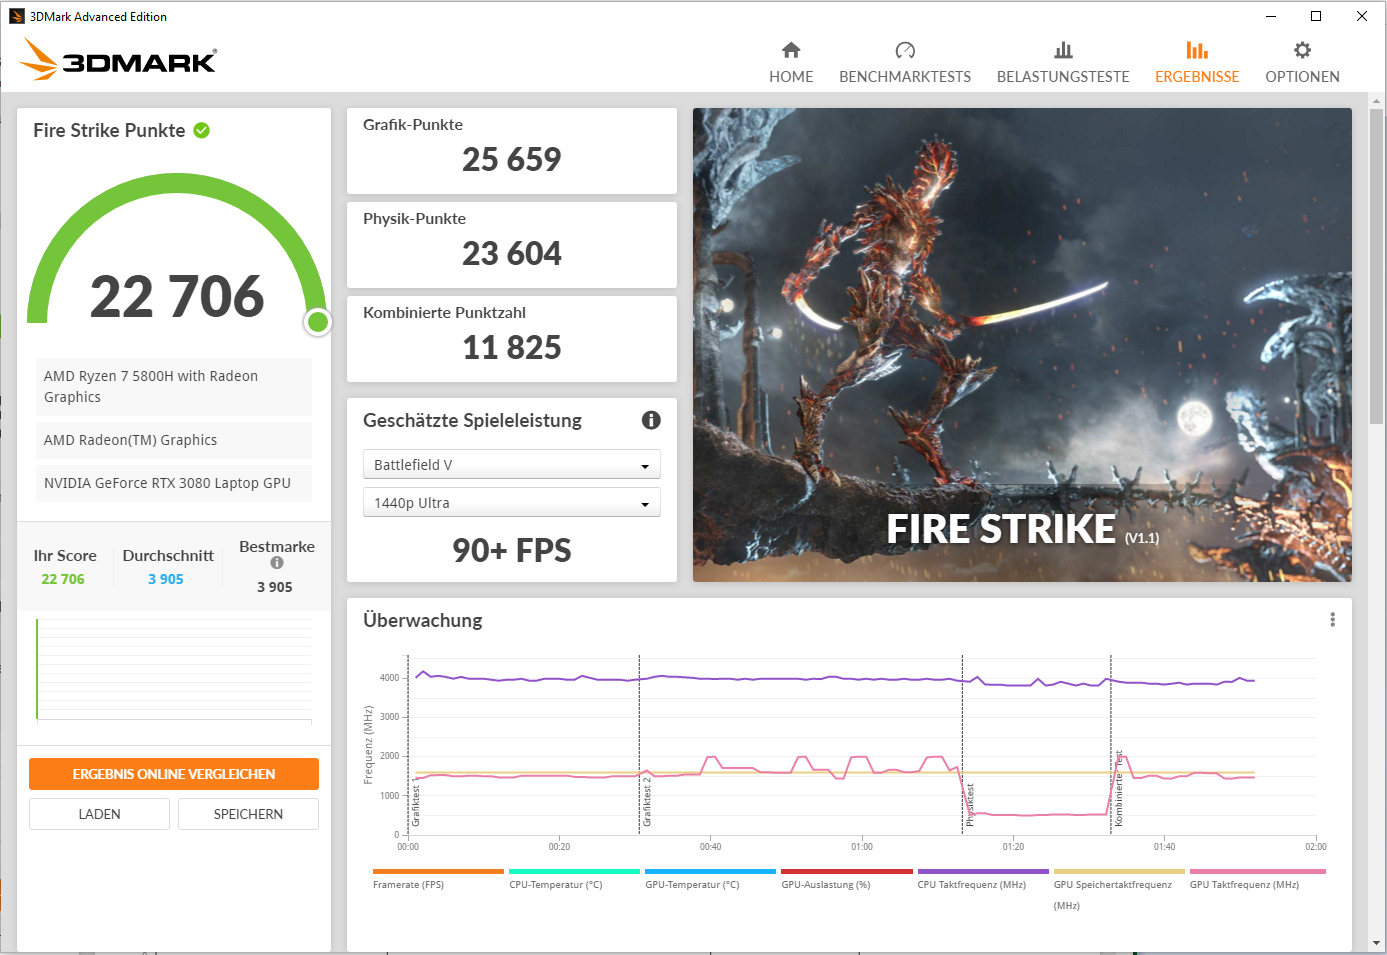

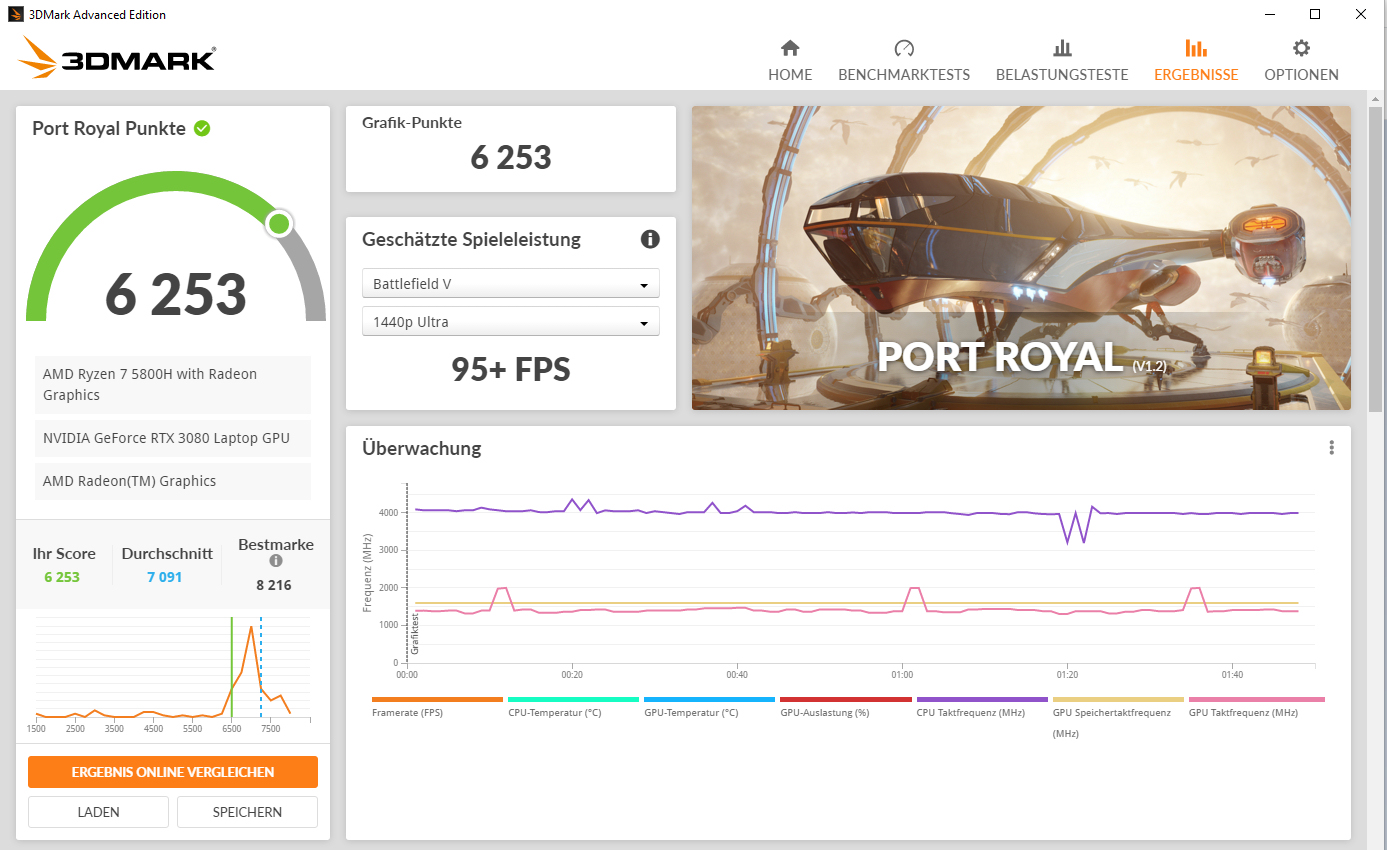
| 3DMark 11 Performance | 25155 points | |
| 3DMark Cloud Gate Standard Score | 46255 points | |
| 3DMark Fire Strike Score | 21176 points | |
| 3DMark Time Spy Score | 8967 points | |
Help | ||
| 3DMark 11 - 1280x720 Performance GPU | |
| Average of class Gaming (10741 - 76300, n=130, last 2 years) | |
| MSI GP76 Leopard 10UG | |
| Average NVIDIA GeForce RTX 3080 Laptop GPU (31288 - 43744, n=40) | |
| Aorus 17G YD | |
| Medion Erazer Beast X25 | |
| Acer Nitro 5 AN517-41-R9S5 | |
| Acer Nitro 5 AN517-41-R9S5 | |
| Acer Nitro 5 AN517-41-R5Z7 | |
Gaming performance
The computer brings all current games smoothly to the screen. FHD resolution and maximum quality settings can usually be selected. The frame rates are below average in the RTX-3080 comparison.
The frame rates of the games we tested increase by up to 15% after installing the mentioned firmware update. A general performance increase is not observed. However: Even after running the update, the Nitro remains behind a nominally weaker RTX-3070 notebook like the MSI GP76 Leopard 10UG. Here, the GP76 benefits from the higher TGP (140 watts vs. 100 watts).
| The Witcher 3 - 1920x1080 Ultra Graphics & Postprocessing (HBAO+) | |
| Average of class Gaming (18.4 - 224, n=66, last 2 years) | |
| MSI GP76 Leopard 10UG | |
| Aorus 17G YD | |
| Average NVIDIA GeForce RTX 3080 Laptop GPU (85.1 - 123, n=40) | |
| SCHENKER XMG Neo 17 (Early 2021, RTX 3070, 5800H) | |
| Medion Erazer Beast X25 | |
| Acer Nitro 5 AN517-41-R9S5 (FW-Update) | |
| Acer Nitro 5 AN517-41-R9S5 | |
| Acer Nitro 5 AN517-41-R5Z7 | |
| Dota 2 Reborn - 1920x1080 ultra (3/3) best looking | |
| Average of class Gaming (65.1 - 248, n=137, last 2 years) | |
| Aorus 17G YD | |
| SCHENKER XMG Neo 17 (Early 2021, RTX 3070, 5800H) | |
| Average NVIDIA GeForce RTX 3080 Laptop GPU (98 - 156, n=45) | |
| Medion Erazer Beast X25 | |
| MSI GP76 Leopard 10UG | |
| Acer Nitro 5 AN517-41-R9S5 | |
| Acer Nitro 5 AN517-41-R9S5 (FW-Update) | |
| Acer Nitro 5 AN517-41-R5Z7 | |
| X-Plane 11.11 - 1920x1080 high (fps_test=3) | |
| Average of class Gaming (33.4 - 150.2, n=140, last 2 years) | |
| Average NVIDIA GeForce RTX 3080 Laptop GPU (65.6 - 113, n=44) | |
| Aorus 17G YD | |
| MSI GP76 Leopard 10UG | |
| SCHENKER XMG Neo 17 (Early 2021, RTX 3070, 5800H) | |
| Acer Nitro 5 AN517-41-R9S5 (FW-Update) | |
| Medion Erazer Beast X25 | |
| Acer Nitro 5 AN517-41-R9S5 | |
| Acer Nitro 5 AN517-41-R5Z7 | |
| Final Fantasy XV Benchmark - 1920x1080 High Quality | |
| Average of class Gaming (19.2 - 215, n=134, last 2 years) | |
| Average NVIDIA GeForce RTX 3080 Laptop GPU (55.5 - 115, n=34) | |
| Medion Erazer Beast X25 | |
| Aorus 17G YD (1.3) | |
| Acer Nitro 5 AN517-41-R9S5 (1.3, FW-Update) | |
| MSI GP76 Leopard 10UG | |
| Acer Nitro 5 AN517-41-R9S5 (1.3) | |
| Acer Nitro 5 AN517-41-R5Z7 (1.3) | |
| GTA V - 1920x1080 Highest Settings possible AA:4xMSAA + FX AF:16x | |
| Average of class Gaming (12.1 - 186.9, n=123, last 2 years) | |
| Average NVIDIA GeForce RTX 3080 Laptop GPU (68.6 - 114.6, n=34) | |
| SCHENKER XMG Neo 17 (Early 2021, RTX 3070, 5800H) | |
| Aorus 17G YD | |
| Medion Erazer Beast X25 | |
| Acer Nitro 5 AN517-41-R9S5 | |
| Acer Nitro 5 AN517-41-R9S5 (FW-Update) | |
| Acer Nitro 5 AN517-41-R5Z7 | |
| Strange Brigade - 1920x1080 ultra AA:ultra AF:16 | |
| Average of class Gaming (38.9 - 456, n=123, last 2 years) | |
| Average NVIDIA GeForce RTX 3080 Laptop GPU (117 - 219, n=34) | |
| Medion Erazer Beast X25 (1.47.22.14 D3D12) | |
| Aorus 17G YD (1.47.22.14 D3D12) | |
| Acer Nitro 5 AN517-41-R9S5 (1.47.22.14 D3D12, FW-Update) | |
| Acer Nitro 5 AN517-41-R9S5 (1.47.22.14 D3D12) | |
| Acer Nitro 5 AN517-41-R5Z7 (1.47.22.14 D3D12) | |
| Dirt 5 - 1920x1080 Ultra High Preset | |
| Acer Nitro 5 AN517-41-R9S5 (FW-Update) | |
| Aorus 17G YD | |
| Average NVIDIA GeForce RTX 3080 Laptop GPU (52 - 110, n=11) | |
| Acer Nitro 5 AN517-41-R9S5 | |
| Acer Nitro 5 AN517-41-R5Z7 | |
| Far Cry 5 - 1920x1080 Ultra Preset AA:T | |
| Average of class Gaming (34 - 174, n=52, last 2 years) | |
| MSI GP76 Leopard 10UG | |
| Average NVIDIA GeForce RTX 3080 Laptop GPU (75 - 146, n=33) | |
| Medion Erazer Beast X25 | |
| Aorus 17G YD | |
| Acer Nitro 5 AN517-41-R9S5 | |
| Acer Nitro 5 AN517-41-R9S5 (FW-Update) | |
| Acer Nitro 5 AN517-41-R5Z7 | |
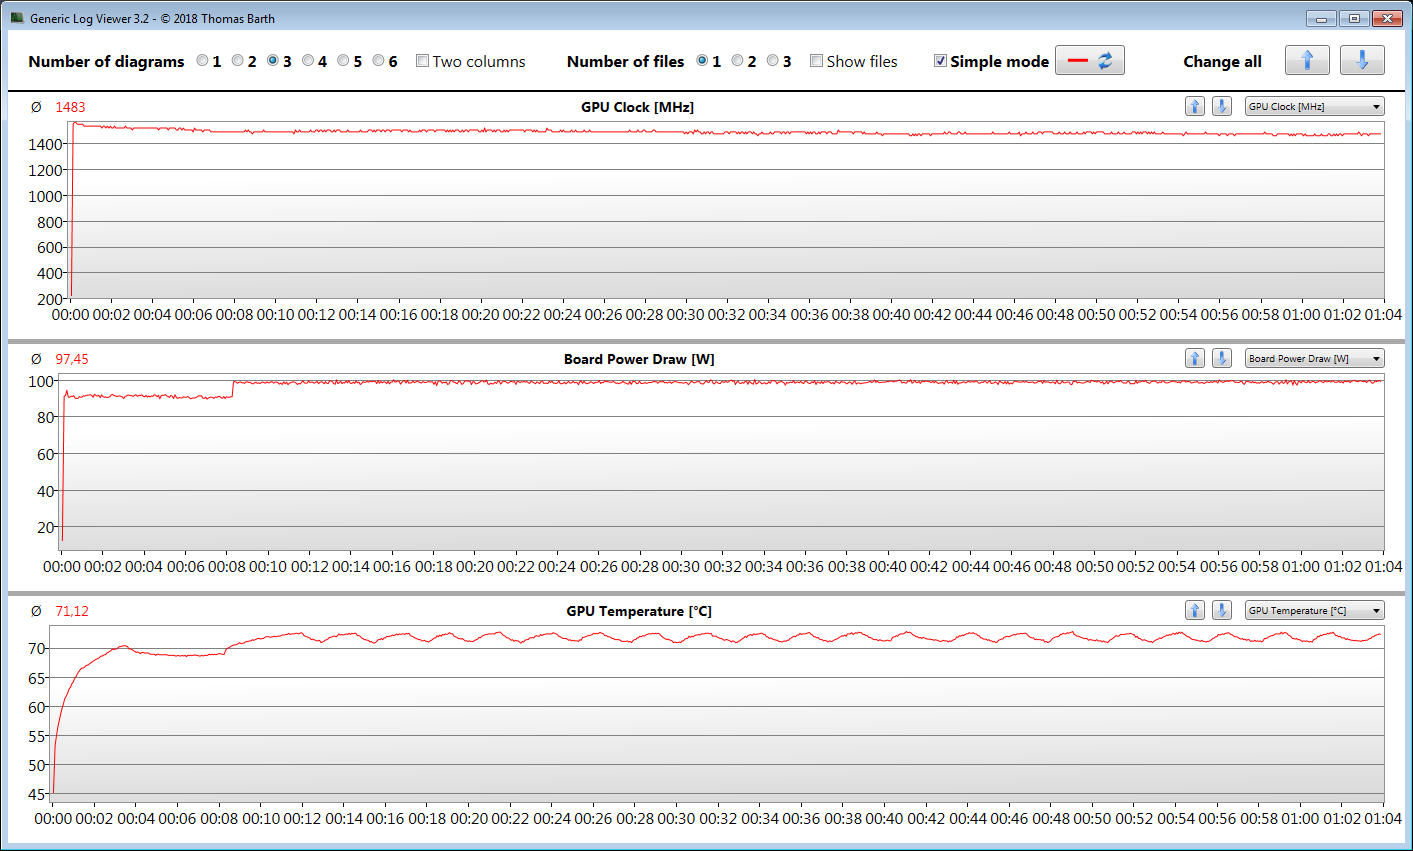
To check whether the frame rates remain largely constant over a longer period, we run the game "The Witcher 3" for about 60 minutes with Full HD resolution and maximum quality settings. The game character is not moved. A drop in the frame rates is not noticed.
Witcher 3 FPS-Diagram
| low | med. | high | ultra | |
|---|---|---|---|---|
| GTA V (2015) | 178 | 172 | 148 | 89.9 |
| The Witcher 3 (2015) | 293 | 262 | 151 | 87.7 |
| Dota 2 Reborn (2015) | 144 | 139 | 123 | 116 |
| Final Fantasy XV Benchmark (2018) | 165 | 113 | 85.4 | |
| X-Plane 11.11 (2018) | 98.1 | 85.8 | 72 | |
| Far Cry 5 (2018) | 134 | 115 | 110 | 103 |
| Strange Brigade (2018) | 313 | 186 | 165 | 151 |
| Dirt 5 (2020) | 190 | 120 | 97.3 | 76.5 |
Emissions & Energy - Acer computer does not generate excessive heat and noise
Noise emissions
The two fans operate at low speeds in idle and are barely audible. Occasionally they stand still. This is not true under heavy usage. The maximum sound pressure level is just under 49 dB(A) (stress test).
Noise Level
| Idle |
| 26 / 28 / dB(A) |
| HDD |
| 0 dB(A) |
| Load |
| 41.6 / 48.6 dB(A) |
 | ||
30 dB silent 40 dB(A) audible 50 dB(A) loud |
||
min: | ||
| Acer Nitro 5 AN517-41-R9S5 AMD Ryzen 7 5800H, NVIDIA GeForce RTX 3080 Laptop GPU | Acer Nitro 5 AN517-41-R5Z7 AMD Ryzen 7 5800H, NVIDIA GeForce RTX 3070 Laptop GPU | MSI GP76 Leopard 10UG Intel Core i7-10750H, NVIDIA GeForce RTX 3070 Laptop GPU | SCHENKER XMG Neo 17 (Early 2021, RTX 3070, 5800H) AMD Ryzen 7 5800H, NVIDIA GeForce RTX 3070 Laptop GPU | Medion Erazer Beast X25 AMD Ryzen 9 5900HX, NVIDIA GeForce RTX 3080 Laptop GPU | Aorus 17G YD Intel Core i7-11800H, NVIDIA GeForce RTX 3080 Laptop GPU | |
|---|---|---|---|---|---|---|
| Noise | -8% | -9% | -10% | -9% | -13% | |
| off / environment * (dB) | 26 | 26 -0% | 24 8% | 24 8% | 25 4% | 25 4% |
| Idle Minimum * (dB) | 26 | 26 -0% | 25 4% | 29 -12% | 26 -0% | 32 -23% |
| Idle Average * (dB) | 28 | 33.1 -18% | 32 -14% | 32 -14% | 30 -7% | 33 -18% |
| Load Average * (dB) | 41.6 | 49.8 -20% | 54 -30% | 49 -18% | 54 -30% | 43 -3% |
| Load Maximum * (dB) | 48.6 | 49.6 -2% | 54 -11% | 55 -13% | 55 -13% | 61 -26% |
| Idle Maximum * (dB) | 31.3 | 34 | 38 | 43 | 39 | |
| Witcher 3 ultra * (dB) | 51 | 53 | 52 | 52 |
* ... smaller is better
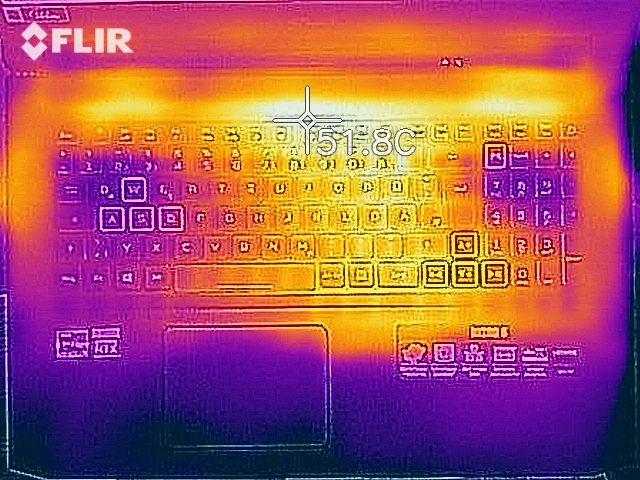
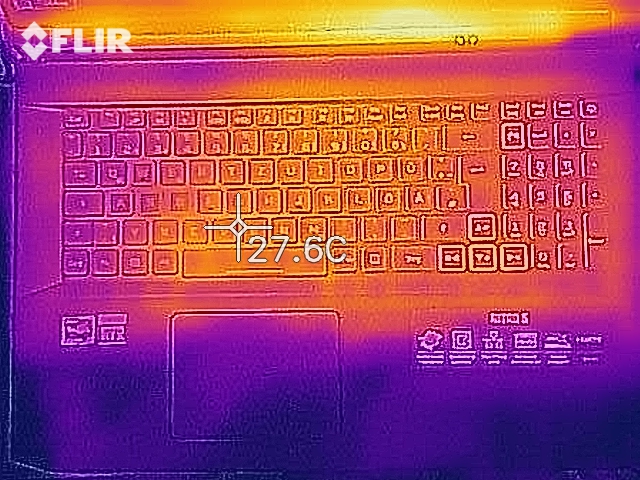
Temperature
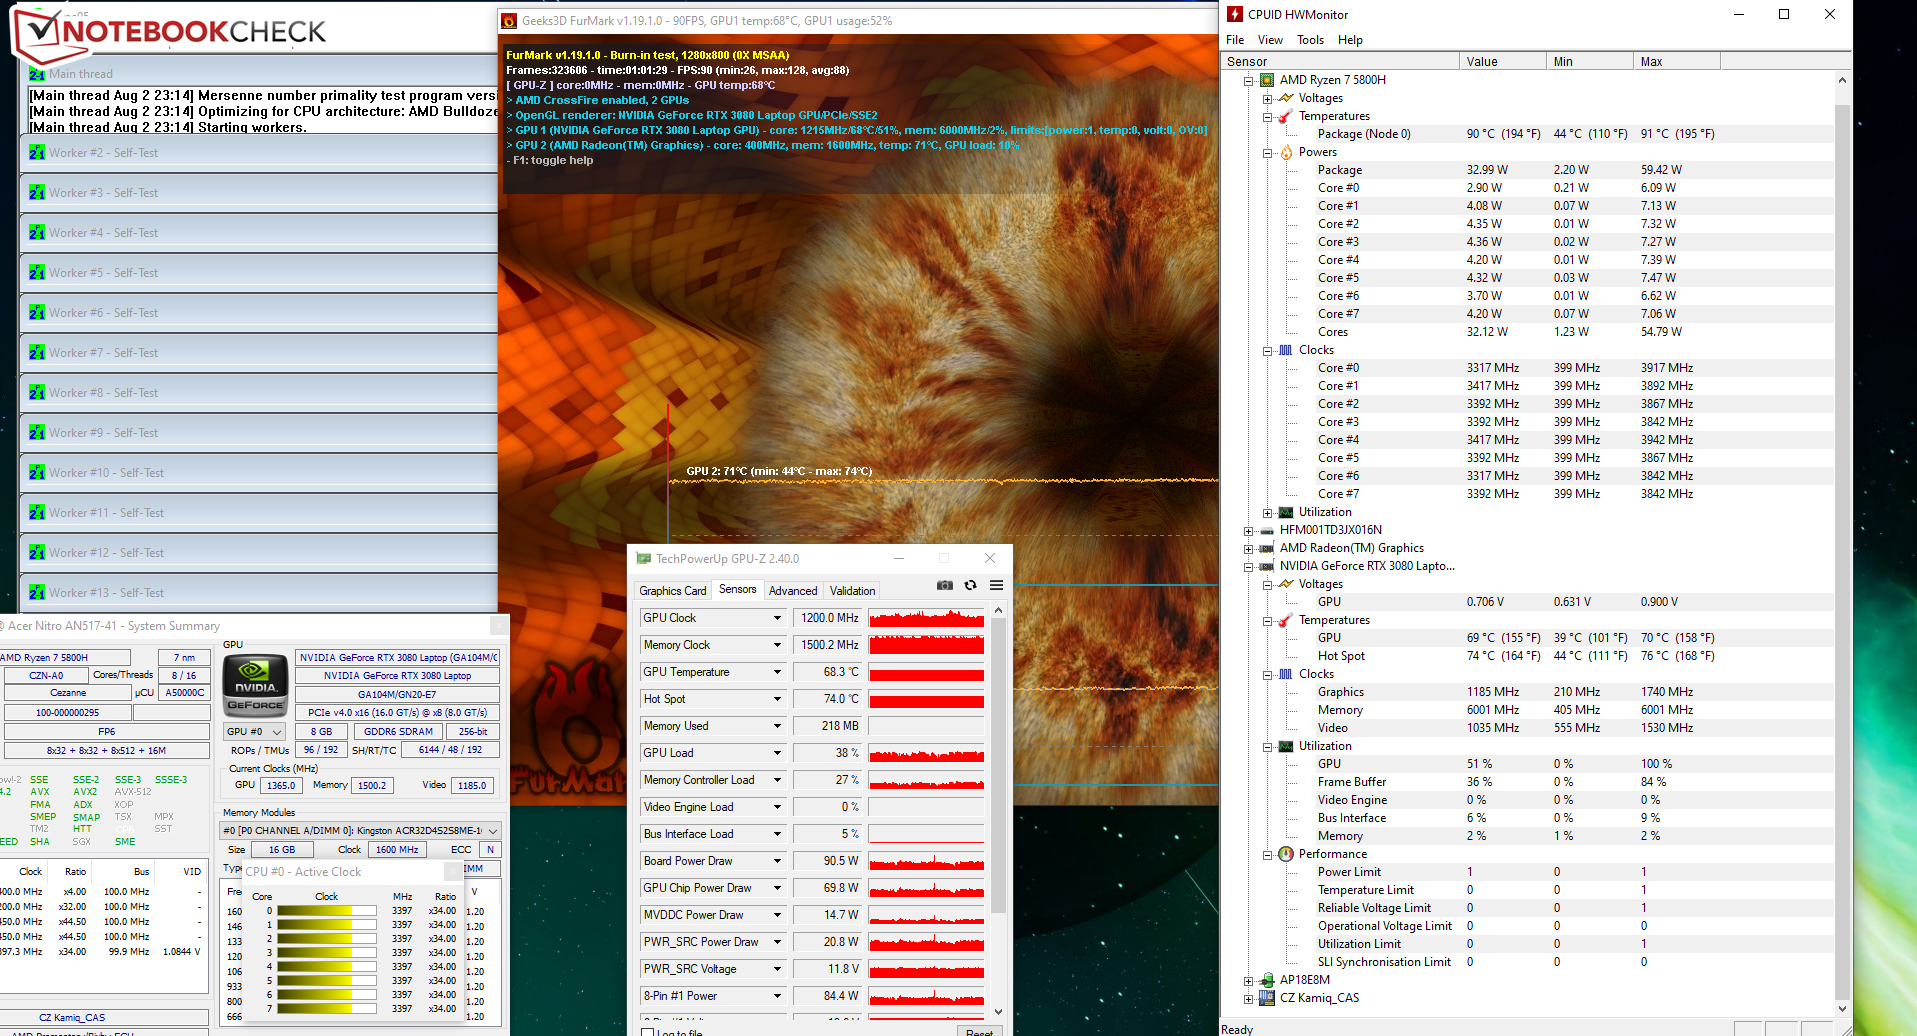
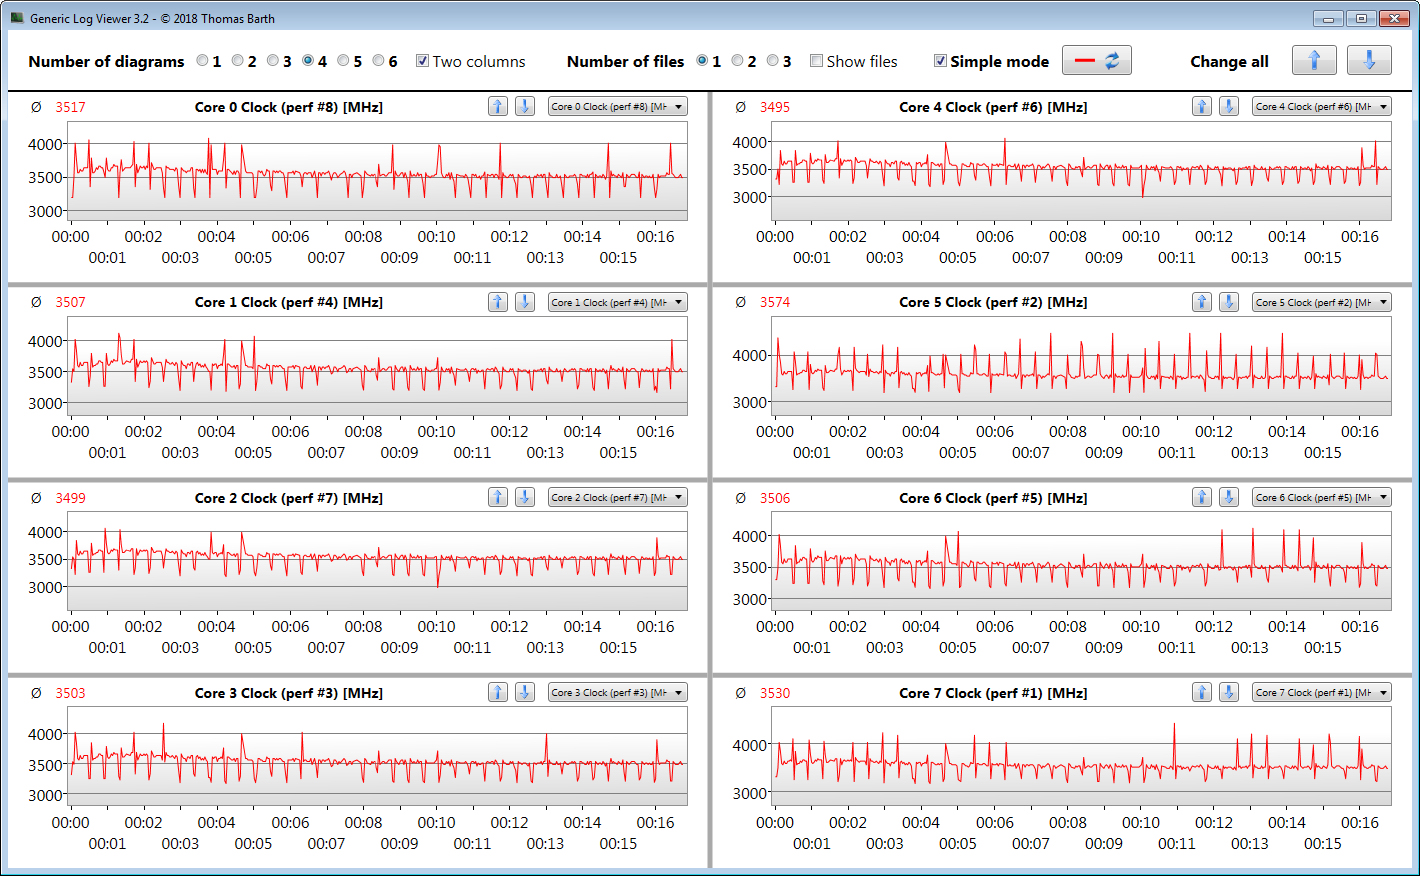
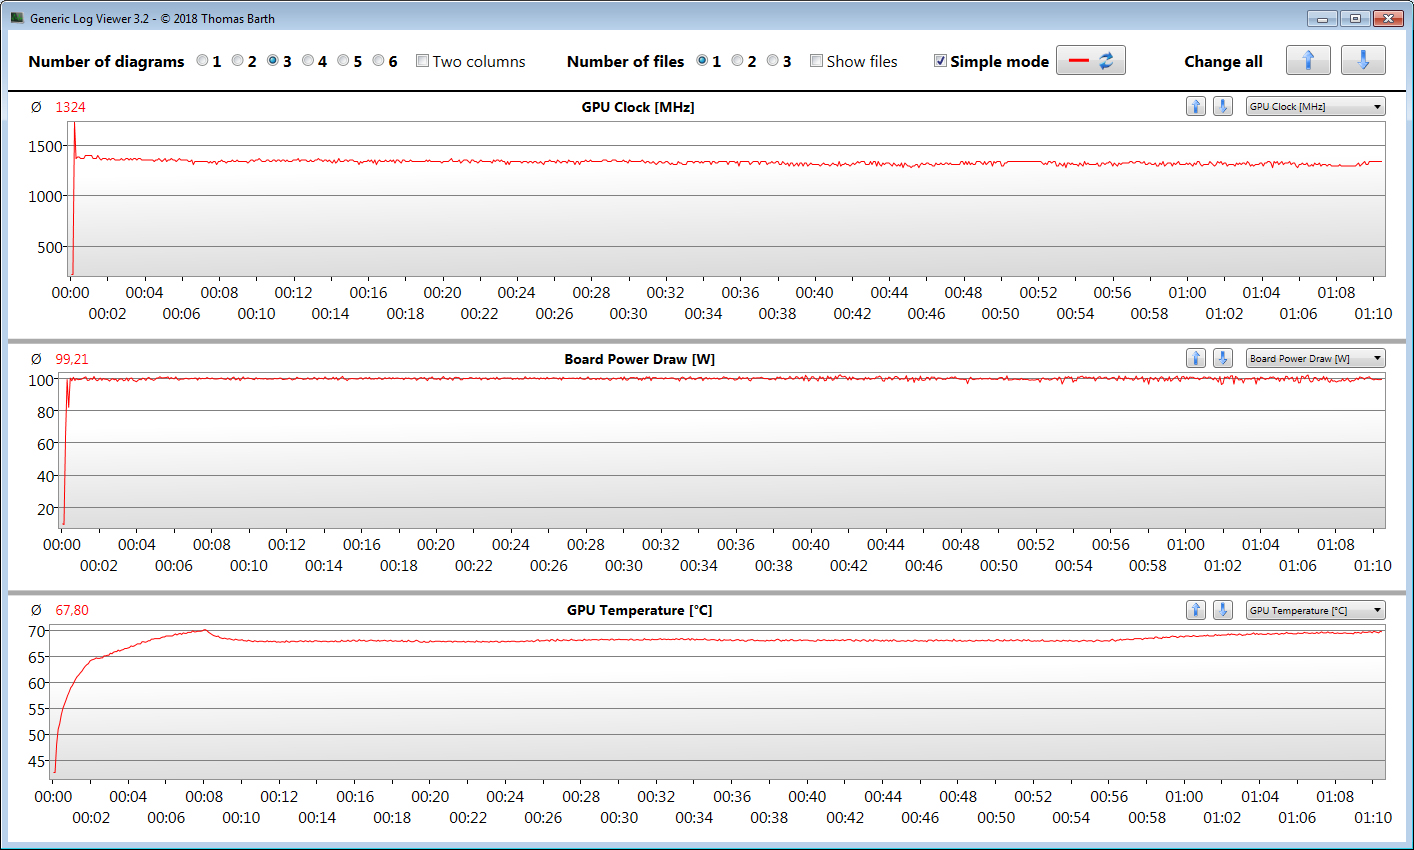
The stress test (Prime95 and FurMark run for one hour) is performed by the CPU and GPU at 3.4 GHz and 500 to 1,200 MHz, respectively. This extreme scenario is used to check whether the system runs stably under full load.
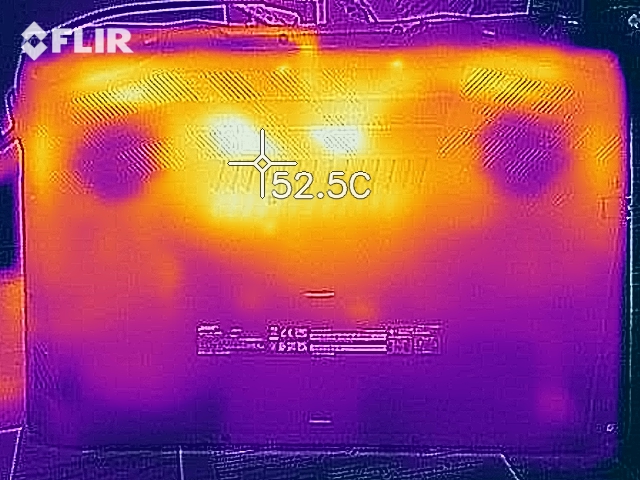
The notebook heats up noticeably under load, but not excessively. During the stress test, the 50 degree Celsius (122 Fahrenheit) mark is exceeded at two measuring points. The temperatures are within a green zone in everyday use.
(-) The maximum temperature on the upper side is 46.4 °C / 116 F, compared to the average of 40.5 °C / 105 F, ranging from 21.2 to 68.8 °C for the class Gaming.
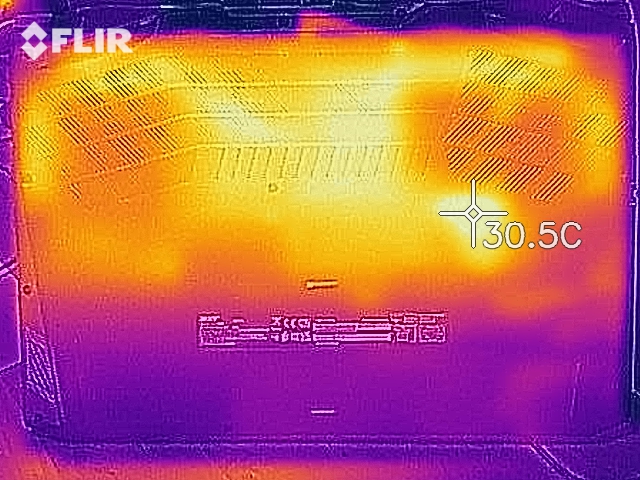
(-) The bottom heats up to a maximum of 56.5 °C / 134 F, compared to the average of 43.3 °C / 110 F
(+) In idle usage, the average temperature for the upper side is 25.6 °C / 78 F, compared to the device average of 33.9 °C / 93 F.
(+) The palmrests and touchpad are cooler than skin temperature with a maximum of 24.5 °C / 76.1 F and are therefore cool to the touch.
(+) The average temperature of the palmrest area of similar devices was 28.9 °C / 84 F (+4.4 °C / 7.9 F).
| Acer Nitro 5 AN517-41-R9S5 AMD Ryzen 7 5800H, NVIDIA GeForce RTX 3080 Laptop GPU | Acer Nitro 5 AN517-41-R5Z7 AMD Ryzen 7 5800H, NVIDIA GeForce RTX 3070 Laptop GPU | MSI GP76 Leopard 10UG Intel Core i7-10750H, NVIDIA GeForce RTX 3070 Laptop GPU | SCHENKER XMG Neo 17 (Early 2021, RTX 3070, 5800H) AMD Ryzen 7 5800H, NVIDIA GeForce RTX 3070 Laptop GPU | Medion Erazer Beast X25 AMD Ryzen 9 5900HX, NVIDIA GeForce RTX 3080 Laptop GPU | Aorus 17G YD Intel Core i7-11800H, NVIDIA GeForce RTX 3080 Laptop GPU | |
|---|---|---|---|---|---|---|
| Heat | -1% | 4% | -5% | -11% | 6% | |
| Maximum Upper Side * (°C) | 46.4 | 44 5% | 43 7% | 47 -1% | 54 -16% | 36 22% |
| Maximum Bottom * (°C) | 56.5 | 52.7 7% | 47 17% | 51 10% | 57 -1% | 52 8% |
| Idle Upper Side * (°C) | 29.4 | 32.6 -11% | 30 -2% | 32 -9% | 34 -16% | 29 1% |
| Idle Bottom * (°C) | 31.2 | 32.1 -3% | 33 -6% | 37 -19% | 35 -12% | 33 -6% |
* ... smaller is better
Speaker
Acer Nitro 5 AN517-41-R9S5 audio analysis
(±) | speaker loudness is average but good (75.5 dB)
Bass 100 - 315 Hz
(-) | nearly no bass - on average 27.4% lower than median
(±) | linearity of bass is average (11.3% delta to prev. frequency)
Mids 400 - 2000 Hz
(+) | balanced mids - only 4.1% away from median
(±) | linearity of mids is average (8.7% delta to prev. frequency)
Highs 2 - 16 kHz
(±) | higher highs - on average 6% higher than median
(+) | highs are linear (5% delta to prev. frequency)
Overall 100 - 16.000 Hz
(±) | linearity of overall sound is average (22.5% difference to median)
Compared to same class
» 80% of all tested devices in this class were better, 5% similar, 15% worse
» The best had a delta of 6%, average was 18%, worst was 132%
Compared to all devices tested
» 64% of all tested devices were better, 6% similar, 30% worse
» The best had a delta of 4%, average was 24%, worst was 134%
Power consumption
We register a maximum power consumption of 12 watts in idle - about half as much as the RTX-3070 sister model. Presumably, a background application drove the energy consumption of the sister model up. Stress test and Witcher 3 test respectively let the power consumption rise up to 152.5 watts and 132 watts on average. The following diagram illustrates the fairly constant power consumption of the notebook during the Witcher 3 test and the stress test. The power supply's nominal power is 180 watts.
| Off / Standby | |
| Idle | |
| Load |
|
Key:
min: | |
Energy absorption Witcher 3 / Stresstest
| Acer Nitro 5 AN517-41-R9S5 AMD Ryzen 7 5800H, NVIDIA GeForce RTX 3080 Laptop GPU | Acer Nitro 5 AN517-41-R5Z7 AMD Ryzen 7 5800H, NVIDIA GeForce RTX 3070 Laptop GPU | MSI GP76 Leopard 10UG Intel Core i7-10750H, NVIDIA GeForce RTX 3070 Laptop GPU | SCHENKER XMG Neo 17 (Early 2021, RTX 3070, 5800H) AMD Ryzen 7 5800H, NVIDIA GeForce RTX 3070 Laptop GPU | Medion Erazer Beast X25 AMD Ryzen 9 5900HX, NVIDIA GeForce RTX 3080 Laptop GPU | Aorus 17G YD Intel Core i7-11800H, NVIDIA GeForce RTX 3080 Laptop GPU | |
|---|---|---|---|---|---|---|
| Power Consumption | -54% | -45% | -52% | -92% | -96% | |
| Idle Minimum * (Watt) | 8.5 | 18.7 -120% | 12 -41% | 13 -53% | 22 -159% | 24 -182% |
| Idle Average * (Watt) | 11.7 | 22 -88% | 16 -37% | 16 -37% | 26 -122% | 26 -122% |
| Idle Maximum * (Watt) | 12 | 25.2 -110% | 28 -133% | 26 -117% | 34 -183% | 38 -217% |
| Load Average * (Watt) | 132 | 134.7 -2% | 92 30% | 125 5% | 120 9% | 101 23% |
| Witcher 3 ultra * (Watt) | 132 | 135 -2% | 198 -50% | 187 -42% | 189 -43% | 164 -24% |
| Load Maximum * (Watt) | 152.5 | 157 -3% | 210 -38% | 259 -70% | 231 -51% | 230 -51% |
* ... smaller is better
Battery life
The AN517-41 achieves a runtime of 5:41 h in our practical WLAN test. The load when calling up websites is mapped via a script.
Pros
Cons
Verdict - Braked Nitro
For just under 2,000 Euros (~$2359), the Nitro 5 is a well-rounded, well-equipped gaming notebook. The Ryzen 7-5800H APU, GeForce RTX-3080 Laptop GPU, 32 GB RAM (dual-channel mode, max. 64 GB) and a 1 TB SSD equip the computer for all common application areas.
The Nitro 5 takes a place at the bottom of the table among the RTX-3080 notebooks. Nevertheless, Acer has put together a well-rounded package here.
The below-average gaming performance is due to the relatively low TGP of 100 watts. Therefore, the Nitro has to compete with a nominally weaker RTX-3070 notebook like the MSI GP76 Leopard 10UG. The GPU performance can be increased via a firmware update, but the gain is only moderate. The Nitro still cannot pass the MSI GP76.
The CPU and GPU can constantly unfold their performance on a high level. The laptop heats up noticeably under load, but not excessively. The noise development is on a class-standard level. The installation of the FW update should increase the heat and noise development a bit.
The screen (FHD, IPS, 144 Hz) offers stable viewing angles, good contrast, a matte surface, short response times and decent color reproduction. Average brightness and color space coverage are too low.
An alternative to the Nitro 5 would be the comparably priced MSI GP76 Leopard 10UG. It offers a bit more GPU, but significantly less CPU performance than the Nitro 5. Furthermore, the MSI laptop only has 16 GB of RAM and a 512 GB SSD.
Price and availability
The Acer Nitro 5 AN517-41-R9S5 (Ryzen 7-5800H, GeForce RTX-3080, 32 GB RAM, 1 TB SSD, Windows 10 Home) is available for a price of 1,999 Euros (~$2358) at Cyberport.de.
Acer Nitro 5 AN517-41-R9S5
- 08/06/2021 v7 (old)
Sascha Mölck
Price comparison

