 Deutsch
 English
 Español
 Français
 Italiano
 Nederlands
 Polski
 Português
 Русский
 Türkçe
 Svenska
 Chinese
 Magyar
Medion Erazer Beast X25 (Tongfang GM7ZG8P) gaming laptop review: Light and yet powerful

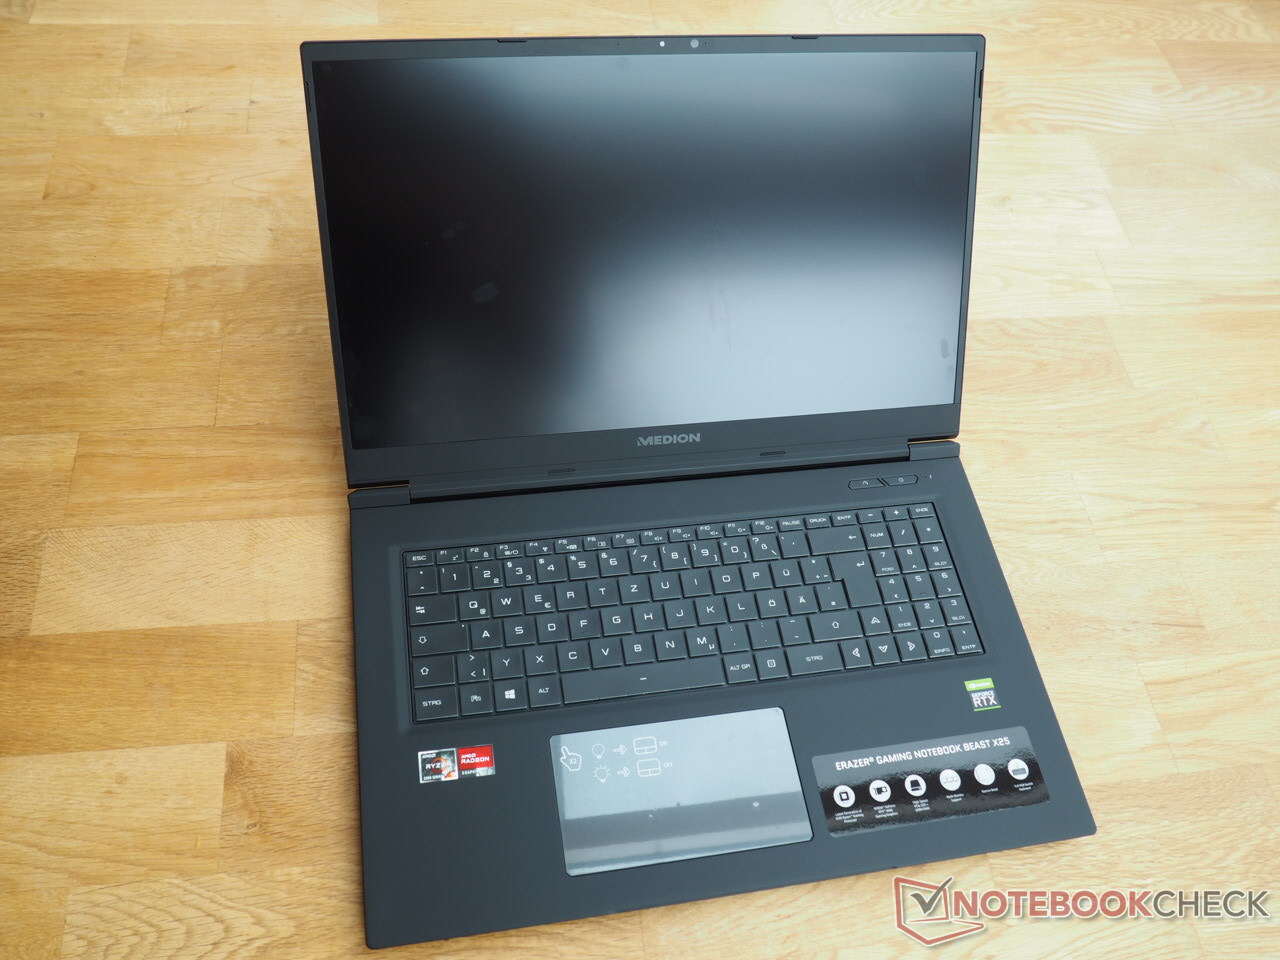
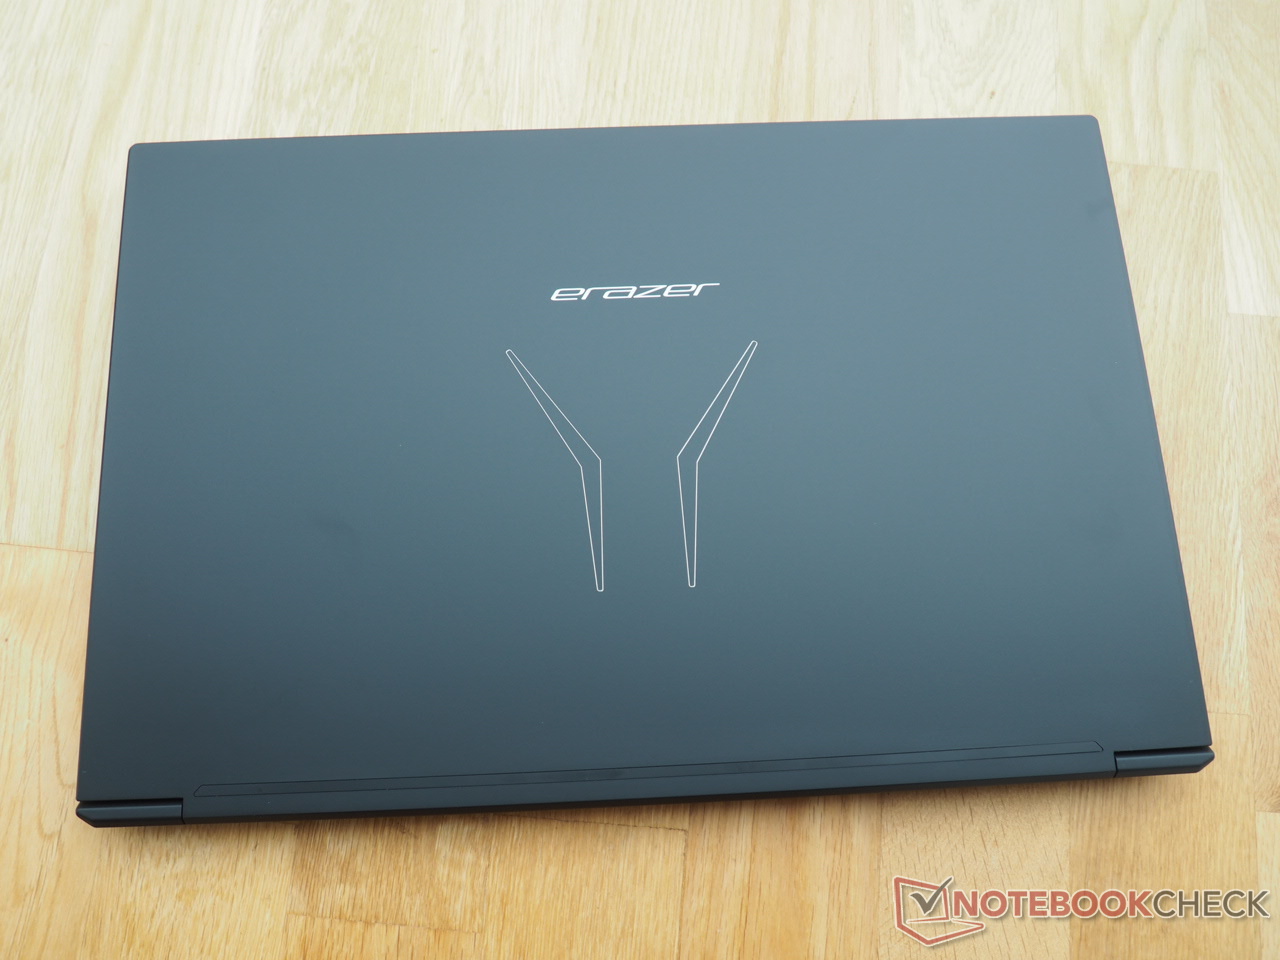
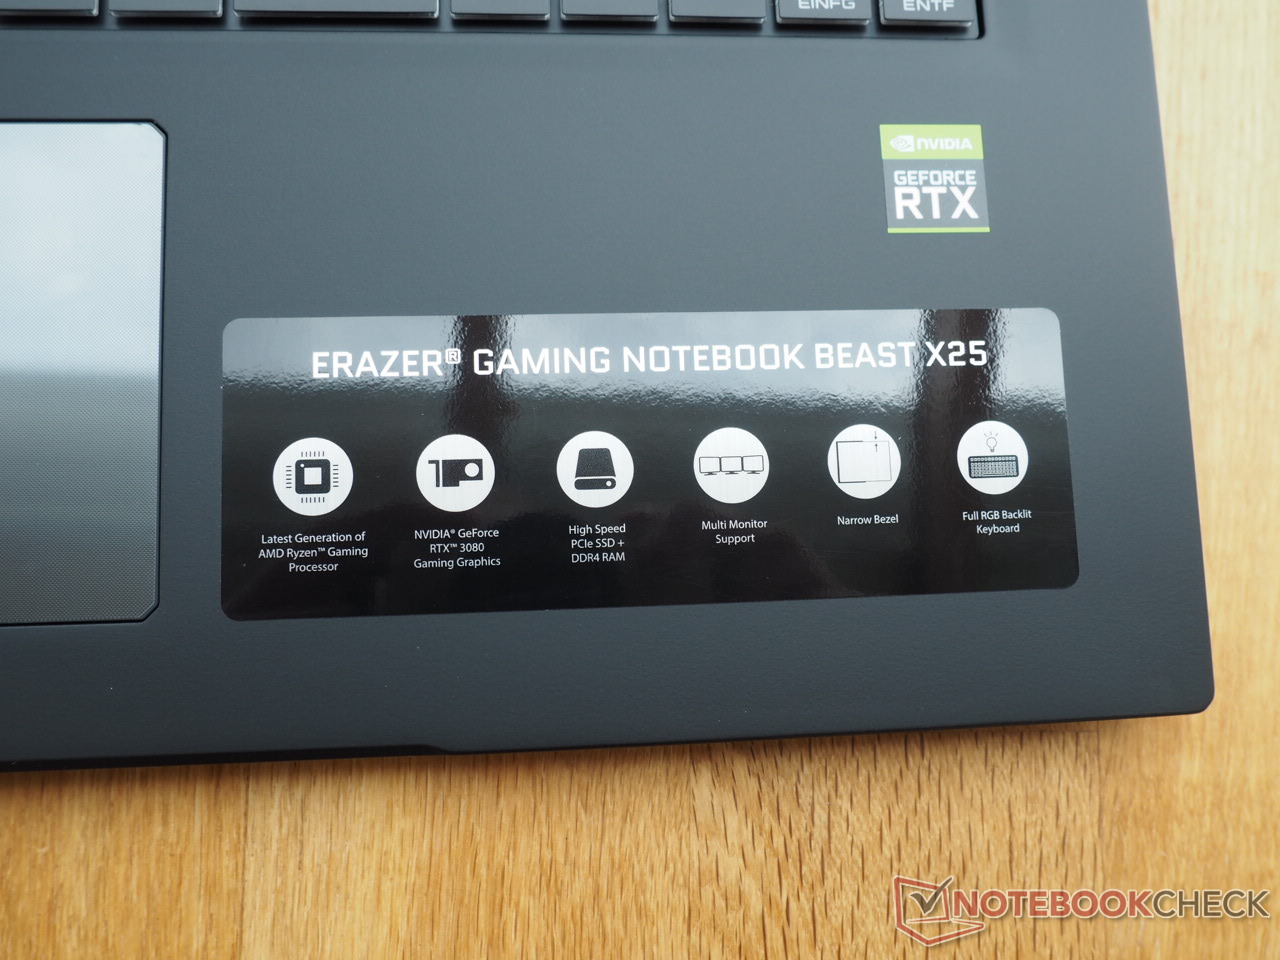
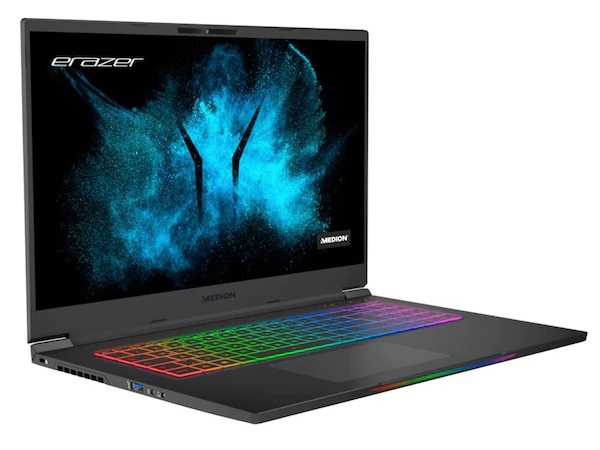
The days when high-end laptops had to be very bulky or heavy are long gone. One of the best examples for the new and considerably slimmer and lighter generation of gaming laptops is the Erazer Beast X25 from Medion, which only weighs 2.3 kg despite its 17-inch format and is also relatively thin with an overall height of 2.3 cm (2.6 cm including the case feet). This makes the 17-incher somewhat comfortable to carry around, and it doesn't take up too much space on the desk. In combination with the discreet design, the Beast X25 looks rather modest. You only notice its gaming nature when you turn it on and the keyboard's brightly colored RGB lighting is activated.
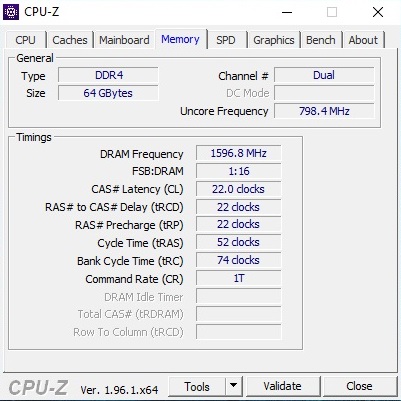
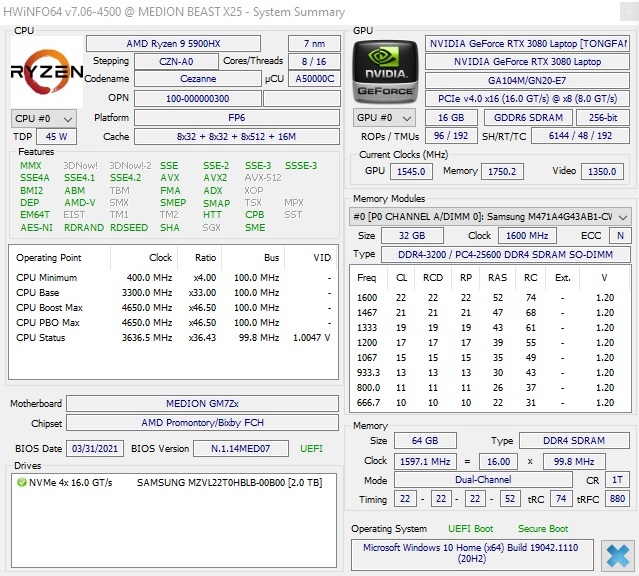
Medion puts the pedal to the metal when it comes to hardware. The AMD Ryzen 9 5900HX processor and the Nvidia GeForce RTX 3080 laptop graphics card with 16 GB of VRAM are among the fastest components available on the laptop market at the moment. In addition - as mentioned initially - there's plenty of RAM and storage. 64 GB of DDR4-3200 RAM (2x 32 GB in dual-channel mode) is just as ample as a 2 TB M.2 NVMe SSD (there's still room for another M.2 SSD if needed). In the case of our review sample, the MD63835, which costs just under 2,700 Euros (~$3,191), the configuration is rounded off by a fast 240 Hz panel with 1920x1080 pixels. Users who prefer a sharper display should be pleased with the MD62210 model, which is 200 Euros (~$236) more expensive and features a QHD display (165 Hz, 2560x1440 pixels).
The competitors of the Erazer Beast X25 include other 17-inch gaming laptops with the GeForce RTX 3080 and modern high-end CPUs, such as the Asus Strix Scar 17 G733QSA, the Asus ROG Zephyrus S17 GX703HSD, the Gigabyte Aero 17 HDR YD, and the Aorus 17G YD, all of which appear in the tables as comparison devices.
Possible contenders in comparison
Rating | Date | Model | Weight | Height | Size | Resolution | Best Price |
|---|---|---|---|---|---|---|---|
| 85 % | 07/2021 | Medion Erazer Beast X25 R9 5900HX, GeForce RTX 3080 Laptop GPU | 2.3 kg | 23 mm | 17.30" | 1920x1080 | |
| 86.6 % | 05/2021 | Asus Strix Scar 17 G733QSA-XS99 R9 5900HX, GeForce RTX 3080 Laptop GPU | 2.8 kg | 28.3 mm | 17.30" | 1920x1080 | |
| 88 % | 05/2021 | Gigabyte Aero 17 HDR YD i9-11980HK, GeForce RTX 3080 Laptop GPU | 2.8 kg | 22 mm | 17.30" | 3840x2160 | |
| 90.1 % | 07/2021 | Asus ROG Zephyrus S17 GX703HSD i9-11900H, GeForce RTX 3080 Laptop GPU | 2.8 kg | 19.9 mm | 17.30" | 2560x1440 | |
| 86 % | 06/2021 | Aorus 17G YD i7-11800H, GeForce RTX 3080 Laptop GPU | 2.8 kg | 26 mm | 17.30" | 1920x1080 |
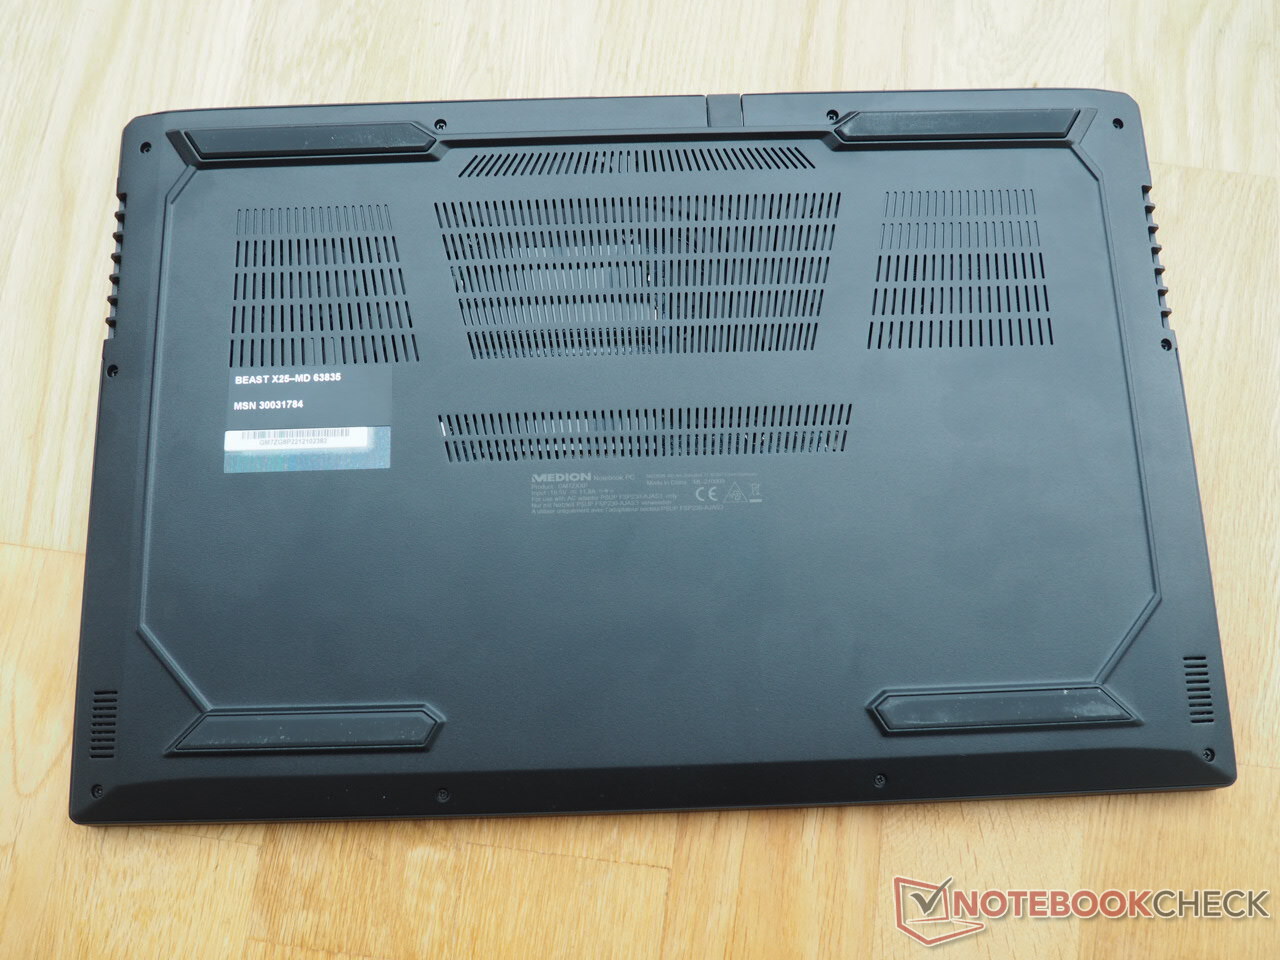
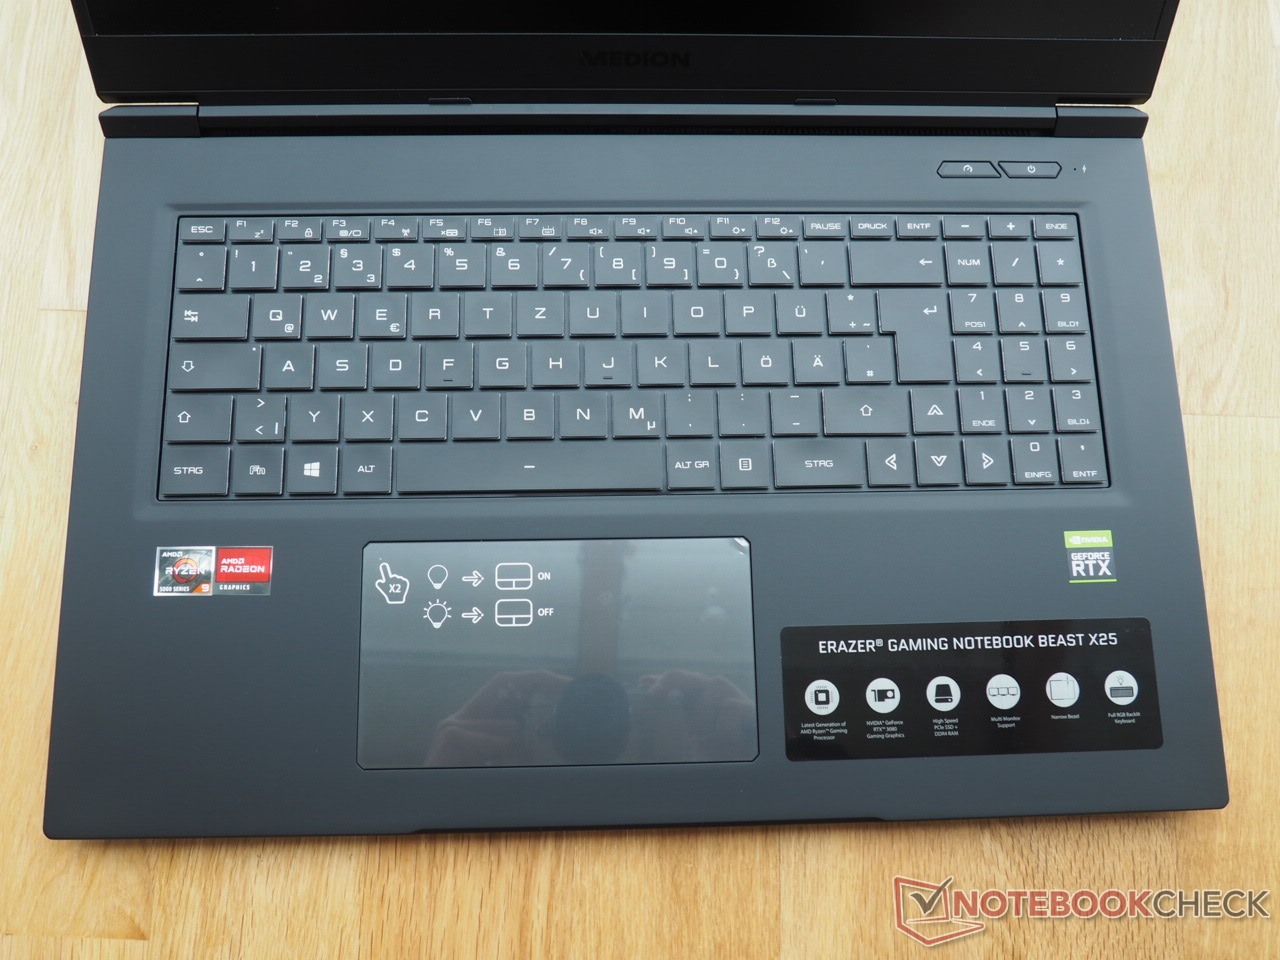
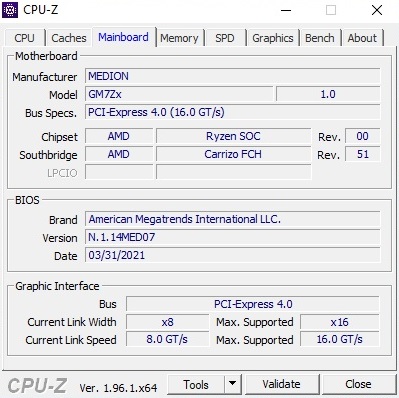
Since the chassis from Tongfang (GM7ZG8P barebone) is largely identical to the recently reviewed Erazer Beast X20 (GM7MG7P barebone), we won't go into the case, connectivity (ports, etc.), and input devices in this article. You can find the corresponding information in the linked review.
SD card reader
| SD Card Reader | |
| average JPG Copy Test (av. of 3 runs) | |
| Aorus 17G YD (AV PRO microSD 128 GB V60) | |
| Gigabyte Aero 17 HDR YD (AV PRO microSD 128 GB V60) | |
| Asus ROG Zephyrus S17 GX703HSD | |
| Average of class Gaming (19 - 202, n=100, last 2 years) | |
| Medion Erazer Beast X25 (AV PRO microSD 128 GB V60) | |
| maximum AS SSD Seq Read Test (1GB) | |
| Asus ROG Zephyrus S17 GX703HSD | |
| Aorus 17G YD (AV PRO microSD 128 GB V60) | |
| Gigabyte Aero 17 HDR YD (AV PRO microSD 128 GB V60) | |
| Average of class Gaming (25.8 - 269, n=94, last 2 years) | |
| Medion Erazer Beast X25 (AV PRO microSD 128 GB V60) | |
Communication
Webcam


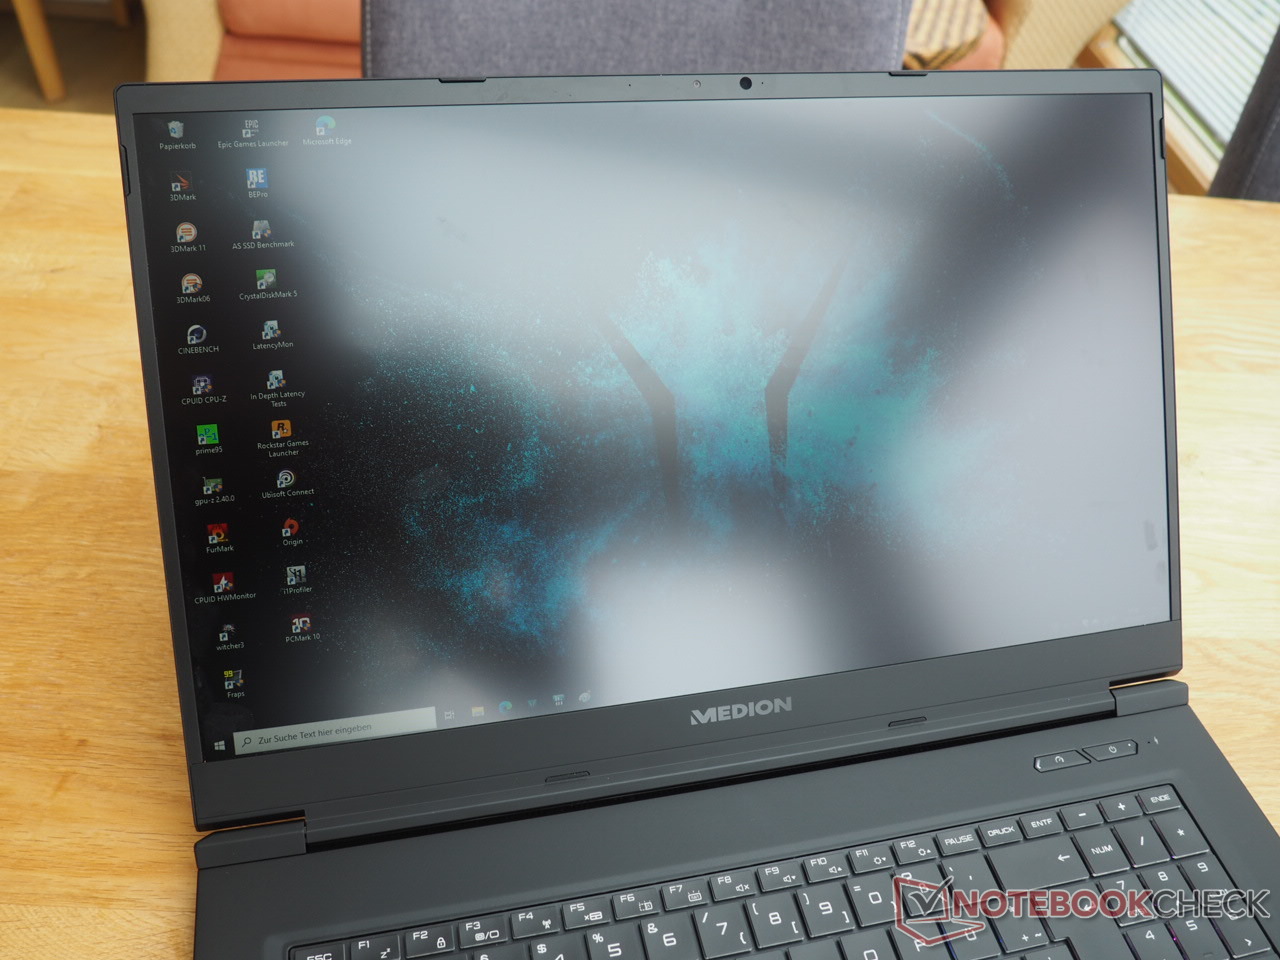
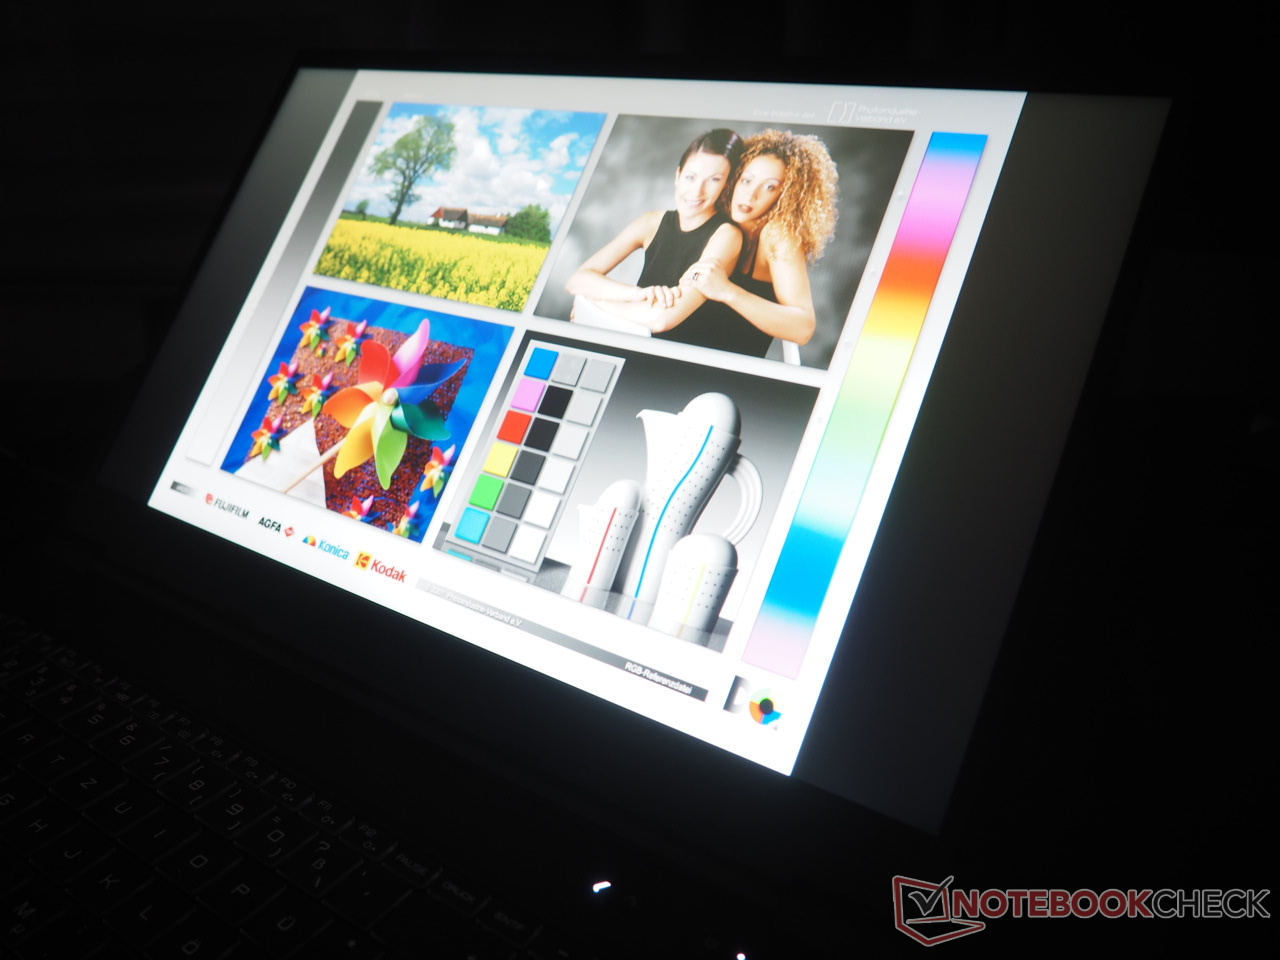
Display- 240 Hz with fast response times
The display consists of a matte IPS panel at Full HD resolution that feels very smooth in every situation thanks to its high frequency of 240 Hz. Response times are equally respectable. We were able to measure under 10 ms both when going from black to white as well as from gray to gray. Therefore, the 17-incher is also perfectly suited for particularly fast games like first-person shooters.
| |||||||||||||||||||||||||
Brightness Distribution: 88 %
Center on Battery: 329 cd/m²
Contrast: 997:1 (Black: 0.33 cd/m²)
ΔE Color 2.03 | 0.5-29.43 Ø5, calibrated: 0.82
ΔE Greyscale 3.5 | 0.57-98 Ø5.3
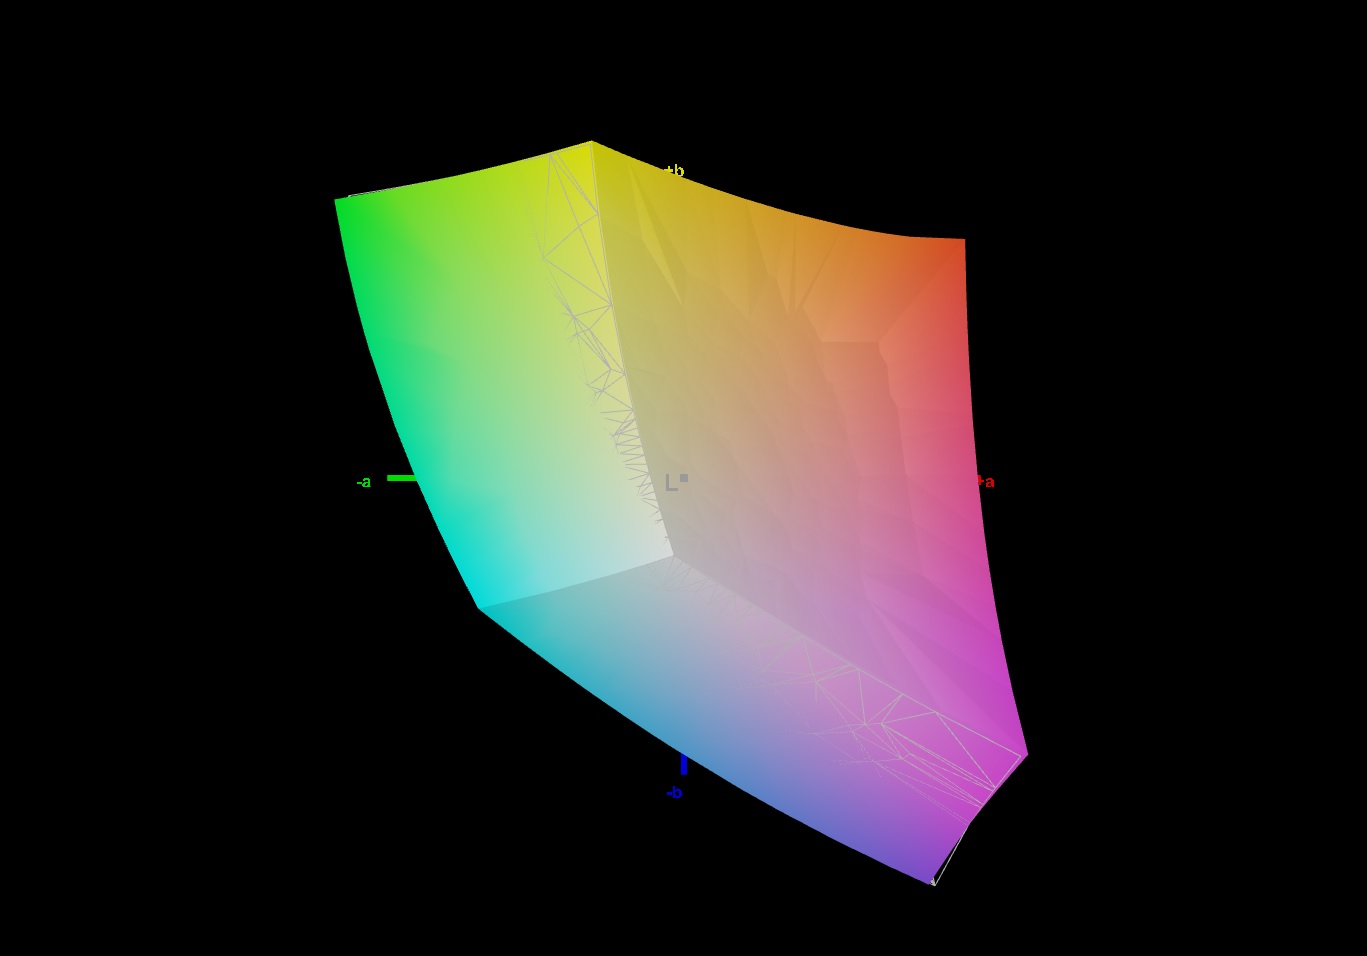
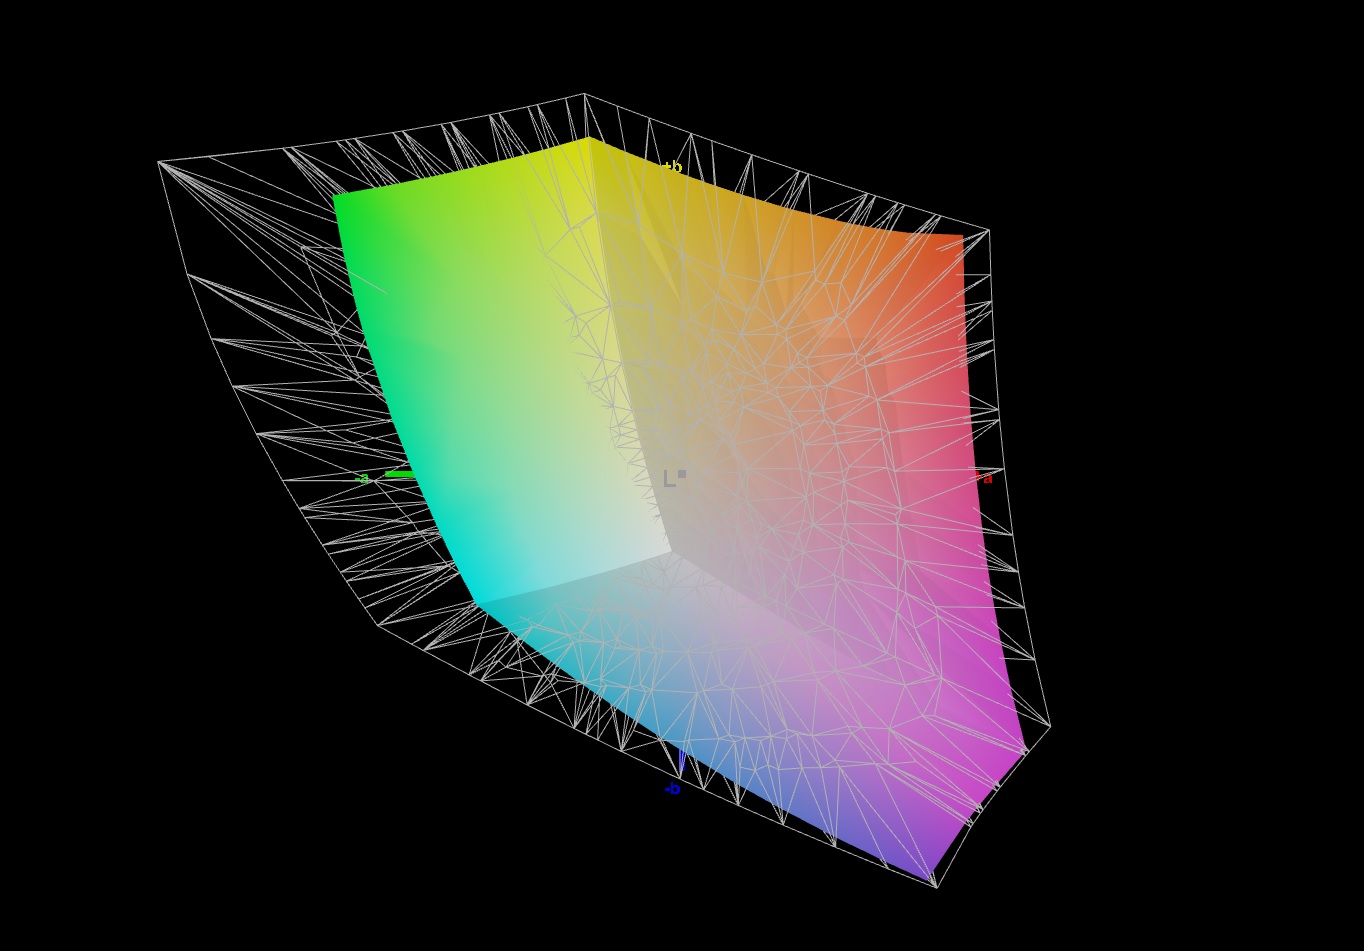
71.6% AdobeRGB 1998 (Argyll 2.2.0 3D)
99.8% sRGB (Argyll 2.2.0 3D)
70.4% Display P3 (Argyll 2.2.0 3D)
Gamma: 2.223
| Medion Erazer Beast X25 BOE NE173FHM-NZ1 (BOE0884), IPS, 1920x1080, 17.30 | Asus Strix Scar 17 G733QSA-XS99 AU Optronics B173HAN05.4, IPS, 1920x1080, 17.30 | Gigabyte Aero 17 HDR YD AU Optronics AUO329B, IPS, 3840x2160, 17.30 | Asus ROG Zephyrus S17 GX703HSD BOE099D (BOE CQ NE173QHM-NY3), IPS, 2560x1440, 17.30 | Aorus 17G YD Sharp LQ173M1JW04, IPS, 1920x1080, 17.30 | |
|---|---|---|---|---|---|
| Display | 1% | 21% | 17% | 2% | |
| Display P3 Coverage | 70.4 | 71 1% | 86.9 23% | 94.2 34% | 72.3 3% |
| sRGB Coverage | 99.8 | 99.4 0% | 100 0% | 98.7 -1% | 100 0% |
| AdobeRGB 1998 Coverage | 71.6 | 72.2 1% | 99.6 39% | 84.4 18% | 73.7 3% |
| Response Times | -33% | -415% | 3% | -56% | |
| Response Time Grey 50% / Grey 80% * | 9.2 ? | 6.6 ? 28% | 52 ? -465% | 4.8 48% | 13.6 ? -48% |
| Response Time Black / White * | 5.6 ? | 10.8 ? -93% | 26 ? -364% | 8 -43% | 9.2 ? -64% |
| PWM Frequency | |||||
| Screen | 4% | 32% | -20% | -5% | |
| Brightness middle | 329 | 303.8 -8% | 488 48% | 322 -2% | 286 -13% |
| Brightness | 315 | 292 -7% | 467 48% | 288 -9% | 282 -10% |
| Brightness Distribution | 88 | 85 -3% | 86 -2% | 72 -18% | 73 -17% |
| Black Level * | 0.33 | 0.23 30% | 0.33 -0% | 0.3 9% | 0.24 27% |
| Contrast | 997 | 1321 32% | 1479 48% | 1073 8% | 1192 20% |
| Colorchecker dE 2000 * | 2.03 | 1.87 8% | 1.23 39% | 3.05 -50% | 2.79 -37% |
| Colorchecker dE 2000 max. * | 5.5 | 3.26 41% | 2.94 47% | 5.23 5% | 6.23 -13% |
| Colorchecker dE 2000 calibrated * | 0.82 | 1.45 -77% | 0.77 6% | 1.92 -134% | 0.82 -0% |
| Greyscale dE 2000 * | 3.5 | 2.7 23% | 1.5 57% | 3.11 11% | 3.5 -0% |
| Gamma | 2.223 99% | 2.26 97% | 2.169 101% | 2.13 103% | 2.358 93% |
| CCT | 6526 100% | 6436 101% | 6614 98% | 6553 99% | 6147 106% |
| Color Space (Percent of AdobeRGB 1998) | 65.6 | 99 | 84 | 74 | |
| Color Space (Percent of sRGB) | 99.4 | 99 | 99 | 96 | |
| Total Average (Program / Settings) | -9% /
-2% | -121% /
-34% | 0% /
-9% | -20% /
-11% |
* ... smaller is better
The remaining parameters are rather unremarkable in a positive sense. A brightness value of just under 315 cd/m² should satisfy most buyers as well as a contrast ratio of around 1,000:1, even if the competition manages a bit more contrast. Meanwhile, the color-space coverage of 99.8% (sRGB) and 71.6% (AdobeRGB), respectively, is on par with the competition. Only the 4K panel of the Gigabyte Aero 17 HDR YD manages to clearly stand out in this category (99.6% AdobeRGB).
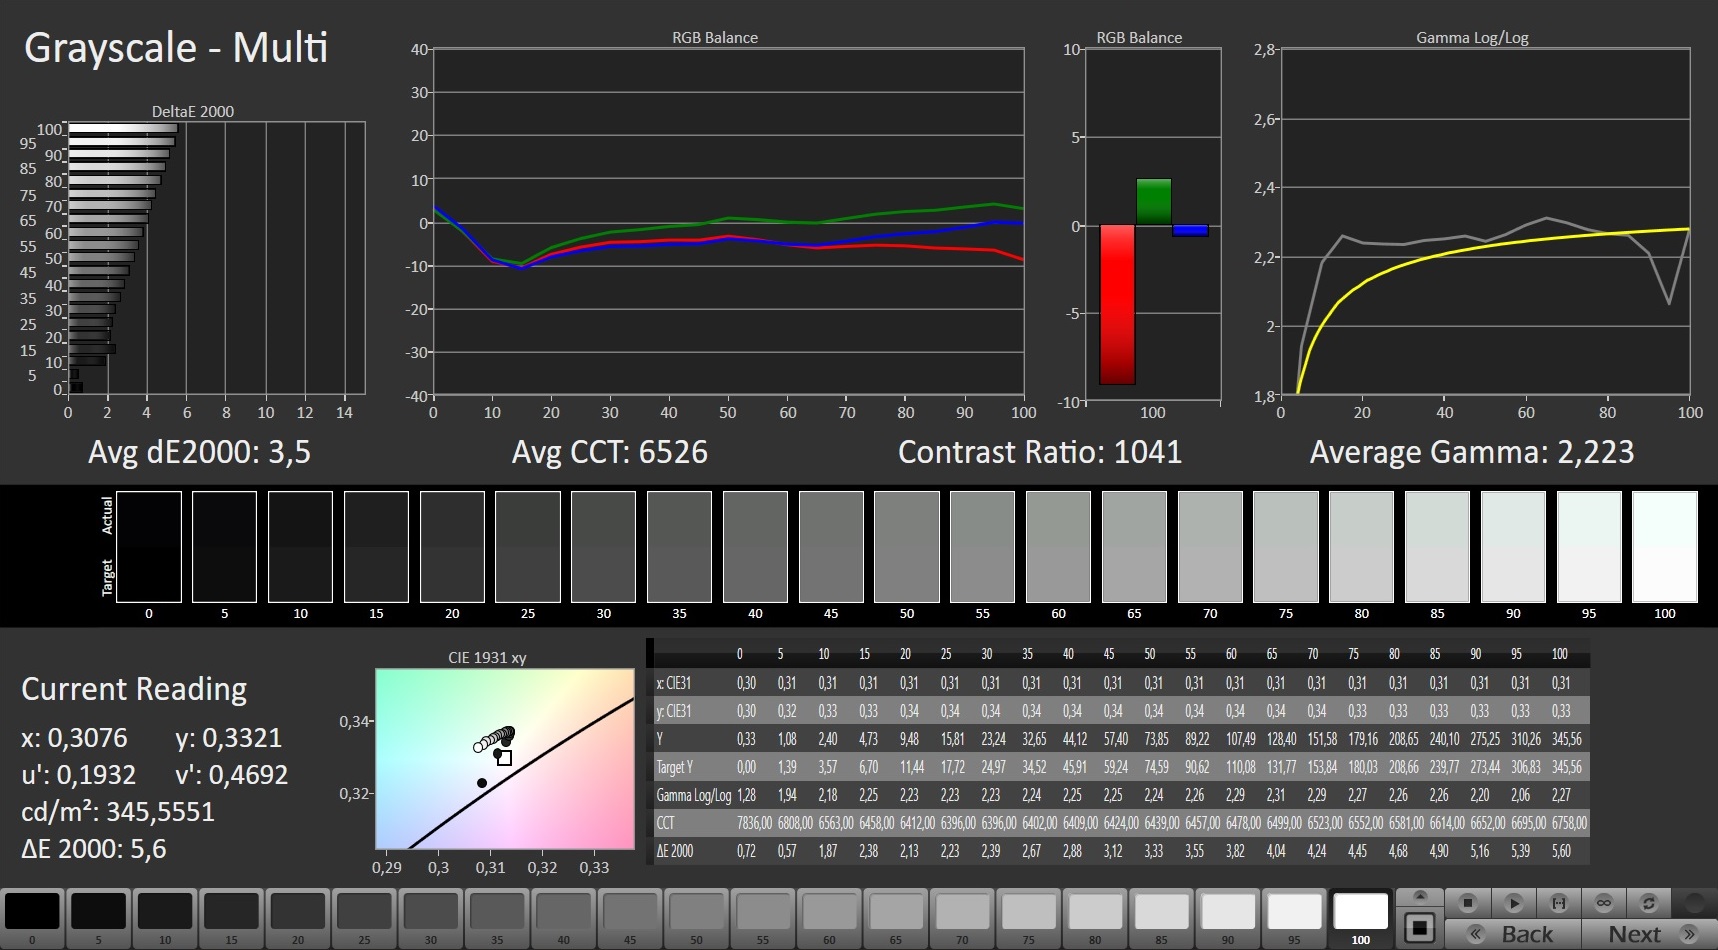
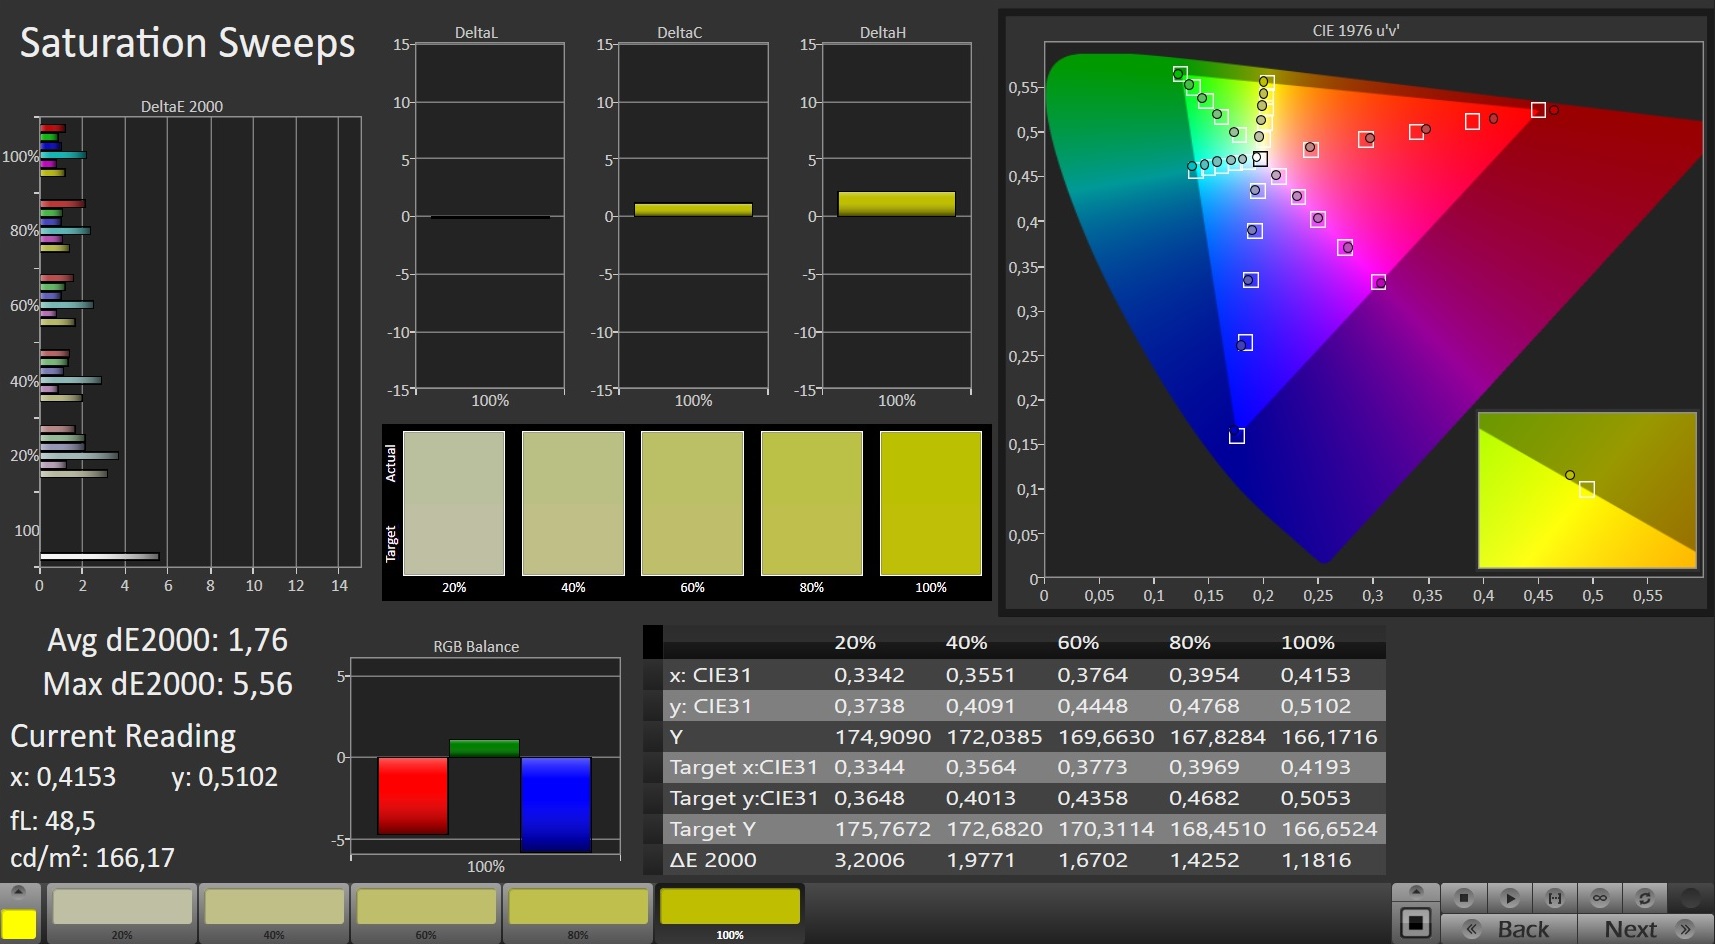
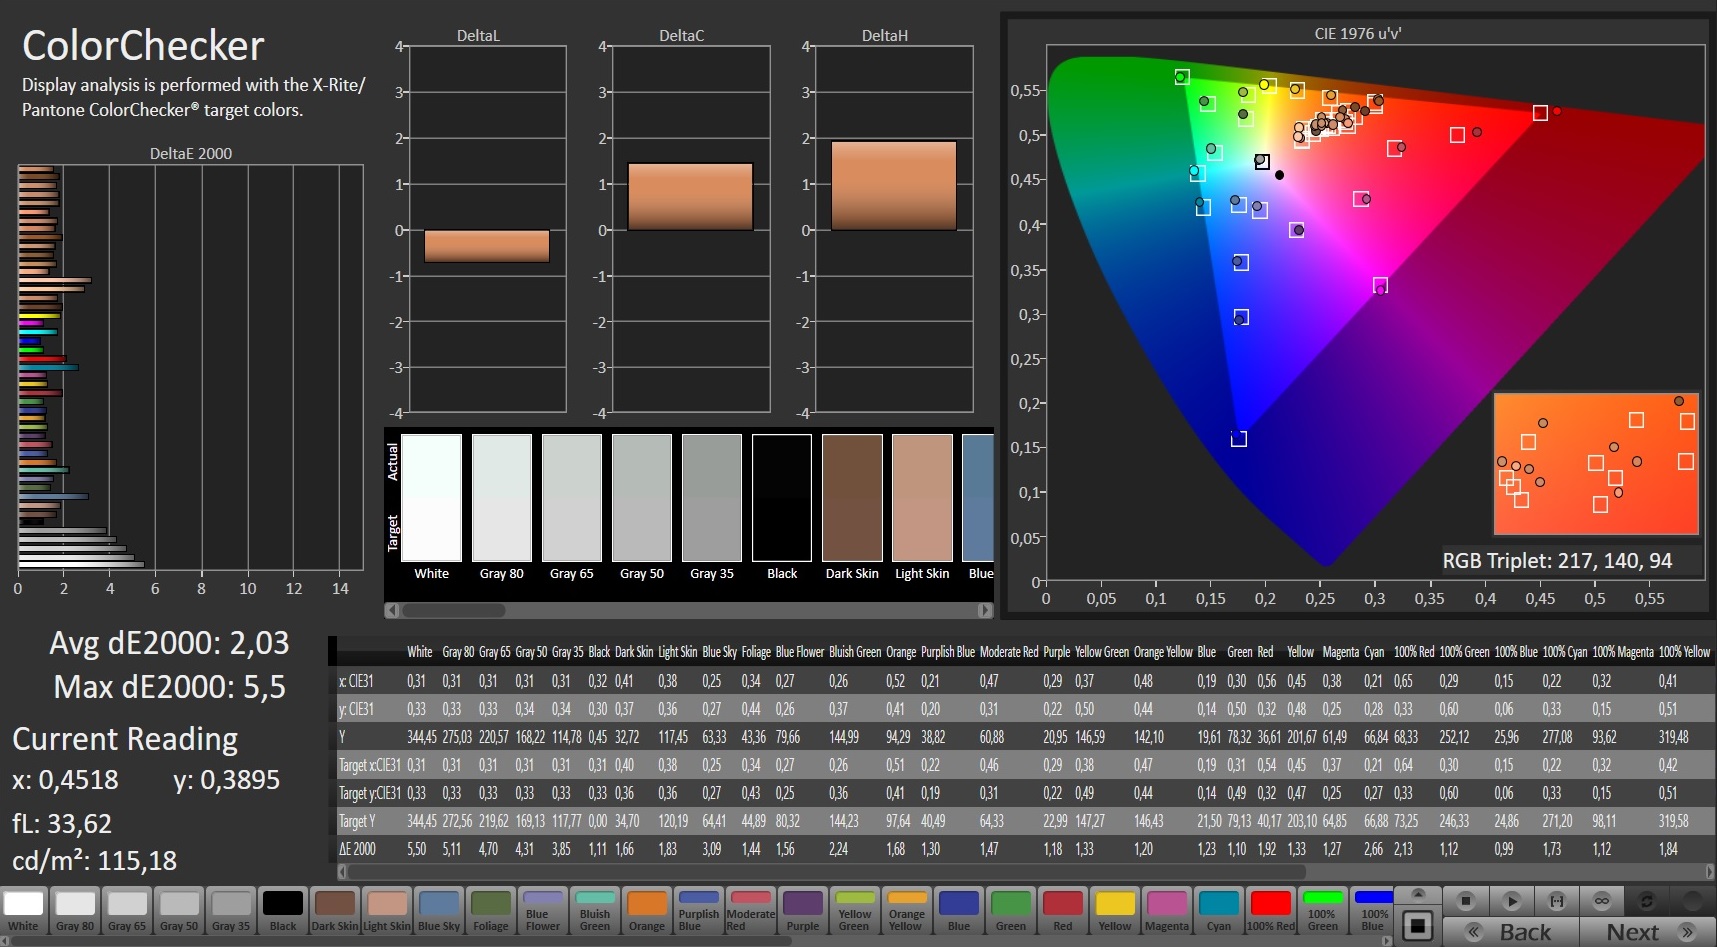
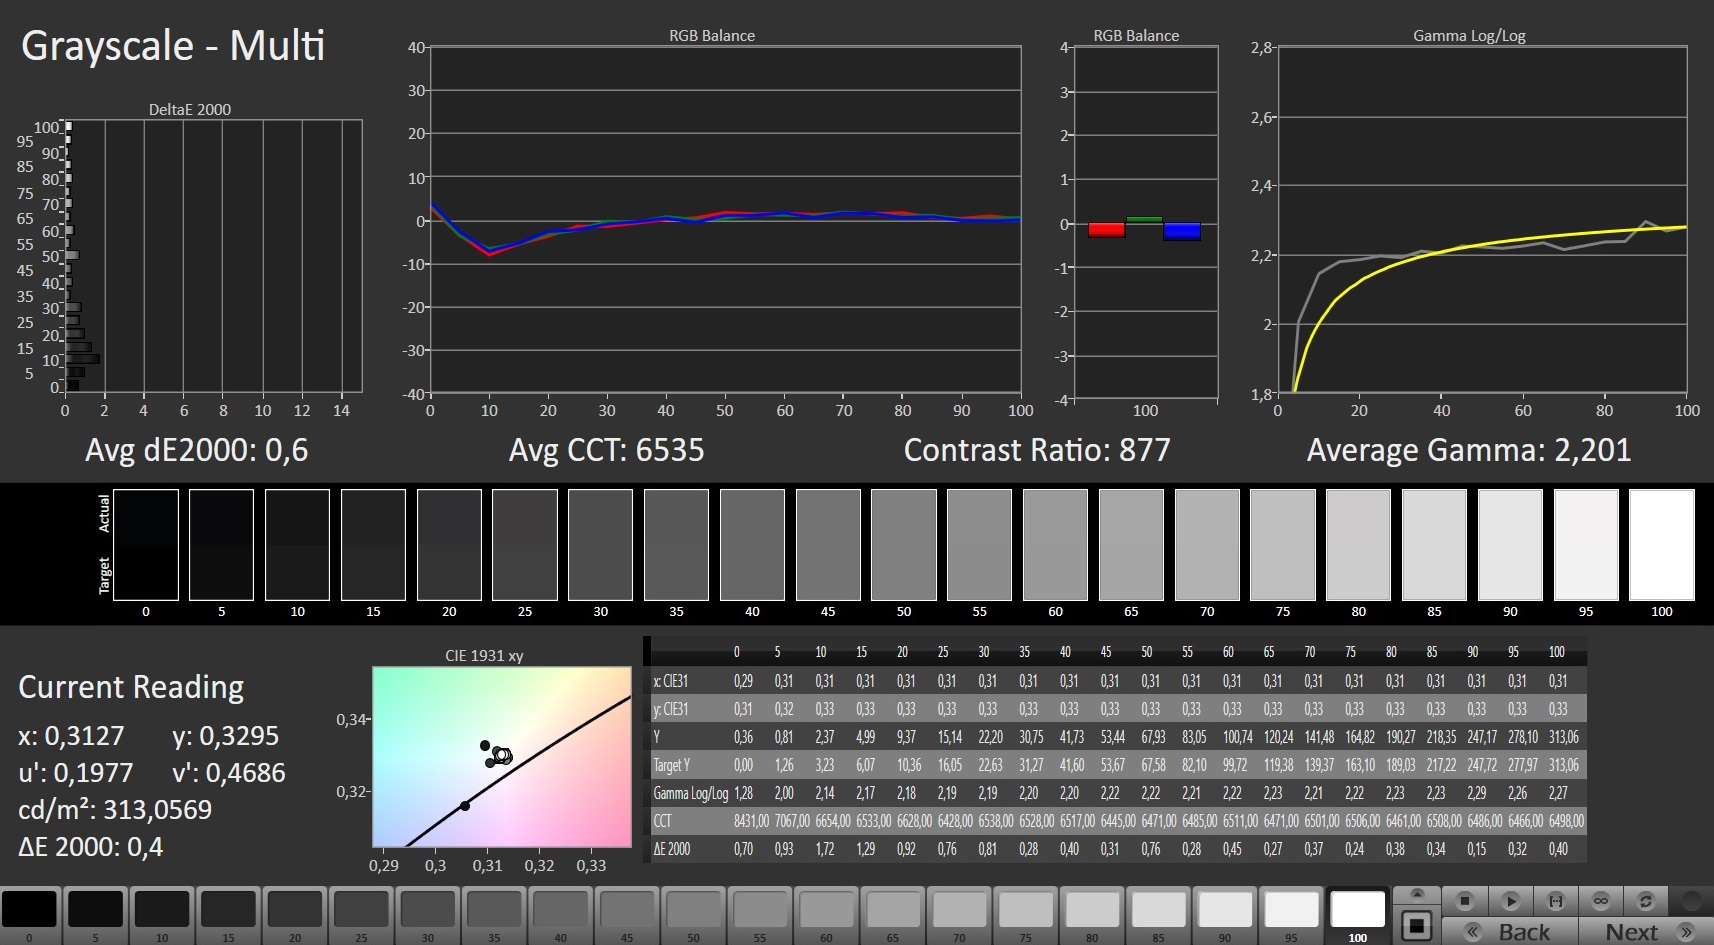

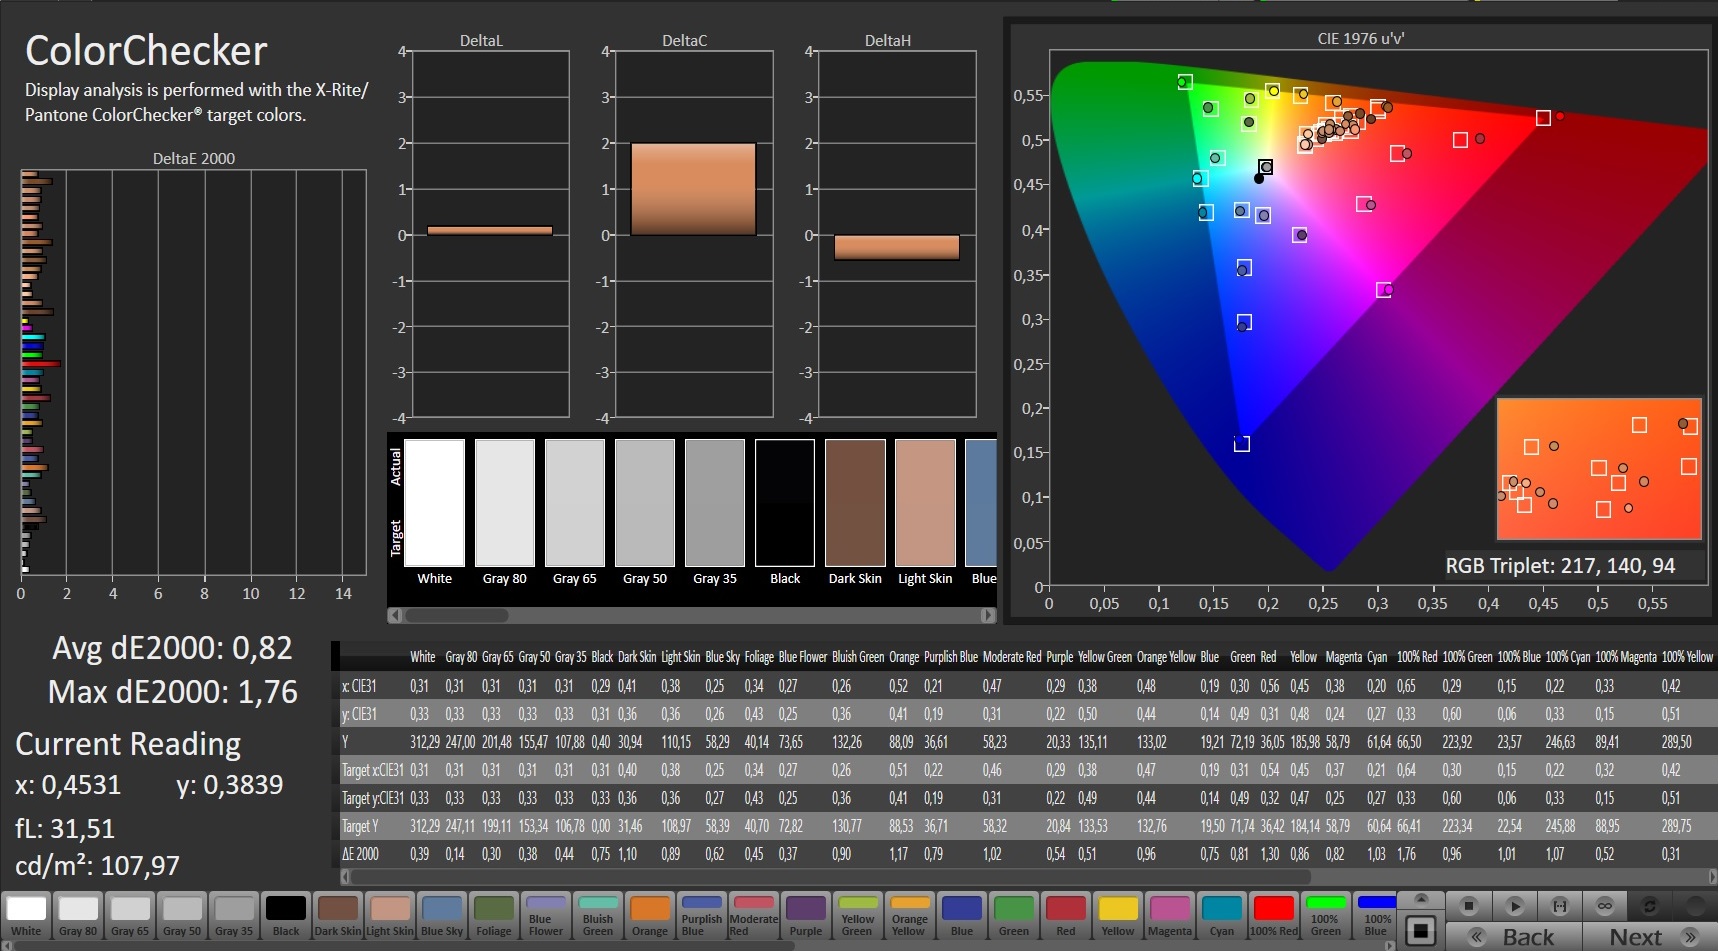
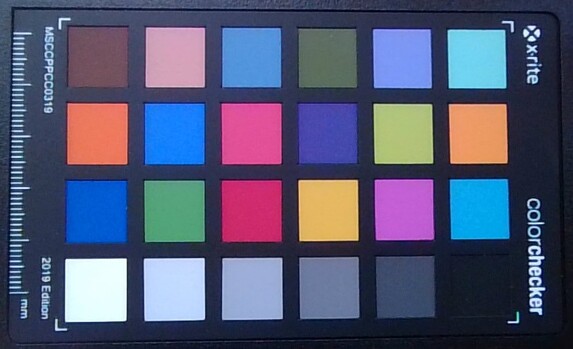
In regards to color accuracy, the Beast X25 cuts a fine figure. In the Calman measuring software's ColorChecker test, the DeltaE 2000 value stays within the ideal range with an average of 2.03 (maximum 3), and even better values can be achieved through calibration. Our corresponding ICC file is linked further above next to the brightness distribution chart. As is typical for IPS panels, there's nothing to complain about in terms of viewing-angle stability, either.
At most, the Full HD panel reveals weaknesses when used outdoors. Although brightness is usually sufficient in the shade, you'll find yourself wishing for a higher brightness in sunny places.
Display Response Times
| ↔ Response Time Black to White | ||
|---|---|---|
| 5.6 ms ... rise ↗ and fall ↘ combined | ↗ 2.8 ms rise | 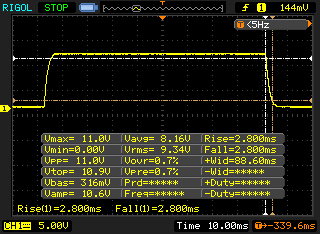 |
| ↘ 2.8 ms fall | ||
| The screen shows very fast response rates in our tests and should be very well suited for fast-paced gaming. In comparison, all tested devices range from 0.1 (minimum) to 240 (maximum) ms. » 13 % of all devices are better. This means that the measured response time is better than the average of all tested devices (21.5 ms). | ||
| ↔ Response Time 50% Grey to 80% Grey | ||
| 9.2 ms ... rise ↗ and fall ↘ combined | ↗ 4.8 ms rise | 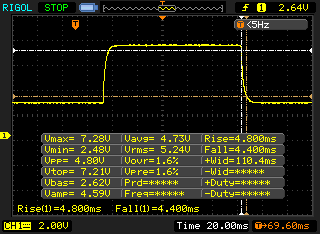 |
| ↘ 4.4 ms fall | ||
| The screen shows fast response rates in our tests and should be suited for gaming. In comparison, all tested devices range from 0.2 (minimum) to 636 (maximum) ms. » 18 % of all devices are better. This means that the measured response time is better than the average of all tested devices (33.7 ms). | ||
Screen Flickering / PWM (Pulse-Width Modulation)
| Screen flickering / PWM not detected | 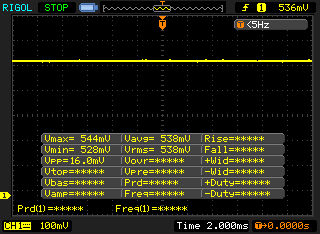 | ||
In comparison: 53 % of all tested devices do not use PWM to dim the display. If PWM was detected, an average of 17900 (minimum: 5 - maximum: 3846000) Hz was measured. | |||
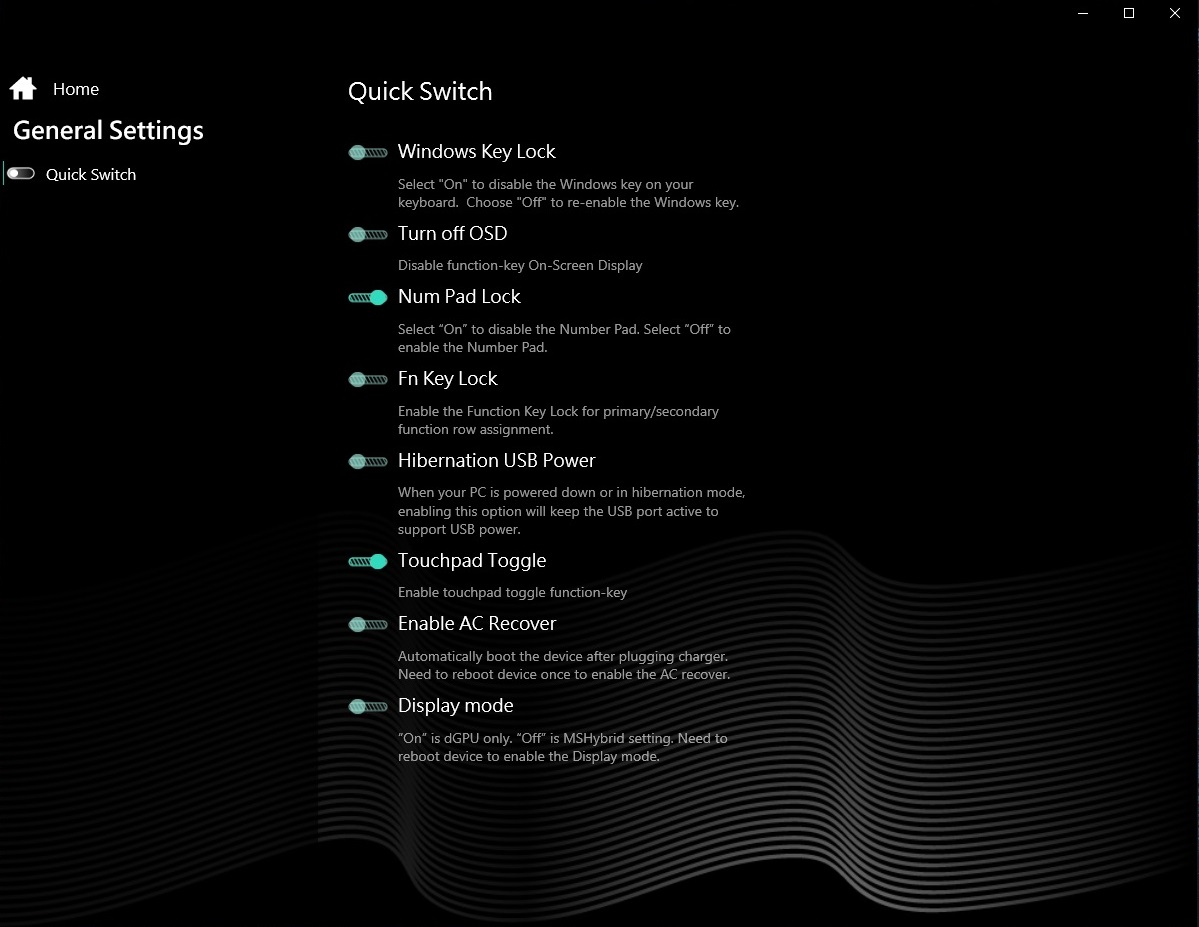
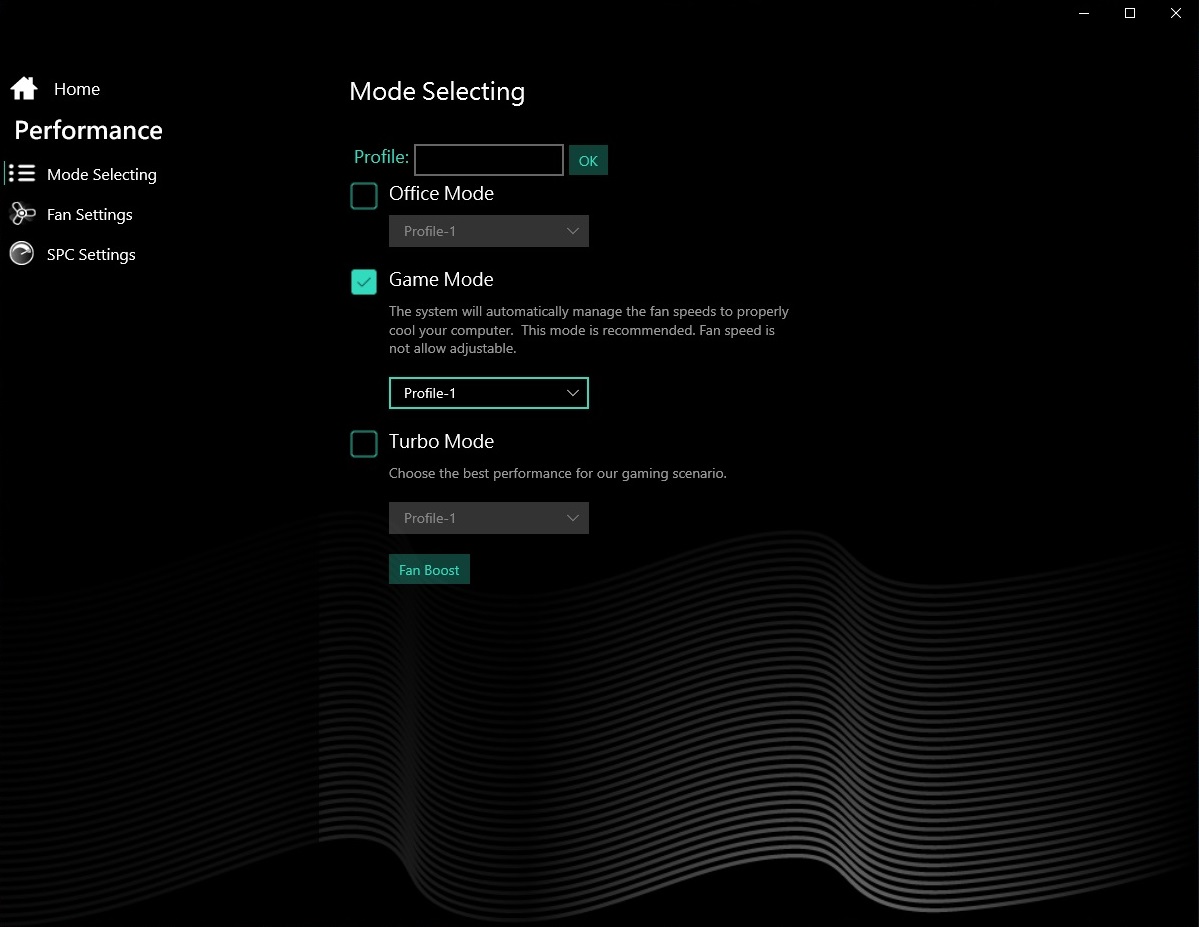
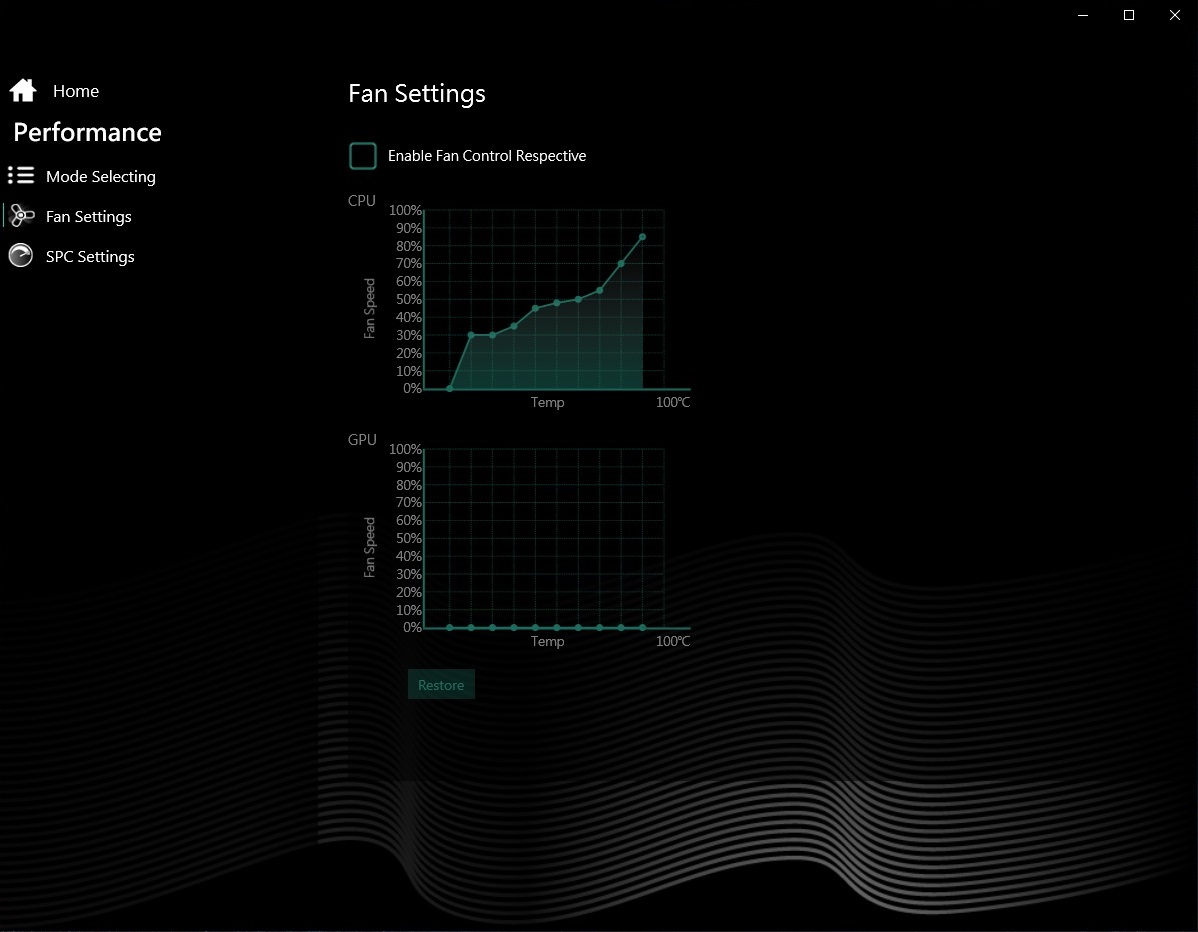
Test conditions - Many options in the Control Center
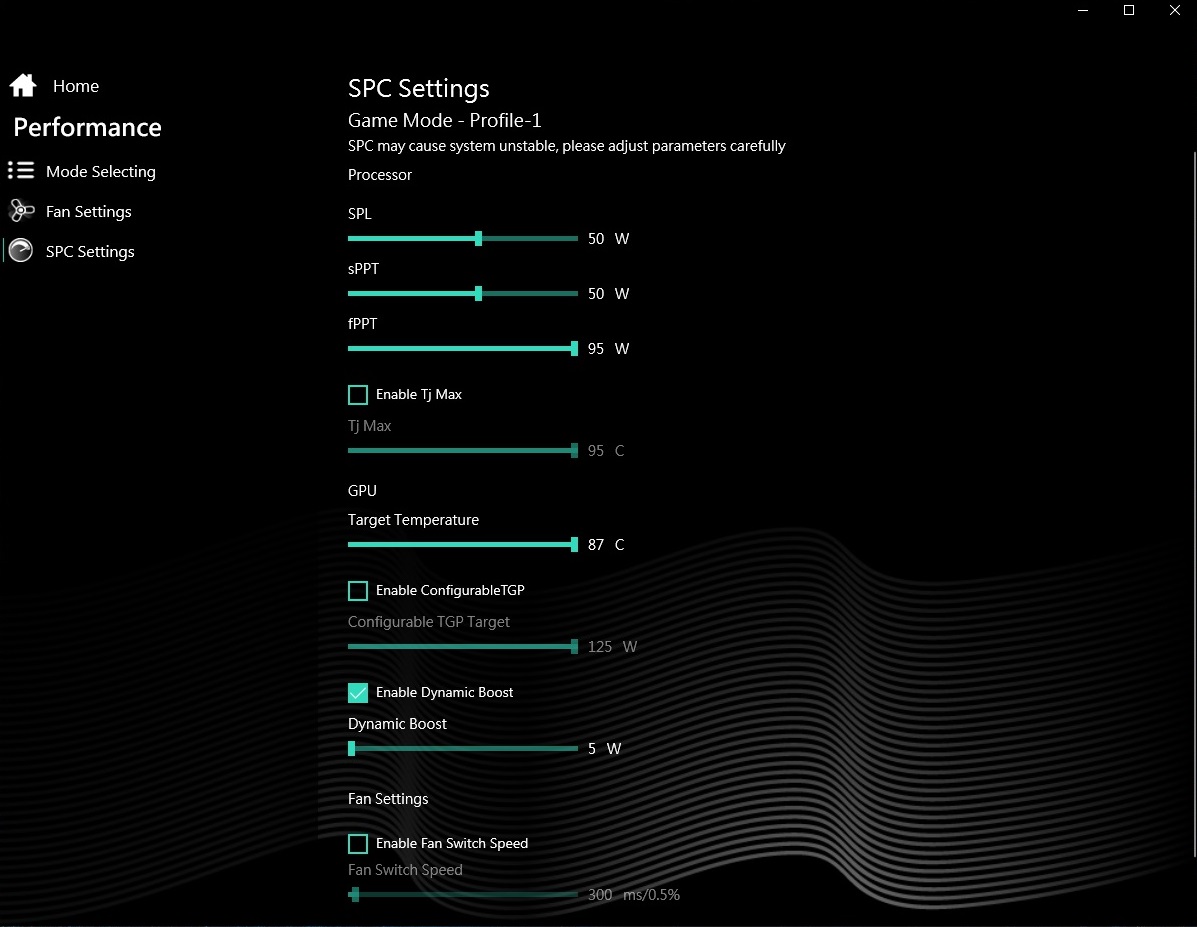
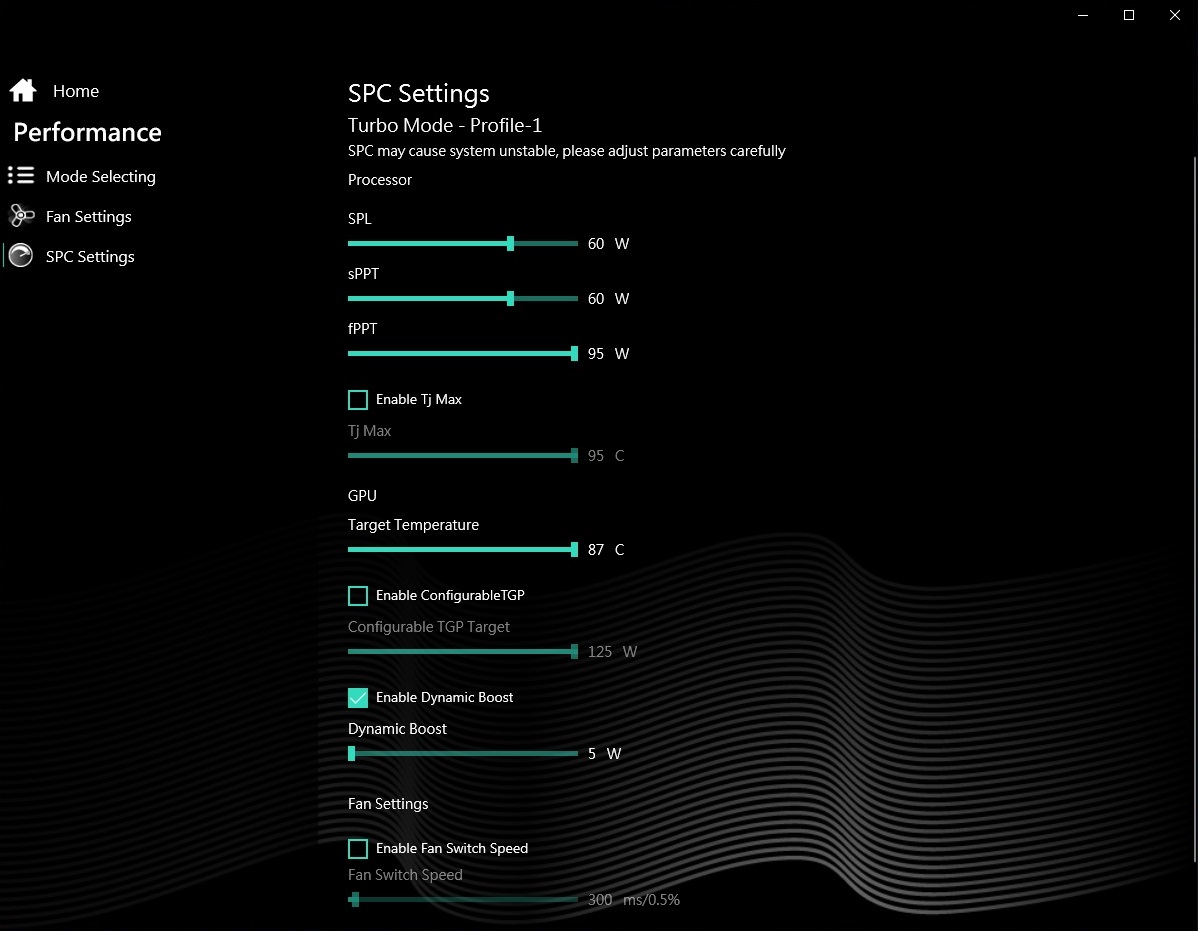
Barebone manufacturer Tongfang deserves great praise for the comprehensive Control Center. The preinstalled tool can be used to adjust an extremely large number of system settings. For example, you can (de)activate the Optimus graphics-switching function or change the performance profile.
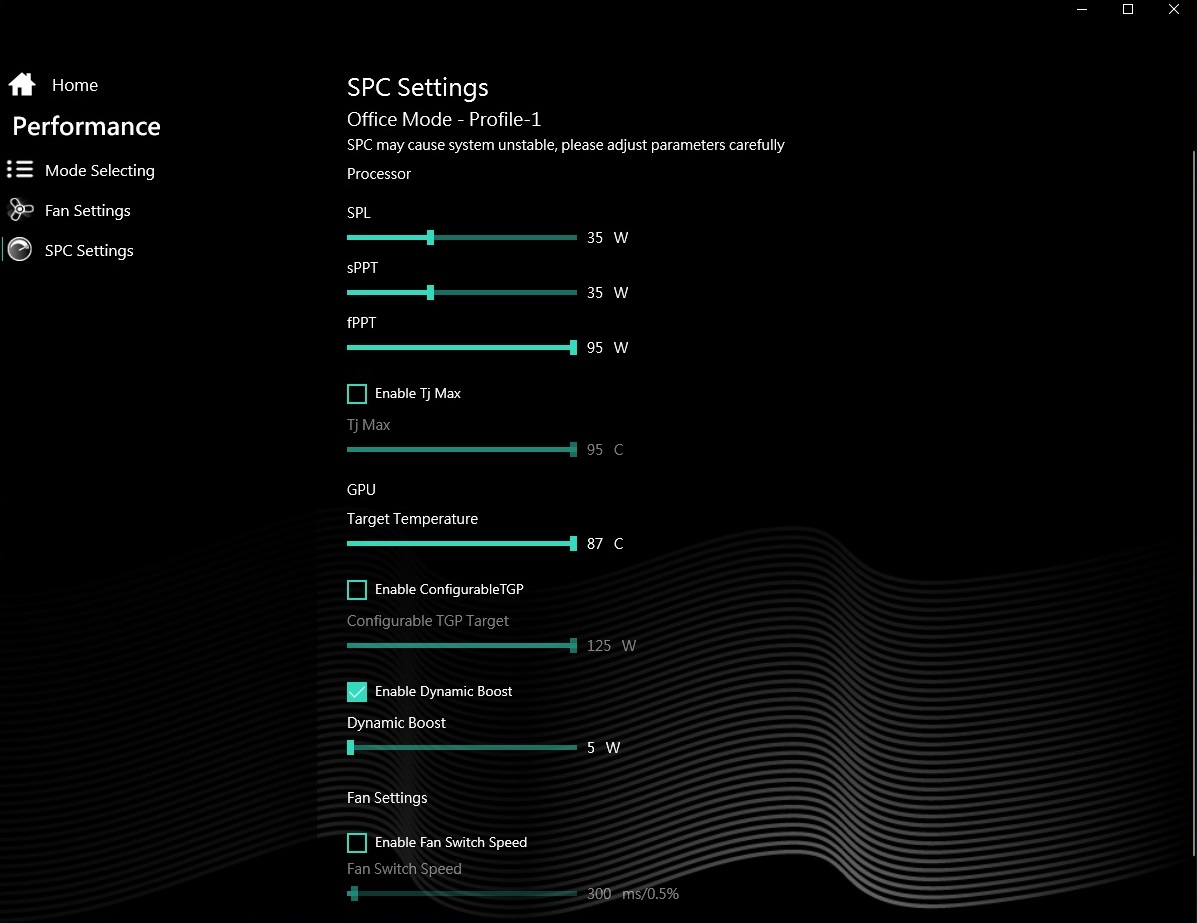
Our tests were all carried out using the Optimus technology and the "Game" performance mode. The latter provides the CPU with 50 watts and sets the graphics card's TGP to 130 watts (125 watts + 5 watts Dynamic Boost). If you want to squeeze even more performance out of the 17-incher, you can increase Dynamic Boost to a maximum of 15 watts, which results in a total of 140 watts. The standard settings of the other two modes, "Office" and "Turbo", can be seen in the following screenshots. An interesting fact: According to the Nvidia driver and Medion's homepage, the graphics card could even go up to a TGP of 165 watts. However, this value was not selectable in our test device.
Performance - AMD meets Nvidia
If you care a lot about future-proofing, the Medion Erazer Beast X25 is the perfect companion. 64 GB of RAM and 2 TB of SSD storage are not a given even in the gaming segment. Many competitors have to make do with 16 to 32 GB and a 500 to 1,000 GB SSD. Appropriately, Medion installs the strongest mobile Nvidia GPU available at the time and one of the most powerful mobile AMD CPUs.
Processor
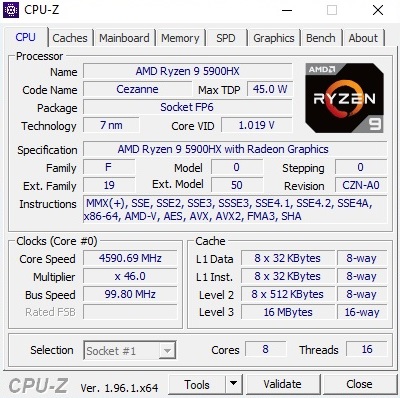
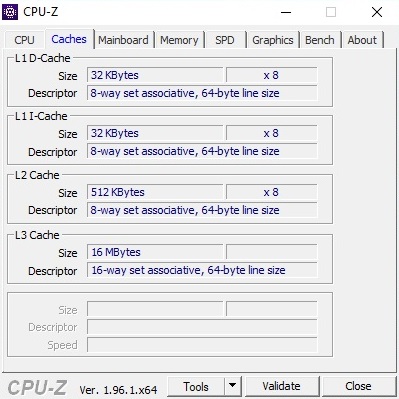
The Ryzen 9 5900HX is an extremely powerful octa-core model that comes with 16 MB of L3 cache and can process up to 16 threads in parallel using SMT. At 45 watts, the TDP is similar to the Intel competition, but AMD uses a slightly finer manufacturing process (7 nm vs. 10 nm @Tiger Lake).
* ... smaller is better
On paper, the clock rate ranges from 3.3 to a maximum of 4.6 GHz. In our Cinebench R15 test, the CPU reached 3.6 to 4.6 GHz under single-core load and an average of 3.7 GHz when all cores were under load. This value is a bit poor for a Ryzen 9 5900HX. The Asus Strix Scar 17 G733QSA, which is also equipped with the 5900HX, delivers better benchmark results in a direct comparison. Performance is more in line with laptops based on the Intel Core i7-11800H or the Core i9-11980H(K). The Beast X25 should be able to outperform the Intel competition when using Turbo mode or manually increasing the CPU values in the Control Center program.
Cinebench R15 Multi endurance test
Based on the graph above, you can see that the CPU performance remains quite constant even after several runs, and it doesn't show any major drops.
System performance
Probably due to the comparatively weak SSD results, the Erazer ranks last in our test field when it comes to the system tests. Nonetheless, the laptop scores points with a very high system speed, which stands out with quick boot, load, and response times, among other things.
| PCMark 10 / Score | |
| Average of class Gaming (5235 - 9852, n=197, last 2 years) | |
| Asus ROG Zephyrus S17 GX703HSD | |
| Asus Strix Scar 17 G733QSA-XS99 | |
| Average AMD Ryzen 9 5900HX, NVIDIA GeForce RTX 3080 Laptop GPU (6807 - 7416, n=6) | |
| Gigabyte Aero 17 HDR YD | |
| Aorus 17G YD | |
| Medion Erazer Beast X25 | |
| PCMark 10 / Essentials | |
| Average of class Gaming (8300 - 12334, n=196, last 2 years) | |
| Asus ROG Zephyrus S17 GX703HSD | |
| Asus Strix Scar 17 G733QSA-XS99 | |
| Aorus 17G YD | |
| Average AMD Ryzen 9 5900HX, NVIDIA GeForce RTX 3080 Laptop GPU (10018 - 10593, n=6) | |
| Gigabyte Aero 17 HDR YD | |
| Medion Erazer Beast X25 | |
| PCMark 10 / Productivity | |
| Average of class Gaming (6662 - 11833, n=196, last 2 years) | |
| Asus Strix Scar 17 G733QSA-XS99 | |
| Average AMD Ryzen 9 5900HX, NVIDIA GeForce RTX 3080 Laptop GPU (8546 - 10066, n=6) | |
| Aorus 17G YD | |
| Medion Erazer Beast X25 | |
| Asus ROG Zephyrus S17 GX703HSD | |
| Gigabyte Aero 17 HDR YD | |
| PCMark 10 / Digital Content Creation | |
| Average of class Gaming (6462 - 18475, n=196, last 2 years) | |
| Asus ROG Zephyrus S17 GX703HSD | |
| Gigabyte Aero 17 HDR YD | |
| Aorus 17G YD | |
| Average AMD Ryzen 9 5900HX, NVIDIA GeForce RTX 3080 Laptop GPU (9377 - 10582, n=6) | |
| Asus Strix Scar 17 G733QSA-XS99 | |
| Medion Erazer Beast X25 | |
| PCMark 10 Score | 6842 points | |
Help | ||
DPC latencies
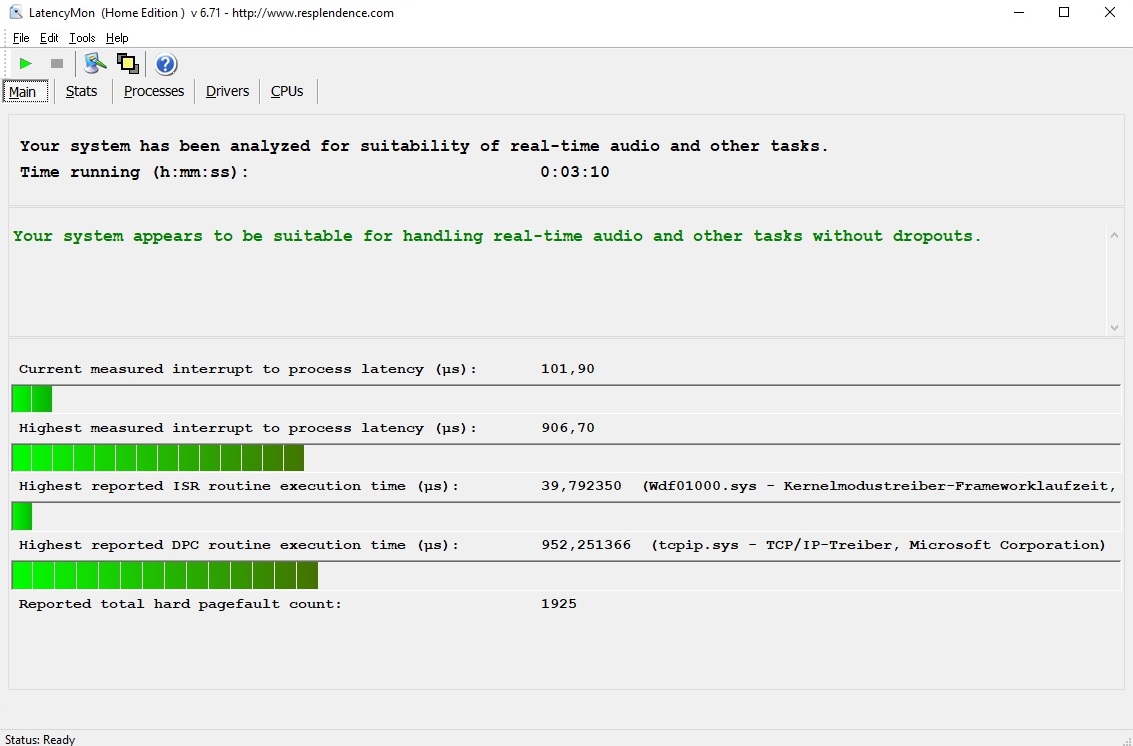
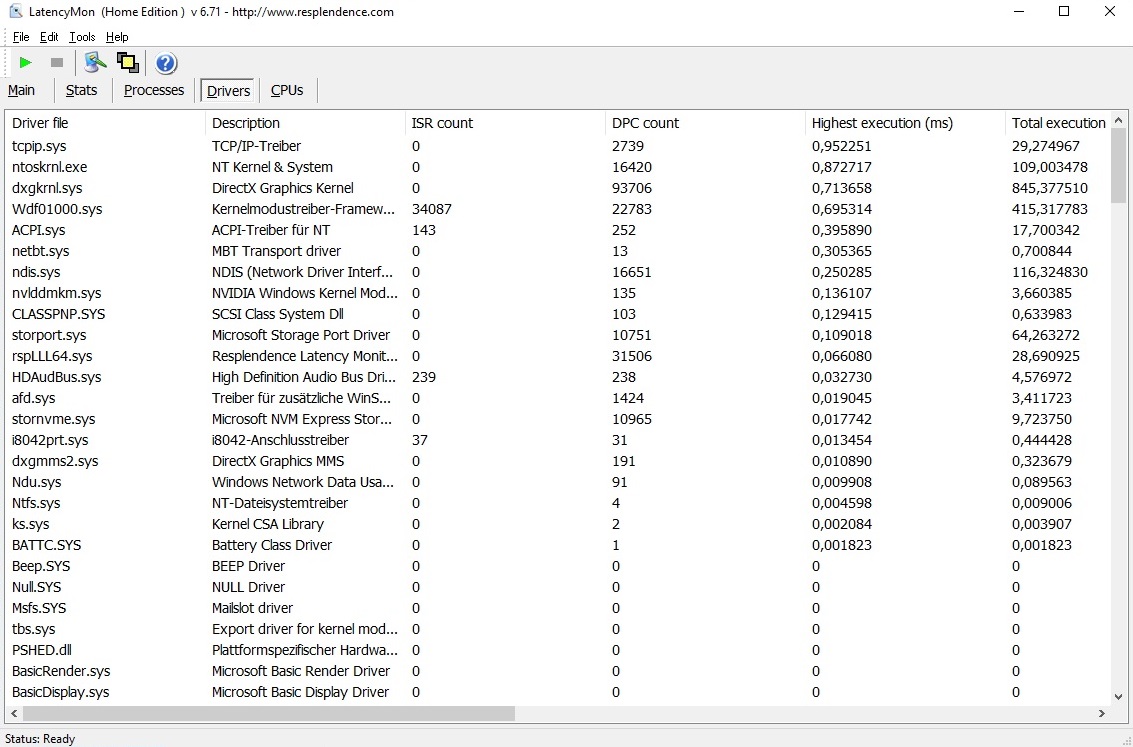
There were no noticeable issues in the latency test with the LatencyMon tool. The 17-incher seems to be ideal for real-time audio and video editing.
| DPC Latencies / LatencyMon - interrupt to process latency (max), Web, Youtube, Prime95 | |
| Gigabyte Aero 17 HDR YD | |
| Asus ROG Zephyrus S17 GX703HSD | |
| Aorus 17G YD | |
| Medion Erazer Beast X25 | |
| Asus Strix Scar 17 G733QSA-XS99 | |
* ... smaller is better
Storage
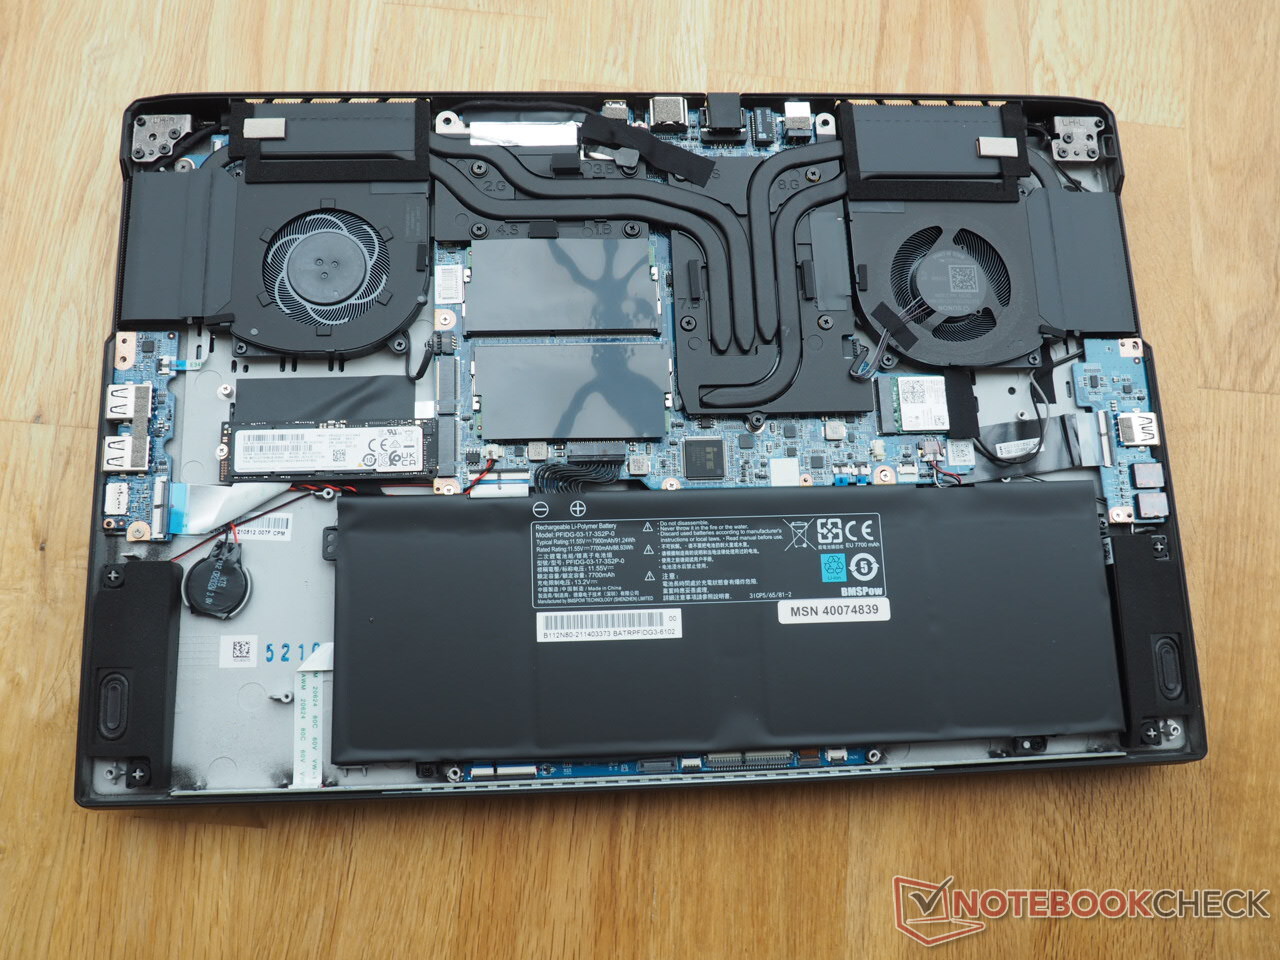
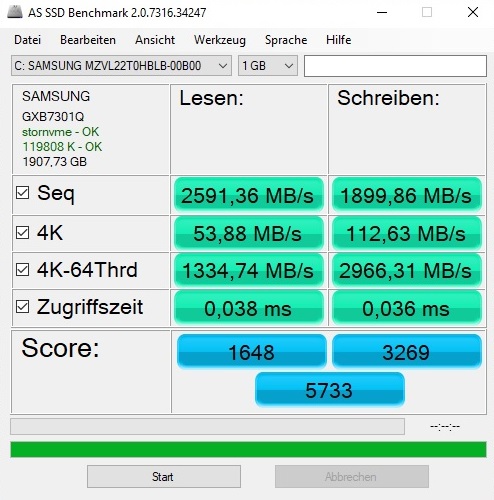
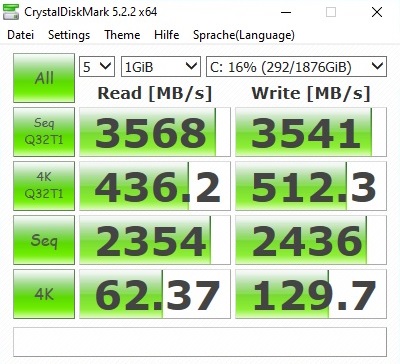
Just like the competition, Medion installs a lightning-fast PCIe 4 SSD from Samsung that surprisingly falls behind the comparison laptops in the AS SSD benchmark and in CrystalDiskMark as our table reveals. Great: Thanks to the free M.2 slot, storage space can be expanded without much effort if needed.
| Medion Erazer Beast X25 Samsung PM9A1 MZVL22T0HBLB | Asus Strix Scar 17 G733QSA-XS99 2x Samsung PM981a MZVLB1T0HBLR (RAID 0) | Gigabyte Aero 17 HDR YD Samsung PM9A1 MZVL2512HCJQ | Asus ROG Zephyrus S17 GX703HSD Samsung PM9A1 MZVL22T0HBLB | Aorus 17G YD Samsung PM9A1 MZVL2512HCJQ | |
|---|---|---|---|---|---|
| CrystalDiskMark 5.2 / 6 | 54% | 65% | 58% | 41% | |
| Write 4K | 129.7 | 235.9 82% | 230.4 78% | 244.2 88% | 227.4 75% |
| Read 4K | 62.4 | 48.02 -23% | 91.6 47% | 89.8 44% | 91.3 46% |
| Write Seq | 2436 | 4822 98% | 4216 73% | 2241 -8% | |
| Read Seq | 2354 | 5043 114% | 4543 93% | 4496 91% | |
| Write 4K Q32T1 | 512 | 625 22% | 667 30% | 607 19% | 661 29% |
| Read 4K Q32T1 | 436.2 | 392.3 -10% | 728 67% | 658 51% | 712 63% |
| Write Seq Q32T1 | 3541 | 5350 51% | 5043 42% | 5270 49% | 1540 -57% |
| Read Seq Q32T1 | 3568 | 7130 100% | 6821 91% | 7091 99% | 6806 91% |
| AS SSD | 14% | 47% | 64% | 25% | |
| Seq Read | 2591 | 4981 92% | 5438 110% | 5085 96% | 5150 99% |
| Seq Write | 1900 | 3050 61% | 3904 105% | 4434 133% | 3920 106% |
| 4K Read | 53.9 | 57 6% | 56.2 4% | 80.3 49% | 46.6 -14% |
| 4K Write | 112.6 | 261.3 132% | 165.8 47% | 214.7 91% | 145.8 29% |
| 4K-64 Read | 1335 | 1205 -10% | 2489 86% | 2573 93% | 2071 55% |
| 4K-64 Write | 2966 | 1290 -57% | 3480 17% | 2972 0% | 3267 10% |
| Access Time Read * | 0.038 | 0.032 16% | 0.054 -42% | 0.018 53% | 0.078 -105% |
| Access Time Write * | 0.036 | 0.044 -22% | 0.026 28% | 0.02 44% | 0.029 19% |
| Score Read | 1648 | 1760 7% | 3089 87% | 3161 92% | 2633 60% |
| Score Write | 3269 | 1857 -43% | 4036 23% | 3631 11% | 2805 -14% |
| Score Total | 5733 | 4428 -23% | 8620 50% | 8380 46% | 7716 35% |
| Total Average (Program / Settings) | 34% /
31% | 56% /
55% | 61% /
62% | 33% /
32% |
* ... smaller is better

Continuous load read: DiskSpd Read Loop, Queue Depth 8
Graphics card
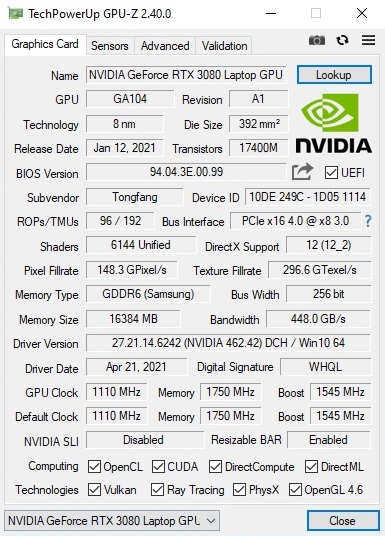
The GeForce RTX 3080, an absolute high-end model from Nvidia's Ampere generation that features 6,144 CUDA cores and 16 GB of GDDR6 VRAM, takes care of demanding graphics computations in the Erazer. The GPU-Z tool reports clock speeds between 1,110 and 1,545 MHz (base/boost) for the chip, and 1,750 MHz for its memory.
Performance for the current Nvidia GPUs depends heavily on the configured TGP, which manufacturers are relatively free to choose. As previously reported, the DirectX 12 chip runs at 130 watts in "Game Mode" including Dynamic Boost, which represents a passable value considering our RTX 3080 Laptops article; this is correspondingly reflected in the graphics benchmarks, where the Beast X25 usually lands in the (lower) midfield of our comparison field.
| 3DMark 11 Performance | 27989 points | |
| 3DMark Cloud Gate Standard Score | 48998 points | |
| 3DMark Fire Strike Score | 23834 points | |
| 3DMark Time Spy Score | 10580 points | |
Help | ||
Gaming performance
Although the Beast X25 doesn't rank at the very top when it comes to our gaming tests, its 3D performance is very high. All the latest games can be played smoothly at the native resolution of 1920x1080 and at high to maximum details. There would often be enough potential for an external QHD (2560x1440 pixels) or UHD (3840x2160 pixels) monitor. Things only become difficult with extremely CPU-intensive games like Cyberpunk 2077 and/or when ray tracing is enabled without DLSS.
| The Witcher 3 | |
| 1920x1080 High Graphics & Postprocessing (Nvidia HairWorks Off) | |
| Average of class Gaming (17.5 - 449, n=166, last 2 years) | |
| Asus ROG Zephyrus S17 GX703HSD | |
| Average NVIDIA GeForce RTX 3080 Laptop GPU (149 - 242, n=31) | |
| Asus Strix Scar 17 G733QSA-XS99 | |
| Aorus 17G YD | |
| Medion Erazer Beast X25 | |
| 1920x1080 Ultra Graphics & Postprocessing (HBAO+) | |
| Average of class Gaming (8.61 - 216, n=226, last 2 years) | |
| Asus ROG Zephyrus S17 GX703HSD | |
| Aorus 17G YD | |
| Asus Strix Scar 17 G733QSA-XS99 | |
| Average NVIDIA GeForce RTX 3080 Laptop GPU (85.1 - 123, n=39) | |
| Medion Erazer Beast X25 | |
| Gigabyte Aero 17 HDR YD | |
| GTA V | |
| 1920x1080 High/On (Advanced Graphics Off) AA:2xMSAA + FX AF:8x | |
| Asus ROG Zephyrus S17 GX703HSD | |
| Gigabyte Aero 17 HDR YD | |
| Average of class Gaming (15.3 - 187.1, n=181, last 2 years) | |
| Average NVIDIA GeForce RTX 3080 Laptop GPU (137 - 176, n=29) | |
| Aorus 17G YD | |
| Medion Erazer Beast X25 | |
| Asus Strix Scar 17 G733QSA-XS99 | |
| 1920x1080 Highest Settings possible AA:4xMSAA + FX AF:16x | |
| Asus ROG Zephyrus S17 GX703HSD | |
| Average of class Gaming (6.38 - 167.7, n=216, last 2 years) | |
| Gigabyte Aero 17 HDR YD | |
| Average NVIDIA GeForce RTX 3080 Laptop GPU (68.6 - 112, n=33) | |
| Aorus 17G YD | |
| Asus Strix Scar 17 G733QSA-XS99 | |
| Medion Erazer Beast X25 | |
| Final Fantasy XV Benchmark - 1920x1080 High Quality | |
| Average of class Gaming (9.13 - 194.9, n=226, last 2 years) | |
| Asus Strix Scar 17 G733QSA-XS99 | |
| Gigabyte Aero 17 HDR YD | |
| Average NVIDIA GeForce RTX 3080 Laptop GPU (55.5 - 115, n=33) | |
| Medion Erazer Beast X25 | |
| Aorus 17G YD | |
We checked if the frame rate remains constant over prolonged periods of time with the RPG hit game The Witcher 3; we ran if for a good 60 minutes (Full HD/Ultra). Just like we already saw in the CPU tests, the Erazer doesn't suffer from performance drops here, either.
The Witcher 3 FPS diagram
| low | med. | high | ultra | |
| GTA V (2015) | 180 | 157 | 91.9 | |
| The Witcher 3 (2015) | 175 | 97.9 | ||
| Dota 2 Reborn (2015) | 147 | 141 | 126 | 119 |
| Final Fantasy XV Benchmark (2018) | 170 | 127 | 97 | |
| X-Plane 11.11 (2018) | 101 | 87.4 | 72.1 | |
| Far Cry 5 (2018) | 119 | 110 | ||
| Strange Brigade (2018) | 332 | 199 | 180 | 168 |
| Hunt Showdown (2020) | 122 | |||
| Death Stranding (2020) | 135 | 134 | ||
| Mafia Definitive Edition (2020) | 104 | |||
| Resident Evil Village (2021) | 155 | 144 | ||
| Mass Effect Legendary Edition (2021) | 109 | |||
| Days Gone (2021) | 130 | 100 | ||
| F1 2021 (2021) | 165 | 111 |
Emissions - Jet plane
Noise emissions
A major drawback of the thin build is the loud noise development, although most gaming laptops have to struggle with this. Around 52 dB(A) after one hour of The Witcher 3 is quite loud and only partly tolerable without headphones. Only the Asus ROG Zephyrus S17 GX703HSD was noticeably quieter in the test.
The Beast X25's performance in idle mode also needs improvement. Even though the laptop is sometimes completely silent (except for temporary coil whine), or it only hisses with a rather subtle level of just under 30 dB(A), the fans occasionally rev up to over 40 dB(A) for no apparent reason, which will annoy sensitive users. The Control Center's "Office Mode" provides a solution or at least some attenuation.
Noise Level
| Idle |
| 26 / 30 / 43 dB(A) |
| Load |
| 54 / 55 dB(A) |
 | ||
30 dB silent 40 dB(A) audible 50 dB(A) loud |
||
min: | ||
| Medion Erazer Beast X25 R9 5900HX, GeForce RTX 3080 Laptop GPU | Asus Strix Scar 17 G733QSA-XS99 R9 5900HX, GeForce RTX 3080 Laptop GPU | Gigabyte Aero 17 HDR YD i9-11980HK, GeForce RTX 3080 Laptop GPU | Asus ROG Zephyrus S17 GX703HSD i9-11900H, GeForce RTX 3080 Laptop GPU | Aorus 17G YD i7-11800H, GeForce RTX 3080 Laptop GPU | Average of class Gaming | |
|---|---|---|---|---|---|---|
| Noise | 16% | -0% | 19% | -2% | 11% | |
| off / environment * | 25 | 25 -0% | 25 -0% | 23 8% | 25 -0% | 24.1 ? 4% |
| Idle Minimum * | 26 | 25.2 3% | 30 -15% | 23 12% | 32 -23% | 25.6 ? 2% |
| Idle Average * | 30 | 25.2 16% | 32 -7% | 23 23% | 33 -10% | 27.4 ? 9% |
| Idle Maximum * | 43 | 25.2 41% | 41 5% | 23 47% | 39 9% | 30.7 ? 29% |
| Load Average * | 54 | 30.7 43% | 43 20% | 41 24% | 43 20% | 43.1 ? 20% |
| Witcher 3 ultra * | 52 | 51.3 1% | 51 2% | 45 13% | 52 -0% | |
| Load Maximum * | 55 | 51.3 7% | 59 -7% | 52 5% | 61 -11% | 53.4 ? 3% |
* ... smaller is better
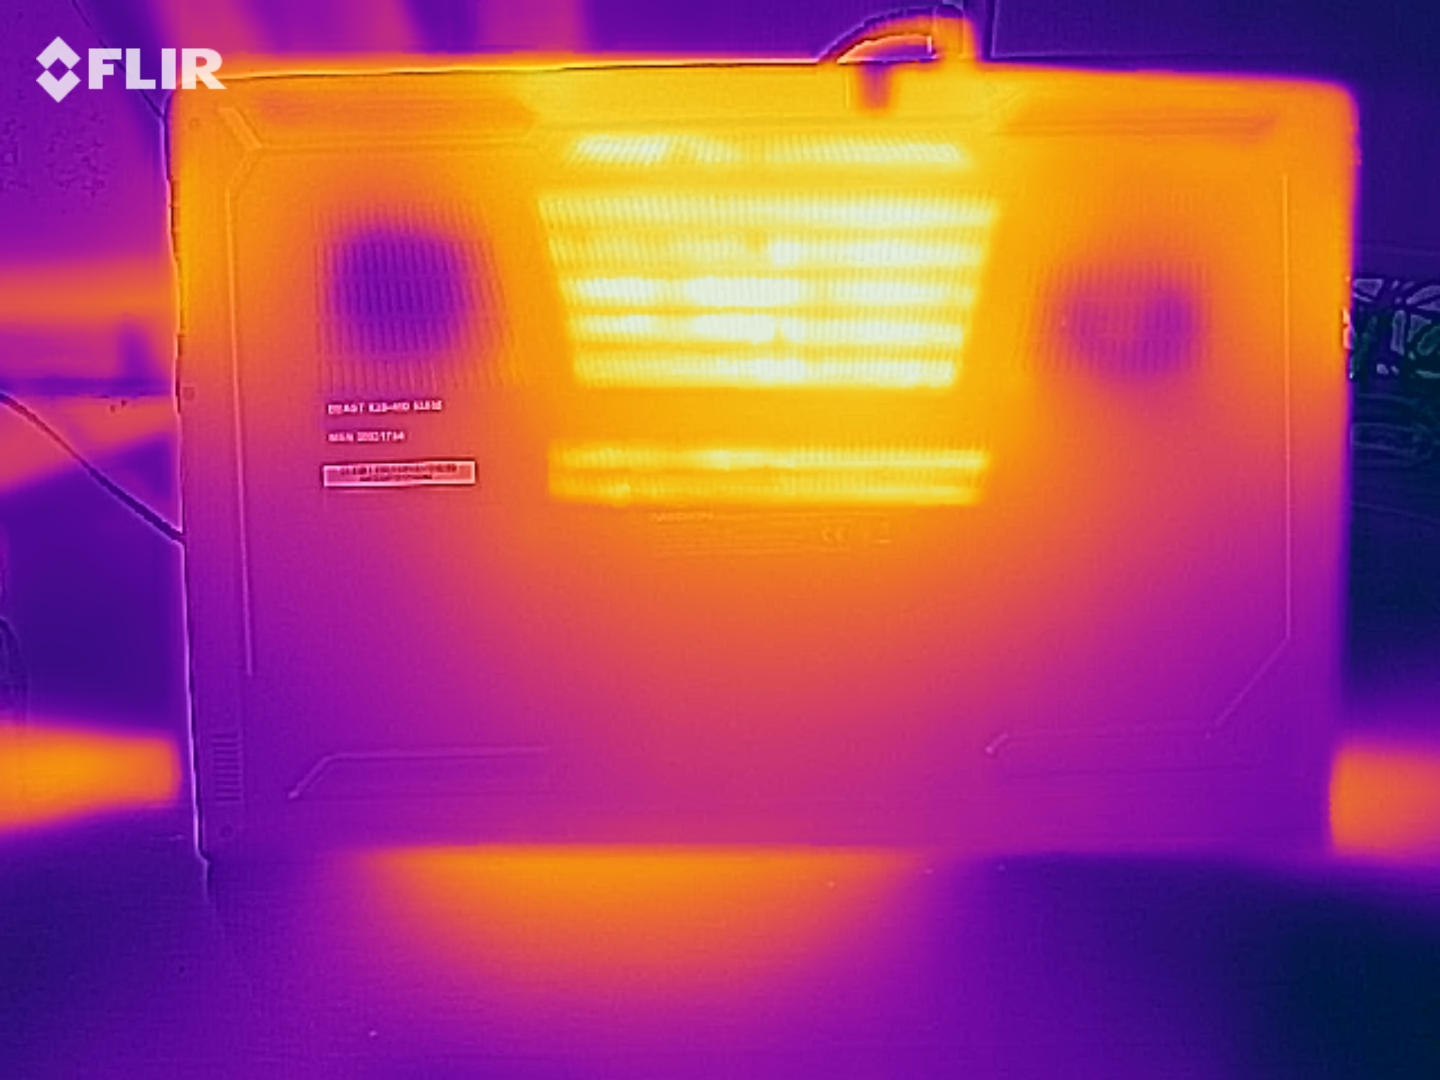
Temperature
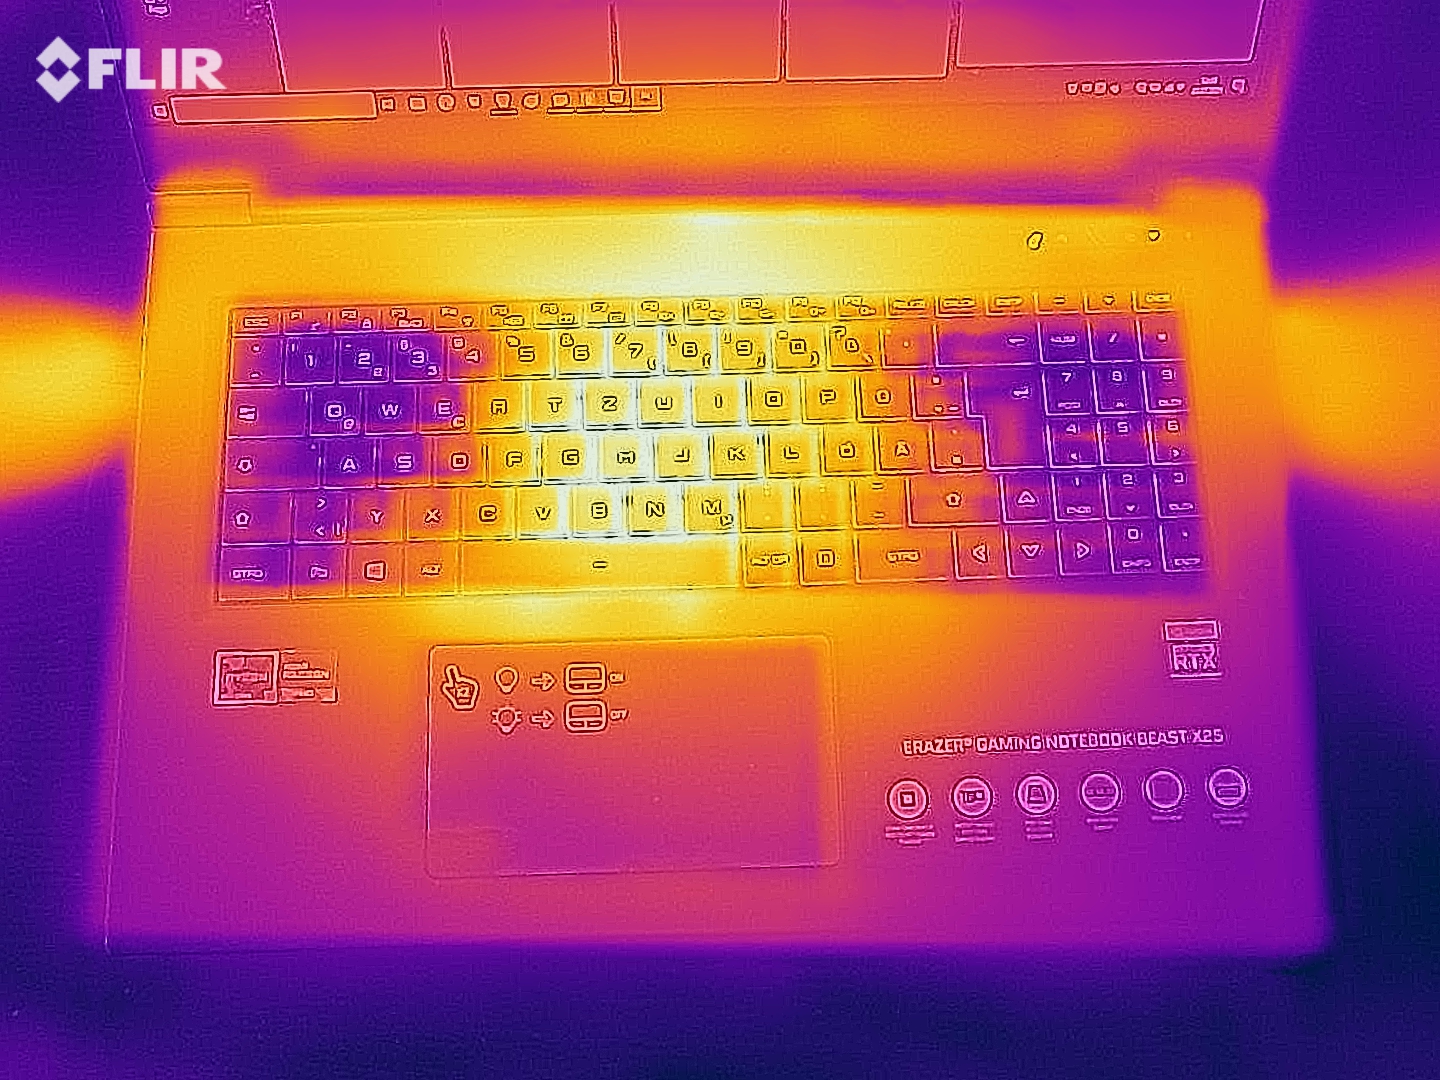
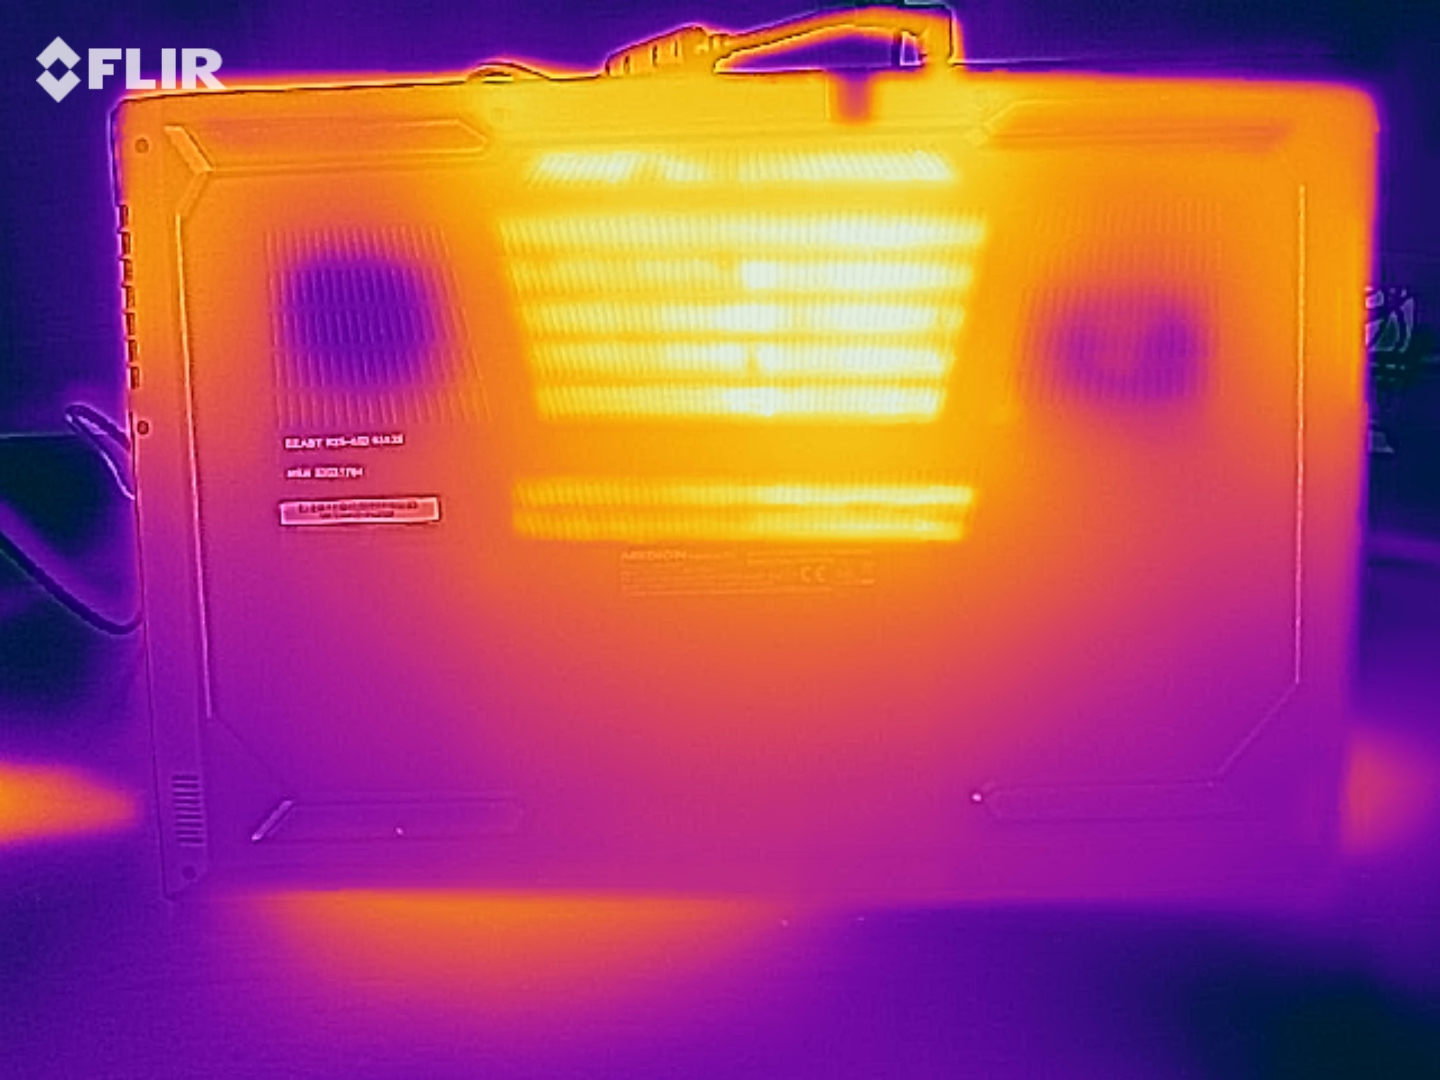
Despite the high noise level, the 17-incher gets relatively hot under load. In this way, we were able to measure up to 54 °C (~129 °F) at the top of the case and up to 57 °C (~135 °F) at the bottom in the stress test with the FurMark and Prime95 tools (maximum 52 °C (~126 °F) and 55 °C (~131 °F), respectively, @The Witcher 3). On the other hand, the chassis feels quite cool in idle usage with a maximum of 35 °C (~95 °F).
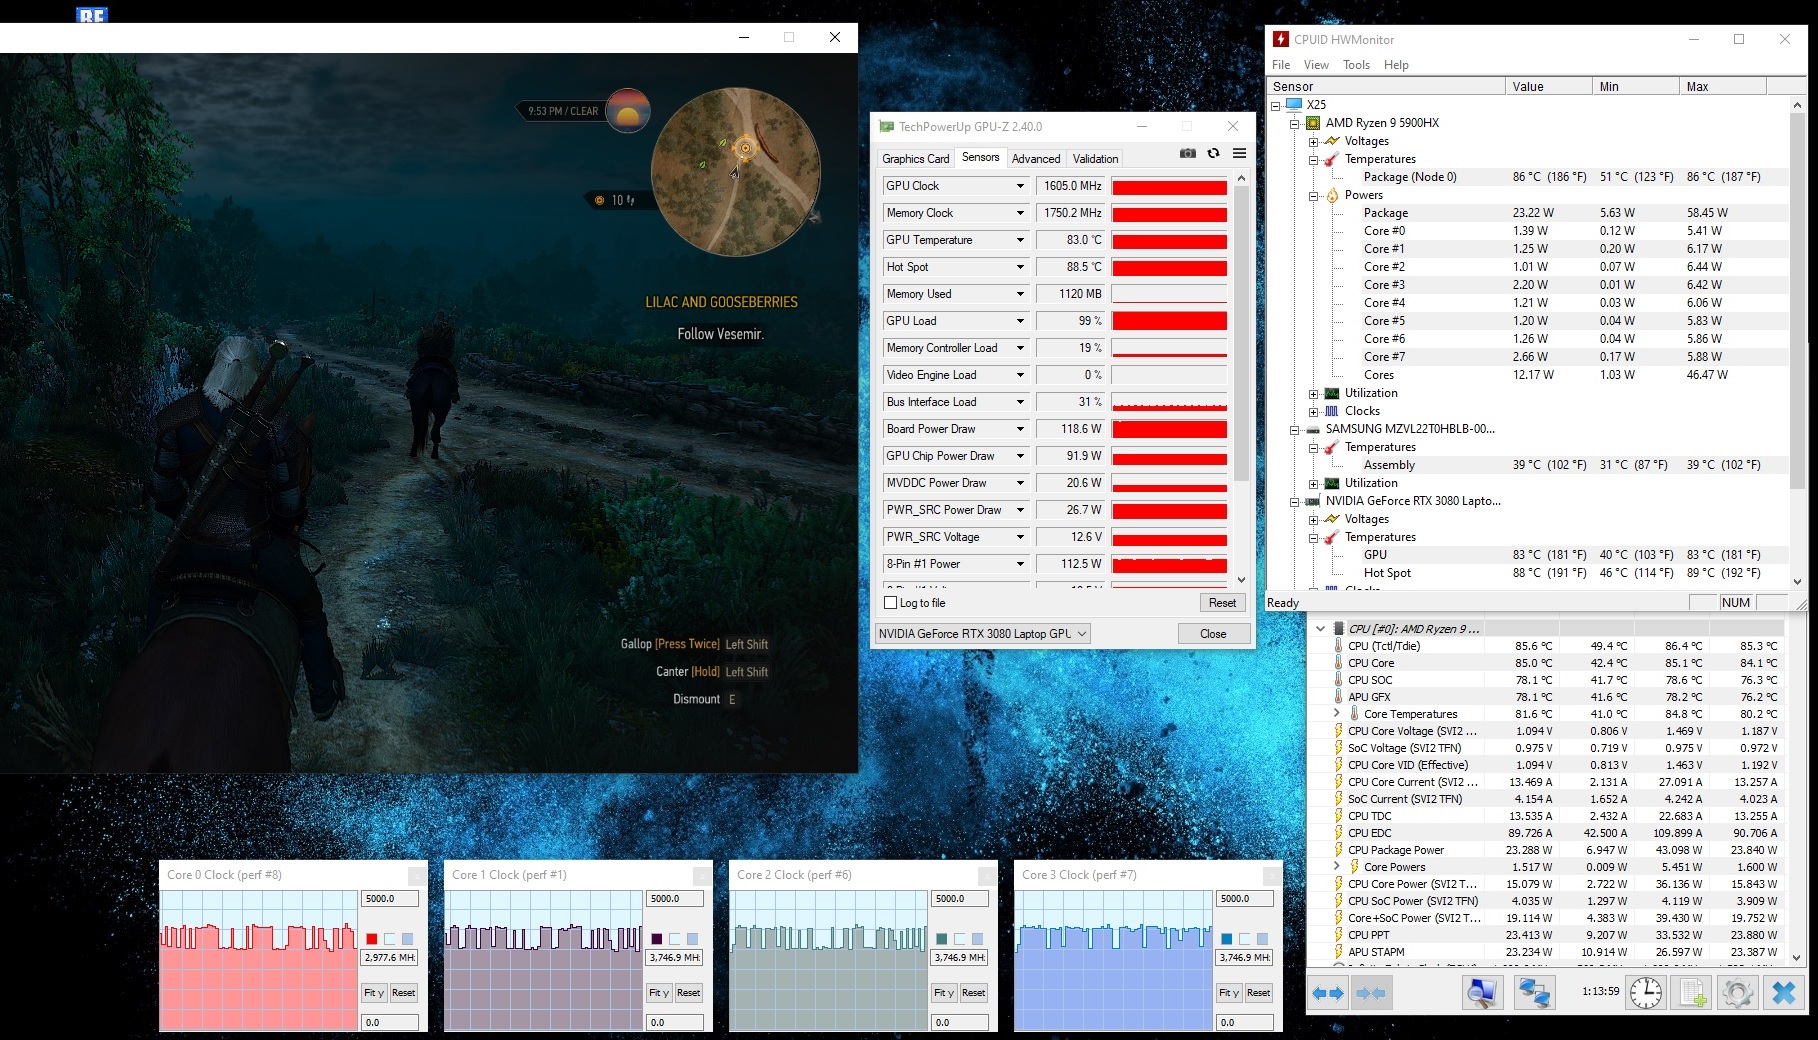
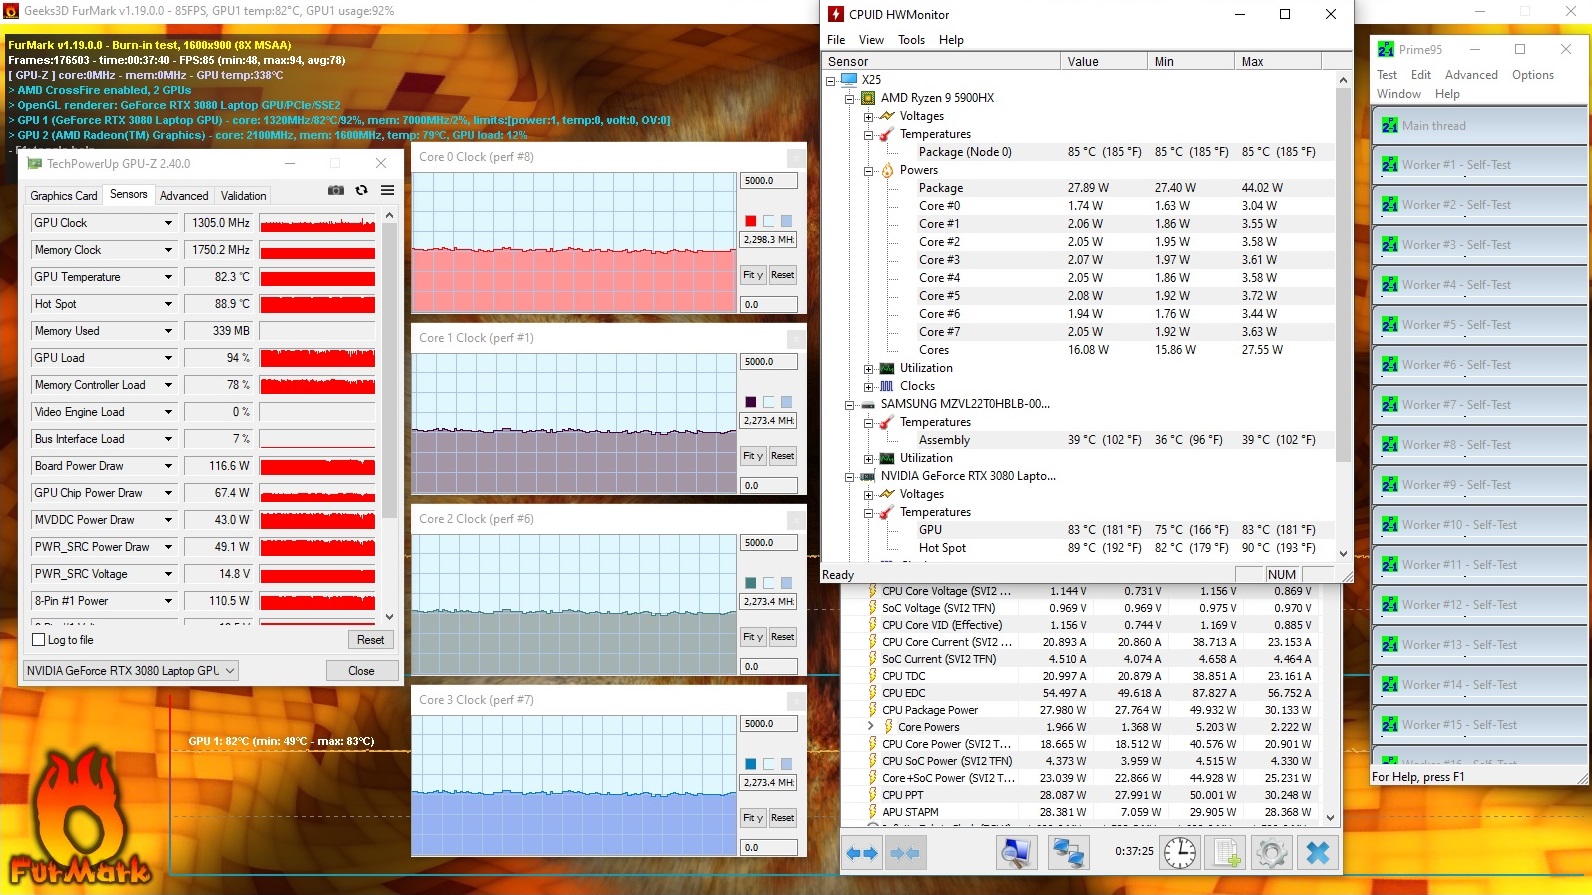
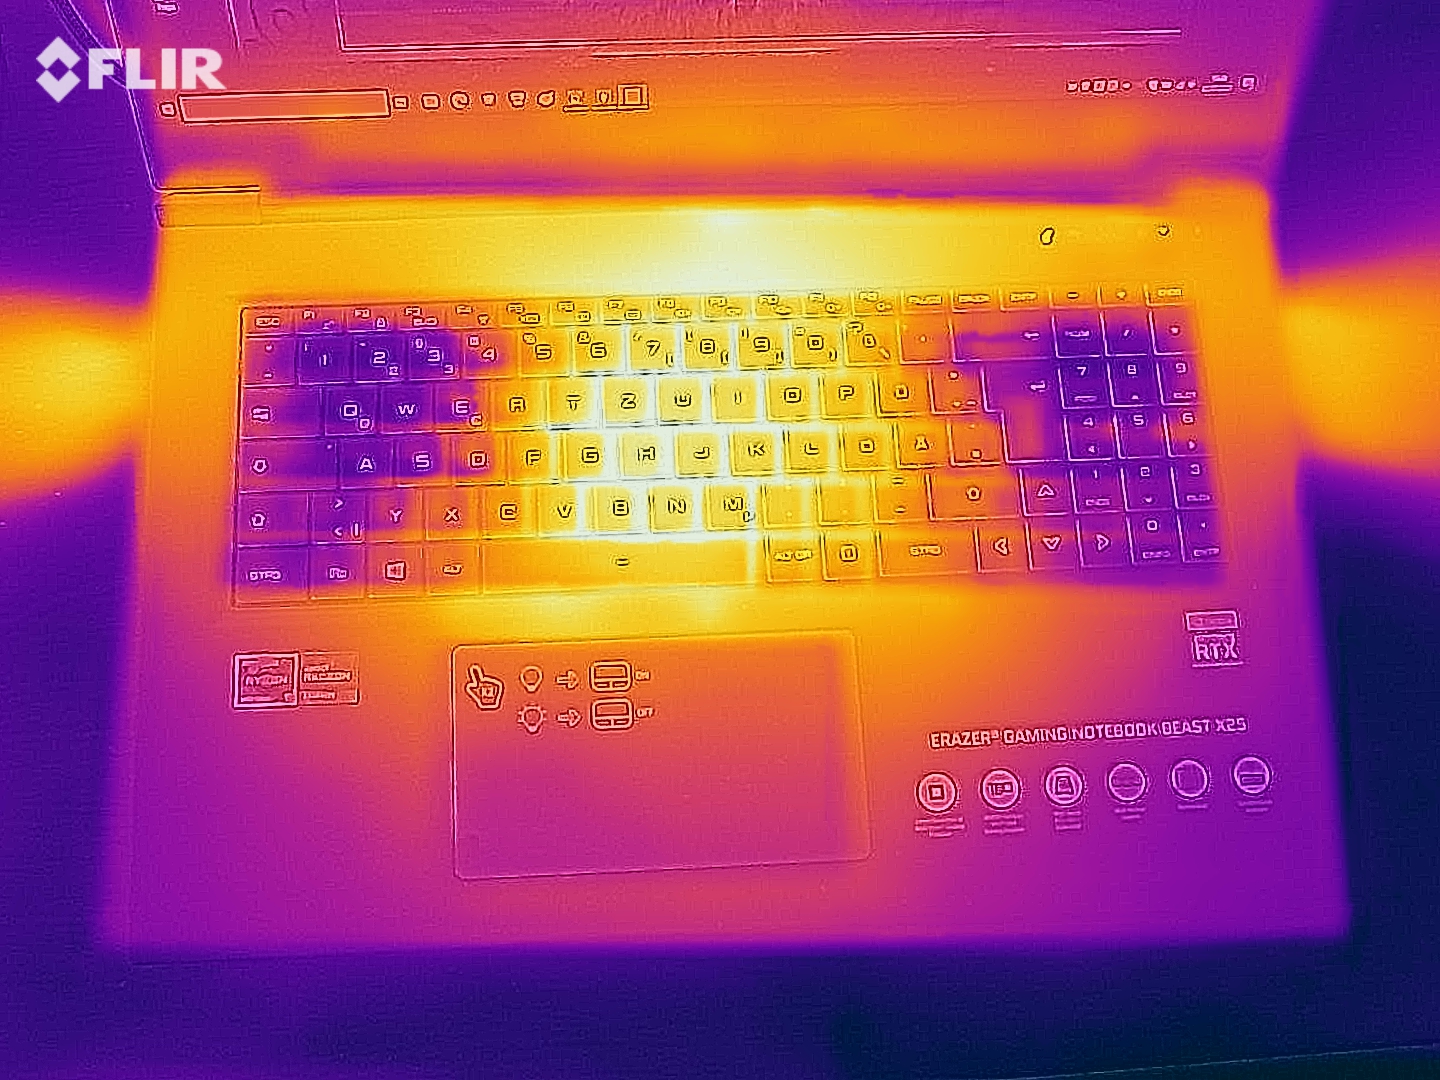
As usual, the components get considerably hotter. Although the Ryzen 9 5900HX throttled to 2.3 GHz under full load, the HWMonitor tool reported a high but still uncritical 85 °C (~185 °F). Things looked a bit better with the GeForce RTX 3080, which settled comfortably at around 82 °C (~180 °F) in the stress test (without throttling). Temperatures were similar in our The Witcher 3 test, but the device was able to reach much higher clock rates (see screenshots).
(-) The maximum temperature on the upper side is 54 °C / 129 F, compared to the average of 40.4 °C / 105 F, ranging from 21.2 to 68.8 °C for the class Gaming.
(-) The bottom heats up to a maximum of 57 °C / 135 F, compared to the average of 43.2 °C / 110 F
(±) In idle usage, the average temperature for the upper side is 32.1 °C / 90 F, compared to the device average of 33.8 °C / 93 F.
(-) Playing The Witcher 3, the average temperature for the upper side is 45.8 °C / 114 F, compared to the device average of 33.8 °C / 93 F.
(-) The palmrests and touchpad can get very hot to the touch with a maximum of 45 °C / 113 F.
(-) The average temperature of the palmrest area of similar devices was 28.9 °C / 84 F (-16.1 °C / -29 F).
| Medion Erazer Beast X25 R9 5900HX, GeForce RTX 3080 Laptop GPU | Asus Strix Scar 17 G733QSA-XS99 R9 5900HX, GeForce RTX 3080 Laptop GPU | Gigabyte Aero 17 HDR YD i9-11980HK, GeForce RTX 3080 Laptop GPU | Asus ROG Zephyrus S17 GX703HSD i9-11900H, GeForce RTX 3080 Laptop GPU | Aorus 17G YD i7-11800H, GeForce RTX 3080 Laptop GPU | Average of class Gaming | |
|---|---|---|---|---|---|---|
| Heat | 11% | 7% | -1% | 16% | 11% | |
| Maximum Upper Side * | 54 | 40 26% | 44 19% | 59 -9% | 36 33% | 46 ? 15% |
| Maximum Bottom * | 57 | 39.8 30% | 56 2% | 53 7% | 52 9% | 49.5 ? 13% |
| Idle Upper Side * | 34 | 34.6 -2% | 32 6% | 35 -3% | 29 15% | 31.4 ? 8% |
| Idle Bottom * | 35 | 38.4 -10% | 35 -0% | 35 -0% | 33 6% | 32.5 ? 7% |
* ... smaller is better
Speakers
Medion Erazer Beast X25 audio analysis
(+) | speakers can play relatively loud (85 dB)
Bass 100 - 315 Hz
(-) | nearly no bass - on average 25% lower than median
(±) | linearity of bass is average (14.4% delta to prev. frequency)
Mids 400 - 2000 Hz
(+) | balanced mids - only 1.8% away from median
(+) | mids are linear (3.5% delta to prev. frequency)
Highs 2 - 16 kHz
(±) | higher highs - on average 5% higher than median
(±) | linearity of highs is average (8.3% delta to prev. frequency)
Overall 100 - 16.000 Hz
(±) | linearity of overall sound is average (15.5% difference to median)
Compared to same class
» 32% of all tested devices in this class were better, 6% similar, 61% worse
» The best had a delta of 6%, average was 18%, worst was 132%
Compared to all devices tested
» 19% of all tested devices were better, 4% similar, 78% worse
» The best had a delta of 4%, average was 25%, worst was 134%
Asus Strix Scar 17 G733QSA-XS99 audio analysis
(±) | speaker loudness is average but good (73.7 dB)
Bass 100 - 315 Hz
(+) | good bass - only 2.1% away from median
(±) | linearity of bass is average (7% delta to prev. frequency)
Mids 400 - 2000 Hz
(+) | balanced mids - only 1.4% away from median
(+) | mids are linear (4.8% delta to prev. frequency)
Highs 2 - 16 kHz
(±) | higher highs - on average 5.9% higher than median
(±) | linearity of highs is average (8.7% delta to prev. frequency)
Overall 100 - 16.000 Hz
(+) | overall sound is linear (10.7% difference to median)
Compared to same class
» 6% of all tested devices in this class were better, 2% similar, 92% worse
» The best had a delta of 6%, average was 18%, worst was 132%
Compared to all devices tested
» 4% of all tested devices were better, 1% similar, 95% worse
» The best had a delta of 4%, average was 25%, worst was 134%
Energy management - Powerful 91 Wh battery
Energy consumption
For a high-end laptop with graphics switching, the energy rates aren't good or particularly bad, either. 22 to 34 watts in idle usage is just as much in line with most competitors as is 120 to 231 watts under load. As long as you don't overdo it with the Control Center settings, the included 230-watt power adapter has sufficient capacity.
| Off / Standby | |
| Idle | |
| Load |
|
| Medion Erazer Beast X25 R9 5900HX, GeForce RTX 3080 Laptop GPU | Asus Strix Scar 17 G733QSA-XS99 R9 5900HX, GeForce RTX 3080 Laptop GPU | Gigabyte Aero 17 HDR YD i9-11980HK, GeForce RTX 3080 Laptop GPU | Asus ROG Zephyrus S17 GX703HSD i9-11900H, GeForce RTX 3080 Laptop GPU | Aorus 17G YD i7-11800H, GeForce RTX 3080 Laptop GPU | Average of class Gaming | |
|---|---|---|---|---|---|---|
| Power Consumption | 21% | -5% | 3% | 1% | 16% | |
| Idle Minimum * | 22 | 10.9 50% | 25 -14% | 21.7 1% | 24 -9% | 13.8 ? 37% |
| Idle Average * | 26 | 14.7 43% | 28 -8% | 27 -4% | 26 -0% | 19.2 ? 26% |
| Idle Maximum * | 34 | 26.8 21% | 40 -18% | 33 3% | 38 -12% | 27 ? 21% |
| Load Average * | 120 | 106.7 11% | 114 5% | 108 10% | 101 16% | 111.3 ? 7% |
| Witcher 3 ultra * | 189 | 192.4 -2% | 176 7% | 195 -3% | 164 13% | |
| Load Maximum * | 231 | 228.4 1% | 236 -2% | 210 9% | 230 -0% | 251 ? -9% |
* ... smaller is better
Energy consumption during The Witcher 3 / stress test
Battery life
While other manufacturers enjoy telling fairy tales when it comes to battery life, the information provided on Medion's website is very conservative at up to 3 hours (video playback). The six-cell 91.2 Wh battery lasted almost 7 hours in our automated Wi-Fi test (accessing various websites at medium display brightness), which is a very respectable rate in the gaming laptop sector. Under ideal conditions (no load, minimum brightness), the 17-incher needs to be plugged in again after just under 10 hours.
| Medion Erazer Beast X25 R9 5900HX, GeForce RTX 3080 Laptop GPU, 91 Wh | Asus Strix Scar 17 G733QSA-XS99 R9 5900HX, GeForce RTX 3080 Laptop GPU, 90 Wh | Gigabyte Aero 17 HDR YD i9-11980HK, GeForce RTX 3080 Laptop GPU, 99 Wh | Asus ROG Zephyrus S17 GX703HSD i9-11900H, GeForce RTX 3080 Laptop GPU, 90 Wh | Aorus 17G YD i7-11800H, GeForce RTX 3080 Laptop GPU, 99 Wh | Average of class Gaming | |
|---|---|---|---|---|---|---|
| Battery Runtime | 26% | -17% | 55% | -0% | -5% | |
| Reader / Idle | 591 | 797 35% | 541 -8% | 544 ? -8% | ||
| WiFi v1.3 | 410 | 559 36% | 334 -19% | 449 10% | 360 -12% | 368 ? -10% |
| Load | 81 | 86 6% | 70 -14% | 162 100% | 96 19% | 84.4 ? 4% |
| H.264 | 430 | 370 | 399 ? | |||
| Witcher 3 ultra | 62 | 81.6 ? |
Pros
Cons
Verdict - Pricey, but cheaper than many competitors
The Medion Erazer Beast X25 is an ideal laptop for passionate gamers who are looking for a discreet, slim, and relatively lightweight device that is also highly future-proof.
Although the case doesn't offer a Thunderbolt port due to the presence of the AMD processor, the device has (almost) everything else that you could want from a modern high-end laptop. Besides the fast 240 Hz Full HD panel (the Beast X25 is also optionally available with a 165 Hz QHD display), the ample amount of RAM and storage (64 GB RAM, 2 TB NVMe SSD) should be mentioned here.
The combination of the Ryzen 9 5900HX CPU and the GeForce RTX 3080 laptop GPU is particularly powerful when running 3D applications. Unlike laptops from other manufacturers that come with a fixed TDP for the CPU and GPU, you can adjust the corresponding values in the preinstalled Control Center either by selecting a profile or by tweaking them manually - a big plus and a great unique selling point.
However, the tremendously powerful hardware results in a significant noise level under load, which encourages the use of a headset. The fan control in idle usage is suboptimal as well (keywords: "rev up"). This is one of the reasons why the competing devices mentioned in the review (e.g. the Asus ROG Zephyrus S17) score slightly better in the overall rating.
The relatively good price-performance ratio speaks for the Erazer Beast X25. Many RTX 3080 laptops cost over 3,000 Euros (~$3,545) or even approach the 4,000 Euro (~$4,723) mark.
Price and availability
In the United States, one known electronics vendor that uses Tongfang barebone systems as base for its laptops is Eluktronics. In this case, you will find their MAX-17 model to be the equivalent to our review sample. Prices start at $1,799, and you can customize the device comprehensively to meet your needs.
Medion Erazer Beast X25
-
07/25/2021 v7
Florian Glaser
Pricecompare

