Notebookcheck Logo

Qualcomm Snapdragon 8cx Gen 3 vs Qualcomm Snapdragon 888 Plus 5G

Qualcomm Snapdragon 8cx Gen 3

► remove from comparison Qualcomm SD 8cx Gen 3

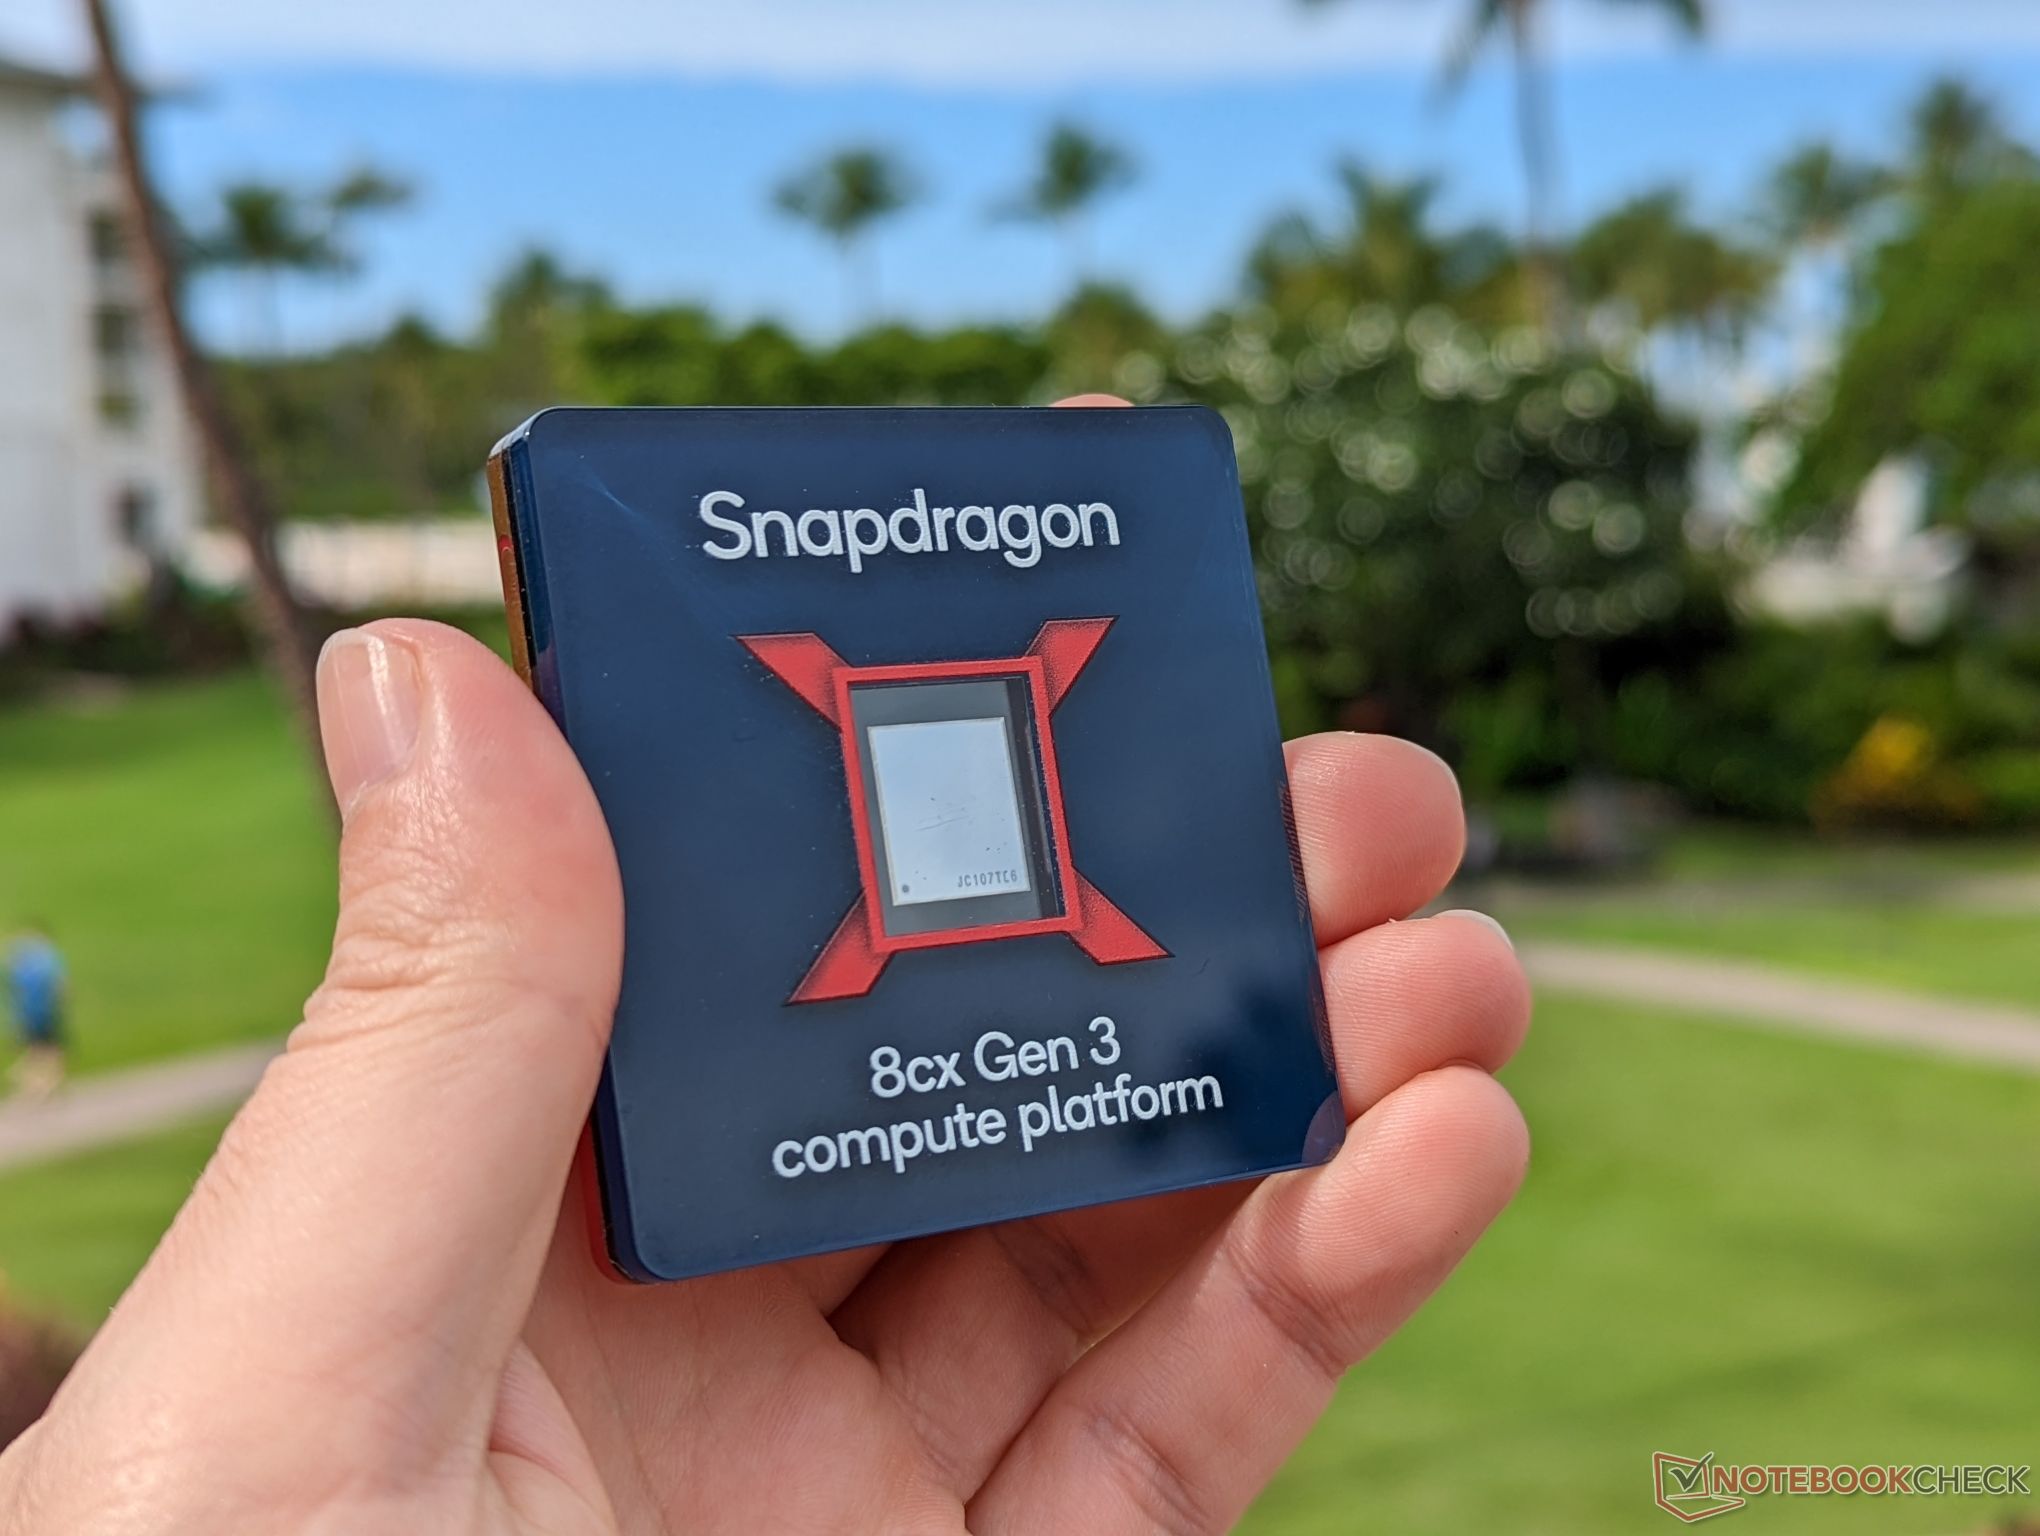
The Qualcomm Snapdragon 8cx Gen 3 Compute Platform is an ARM based SoC for Windows laptops. It integrates four big ARM Cortex-X1 performance cores (up to 3 GHz) and four smaller ARM Cortex-A78 with up to 2.4 GHz.

The Compute Platform also integrates a Snapdragon X62 5G modem with up to 10 Gbps download and 316 Mbps upload. The integrated WLAN modem supports Wi-Fi 6E (2x2) and the satellite positioning system supports BeiDou, Galileo, GLONASS, GPS, QZSS, and SBAS. The integrated video engine supports H.264, H.265, and VP9 decoding in 4K 120fps.

The performance should be around 85% faster for the CPU and 60% faster for the GPU compared to the previous generation (Snapdragon 8cx Gen 2).

The chip is produced in the modern 5nm process at Samsung (5LPE) and designed for fanless laptops (7 to 9 Watt TDP range).

Qualcomm Snapdragon 888 Plus 5G

► remove from comparison Qualcomm SD 888+ 5G

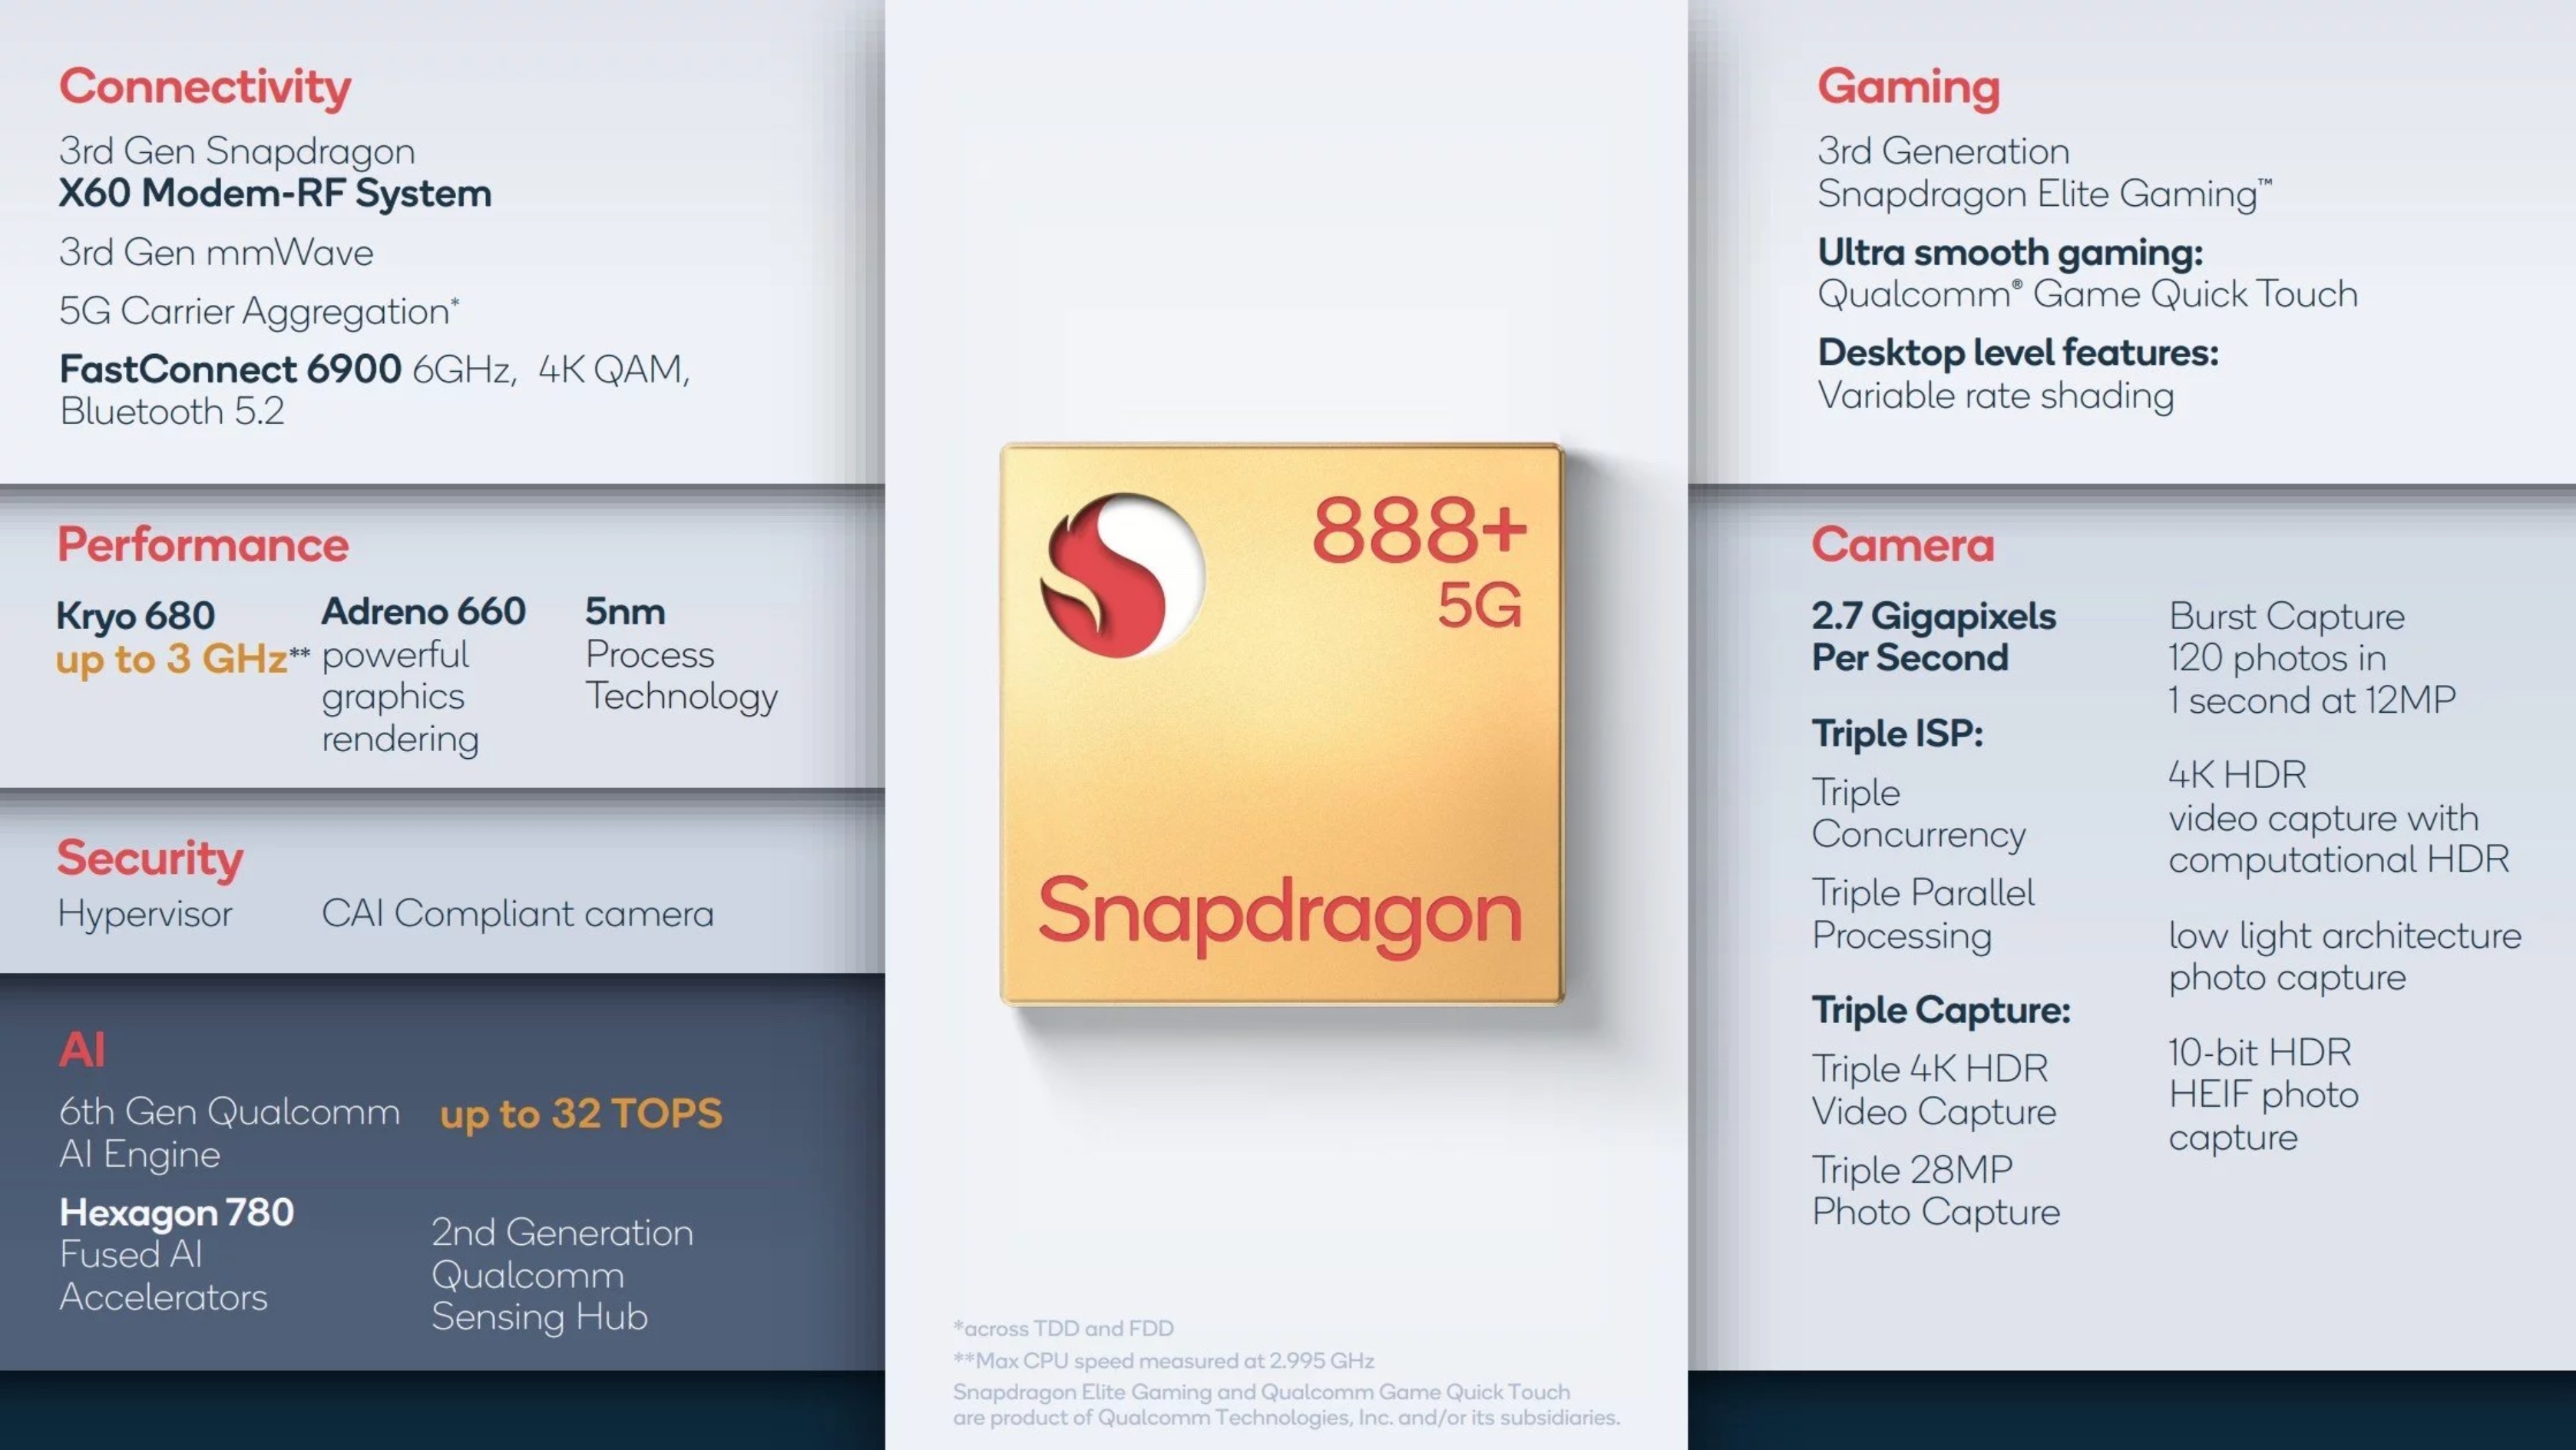
The Qualcomm Snapdragon 888+ (Plus) 5G Mobile Platform is a high-end SoC for smartphones that was introduced in mid 2021 and manufactured in 5 nm at Samsung. 

Integrates one “Prime Core” based on a ARM Cortex-X1 architecture clocked at up to 3 GHz. Three more performance cores are based on the A78 but clock up to 2.42 GHz. Furthermore, four energy saving cores are integrated that are based on the ARM Cortex-A55 architecture and clock at up to 1.8 GHz. In addition to the processor cores, the SoC integrates a WiFi 6e modem, a Hexagon 780 DSP (up to 26 TOPS of AI performance) and a Spectra 580 ISP. The integrated memory controller now supports faster LPDDR5 memory with up to 3,200 MHz. 5G is now included in the chip with the Snapdragon X60 modem.

Compared to the older Snapdragon 888, the 888+ offers a slightly higher clocked prime core (+160 MHz) and a 23% faster Hexagon 790 DSP. Therefore, it is now the fastest Android SoC (at the time of announcement), but still slightly slower (CPU and GPU) than the Apple A14 and A15 Bionic SoCs.

ModelQualcomm Snapdragon 8cx Gen 3Qualcomm Snapdragon 888 Plus 5G
SeriesQualcomm SnapdragonQualcomm Snapdragon
CodenameCortex-X1 / A78Cortex-X1 / A78 / A55 (Kryo 680)
Clock2400 - 2995 MHz1800 - 3000 MHz
L1 Cache768 KB
L2 Cache6 MB
L3 Cache8 MB3 MB
Cores / Threads8 / 88 / 8
1 x 3.0 GHz ARM Cortex-X1
3 x 2.4 GHz ARM Cortex-A78
4 x 1.8 GHz ARM Cortex-A55
TDP7 Watt5 Watt
Technology5 nm5 nm
FeaturesFastConnect 6900 2x2 Wi-Fi, Adreno 690 GPUAdreno 660 GPU, Spectra 580 ISP, Hexagon 780, X60 5G Modem, FastConnect 6900 WiFi, LPDDR5-6400 (3200 MHz) Memory Controller (64 Bit)
iGPUQualcomm Adreno 690Qualcomm Adreno 660
ArchitectureARMARM
Announced
Manufacturerwww.qualcomm.comwww.qualcomm.com
Series: Snapdragon Cortex-X1 / A78 / A55 (Kryo 680)
Qualcomm Snapdragon G3x Gen 1 compare1.8 - 3 GHz8 / 8 cores3 MB L3 Cortex-X1 / A78 / A55 (Kryo 680)
Qualcomm Snapdragon 888 Plus 5G « 1.8 - 3 GHz8 / 8 cores3 MB L3 Cortex-X1 / A78 / A55 (Kryo 680)
Qualcomm Snapdragon 888 5G compare1.8 - 2.84 GHz8 / 8 cores3 MB L3 Cortex-X1 / A78 / A55 (Kryo 680)
Qualcomm Snapdragon 888 4G compare1.8 - 2.84 GHz8 / 8 cores3 MB L3 Cortex-X1 / A78 / A55 (Kryo 680)

Benchmarks

Performance Rating - CB R15 + R20 + 7-Zip + X265 + Blender + 3DM11 CPU - SD 8cx Gen 3
24.4 pt (34%)
Performance Rating - Geekbench 5.5, PCM Work, Sling Shot Physics, Antutu v8 CPU - SD 888+ 5G
1.3 pt (100%)
Qualcomm Snapdragon 888 Plus 5G
1.3
max:
1.3 0%
0%
100%
Cinebench R23 - Cinebench R23 Multi Core
min: 3534     avg: 3603     median: 3567 (3%)     max: 3709 Points
Cinebench R23 - Cinebench R23 Single Core
min: 559     avg: 588     median: 598 (25%)     max: 608 Points
Cinebench R20 - Cinebench R20 CPU (Single Core)
min: 199     avg: 208.7     median: 205 (23%)     max: 222 Points
Cinebench R20 - Cinebench R20 CPU (Multi Core)
min: 810     avg: 1105     median: 1248 (3%)     max: 1258 Points
Cinebench R15 - Cinebench R15 CPU Multi 64 Bit
min: 723     avg: 749     median: 748.5 (5%)     max: 774 Points
Cinebench R15 - Cinebench R15 CPU Single 64 Bit
min: 119     avg: 119.1     median: 119.1 (36%)     max: 119.1 Points
Cinebench R11.5 - Cinebench R11.5 CPU Multi 64 Bit
9.2 Points (12%)
Cinebench R11.5 - Cinebench R11.5 CPU Single 64 Bit
1.4 Points (34%)
Cinebench R10 - Cinebench R10 Rend. Single (32bit)
2481 Points (15%)
Cinebench R10 - Cinebench R10 Rend. Multi (32bit)
13940 Points (10%)
wPrime 2.10 - wPrime 2.0 1024m *
305.3 s (4%)
wPrime 2.10 - wPrime 2.0 32m *
8.7 s (2%)
WinRAR - WinRAR 4.0
4046 Points (6%)
7-Zip 18.03 - 7-Zip 18.03 Multli Thread 4 runs
min: 16223     avg: 21572     median: 23989 (14%)     max: 24505 MIPS
7-Zip 18.03 - 7-Zip 18.03 Single Thread 4 runs
min: 3874     avg: 3912     median: 3915 (47%)     max: 3946 MIPS
X264 HD Benchmark 4.0 - x264 Pass 2
33.2 fps (12%)
X264 HD Benchmark 4.0 - x264 Pass 1
146.9 fps (34%)
HWBOT x265 Benchmark v2.2 - HWBOT x265 4k Preset
min: 1.5     avg: 2.2     median: 2.5 (4%)     max: 2.68 fps
Blender - Blender 3.3 Classroom CPU *
min: 1153     avg: 1626     median: 1625.5 (21%)     max: 2098 Seconds
Blender - Blender 2.79 BMW27 CPU *
min: 1059     avg: 1246     median: 1080 (8%)     max: 1600 Seconds
R Benchmark 2.5 - R Benchmark 2.5 *
min: 1.011     avg: 1     median: 1 (22%)     max: 1.013 sec
3DMark 06 - CPU - 3DMark 06 - CPU
3876 Points (8%)
Super Pi mod 1.5 XS 1M - Super Pi mod 1.5 XS 1M *
17.5 s (4%)
Super Pi mod 1.5 XS 2M - Super Pi mod 1.5 XS 2M *
37.4 s (2%)
Super Pi Mod 1.5 XS 32M - Super Pi mod 1.5 XS 32M *
848 s (4%)
3DMark 11 - 3DM11 Performance Physics
min: 7084     avg: 7306     median: 7333 (20%)     max: 7500 Points
3DMark - 3DMark Ice Storm Physics
18857 Points (15%)
3DMark - 3DMark Cloud Gate Physics
min: 2899     avg: 4704     median: 4704 (12%)     max: 6509 Points
3DMark - 3DMark Fire Strike Standard Physics
min: 9533     avg: 9637     median: 9637 (17%)     max: 9741 Points
3DMark - 3DMark Time Spy CPU
2939 Points (12%)
3DMark - 3DMark Sling Shot Extreme (ES 3.1) Unlimited Physics
min: 4387     avg: 4898     median: 4952 (19%)     max: 5260 Points
3DMark - 3DMark Sling Shot (ES 3.0) Unlimited Physics
min: 4365     avg: 4994     median: 5260 (60%)     max: 5293 Points
Geekbench 5.5 - Geekbench 5.1 - 5.4 64 Bit Single-Core
min: 1486     avg: 1588     median: 1588 (67%)     max: 1690 Points
min: 1076     avg: 1143     median: 1157 (49%)     max: 1170 Points
Geekbench 5.5 - Geekbench 5.1 - 5.4 64 Bit Multi-Core
min: 4457     avg: 5990     median: 5989.5 (11%)     max: 7522 Points
min: 3286     avg: 3572     median: 3628.5 (7%)     max: 3675 Points
Geekbench 5.0 - Geekbench 5.0 64 Bit Single-Core
min: 663     avg: 665     median: 665 (3%)     max: 667 Points
1164 Points (5%)
Geekbench 5.0 - Geekbench 5.0 64 Bit Multi-Core
min: 3749     avg: 3797     median: 3796.5 (12%)     max: 3844 Points
3699 Points (12%)
Geekbench 4.4 - Geekbench 4.1 - 4.4 64 Bit Single-Core
3460 Points (35%)
min: 4754     avg: 4973     median: 4973 (50%)     max: 5192 Points
Geekbench 4.4 - Geekbench 4.1 - 4.4 64 Bit Multi-Core
15240 Points (17%)
min: 12433     avg: 13553     median: 13552.5 (15%)     max: 14672 Points
Geekbench 4.0 - Geekbench 4.0 64 Bit Single-Core
5255 Points (72%)
Geekbench 4.0 - Geekbench 4.0 64 Bit Multi-Core
13602 Points (33%)
Geekbench 3 - Geekbench 3 64 Bit Multi-Core
11320 Points (18%)
Geekbench 3 - Geekbench 3 64 Bit Single-Core
3977 Points (60%)
Geekbench 2 - 32 Bit - Geekbench Stream
3422 Points (28%)
Geekbench 2 - 32 Bit - Geekbench Memory
5554 Points (50%)
Geekbench 2 - 32 Bit - Geekbench Floating Point
18052 Points (35%)
Geekbench 2 - 32 Bit - Geekbench Integer
8716 Points (18%)
Geekbench 2 - 32 Bit - Geekbench Total Score
10821 Points (28%)
Mozilla Kraken 1.1 - Kraken 1.1 Total Score *
min: 1913     avg: 1925     median: 1915 (2%)     max: 1946 ms
min: 1117.9     avg: 1267     median: 1253.5 (1%)     max: 1443 ms
Sunspider - Sunspider 1.0 Total Score *
342.5 ms (4%)
Octane V2 - Octane V2 Total Score
49893 Points (45%)
min: 28695     avg: 38237     median: 37604 (34%)     max: 49046 Points
WebXPRT 4 - WebXPRT 4 Score
min: 64.2     avg: 66.2     median: 67.2 (19%)     max: 67.2 Points
104 Points (30%)
WebXPRT 3 - WebXPRT 3 Score
min: 84.7     avg: 90.5     median: 90.5 (19%)     max: 96.2 Points
min: 120     avg: 144     median: 147 (31%)     max: 165 Points
AnTuTu v8 - AnTuTu v8 UX
min: 108609     avg: 111028     median: 111506 (93%)     max: 112968 Points
AnTuTu v8 - AnTuTu v8 MEM
min: 97862     avg: 106258     median: 102389 (83%)     max: 118523 Points
AnTuTu v8 - AnTuTu v8 GPU
min: 297329     avg: 308231     median: 306570 (56%)     max: 320795 Points
AnTuTu v8 - AnTuTu v8 CPU
min: 181327     avg: 186005     median: 184740 (67%)     max: 191947 Points
AnTuTu v8 - AnTuTu v8 Total Score
min: 695964     avg: 711522     median: 712952 (69%)     max: 725649 Points
Antutu v9 - AnTuTu v9 Total Score
min: 794271     avg: 813105     median: 815115 (49%)     max: 829929 Points
Antutu v9 - AnTuTu v9 CPU
min: 196860     avg: 203592     median: 205863 (56%)     max: 208053 Points
PassMark PerformanceTest Mobile V1 - PerformanceTest Mobile V1 CPU Tests
4771 Points (1%)
PCMark for Android - PCM f. Android Storage 2.0 score
min: 28905     avg: 32530     median: 31947 (51%)     max: 36738 Points
PCMark for Android - PCM f. Android Work Score 3.0
min: 12136     avg: 15268     median: 15403 (71%)     max: 18567 Points
PCMark for Android - PCM f. Android Work Score 2.0
12692 Points (83%)
CrossMark - CrossMark Overall
min: 627     avg: 673     median: 672.5 (26%)     max: 718 Points
min: 828     avg: 872     median: 872 (33%)     max: 916 Points
Power Consumption - Prime95 Power Consumption - external Monitor *
min: 26.9     avg: 33.5     median: 35.7 (6%)     max: 37.9 Watt
Power Consumption - Cinebench R15 Multi Power Consumption - external Monitor *
min: 32.7     avg: 33     median: 33 (6%)     max: 33.2 Watt
Power Consumption - Geekbench 5.5 Power Consumption 150cd *
min: 4.68     avg: 5.3     median: 5.1 (2%)     max: 6.41 Watt
Power Consumption - Idle Power Consumption - external Monitor *
min: 3.21     avg: 3.4     median: 3.2 (2%)     max: 3.6 Watt
Power Consumption - Idle Power Consumption 150cd 1min *
min: 3.5     avg: 3.7     median: 3.7 (4%)     max: 3.9 Watt
min: 0.943     avg: 1.1     median: 1 (1%)     max: 1.244 Watt
Power Consumption - Cinebench R15 Multi Power Efficiency - external Monitor
min: 22.1     avg: 22.7     median: 22.7 (17%)     max: 23.3 Points per Watt

Average Benchmarks Qualcomm Snapdragon 8cx Gen 3 → 100% n=11

Average Benchmarks Qualcomm Snapdragon 888 Plus 5G → 115% n=11

- Range of benchmark values for this graphics card
- Average benchmark values for this graphics card
* Smaller numbers mean a higher performance
1 This benchmark is not used for the average calculation

Add one or more devices and compare

In the following list you can select (and also search for) devices that should be added to the comparison. You can select more than one device.

restrict list:

show all (including archived), 2024, 2023
v1.26
log 15. 21:08:35

#0 checking url part for id 14600 +0s ... 0s

#1 checking url part for id 13833 +0s ... 0s

#2 not redirecting to Ajax server +0s ... 0s

#3 did not recreate cache, as it is less than 5 days old! Created at Mon, 13 May 2024 05:39:12 +0200 +0.001s ... 0.001s

#4 composed specs +0.02s ... 0.021s

#5 did output specs +0s ... 0.021s

#6 getting avg benchmarks for device 14600 +0.018s ... 0.04s

#7 got single benchmarks 14600 +0.012s ... 0.051s

#8 getting avg benchmarks for device 13833 +0.009s ... 0.06s

#9 got single benchmarks 13833 +0.02s ... 0.08s

#10 got avg benchmarks for devices +0s ... 0.08s

#11 min, max, avg, median took s +0.222s ... 0.302s

#12 return log +0.023s ... 0.325s

Please share our article, every link counts!
> Expert Reviews and News on Laptops, Smartphones and Tech Innovations > Benchmarks / Tech > Processor Comparison - Head 2 Head
Redaktion, 2017-09- 8 (Update: 2023-07- 1)