Notebookcheck Logo

Qualcomm Snapdragon 8 Gen 2 for Galaxy vs Intel Core i3-1125G4 vs Intel Core i5-1145G7

Qualcomm Snapdragon 8 Gen 2 for Galaxy

► remove from comparison Qualcomm SD 8 Gen 2 for Galaxy

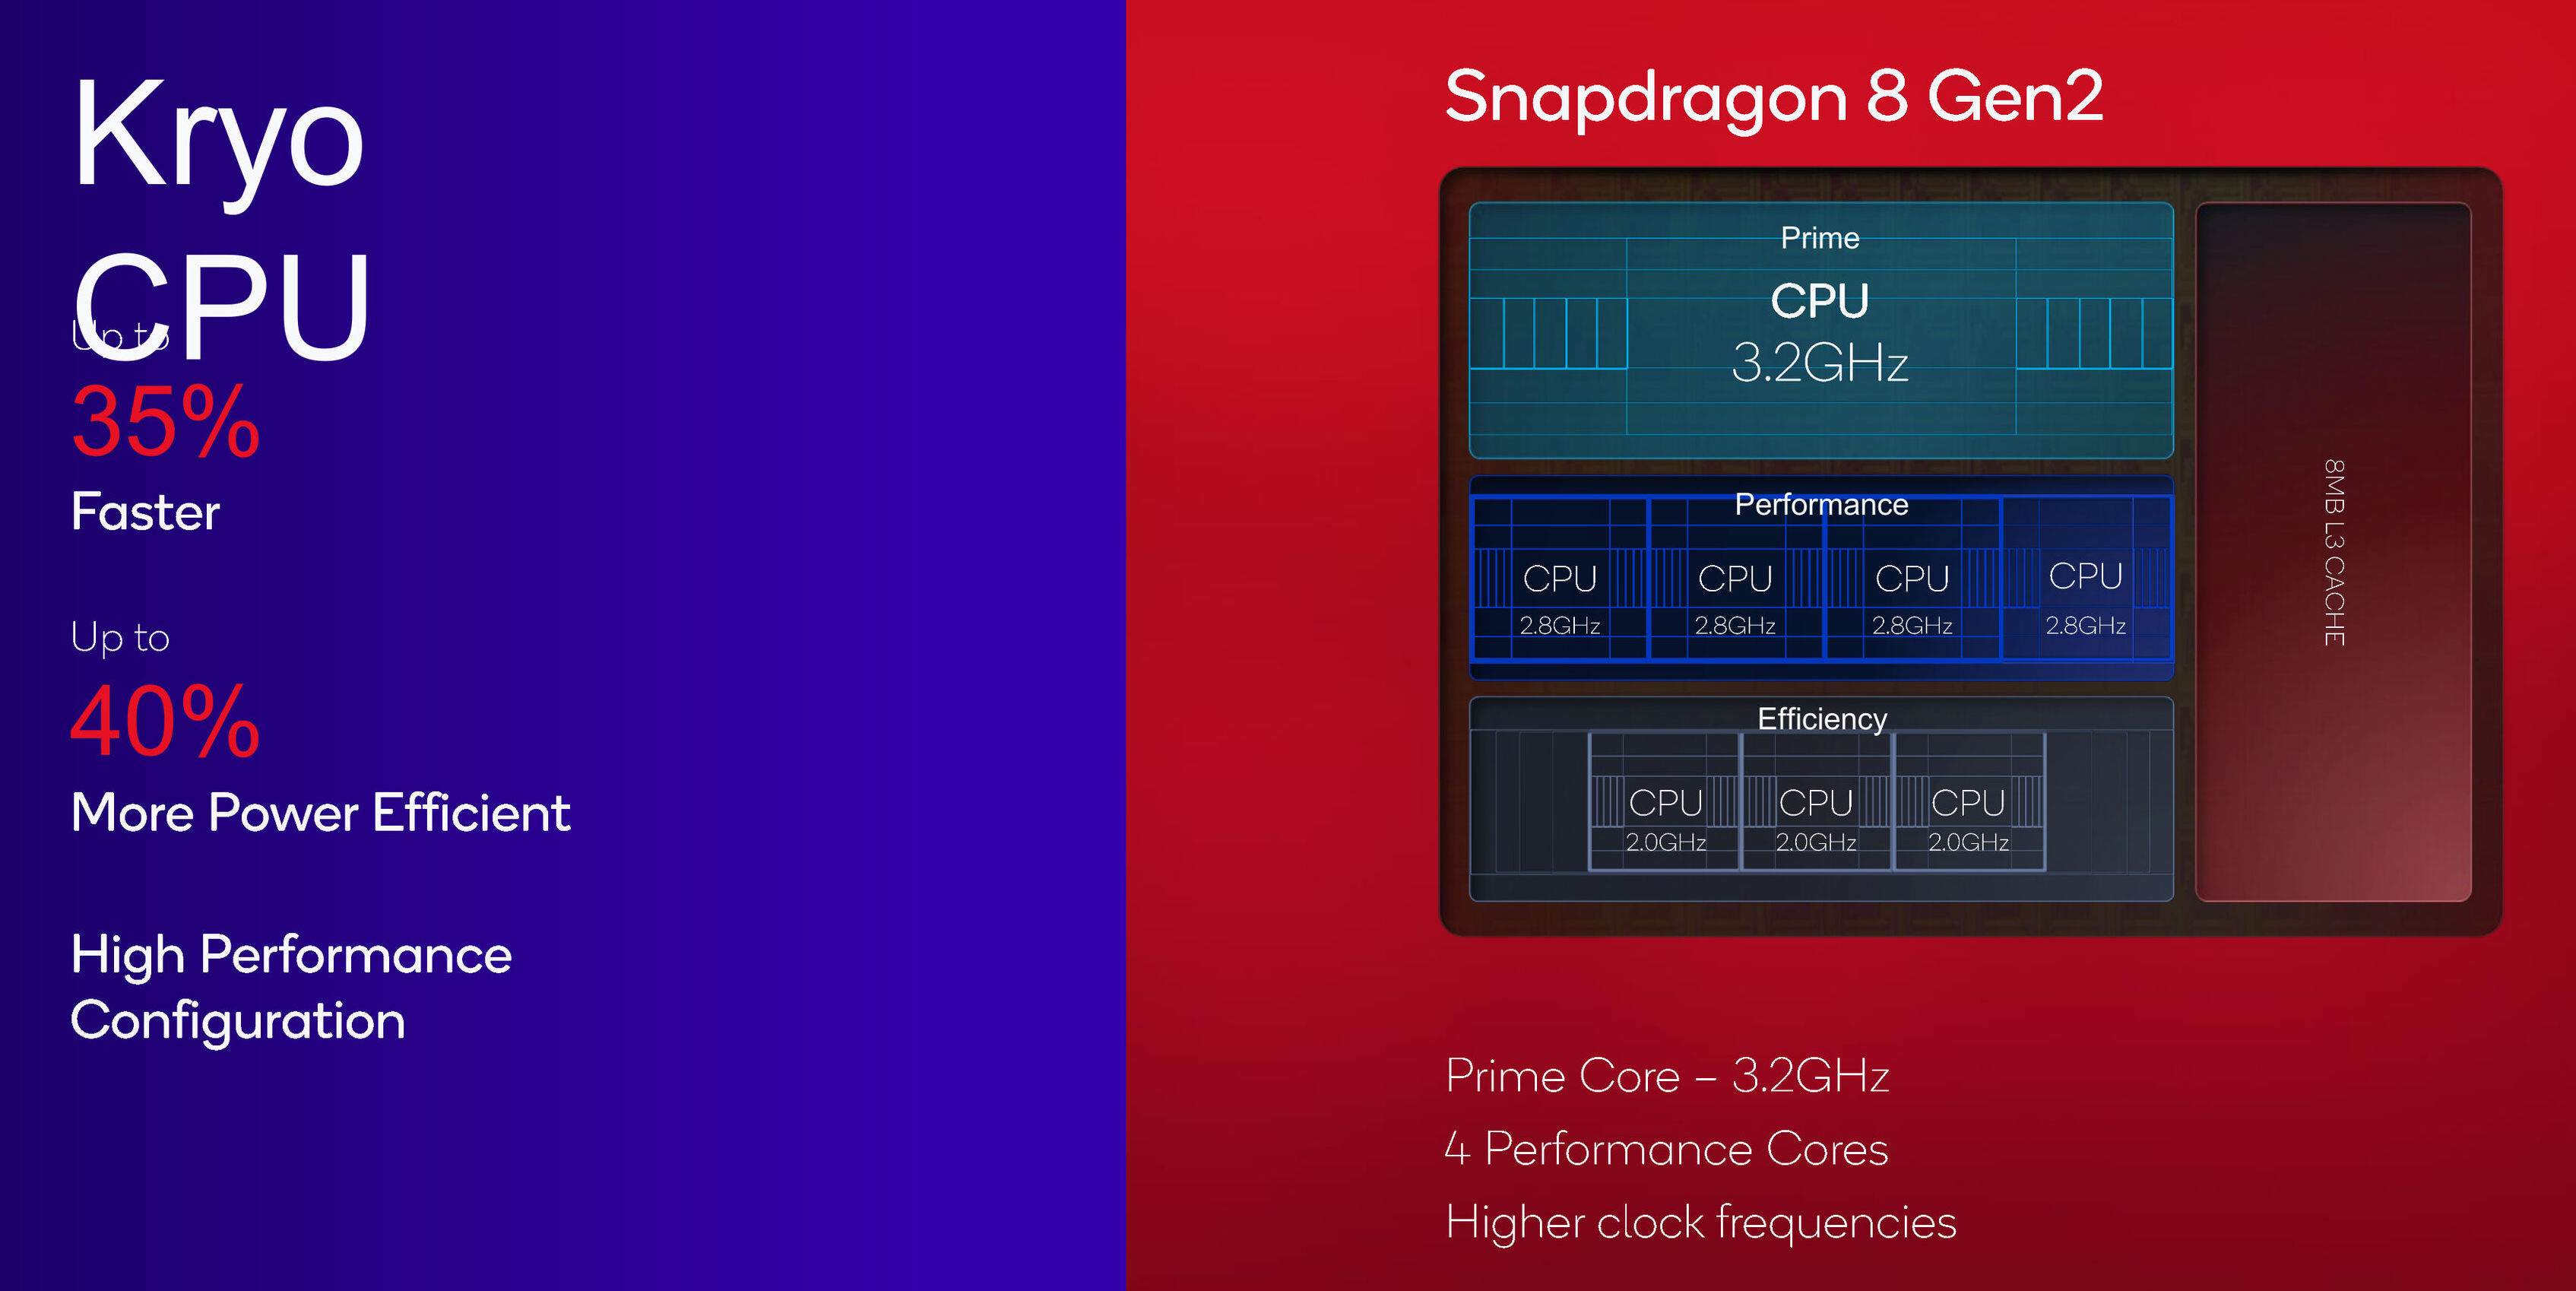
The Qualcomm Snapdragon 8 Gen 2 for Galaxy Mobile Platform is a high-end SoC for smartphones that was introduced in late 2022 and manufactured in 4 nm at TSMC (N4P). It integrates four different CPU clusters. A fast and big prime core based on the ARM Cortex-X3 architecture and clocked at up to 3.36 GHz for 64 bit applications. Two more ARM Cortex-A715 based performance cores clocked at up to 2.8 GHz (also only for 64 bit apps). Two more Cortex-A710 performance cores at up to 2.8 GHz that can also be used for older apps and three efficiency cores (ARM Cortex-A510 with up to 2 GHz). All cores can use the shared 8 MB level 3 cache. Compared to the normal SD 8 Gen 2, the "for Galaxy" version offers a 160 MHz higher clocked prime core.

Thanks to the new architecture and high clock rates, the SD 8 Gen 2 is the fastest mobile CPU for Android based devices and is only topped by current Apple SoCs like the Apple A16 (see benchmarks below).

The chip also integrates a Hexagon accelerator for AI workloads (tensor, scalar and vector). Qualcomm states that its one of the first chips with INT4 support and up to 4.35x performance compared to the previous generation. 

The 18-Bit-Spectra ISP is able to process photos with up to 200 MP and work with videos up to 8k30 (including 10-bit, HDR10+, HLG and Dolby Vision).

A big improvement of the Snapdragon 8 G2 is the integrated Adreno 740 GPU, that now supports Hardware Raytracing and tops even the iGPU in the Apple A16.

The integrated AI Engine can offer up to 4x faster AI performance thanks to the bigger Tensor engine. The 18-Bit-Spectra-ISP also saw some big improvements and is now called Snapdragon Sight.

The integrated Adreno 730 offers a 30% graphics boost compared to the previous Adreno 660.

The integrated Snapdragon X70 5G modem is also new as is the FastConnect 7800 modem with Wi-Fi 7 and Bluetooth 5.3 support.

Intel Core i3-1125G4

► remove from comparison Intel i3-1125G4

The Intel Core i3-1125G4 is a 28 W quad-core SoC for laptops and Ultrabooks of the Tiger Lake family (UP3) that was introduced in September 2020. It integrates four Willow Cove processor cores (8 threads thanks to Hyper-Threading). Each core can clock from 2 GHz (guaranteed base speed @ 28 W) to 3.7 GHz (single-core boost). All cores at once can clock at up to 3.3 GHz. The faster Core i7 models offer more Level 3 cache (12 versus 8 MB in the i5) and higher clocked cores.

Another novelty is the integrated Xe GPU based on the completely new Gen 12 architecture. In the i3-1125G4 Intel names the GPU UHD Graphics and offers only 48 of the 96 EUs clocked at 400 - 1250 MHz. The GPU and CPU can together use the 8 MB of L3 cache.

Furthermore, Tiger Lake SoCs add PCIe 4 support (four lanes), AI hardware acceleration, and the partial integration of Thunderbolt 4 / USB 4 and Wi-Fi 6 in the chip.

Performance

While we have not tested a single laptop built around the 1125G4 as of October 2023, we expect the chip's multi-thread performance to be 10% to 20% lower than that of the Core i5-1135G7 (4 cores, 8 threads, somewhat higher clock speeds).

Your mileage may vary depending on how high the CPU power limits are and how competent the cooling solution of your system is.

Power consumption

This Core i3 series chip has a default TDP of 12 W to 28 W, the expectation being that laptop makers will go for a higher value in exchange for higher performance. Either way, that's a little too high to allow for passively cooled designs.

The i3-1125G4 is manufactured on Intel's third-gen 10 nm process marketed as SuperFin for average, as of early 2023, energy efficiency.

Intel Core i5-1145G7

► remove from comparison Intel i5-1145G7

The Intel Core i5-1145G7 is a power efficient quad-core SoC for laptops and Ultrabooks based on the Tiger Lake-U generation that was announced early 2021. It integrates four Willow Cove processor cores (8 threads thanks to HyperThreading). The base clock speed depends on the TDP settings and ranges from 1.1 GHz (12 Watt TDP) up to 2.6 GHz (28 Watt). The Boost is always specified at 4.4 GHz (one or two cores).

Another novelty is the integrated Xe graphics card with 80 EUs based on the completely new Gen 12 architecture. It offers a significantly higher performance compared to the older Iris Plus G7 (Ice Lake).

Furthermore, Tiger Lake SoCs add PCIe 4 support (4 lanes), AI hardware acceleration, and the partial integration of Thunderbolt 4 / USB 4 and Wifi 6 in the chip. In addition to this, the i5 supports vPro for easy remote management.

The chip is produced on the improved 10nm SuperFin process at Intel that should be comparable to the 7nm process at TSMC (e.g. Ryzen 4000 series).

All articles on Tiger Lake can be found on our Tiger Lake architecture hub.

ModelQualcomm Snapdragon 8 Gen 2 for GalaxyIntel Core i3-1125G4Intel Core i5-1145G7
SeriesQualcomm SnapdragonIntel Tiger LakeIntel Tiger Lake
CodenameCortex-X3 / A715 / A710 / A510 (Kryo)Tiger Lake-UP3Tiger Lake-UP3
Series: Tiger Lake Tiger Lake-UP3
Qualcomm Snapdragon 8 Gen 2 for Galaxy « 2 - 3.36 GHz8 / 8 cores8 MB L3
Qualcomm Snapdragon 8 Gen 22 - 3.2 GHz8 / 8 cores8 MB L3
Intel Core i7-1195G72.9 - 5 GHz4 / 8 cores12 MB L3
Intel Core i7-1185G73 - 4.8 GHz4 / 8 cores12 MB L3
Intel Core i7-1165G72.8 - 4.7 GHz4 / 8 cores12 MB L3
Intel Core i5-1155G72.5 - 4.5 GHz4 / 8 cores8 MB L3
Intel Core i5-1145G72.6 - 4.4 GHz4 / 8 cores8 MB L3
Intel Core i5-1135G72.4 - 4.2 GHz4 / 8 cores8 MB L3
Intel Core i3-1125G4 « 2 - 3.7 GHz4 / 8 cores8 MB L3
Intel Core i3-1115G43 - 4.1 GHz2 / 4 cores6 MB L3
Intel Core i7-1195G72.9 - 5 GHz4 / 8 cores12 MB L3
Intel Core i7-1185G73 - 4.8 GHz4 / 8 cores12 MB L3
Intel Core i7-1165G72.8 - 4.7 GHz4 / 8 cores12 MB L3
Intel Core i5-1155G72.5 - 4.5 GHz4 / 8 cores8 MB L3
Intel Core i5-1145G7 « 2.6 - 4.4 GHz4 / 8 cores8 MB L3
Intel Core i5-1135G72.4 - 4.2 GHz4 / 8 cores8 MB L3
Intel Core i3-1125G42 - 3.7 GHz4 / 8 cores8 MB L3
Intel Core i3-1115G43 - 4.1 GHz2 / 4 cores6 MB L3
Clock2000 - 3360 MHz2000 - 3700 MHz2600 - 4400 MHz
L3 Cache8 MB8 MB8 MB
Cores / Threads8 / 8
1 x 3.4 GHz ARM Cortex-X3
2 x 2.8 GHz ARM Cortex-A715
2 x 2.8 GHz ARM Cortex-A710
3 x 2.0 GHz ARM Cortex-A510
4 / 84 / 8
Technology4 nm10 nm10 nm
FeaturesAdreno GPU, Spectra ISP, Hexagon, X70 5G Modem, FastConnect 7800 Wi-Fi 7, LPDDR5x 4200 MHz Memory ControllerDDR4-3200/LPDDR4x-3733 RAM, PCIe 4, 4 GT/s bus, DL Boost, GNA, MMX, SSE, SSE2, SSE3, SSSE3, SSE4.1, SSE4.2, AVX, AVX2, AVX-512, BMI2, ABM, FMA, ADX, VMX, SMX, SMEP, SMAP, EIST, TM1, TM2, Hyper-Threading, Turbo, SST, AES-NI, RDRAND, RDSEED, SHA, TMEDDR4-3200/LPDDR4x-4266 RAM, PCIe 4, 4 GT/s bus, DL Boost, GNA, vPro, MMX, SSE, SSE2, SSE3, SSSE3, SSE4.1, SSE4.2, AVX, AVX2, AVX-512, BMI2, ABM, FMA, ADX, VMX, SMX, SMEP, SMAP, EIST, TM1, TM2, HT, Turbo, SST, AES-NI, RDRAND, RDSEED, SHA, TME
iGPUQualcomm Adreno 740Intel UHD Graphics Xe G4 48EUs (400 - 1250 MHz)Intel Iris Xe Graphics G7 80EUs (400 - 1300 MHz)
ArchitectureARM v9x86x86
Announced
Manufacturerwww.qualcomm.comark.intel.comark.intel.com
L1 Cache320 KB320 KB
L2 Cache5 MB5 MB
TDP28 Watt28 Watt
max. Temp.100 °C100 °C
SocketBGA1449BGA1449

Benchmarks

Performance Rating - CB R15 + R20 + 7-Zip + X265 + Blender + 3DM11 CPU - i5-1145G7
32.8 pt (45%)
Intel Core i5-1145G7
32.8
max:
72.1 120%
0%
100%
Cinebench R23 - Cinebench R23 Multi Core
min: 4769     avg: 4880     median: 4880 (5%)     max: 4991 Points
Cinebench R23 - Cinebench R23 Single Core
min: 1361     avg: 1375     median: 1374.5 (58%)     max: 1388 Points
Cinebench R20 - Cinebench R20 CPU (Single Core)
531 Points (59%)
Cinebench R20 - Cinebench R20 CPU (Multi Core)
min: 1693     avg: 1842     median: 1841.5 (4%)     max: 1990 Points
Cinebench R15 - Cinebench R15 CPU Multi 64 Bit
min: 791     avg: 792     median: 791.5 (5%)     max: 792 Points
Cinebench R15 - Cinebench R15 CPU Single 64 Bit
min: 202     avg: 202.5     median: 202.5 (61%)     max: 203 Points
Cinebench R11.5 - Cinebench R11.5 CPU Multi 64 Bit
min: 9.12     avg: 9.3     median: 9.3 (12%)     max: 9.41 Points
Cinebench R11.5 - Cinebench R11.5 CPU Single 64 Bit
min: 2.26     avg: 2.3     median: 2.3 (57%)     max: 2.36 Points
Cinebench R10 - Cinebench R10 Rend. Single (32bit)
min: 8225     avg: 8275     median: 8274.5 (50%)     max: 8324 Points
Cinebench R10 - Cinebench R10 Rend. Multi (32bit)
min: 25475     avg: 25545     median: 25545 (19%)     max: 25615 Points
Cinebench R10 - Cinebench R10 Rend. Multi (64bit)
min: 33427     avg: 34400     median: 34399.5 (24%)     max: 35372 Points
Cinebench R10 - Cinebench R10 Rend. Single (64bit)
min: 10472     avg: 10648     median: 10648 (13%)     max: 10824 Points
wPrime 2.10 - wPrime 2.0 1024m *
min: 227.285     avg: 281.1     median: 281.1 (3%)     max: 335 s
wPrime 2.10 - wPrime 2.0 32m *
min: 6.499     avg: 8.4     median: 8.3 (2%)     max: 10.2 s
WinRAR - WinRAR 4.0
min: 4190     avg: 4707     median: 4706.5 (7%)     max: 5223 Points
7-Zip 18.03 - 7-Zip 18.03 Multli Thread 4 runs
min: 20565     avg: 21844     median: 21844 (13%)     max: 23123 MIPS
7-Zip 18.03 - 7-Zip 18.03 Single Thread 4 runs
min: 4751     avg: 4802     median: 4802 (57%)     max: 4853 MIPS
X264 HD Benchmark 4.0 - x264 Pass 2
46.3 fps (16%)
X264 HD Benchmark 4.0 - x264 Pass 1
192 fps (44%)
HWBOT x265 Benchmark v2.2 - HWBOT x265 4k Preset
min: 5.46     avg: 6     median: 6 (11%)     max: 6.6 fps
TrueCrypt - TrueCrypt Serpent
min: 0.437     avg: 0.5     median: 0.5 (0%)     max: 0.469 GB/s
TrueCrypt - TrueCrypt Twofish
min: 0.713     avg: 0.8     median: 0.8 (13%)     max: 0.802 GB/s
TrueCrypt - TrueCrypt AES
5.6 GB/s (15%)
Blender - Blender 3.3 Classroom CPU *
1116 Seconds (14%)
Blender - Blender 2.79 BMW27 CPU *
min: 601     avg: 641     median: 641 (5%)     max: 681 Seconds
R Benchmark 2.5 - R Benchmark 2.5 *
min: 0.627     avg: 0.6     median: 0.6 (14%)     max: 0.63 sec
3DMark 06 - CPU - 3DMark 06 - CPU
min: 8786     avg: 8923     median: 8922.5 (19%)     max: 9059 Points
Super Pi mod 1.5 XS 1M - Super Pi mod 1.5 XS 1M *
min: 7.2     avg: 7.5     median: 7.5 (2%)     max: 7.825 s
Super Pi mod 1.5 XS 2M - Super Pi mod 1.5 XS 2M *
min: 15.7     avg: 16.5     median: 16.5 (1%)     max: 17.298 s
Super Pi Mod 1.5 XS 32M - Super Pi mod 1.5 XS 32M *
min: 366     avg: 389.8     median: 389.8 (2%)     max: 413.691 s
3DMark Vantage - 3DM Vant. Perf. CPU no Physx
30874 Points (27%)
3DMark 11 - 3DM11 Performance Physics
min: 10880     avg: 11208     median: 11208 (30%)     max: 11536 Points
3DMark - 3DMark Ice Storm Physics
63423 Points (52%)
3DMark - 3DMark Ice Storm Extreme Physics
63591 Points (52%)
3DMark - 3DMark Ice Storm Unlimited Physics
65828 Points (55%)
3DMark - 3DMark Cloud Gate Physics
min: 8524     avg: 8726     median: 8725.5 (22%)     max: 8927 Points
3DMark - 3DMark Fire Strike Standard Physics
min: 13209     avg: 13311     median: 13311 (24%)     max: 13413 Points
3DMark - 3DMark Time Spy CPU
min: 4092     avg: 4290     median: 4289.5 (18%)     max: 4487 Points
1198 Points (51%)
min: 1427     avg: 1429     median: 1428.5 (60%)     max: 1430 Points
3738 Points (7%)
min: 5055     avg: 5261     median: 5261 (9%)     max: 5467 Points
Geekbench 5.0 - Geekbench 5.0 64 Bit Single-Core
1423 Points (6%)
Geekbench 5.0 - Geekbench 5.0 64 Bit Multi-Core
5351 Points (17%)
Geekbench 4.4 - Geekbench 4.1 - 4.4 64 Bit Single-Core
min: 8370     avg: 8391     median: 8380 (84%)     max: 8424 Points
6226 Points (62%)
Geekbench 4.4 - Geekbench 4.1 - 4.4 64 Bit Multi-Core
min: 21038     avg: 21162     median: 21209 (23%)     max: 21238 Points
20787 Points (23%)
Geekbench 4.0 - Geekbench 4.0 64 Bit Single-Core
min: 6882     avg: 6950     median: 6949.5 (95%)     max: 7017 Points
Geekbench 4.0 - Geekbench 4.0 64 Bit Multi-Core
min: 19260     avg: 19271     median: 19270.5 (47%)     max: 19281 Points
Geekbench 3 - Geekbench 3 64 Bit Multi-Core
19117 Points (30%)
Geekbench 3 - Geekbench 3 64 Bit Single-Core
6624 Points (99%)
Mozilla Kraken 1.1 - Kraken 1.1 Total Score *
min: 634.3     avg: 795     median: 696.2 (1%)     max: 1532.5 ms
min: 702     avg: 712     median: 712 (1%)     max: 722 ms
Octane V2 - Octane V2 Total Score
min: 49582     avg: 59058     median: 60115 (54%)     max: 64715 Points
177.4 Points (51%)
WebXPRT 3 - WebXPRT 3 Score
min: 183     avg: 219     median: 231 (48%)     max: 243 Points
min: 234     avg: 238.5     median: 238.5 (50%)     max: 243 Points
PCMark for Android - PCM f. Android Storage 2.0 random write internal
85.7 MB/s (63%)
PCMark for Android - PCM f. Android Storage 2.0 seq write internal
2081 MB/s (64%)
PCMark for Android - PCM f. Android Storage 2.0 random read internal
50.9 MB/s (62%)
PCMark for Android - PCM f. Android Storage 2.0 seq read internal
2371 MB/s (66%)
PCMark for Android - PCM f. Android Storage 2.0 score
min: 35786     avg: 42805     median: 41063 (65%)     max: 48832 Points
min: 1279     avg: 1285     median: 1284.5 (49%)     max: 1290 Points
Power Consumption - Prime95 Power Consumption - external Monitor *
min: 38     avg: 42.8     median: 42.8 (7%)     max: 47.5 Watt
Power Consumption - Cinebench R15 Multi Power Consumption - external Monitor *
min: 45.2     avg: 50.4     median: 50.4 (9%)     max: 55.5 Watt
Power Consumption - Idle Power Consumption - external Monitor *
10.9 Watt (7%)
3.6 Watt (4%)
Power Consumption - Cinebench R15 Multi Power Efficiency - external Monitor
17.5 Points per Watt (13%)

Average Benchmarks Qualcomm Snapdragon 8 Gen 2 for Galaxy → 100% n=2

Average Benchmarks Intel Core i3-1125G4 → 76% n=2

Average Benchmarks Intel Core i5-1145G7 → 99% n=2

- Range of benchmark values for this graphics card
- Average benchmark values for this graphics card
* Smaller numbers mean a higher performance
1 This benchmark is not used for the average calculation

v1.26
log 29. 16:21:05

#0 checking url part for id 14990 +0s ... 0s

#1 checking url part for id 12740 +0s ... 0s

#2 checking url part for id 12236 +0s ... 0s

#3 not redirecting to Ajax server +0s ... 0s

#4 did not recreate cache, as it is less than 5 days old! Created at Tue, 28 May 2024 05:33:54 +0200 +0.001s ... 0.001s

#5 composed specs +0.031s ... 0.032s

#6 did output specs +0s ... 0.032s

#7 getting avg benchmarks for device 14990 +0.003s ... 0.034s

#8 got single benchmarks 14990 +0.021s ... 0.055s

#9 getting avg benchmarks for device 12740 +0.002s ... 0.058s

#10 got single benchmarks 12740 +0.011s ... 0.069s

#11 getting avg benchmarks for device 12236 +0.015s ... 0.084s

#12 got single benchmarks 12236 +0.018s ... 0.102s

#13 got avg benchmarks for devices +0s ... 0.102s

#14 min, max, avg, median took s +0.229s ... 0.331s

#15 return log +0s ... 0.331s

Please share our article, every link counts!
> Expert Reviews and News on Laptops, Smartphones and Tech Innovations > Benchmarks / Tech > Processor Comparison - Head 2 Head
Redaktion, 2017-09- 8 (Update: 2023-07- 1)