

Intel Celeron N3150 vs Intel Celeron N5095A vs Intel Celeron N5095
Intel Celeron N3150
► remove from comparison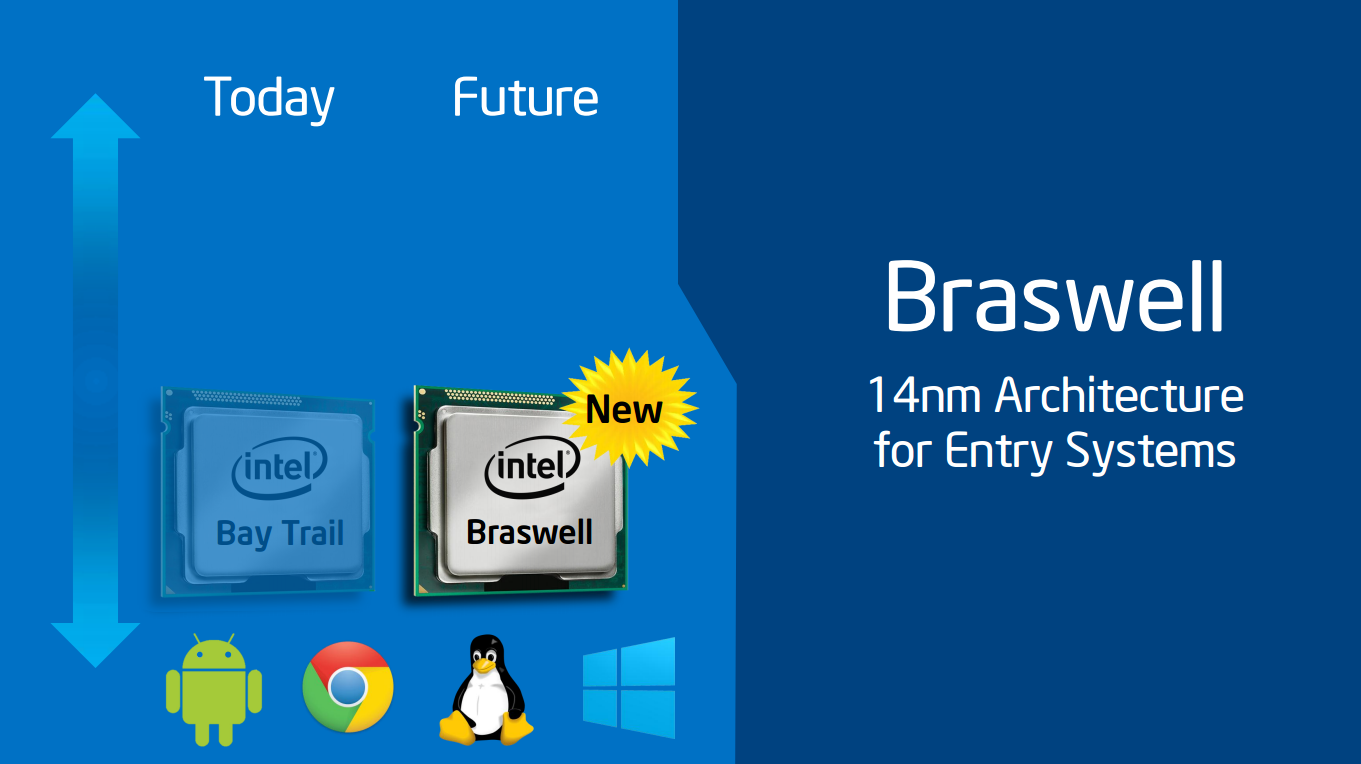
The Intel Celeron N3150 is a quad-core SoC for entry-level notebooks, which has been presented in early 2015. It is clocked at 1.6 - 2.08 GHz and part of the Braswell platform. Thanks to its new 14 nanometer low-power process (P1273) with tri-gate transistors, energy efficiency has been significantly improved compared to its predecessor Bay Trail (e.g. Celeron N2930). In addition to the CPU cores, the SoC offers a DirectX 11.2-capable GPU as well as a DDR3L Memory Controller (2x 64 bit, 25.6 GB/s).
Architecture
The processor cores are based on the Airmont architecture, which is basically a slightly modified shrink of the previous Silvermont core. While performance per clock has not been improved, the more efficient 14 nm process may lead to a better utilization of the CPU Burst (alias Turbo Boost) and therefore a somewhat higher performance in certain situations.
Performance
Compared to its predecessor Celeron N2930 (1.8 - 2.2 GHz) or the competing AMD APU E2-6110, the N3150 offers an almost identical performance. Using Windows, the CPU is adequate for everyday tasks such as Internet browsing or office applications, but may struggle in more demanding software.
Graphics
The HD Graphics (Braswell) is based on the Intel Gen8 architecture, which supports DirectX 11.2 and is also found in the Broadwell series (e.g. HD Graphics 5300). With 12 EUs (Execution Units) and a clock speed of up to 640 MHz, the GPU is almost twice as fast as the HD Graphics (Bay Trail), but still not powerful enough to handle demanding 3D games of 2015. The GPU also supports 4K/H.265 video acceleration.
Power Consumption
The entire SoC is rated at an TDP of 6 watts (SDP 4 watts). Thus, the chip can be cooled passively.
Intel Celeron N5095A
► remove from comparisonThe Celeron N5095A is an inexpensive quad-core SoC of the Jasper Lake product family designed for use in affordable SFF desktops and laptops. It features four Tremont CPU cores running at 2 GHz that Boost to up to 2.9 GHz with no thread-doubling Hyper-Threading technology in sight. A pretty basic iGPU is present as well.
The only difference between the N5095A and the N5095 is that the former comes with support for more proprietary Intel technologies such as the Smart Sound DSP, Wake on Voice and HD Audio.
Architecture and Features
Tremont brings many improvements over Goldmont Plus, the architecture that we know from the N5030 and myriads of other N-class CPUs. An up to 30% boost in single-thread performance is to be expected thanks to smarter prefetchers, branch prediction improvements and other refinements, according to Intel. These new chips are physically larger than their immediate predecessors as a result. Either way, this is still a "small" core rather than a "big" one according to ChipsAndCheese.
The Celeron has 1.5 MB of L2 and 4 MB of L3 cache and is compatible with DDR4-2933 and LPDDR4x-2933 memory or slower. Support for Intel CNVi Wi-Fi 6 modules is baked into the chip, as are 8 PCIe 3.0 lanes for NVMe SSD speeds up to 3.9 GB/s. USB 4 or Thunderbolt aren't supported however.
Please also note that the Celeron gets soldered to the motherboard (BGA1338 socket interface) for good and is thus not user-replaceable.
Performance
While we haven't tested a single system featuring the N5095A as of Sep 2024, we have done several reviews of computers/laptops powered by the N5095. CPU performance should be pretty much identical between the two. Therefore, we fully expect the chip to be about as fast as the Core i3-10110U, Core i3-1005G1, Celeron N5105 and also the Ryzen 3 3200U in multi-threaded workloads. Which is just enough for the most basic of tasks in late 2024.
Performance will get a significant hit if the power target is set to 10 W or 6 W instead of the Intel-recommended 15 W value.
Graphics
The DirectX 12.1-capable 16 EU UHD Graphics runs at up to 750 MHz and is in many respects similar to what Ice Lake CPUs come equipped with. This graphics adapter is capable of driving up to 3 SUHD displays simultaneously; HEVC, AVC, VP9, MPEG-2 and other popular video codecs can all be hardware-decoded. AV1 and VVC can't.
As far as gaming is concerned, it is reasonable to expect playable framerates in really old games (like Dota 2 Reborn) provided one sticks to lower resolutions such as HD 720p.
Power consumption
While most N-class chips have a 6 W long-term power target, the Celeron N5095A has a 15 W TDP to mimic much faster U-class Core processors. This isn't a great CPU for passively cooled designs.
The N5095A is built with the same 10 nm Intel process as Ice Lake-U processors for pretty unimpressive power efficiency, as of late 2024.
Intel Celeron N5095
► remove from comparisonThe Celeron N5095 is an inexpensive quad-core SoC of the Jasper Lake product family designed for use in affordable SFF desktops and laptops. It features four Tremont CPU cores running at 2 GHz that Boost to up to 2.9 GHz with no thread-doubling Hyper-Threading technology in sight. A pretty basic iGPU is present as well.
The only difference between the N5095 and the N5095A is that the latter comes with support for more proprietary Intel technologies such as the Smart Sound DSP, Wake on Voice and HD Audio.
Architecture and Features
Tremont brings many improvements over Goldmont Plus, the architecture that we know from the N5030 and myriads of other N-class CPUs. An up to 30% boost in single-thread performance is to be expected thanks to smarter prefetchers, branch prediction improvements and other refinements, according to Intel. These new chips are physically larger than their immediate predecessors as a result. Either way, this is still a "small" core rather than a "big" one according to ChipsAndCheese.
The Celeron has 1.5 MB of L2 and 4 MB of L3 cache and is compatible with DDR4-2933 and LPDDR4x-2933 memory or slower. Support for Intel CNVi Wi-Fi 6 modules is baked into the chip, as are 8 PCIe 3.0 lanes for NVMe SSD speeds up to 3.9 GB/s. USB 4 or Thunderbolt aren't supported however.
Please also note that the Celeron gets soldered to the motherboard (BGA1338 socket interface) for good and is thus not user-replaceable.
Performance
The average N5095 in our database is about as fast as the Core i3-10110U, Core i3-1005G1, Celeron N5105 and also the Ryzen 3 3200U in multi-threaded workloads. Which is just enough for the most basic of tasks in late 2024.
Performance will get a significant hit if the power target is set to 10 W or 6 W instead of the Intel-recommended 15 W value.
Graphics
The DirectX 12.1-capable 16 EU UHD Graphics runs at up to 750 MHz and is in many respects similar to what Ice Lake CPUs come equipped with. This graphics adapter is capable of driving up to 3 SUHD displays simultaneously; HEVC, AVC, VP9, MPEG-2 and other popular video codecs can all be hardware-decoded. AV1 and VVC can't.
As far as gaming is concerned, it is reasonable to expect playable framerates in really old games (like Dota 2 Reborn) provided one sticks to lower resolutions such as HD 720p.
Power consumption
While most N-class chips have a 6 W long-term power target, the Celeron N5095 has a 15 W TDP to mimic much faster U-class Core processors. This isn't a great CPU for passively cooled designs.
The N5095 is built with the same 10 nm Intel process as Ice Lake-U processors for pretty unimpressive power efficiency, as of late 2024.
| Model | Intel Celeron N3150 | Intel Celeron N5095A | Intel Celeron N5095 | ||||||||||||||||||||||||||||||||||||||||||||||||||||||||||||||||||||||||||||||||||||
| Codename | Braswell | Jasper Lake | Jasper Lake | ||||||||||||||||||||||||||||||||||||||||||||||||||||||||||||||||||||||||||||||||||||
| Series | Intel Celeron | Intel Jasper Lake | Intel Jasper Lake | ||||||||||||||||||||||||||||||||||||||||||||||||||||||||||||||||||||||||||||||||||||
| Series: Jasper Lake Jasper Lake |
|
|
| ||||||||||||||||||||||||||||||||||||||||||||||||||||||||||||||||||||||||||||||||||||
| Clock | 1600 - 2080 MHz | 2000 - 2900 MHz | 2000 - 2900 MHz | ||||||||||||||||||||||||||||||||||||||||||||||||||||||||||||||||||||||||||||||||||||
| L2 Cache | 2 MB | 1.5 MB | 1.5 MB | ||||||||||||||||||||||||||||||||||||||||||||||||||||||||||||||||||||||||||||||||||||
| Cores / Threads | 4 / 4 | 4 / 4 4 x 2.9 GHz Intel Tremont | 4 / 4 4 x 2.9 GHz Intel Tremont | ||||||||||||||||||||||||||||||||||||||||||||||||||||||||||||||||||||||||||||||||||||
| TDP | 6 Watt | 15 Watt | 15 Watt | ||||||||||||||||||||||||||||||||||||||||||||||||||||||||||||||||||||||||||||||||||||
| Technology | 14 nm | 10 nm | 10 nm | ||||||||||||||||||||||||||||||||||||||||||||||||||||||||||||||||||||||||||||||||||||
| max. Temp. | 90 °C | 105 °C | |||||||||||||||||||||||||||||||||||||||||||||||||||||||||||||||||||||||||||||||||||||
| Socket | FCBGA1170 | BGA1338 | BGA1338 | ||||||||||||||||||||||||||||||||||||||||||||||||||||||||||||||||||||||||||||||||||||
| Features | Intel HD Graphics (Braswell, 12 EUs, 320 - 640 MHz), Wireless Display, Quick Sync, AES-NI, max. 8 GB Dual-Channel DDR3L-1600 (25,6 GB/s), 5x USB 3.0, 4x PCIe 2.0, 2x SATA 6.0 Gbit/s | DDR4-2933/LPDDR4x-2933 RAM, PCIe 3, GNA, MMX, SSE, SSE2, SSE3, SSSE3, SSE4.1, SSE4.2, VMX, SMEP, SMAP, EIST, TM1, TM2, Turbo, SST, AES-NI, RDRAND, RDSEED, SHA | DDR4-2933/LPDDR4x-2933 RAM, PCIe 3, GNA, MMX, SSE, SSE2, SSE3, SSSE3, SSE4.1, SSE4.2, VMX, SMEP, SMAP, EIST, TM1, TM2, Turbo, SST, AES-NI, RDRAND, RDSEED, SHA | ||||||||||||||||||||||||||||||||||||||||||||||||||||||||||||||||||||||||||||||||||||
| iGPU | Intel HD Graphics (Braswell) (320 - 640 MHz) | Intel UHD Graphics (Jasper Lake 16 EU) (450 - 750 MHz) | Intel UHD Graphics (Jasper Lake 16 EU) (450 - 750 MHz) | ||||||||||||||||||||||||||||||||||||||||||||||||||||||||||||||||||||||||||||||||||||
| Architecture | x86 | x86 | x86 | ||||||||||||||||||||||||||||||||||||||||||||||||||||||||||||||||||||||||||||||||||||
| $107 U.S. | |||||||||||||||||||||||||||||||||||||||||||||||||||||||||||||||||||||||||||||||||||||||
| Announced | |||||||||||||||||||||||||||||||||||||||||||||||||||||||||||||||||||||||||||||||||||||||
| Manufacturer | ark.intel.com | ark.intel.com | ark.intel.com | ||||||||||||||||||||||||||||||||||||||||||||||||||||||||||||||||||||||||||||||||||||
| L3 Cache | 4 MB | 4 MB |

Benchmarks

Average Benchmarks Intel Celeron N3150 → 0% n=0
Average Benchmarks Intel Celeron N5095 → 0% n=0
* Smaller numbers mean a higher performance
1 This benchmark is not used for the average calculation