ARM Mali-400 MP2 vs PowerVR SGX531
ARM Mali-400 MP2 ► remove from comparison
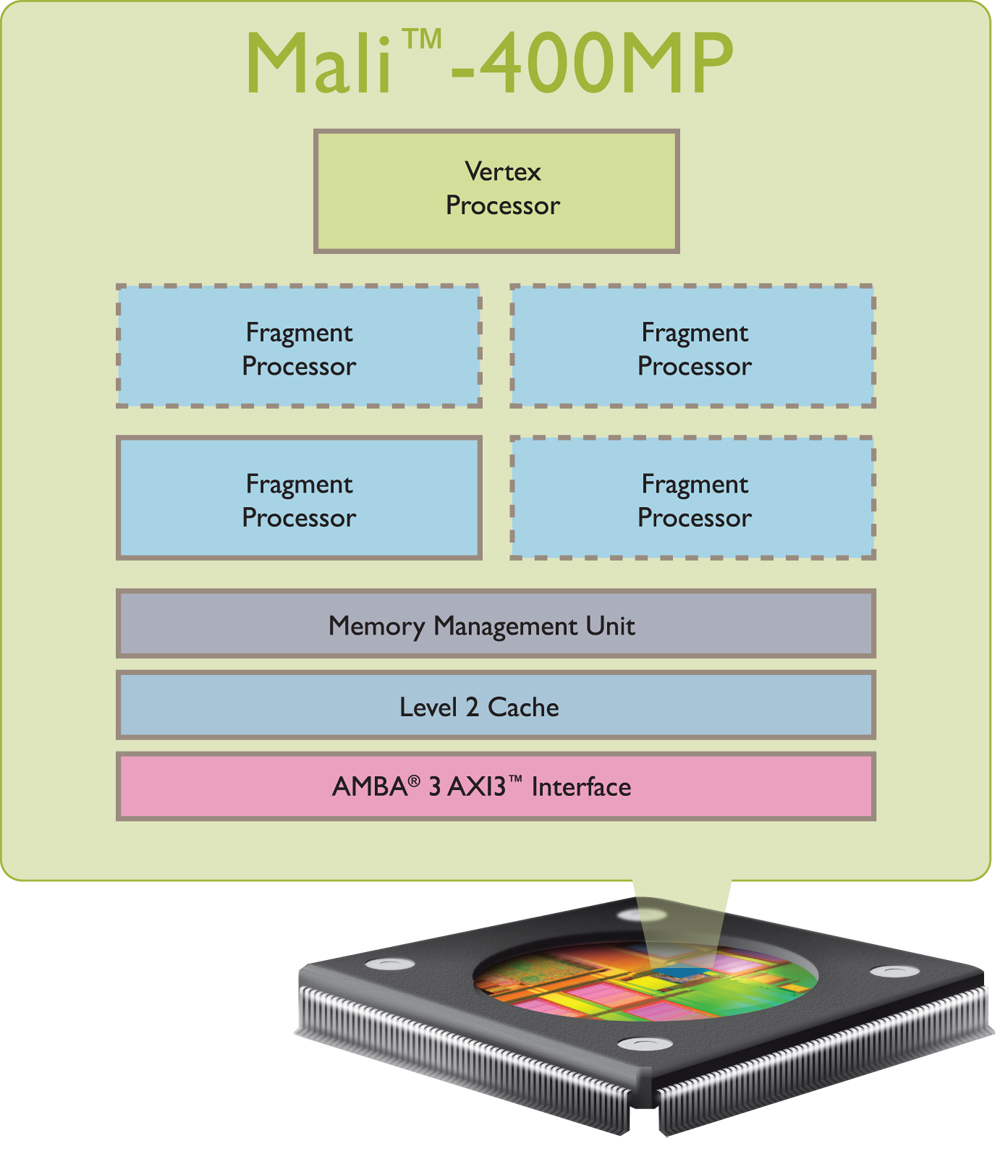
The ARM Mali-400 MP4 is an OpenGL ES 2.0 capable GPU for ARM SoCs (System on a Chip). It is primarily designed for tablets and smartphones with mobile operating systems like Android. MP2 is the version with two cores (so called fragment processors) and a vertex processor.
PowerVR SGX531 ► remove from comparison
The PowerVR SGX531 is an integrated graphics card that can be found in mostly ARM based SoCs for tablets and smartphones. It offers 2 pixel and 1 vertex shaders that are usually clocked at 200 MHz. The GPU supports OpenGL ES 2.0 and was announced in Oct. of 2006.
ARM Mali-400 MP2 PowerVR SGX531 PowerVR SGX500 Series Architecture Utgard PowerVR SGX5 Pipelines 2 / 1 Pixel- / Vertexshader 2 / 1 Pixel- / Vertexshader Shared Memory no no API OpenGL ES 2.0 OpenGL ES 2.0 Date of Announcement 02.06.2008 01.10.2006 Link to Manufacturer Page www.arm.com
Benchmarks 3DMark - 3DMark Ice Storm Unlimited Graphics
min: 2386 avg: 2497 median: 2465 (0%) max: 3146 Points
536 Points (0%)
3DMark - 3DMark Ice Storm Extreme Graphics
min: 1539 avg: 1703 median: 1687 (0%) max: 2000 Points
3DMark - 3DMark Ice Storm Graphics
min: 1957 avg: 2662 median: 2654.5 (0%) max: 3453 Points
min: 382 avg: 539 median: 562 (0%) max: 672 Points
3DMark - 3DMark Sling Shot (ES 3.0) Unlimited
0 Points (0%)
3DMark - 3DMark Sling Shot (ES 3.0) Unlimited Graphics
0 Points (0%)
3DMark - 3DMark Sling Shot Extreme (ES 3.1) Unlimited
0 Points (0%)
3DMark - 3DMark Sling Shot Extreme (ES 3.1) Unlimited Graphics
0 Points (0%)
GFXBench - GFXBench 5.0 Aztec Ruins High Tier Offscreen
0 fps (0%)
GFXBench - GFXBench 5.0 Aztec Ruins Normal Tier Offscreen
0 fps (0%)
GFXBench - GFXBench Car Chase Offscreen
0 fps (0%)
GFXBench 3.1 - GFXBench Manhattan ES 3.1 Offscreen
0 fps (0%)
GFXBench 3.0 - GFXBench 3.0 Manhattan Offscreen
min: avg: 0 (0%) max: 0 fps
GFXBench (DX / GLBenchmark) 2.7 + ARM Mali-400 MP2 GFXBench (DX / GLBenchmark) 2.7 - GFXBench T-Rex HD Offscreen C24Z16
min: 3.7 avg: 4.6 median: 4.3 (0%) max: 11 fps
GFXBench T-Rex HD Offscreen C24Z16 + PowerVR SGX531 0.5 fps (0%)
AnTuTu 3DRating - Antutu 3DRating Off-screen
1594 Points (55%)
min: 544 avg: 746 median: 746.5 (26%) max: 909 Points
AnTuTu 3DRating - Antutu 3DRating Score
min: 2244 avg: 2525 median: 2524.5 (22%) max: 2805 Points
min: 1262 avg: 1613 median: 1527 (13%) max: 2074 Points
AnTuTu v3 - AnTuTu v3 GPU
3736 Points (39%)
min: 707 avg: 1630 median: 1708 (18%) max: 2131 Points
Basemark ES 2.0 - Basemark ES 2.0
min: 20.4 avg: 31.7 median: 32.9 (54%) max: 41.19 fps
min: 4.88 avg: 7.5 median: 7.8 (13%) max: 9.22 fps
Basemark X 1.1 - Basemark X 1.1 High Quality
min: 1630 avg: 1652 median: 1643 (4%) max: 1693 Points
Basemark X 1.1 - Basemark X 1.1 Medium Quality
min: 4820 avg: 4828 median: 4830.5 (11%) max: 4832 Points
NenaMark2 - NenaMark2 Score
min: 41.1 avg: 52.3 median: 54.8 (81%) max: 58.4 fps
min: 17 avg: 22.4 median: 23.6 (35%) max: 25.1 fps
PassMark PerformanceTest Mobile V1 - PerformanceTest Mobile V1 2D Graphics Tests
min: 2046 avg: 2294 median: 2346.5 (2%) max: 2412 Points
min: 2079 avg: 2217 median: 2183 (2%) max: 2424 Points
PassMark PerformanceTest Mobile V1 - PerformanceTest Mobile V1 3D Graphics Tests
min: 678 avg: 763 median: 769.5 (1%) max: 838 Points
min: 373 avg: 463.5 median: 487.5 (1%) max: 506 Points
Smartbench 2012 - Smartbench 2012 Gaming Index
min: 1529 avg: 2406 median: 2276.5 (49%) max: 3190 Points
min: 1289 avg: 1572 median: 1630 (35%) max: 1905 Points
Average Benchmarks ARM Mali-400 MP2 → 100% n=11 Average Benchmarks PowerVR SGX531 → 46% n=11
- Range of benchmark values for this graphics card
- Average benchmark values for this graphics card
* Smaller numbers mean a higher performance
1 This benchmark is not used for the average calculation
Game Benchmarks The following benchmarks stem from our benchmarks of review laptops. The performance depends on the used graphics memory, clock rate, processor, system settings, drivers, and operating systems. So the results don't have to be representative for all laptops with this GPU. For detailed information on the benchmark results, click on the fps number.
100%
Mali-400 MP2:
30 [X] LG K7 Mediatek MT6580M 1.3GHz
Mali-400 MP2
fps
100%
Mali-400 MP2:
23 27 43 [X] LG K7 Mediatek MT6580M 1.3GHz
Mali-400 MP2
~ 31 fps
100%
Mali-400 MP2:
14 15 31 [X] LG K7 Mediatek MT6580M 1.3GHz
Mali-400 MP2
~ 20 fps
100%
Mali-400 MP2:
50 54 ~ 52 fps
100%
Mali-400 MP2:
21 22 ~ 22 fps
Average Gaming ARM Mali-400 MP2 → 100% Average Gaming 30-70 fps → 100%
ARM Mali-400 MP2 low med. high ultra QHD 4K Dead Trigger 2 30 Asphalt 8: Airborne 31 20 Real Racing 3 52 22 < 30 fps < 60 fps < 120 fps ≥ 120 fps 2 2 1
For more games that might be playable and a list of all games and graphics cards visit our Gaming List
v1.27
log 11. 11:45:25
#0 checking url part for id 3531 +0s ... 0s
#1 checking url part for id 3745 +0s ... 0s
#2 not redirecting to Ajax server +0s ... 0s
#3 did not recreate cache, as it is less than 5 days old! Created at Mon, 10 Jun 2024 05:39:56 +0200 +0.001s ... 0.001s
#4 composed specs +0.098s ... 0.099s
#5 did output specs +0s ... 0.099s
#6 start showIntegratedCPUs +0s ... 0.099s
#7 getting avg benchmarks for device 3531 +0.031s ... 0.129s
#8 got single benchmarks 3531 +0.129s ... 0.259s
#9 getting avg benchmarks for device 3745 +0.002s ... 0.261s
#10 got single benchmarks 3745 +0.023s ... 0.284s
#11 got avg benchmarks for devices +0s ... 0.284s
#12 No cached benchmark found, getting uncached values +0.04s ... 0.324s
#13 No cached benchmark found, getting uncached values +0.005s ... 0.329s
#14 No cached benchmark found, getting uncached values +0.004s ... 0.333s
#15 No cached benchmark found, getting uncached values +0.005s ... 0.337s
#16 No cached benchmark found, getting uncached values +0.002s ... 0.34s
#17 No cached benchmark found, getting uncached values +0.003s ... 0.343s
#18 No cached benchmark found, getting uncached values +0.003s ... 0.345s
#19 No cached benchmark found, getting uncached values +0.003s ... 0.348s
#20 No cached benchmark found, getting uncached values +0.003s ... 0.351s
#21 min, max, avg, median took s +0.046s ... 0.396s
#22 before gaming benchmark output +0s ... 0.396s
#23 Got 11 rows for game benchmarks. +0.015s ... 0.411s
#24 composed SQL query for gamebenchmarks +0s ... 0.411s
#25 got data and put it in $dataArray +0.001s ... 0.413s
#26 benchmarks composed for output. +0.007s ... 0.42s
#27 calculated avg scores. +0s ... 0.42s
#28 return log +0.04s ... 0.459s
Please share our article, every link counts!
Redaktion, 2017-09- 8 (Update: 2023-07- 1)
 Deutsch
 English
 Español
 Français
 Italiano
 Nederlands
 Polski
 Português
 Русский
 Türkçe
 Svenska
 Chinese
 Magyar