

Apple M1 Pro 8-Core vs Intel Core i7-11700K vs Intel Core i7-11700
Apple M1 Pro 8-Core
► remove from comparison
The Apple M1 Pro 8-Core is a System on a Chip (SoC) from Apple that is found in the late 2021 MacBook Pro 14 and 16-inch models. It offers 8 cores from the 10 available in the chip divided in six performance cores (P-cores with 600 - 3220 MHz) and four power-efficiency cores (E-cores with 600 - 2064 MHz). The cores are similar to the cores in the Apple M1.
The big cores (codename Firestorm) offer 192 KB instruction cache, 128 KB data cache, and 24 MB shared L2 cache (up from 12 MB in the M1). The four efficiency cores (codename Icestorm) are a lot smaller and offer only 128 KB instruction cache, 64 KB data cache, and 4 MB shared cache. Finally, the SoC includes 16 MB System Level Cache shared by the GPU. The efficiency cores (E cluster) clock with 600 - 2064 MHz, the performance cores (P cluster) with 600 - 3228 MHz.
The unified memory (16 or 32 GB LPDDR5-6400) next to the chip is connected by a 256 bit memory controller and can be used by the GPU and CPU.
The integrated graphics card in the M1 Pro offers 14 cores (of the 16 cores in the chip).
Furthermore, the SoC integrates a fast 16 core neural engine, a secure enclave (e.g., for encryption), a unified memory architecture, Thunderbolt 4 controller, an ISP, and media de- and encoders (including ProRes).
The M1 Pro is manufactured in 5 nm at TSMC and integrates 33.7 billion transistors. The peak power consumption of the chip was advertised around 30W for CPU intensive tasks.
Intel Core i7-11700K
► remove from comparison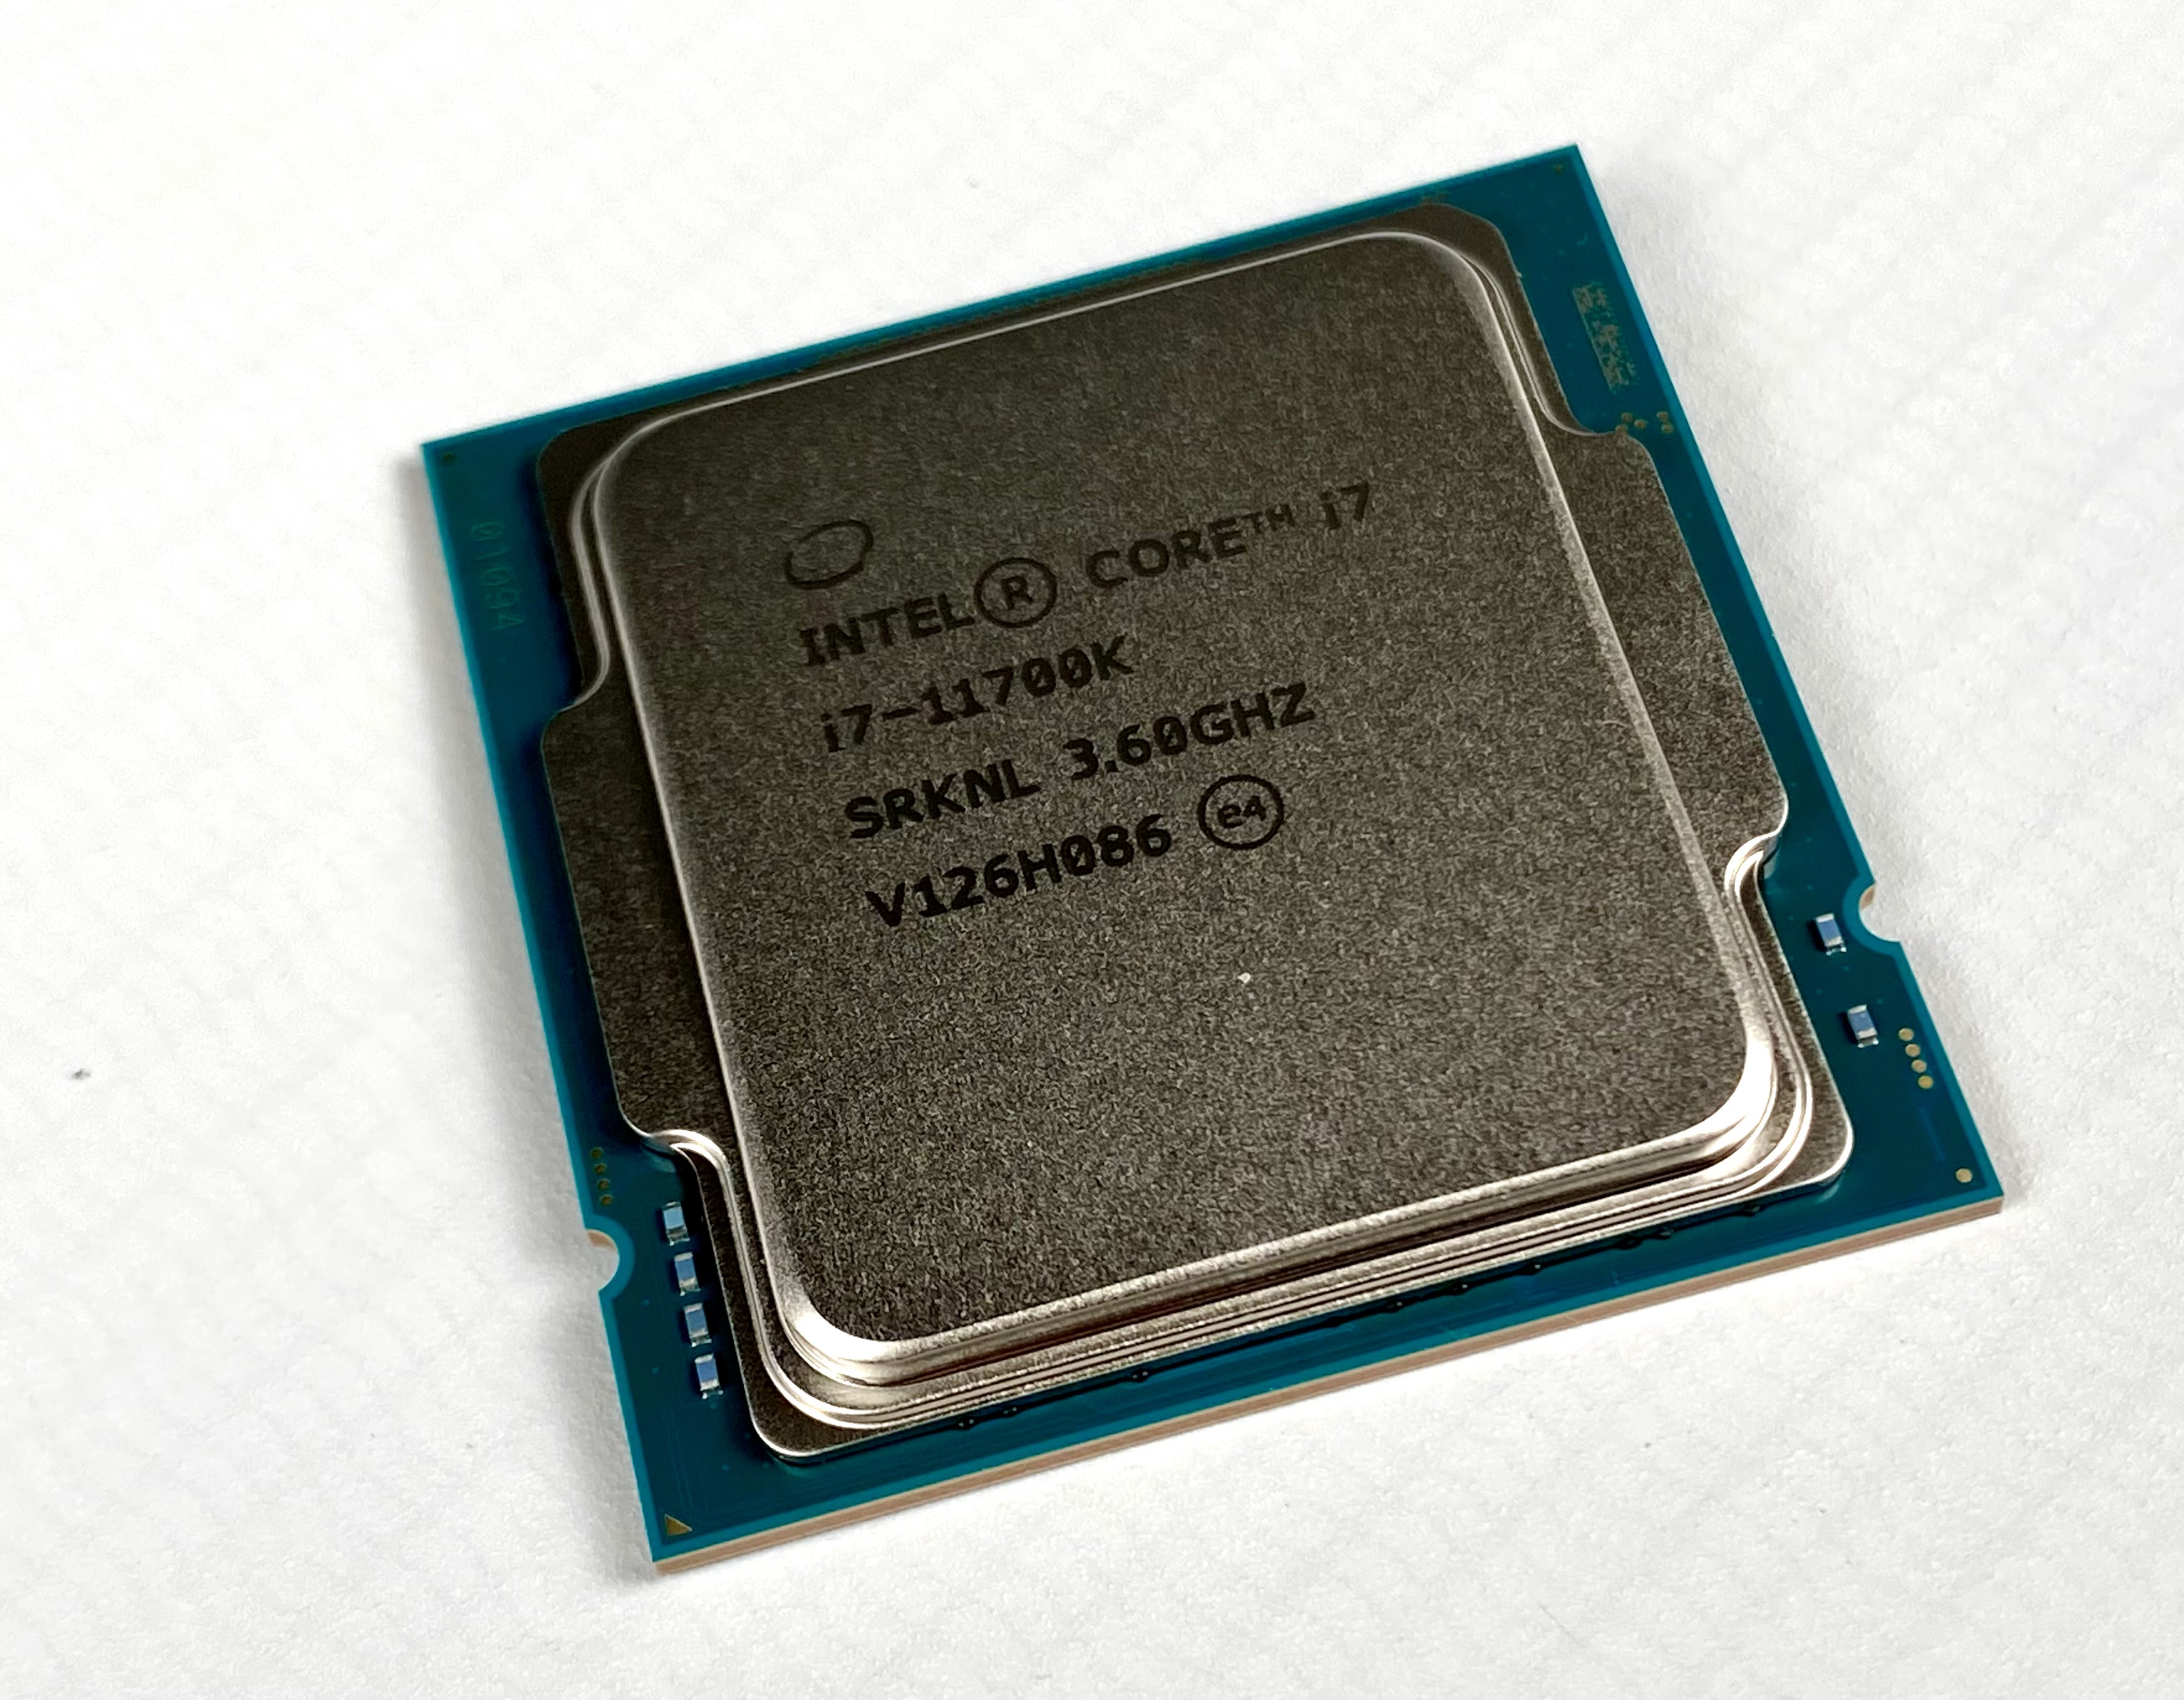
The Intel Core i7-11700K is a high-end desktop CPU based on the Rocket Lake architecture. The CPU offers 8 cores and 16 threads clocked at 3.6 - 4.9 GHz. The TDP is rated at 125 Watt (PL1, power limit sustained load) but the PL2 is set to around 250 Watt for short term boosts (up to 56 seconds).
The Sunny Cove processor cores (known from the Ice Lake mobile CPUs) offer larger caches and an improved IPC (up to 19%). Furthermore, the chip also includes (partly) integrated WiFi 6E and Thunderbolt 4. The platform supports PCIe 4.0 and Intel DL Boost for AI acceleration.
The faster Rocket Lake-S CPUs also integrate a new Intel UHD Graphics 750 that is based on the current Intel Xe architecture (e.g. mobile Tiger Lake).
The CPU is manufactured on an old 14 nm process like the Comet Lake predecessors.
Intel Core i7-11700
► remove from comparison
The Intel Core i7-11700 is a high-end desktop CPU based on the Rocket Lake architecture. The CPU offers 8 cores and 16 threads clocked at 2.5 - 4.9 GHz. The TDP is rated at 65 Watt (PL1, power limit sustained load) but the PL2 is set to around 224 Watt for short term boosts (up to 56 seconds).
The Sunny Cove processor cores (known from the Ice Lake mobile CPUs) offer larger caches and an improved IPC (up to 19%). Furthermore, the chip also includes (partly) integrated WiFi 6E and Thunderbolt 4. The platform supports PCIe 4.0 and Intel DL Boost for AI acceleration.
The faster Rocket Lake-S CPUs also integrate a new Intel UHD Graphics 750 that is based on the current Intel Xe architecture (e.g. mobile Tiger Lake).
The CPU is manufactured on the old 14 nm process like the Comet Lake predecessors.
| Model | Apple M1 Pro 8-Core | Intel Core i7-11700K | Intel Core i7-11700 | ||||||||||||||||||||||||||||||||||||||||||||||||||||||||||||||||
| Series | Apple M1 | Intel Rocket Lake | Intel Rocket Lake | ||||||||||||||||||||||||||||||||||||||||||||||||||||||||||||||||
| Series: Rocket Lake Rocket Lake |
|
|
| ||||||||||||||||||||||||||||||||||||||||||||||||||||||||||||||||
| Clock | 2060 - 3220 MHz | 3600 - 5000 MHz | 2500 - 4900 MHz | ||||||||||||||||||||||||||||||||||||||||||||||||||||||||||||||||
| L1 Cache | 2.3 MB | 640 KB | 640 KB | ||||||||||||||||||||||||||||||||||||||||||||||||||||||||||||||||
| L2 Cache | 28 MB | 4 MB | 4 MB | ||||||||||||||||||||||||||||||||||||||||||||||||||||||||||||||||
| L3 Cache | 16 MB | 16 MB | 16 MB | ||||||||||||||||||||||||||||||||||||||||||||||||||||||||||||||||
| Cores / Threads | 8 / 8 | 8 / 16 | 8 / 16 | ||||||||||||||||||||||||||||||||||||||||||||||||||||||||||||||||
| Transistors | 33700 Million | ||||||||||||||||||||||||||||||||||||||||||||||||||||||||||||||||||
| Technology | 5 nm | 14 nm | 14 nm | ||||||||||||||||||||||||||||||||||||||||||||||||||||||||||||||||
| Features | ARMv8 Instruction Set | DDR4-3200 RAM, PCIe 4, 8 GT/s bus, DL Boost, GNA, vPro, MMX, SSE, SSE2, SSE3, SSSE3, SSE4.1, SSE4.2, AVX, AVX2, AVX-512, BMI2, ABM, FMA, ADX, VMX, SMX, SMEP, SMAP, MPX, EIST, TM1, TM2, HT, Turbo, SST, AES-NI, RDRAND, RDSEED, SHA | DDR4-3200 RAM, PCIe 4, 8 GT/s bus, DL Boost, GNA, vPro, MMX, SSE, SSE2, SSE3, SSSE3, SSE4.1, SSE4.2, AVX, AVX2, AVX-512, BMI2, ABM, FMA, ADX, VMX, SMX, SMEP, SMAP, MPX, EIST, TM1, TM2, HT, Turbo, SST, AES-NI, RDRAND, RDSEED, SHA | ||||||||||||||||||||||||||||||||||||||||||||||||||||||||||||||||
| iGPU | Apple M1 Pro 14-Core GPU ( - 1296 MHz) | Intel UHD Graphics Xe 750 32EUs (Rocket Lake) (350 - 1300 MHz) | Intel UHD Graphics 750 (350 - 1300 MHz) | ||||||||||||||||||||||||||||||||||||||||||||||||||||||||||||||||
| Chip AI | 11 TOPS INT8 | ||||||||||||||||||||||||||||||||||||||||||||||||||||||||||||||||||
| Architecture | ARM | x86 | x86 | ||||||||||||||||||||||||||||||||||||||||||||||||||||||||||||||||
| Announced | |||||||||||||||||||||||||||||||||||||||||||||||||||||||||||||||||||
| Codename | Rocket Lake | Rocket Lake | |||||||||||||||||||||||||||||||||||||||||||||||||||||||||||||||||
| TDP | 125 Watt | 65 Watt | |||||||||||||||||||||||||||||||||||||||||||||||||||||||||||||||||
| max. Temp. | 100 °C | 100 °C | |||||||||||||||||||||||||||||||||||||||||||||||||||||||||||||||||
| Socket | LGA1200 | LGA1200 | |||||||||||||||||||||||||||||||||||||||||||||||||||||||||||||||||
| Manufacturer | ark.intel.com | ark.intel.com | |||||||||||||||||||||||||||||||||||||||||||||||||||||||||||||||||
| Die Size | 276 mm2 |

Benchmarks

Average Benchmarks Apple M1 Pro 8-Core → 100% n=11
Average Benchmarks Intel Core i7-11700K → 111% n=11
Average Benchmarks Intel Core i7-11700 → 97% n=11
* Smaller numbers mean a higher performance
1 This benchmark is not used for the average calculation