Notebookcheck Logo
 Kingston Fury Renegade G5 8 TB

Kingston Fury Renegade G5 8 TB review - High-end PCIe 5.0 NVMe SSD with more than 14,000 MB/s for gaming & workstations

As a PCIe 5.0 x4 SSD of the current generation, the Kingston Fury Renegade G5 with 8 TB delivers transfer rates beyond the 14,000 MB/s mark. In the test, the top model impresses with outstanding performance, even if there remains a non-performance-related disadvantage.
Sebastian Bade 👁 (translated by Sebastian Bade) Published 🇩🇪
Storage AMD

Verdict - With the Fury Renegade G5, Kingston delivers one of the fastest SSDs ever

The Kingston Fury Renegade G5 with 8 TB impresses in the test with outstanding overall performance and is one of the fastest PCIe 5.0 SSDs currently available. With sequential read and write rates of over 14,000 MB/s, the top model achieves top values in CrystalDiskMark. The SSD is also extremely stable under continuous load: in the diskspd loop, the performance remains constant over the entire test period, and thermal throttling does not occur in our test scenario. However, this requires the use of a powerful heat sink to exploit the full potential of the mass storage even under continuous load.

Overall, the Kingston Fury Renegade G5 presents itself as a powerful NVMe mass storage device without any significant technical weaknesses. However, the price of the 8 TB version, which is clearly in the high-end segment, must be viewed critically. Cheaper alternatives such as the equally powerful Kingston KC3000 offer lower transfer rates, but with around 7,000 MB/s, they also deliver high performance at a significantly lower price.

Pros

+ 8 TB storage space
+ very high data rates for writing and reading
+ Stable performance under load
+ LPDDR4 DRAM cache
+ Free Acronis True Image
+ 5-year warranty

Cons

- no cooler included
- at least passive cooler required
- very expensive

Price and availability

The Kingston Fury Renegade G5 8 TB is not currently available. The Kingston Fury Renegade G5 with 4 TB can be purchased from Amazon for $593.

Kingston Fury Renegade G5 Models

Amazon Logo
$593.40
Kingston Fury Renegade G5 4096GB NVMe SSD | PCIe 5.0 M.2 2280 | SFYR2S/4T0
  • $284.23
    Kingston Fury Renegade G5 1024GB NVMe SSD | PCIe 5.0 M.2 2280 | SFYR2S/1T0
  • $329.11
    Kingston Fury Renegade G5 2048GB NVMe SSD | PCIe 5.0 M.2 2280 | SFYR2S/2T0

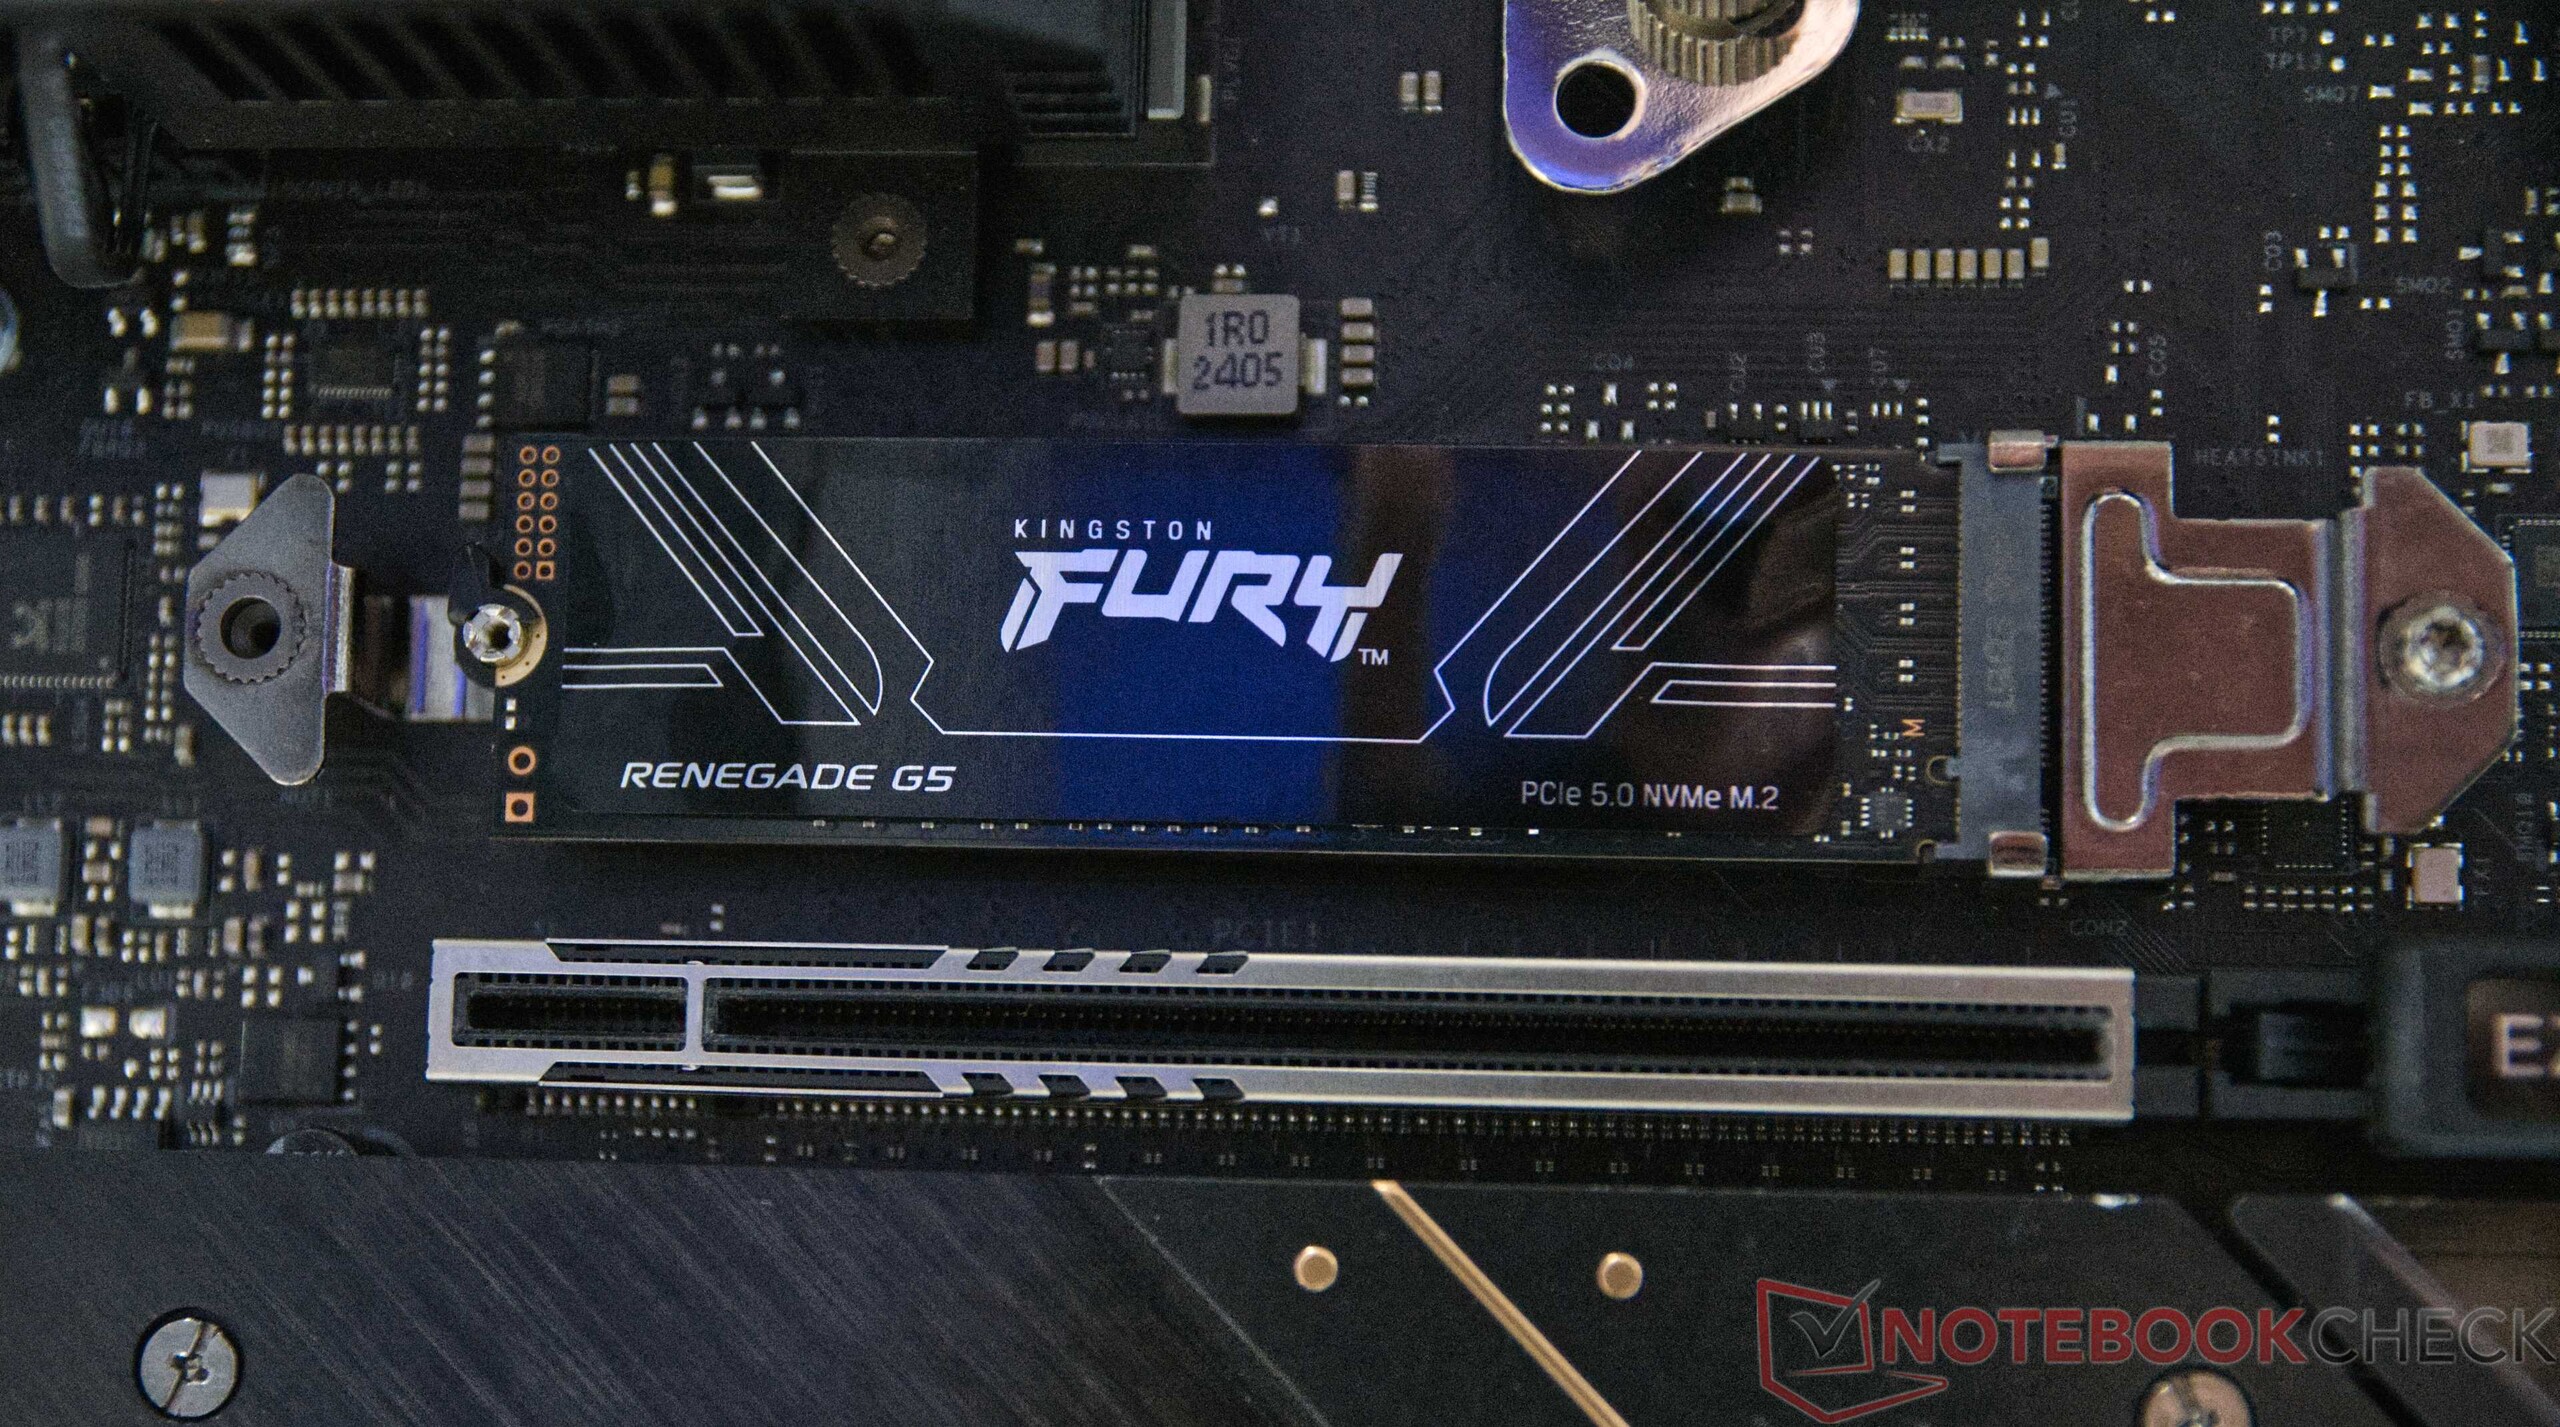
The Kingston Fury Renegade G5 with 8 TB is aimed at demanding gamers, content creators and power users who want to get the most out of a PCIe 5.0 SSD. With advertised transfer rates of over 14,000 MB/s read and write, it is currently one of the fastest NVMe SSDs in its performance class. In this test, we take a closer look at the 8 TB version of the Fury Renegade G5 and analyze how it performs in everyday use and under continuous load and what strengths and weaknesses it reveals. In addition to the 8 TB model tested, the FURY Renegade G5 is also available with 1 TB, 2 TB and 4 TB, whereby the smaller variants (1 TB and 2 TB) in particular have slightly lower write rates according to the data sheet.

Kingston Fury Renegade G5 SSD
Form factor M.2 (2280)
Interface PCIe 5.0 x4
Memory 3D-NAND TLC, LPDDR4 DRAM cache
Weight 9.2 g (8 TB); 7.7 g (2 TB + 4 TB); 7.3 g (1 TB)
available capacities 8 TB, 4 TB, 2 TB, 1 TB
Data transfer rates
(sequential according to the manufacturer)
up to 14,800 MB/s read
up to 14,000 MB/s write
Load capacity 8 PB, 1,000 TB per TB capacity
IOPS 2200K read, 2200K write
average operating time 2,000,000 h
Firmware SGW00110
Warranty period 5 years
EAN SFYR2D/8T1; SFYR2S/4T0; SFYR2S/2T0; SFYR2S/1T0

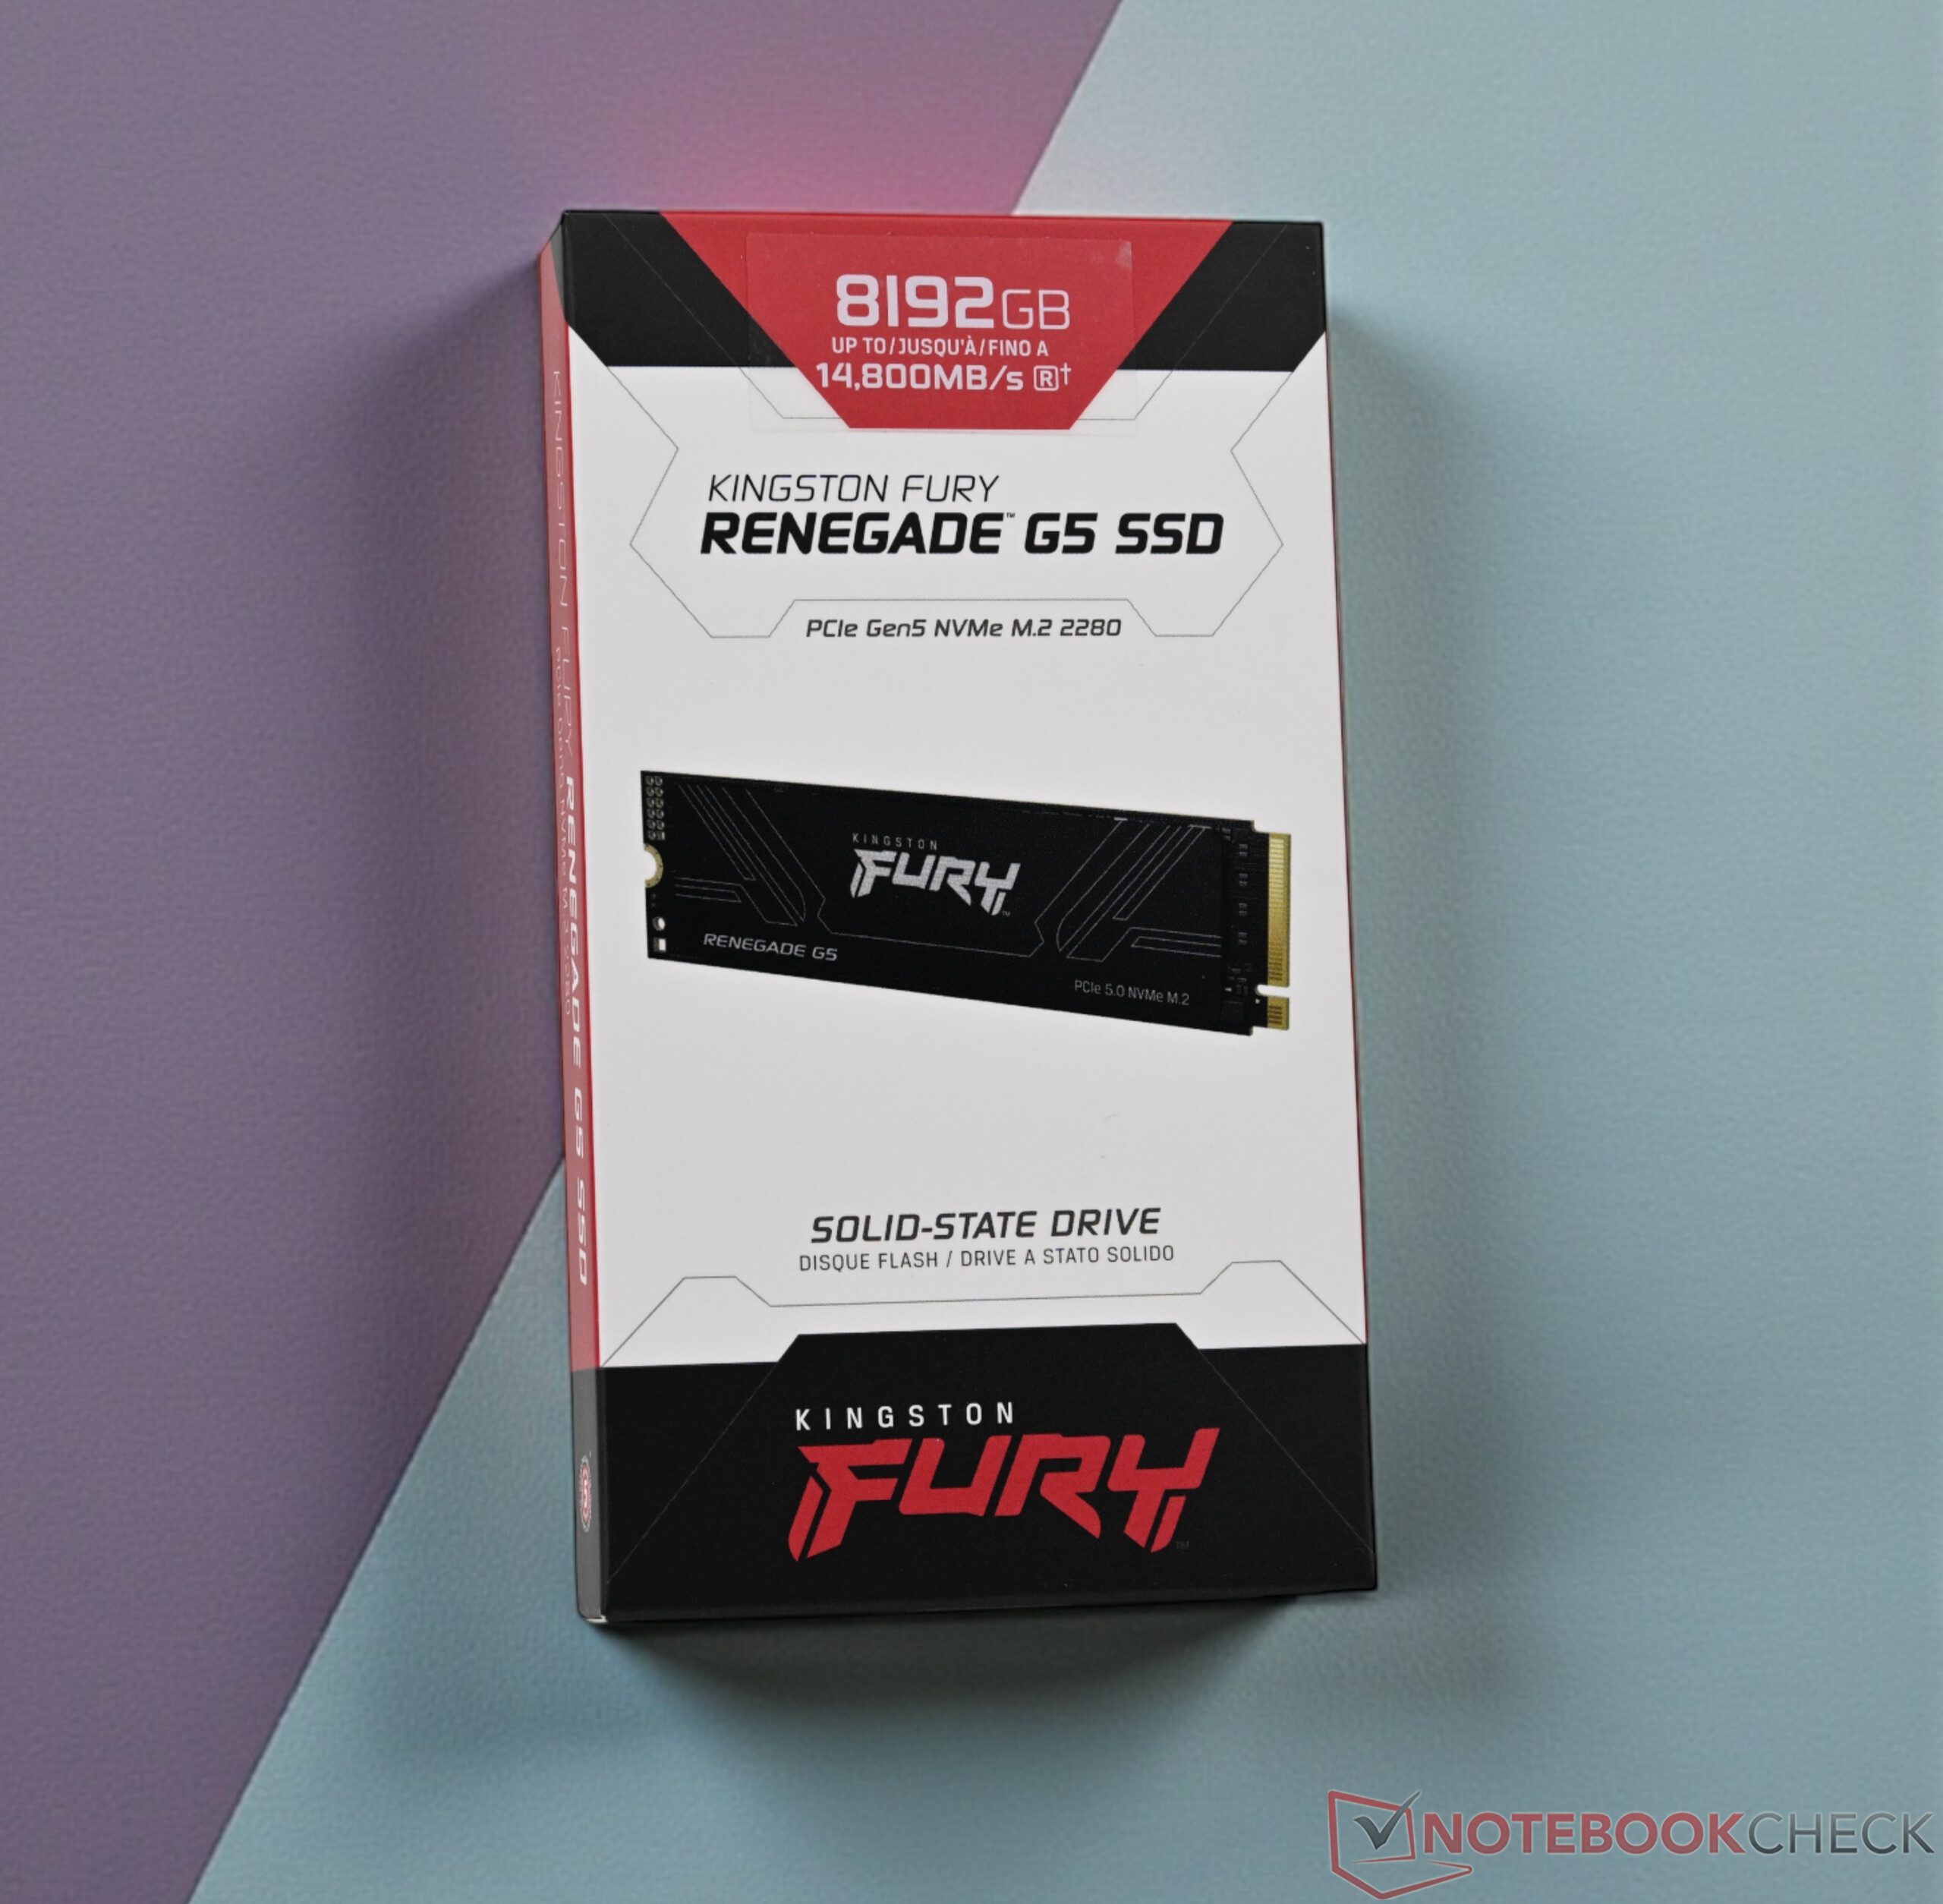
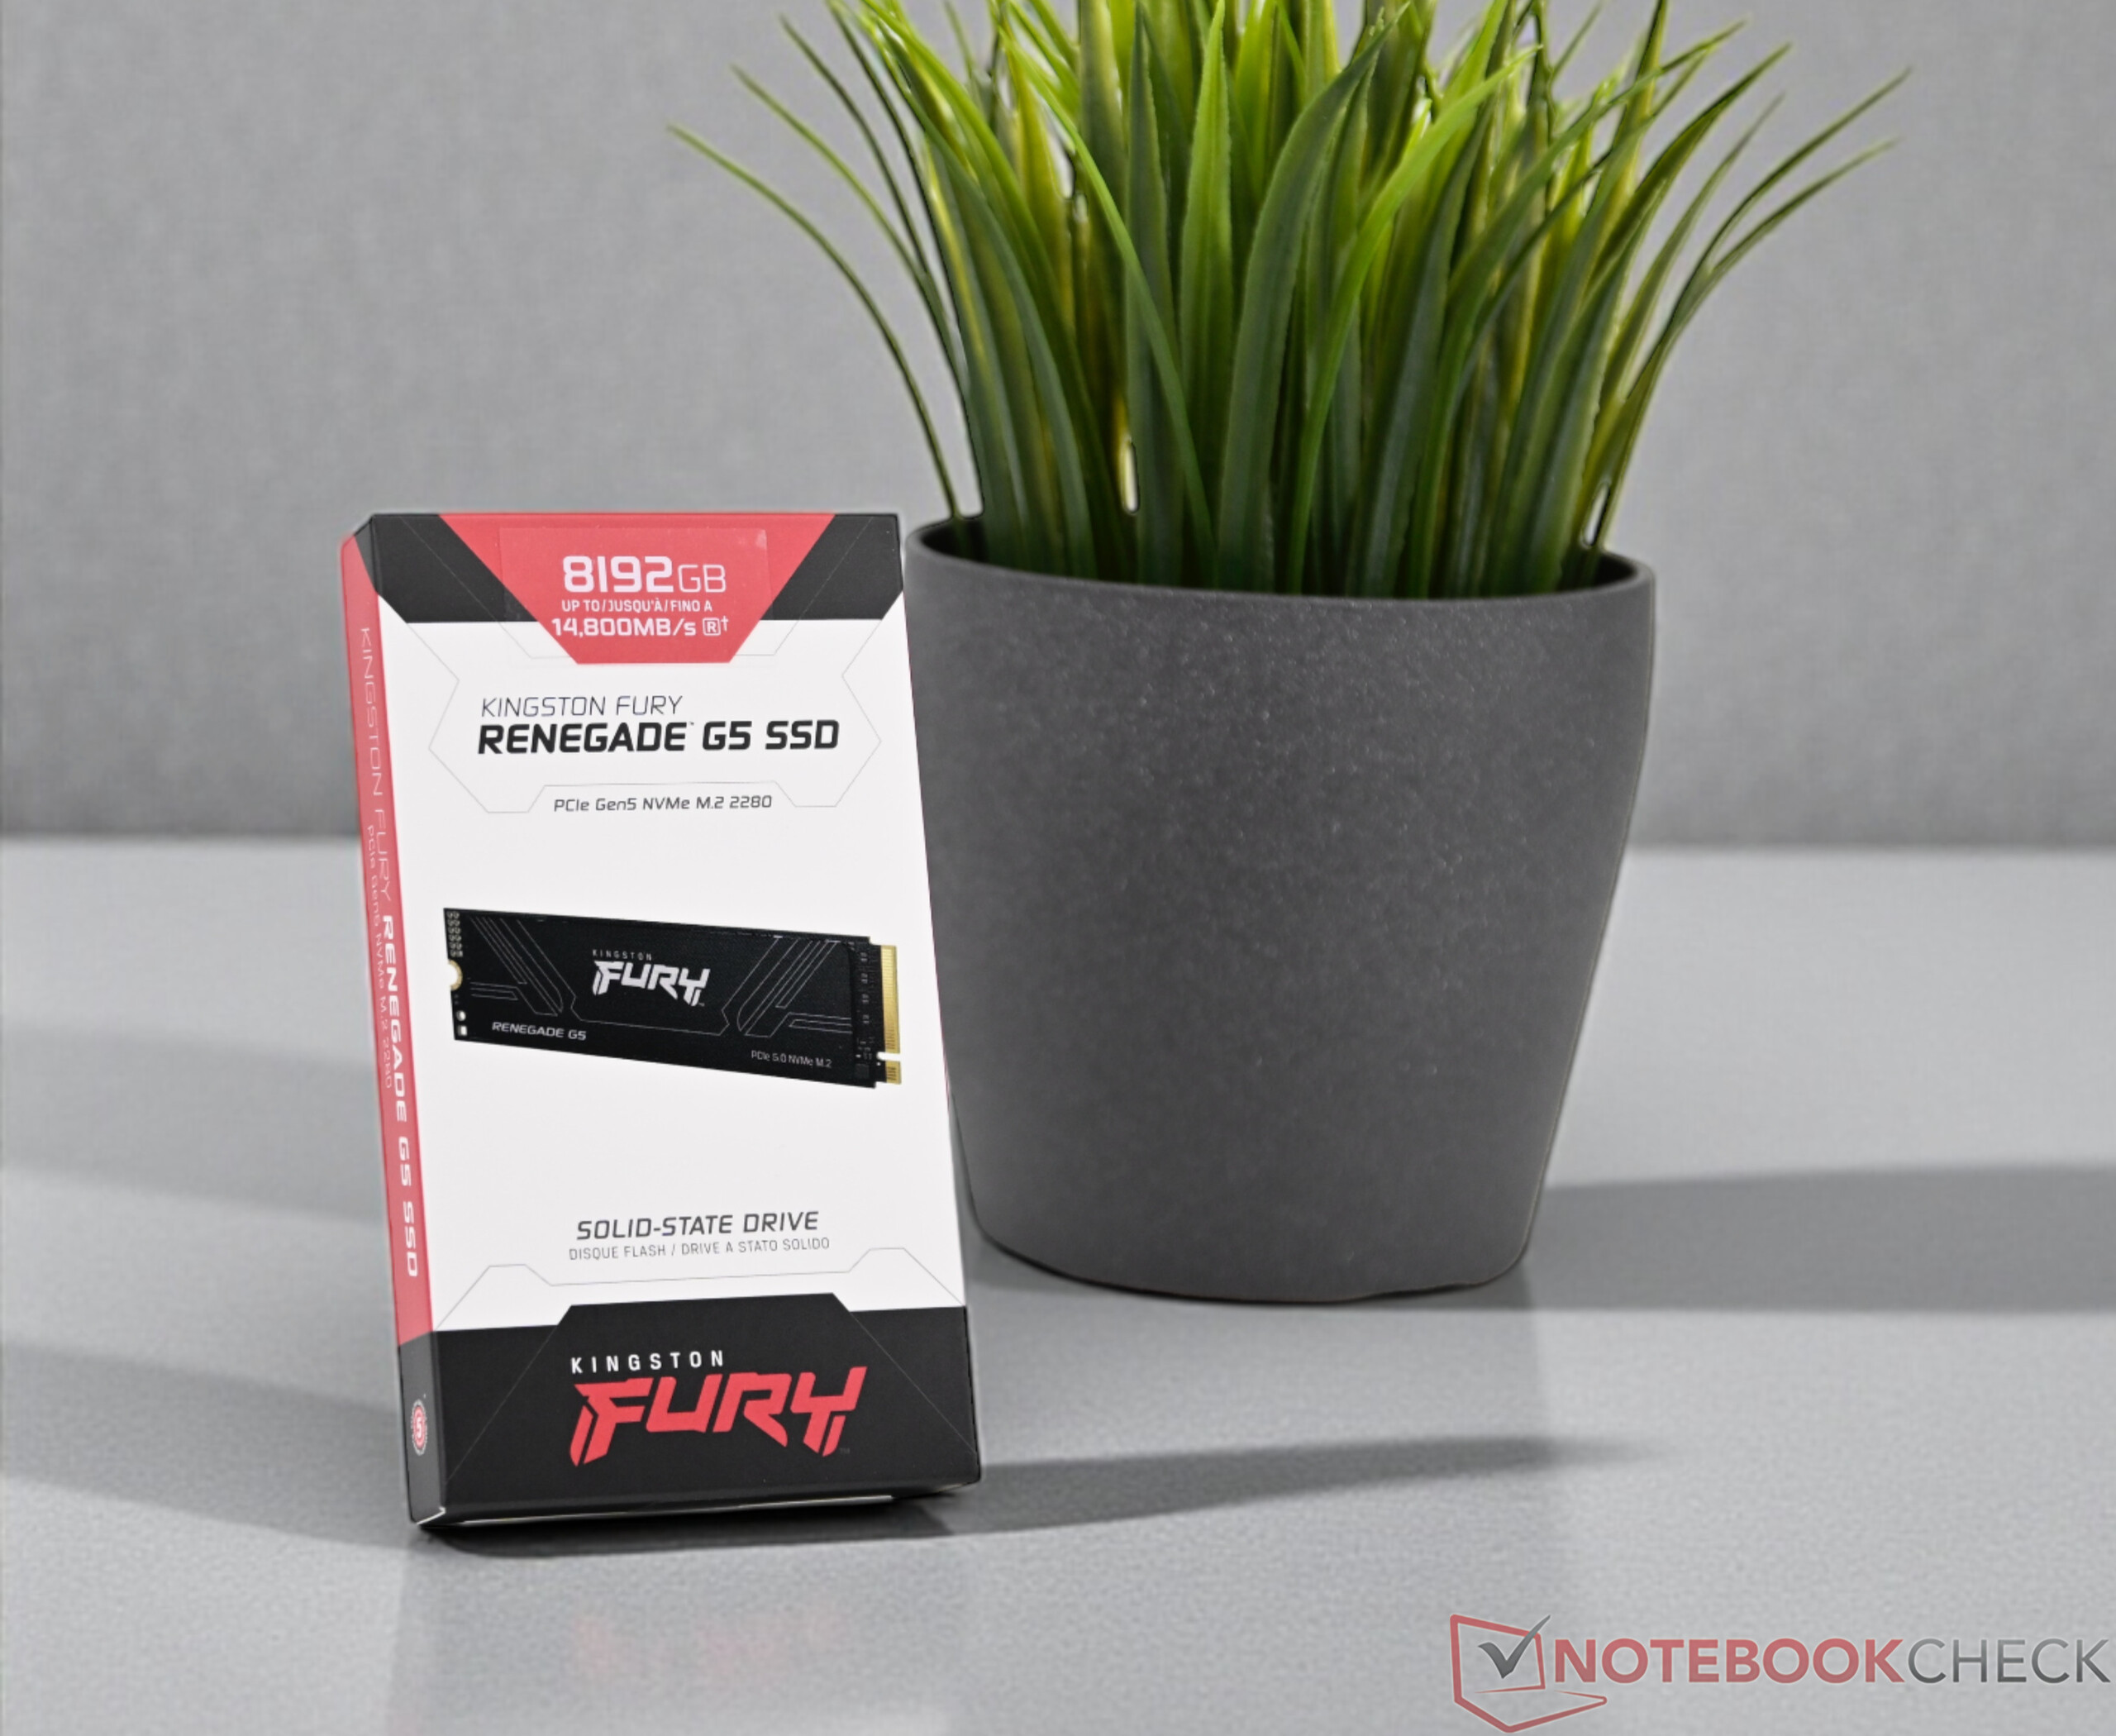
Packaging & scope of delivery: cardboard and plastic ensure safe transportation

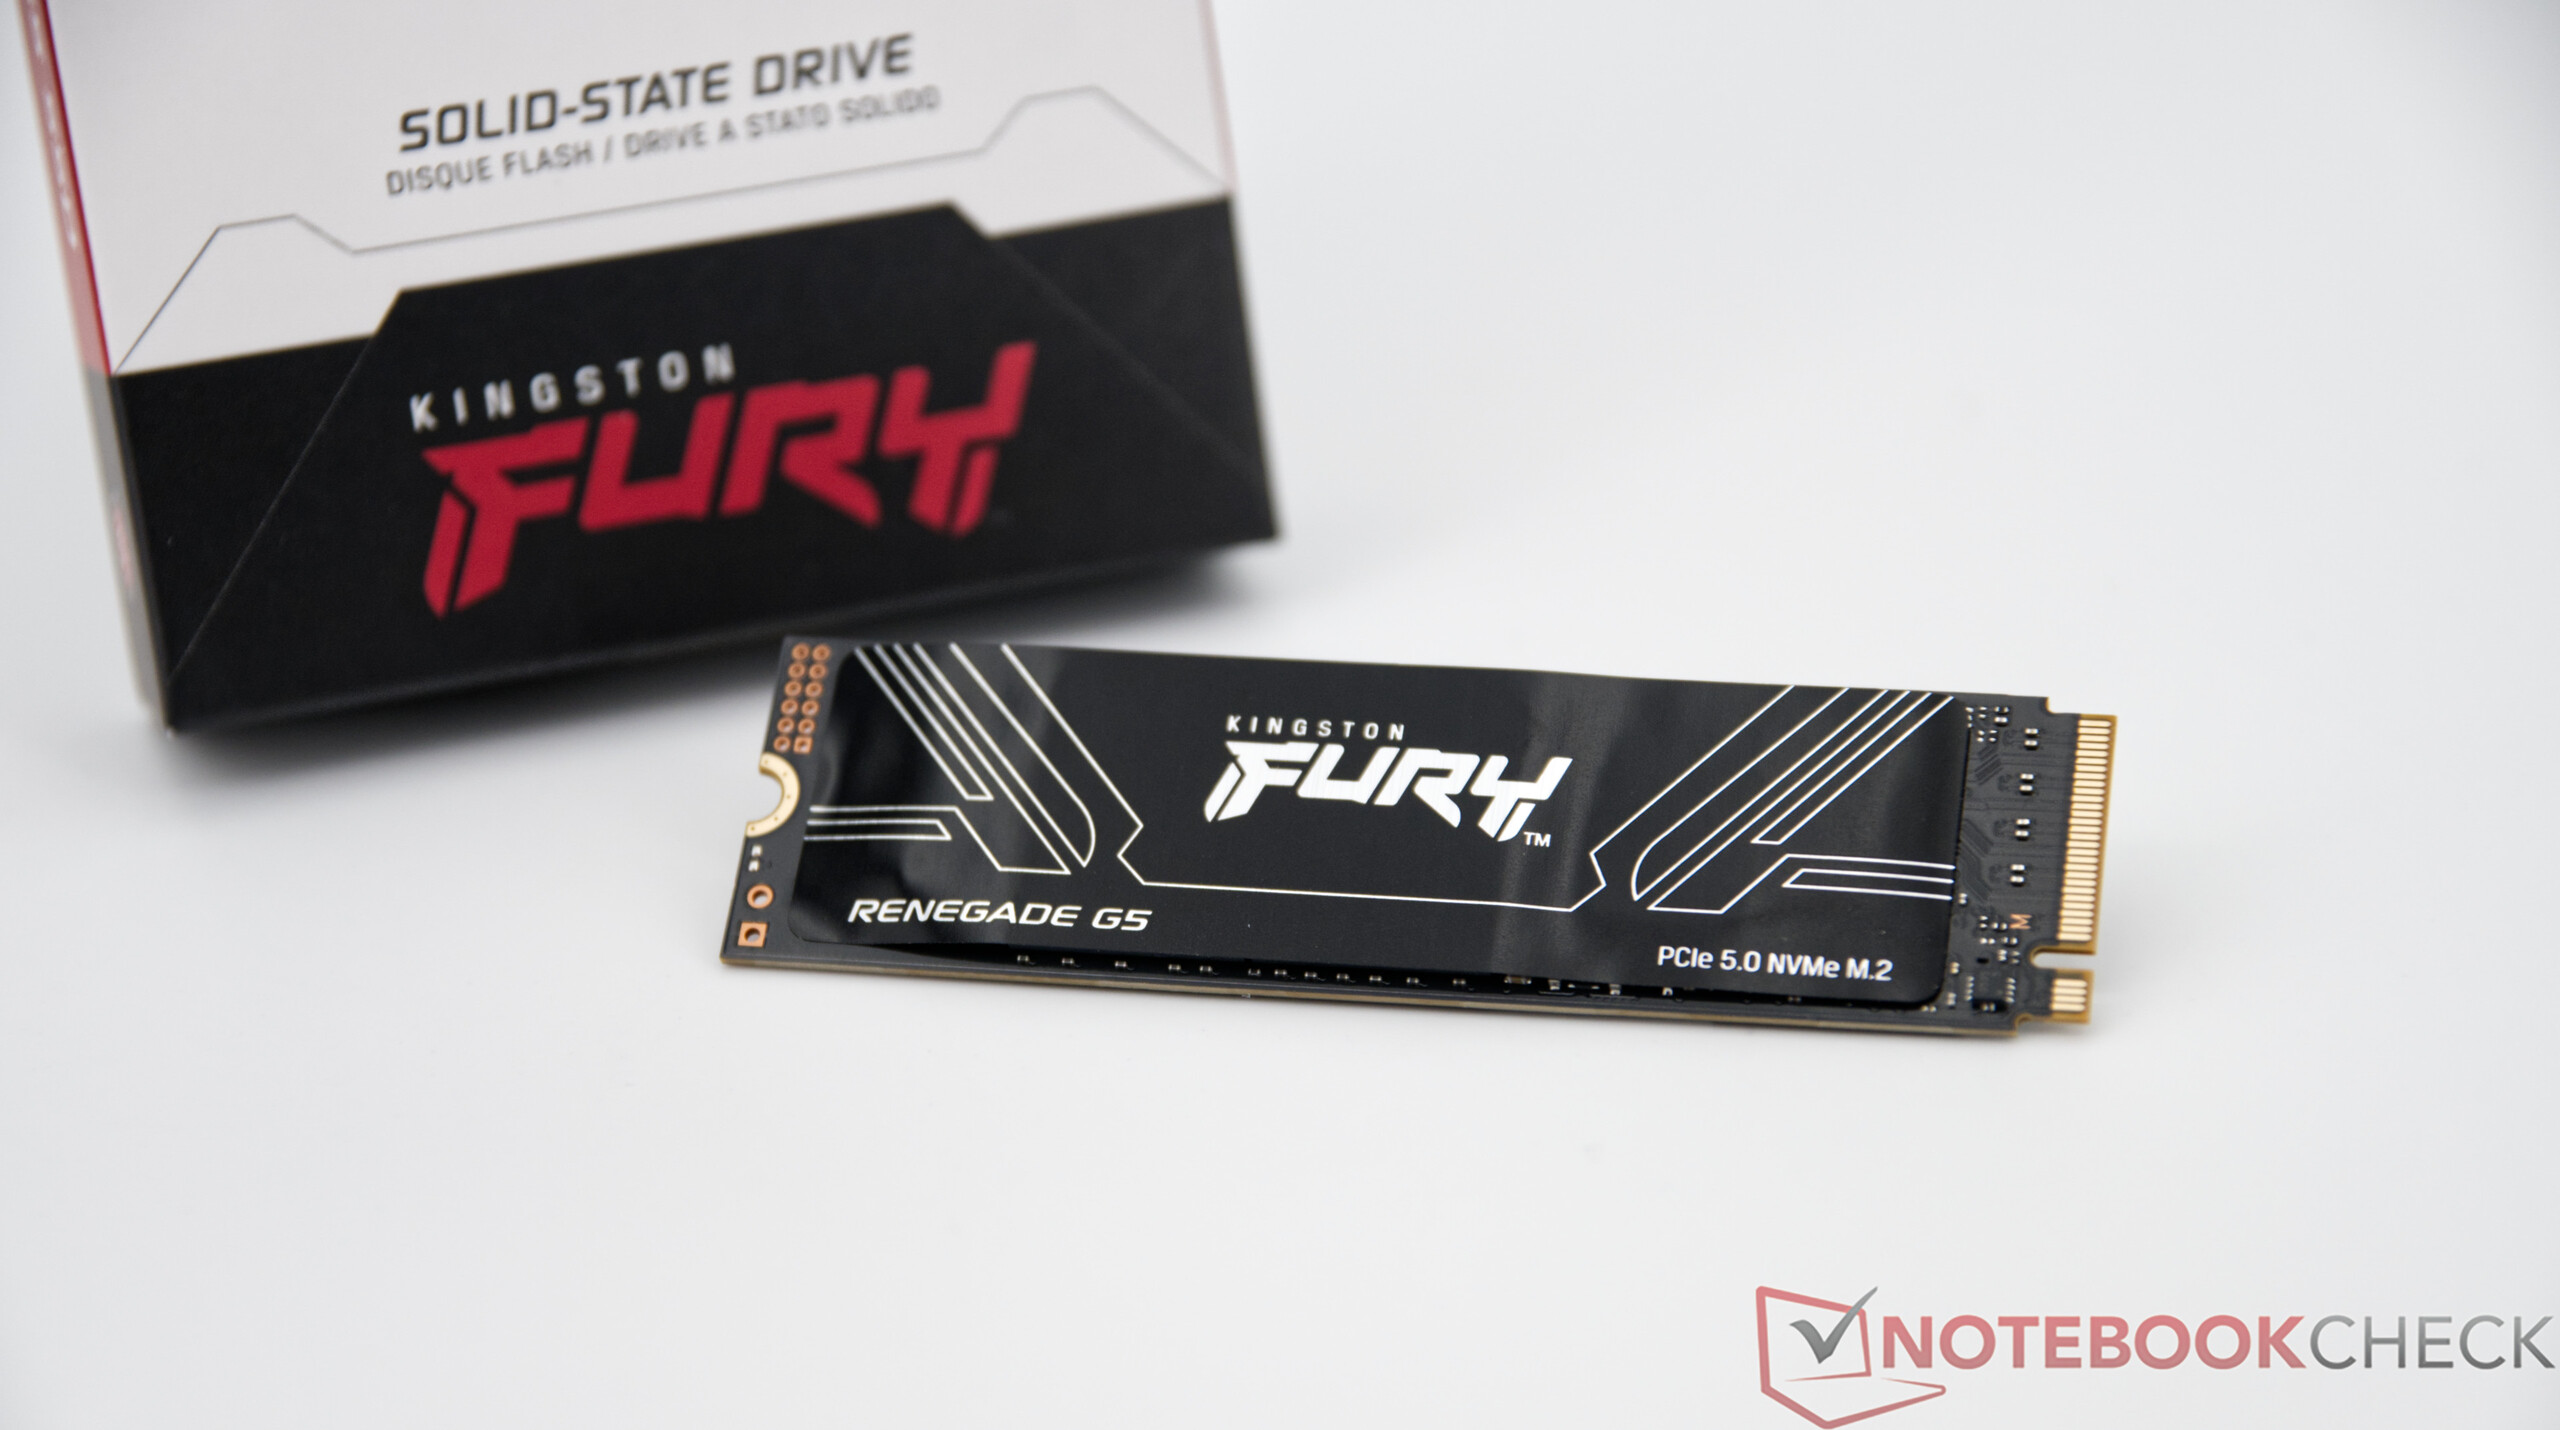
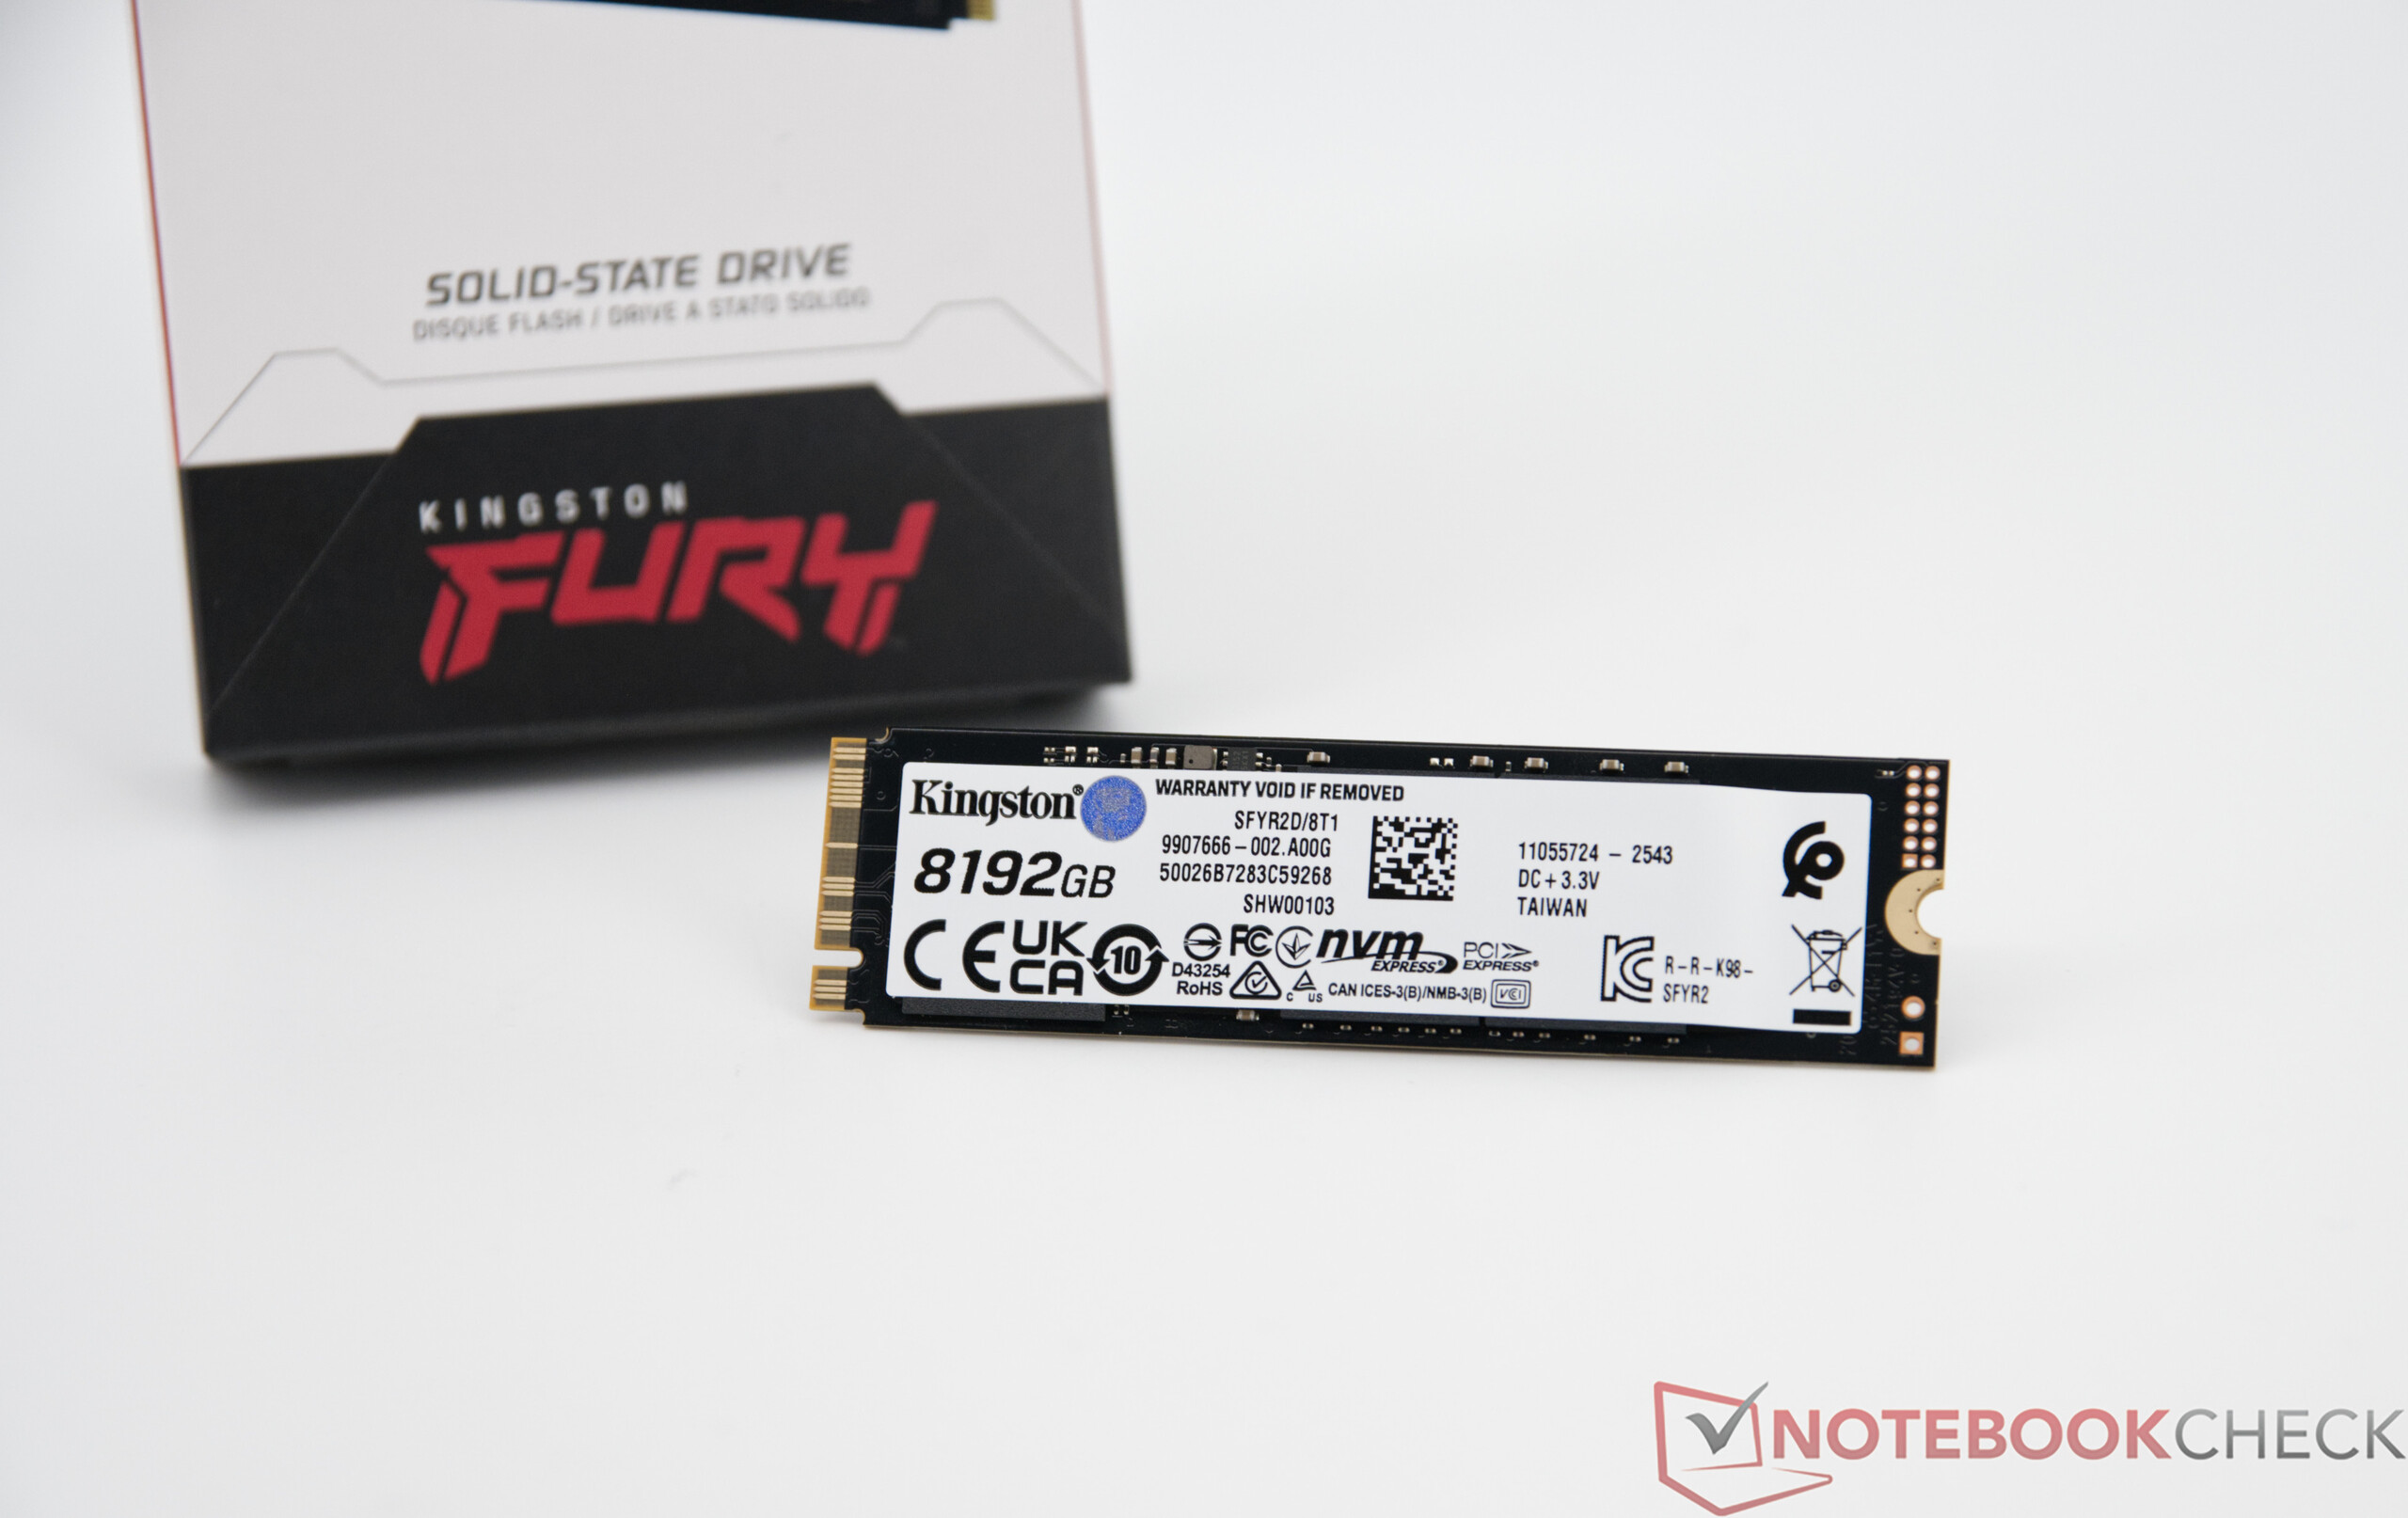
Kingston delivers the Fury Renegade G5 with 8 TB in plain cardboard packaging. Inside, the SSD is housed in a precisely fitting plastic holder for secure attachment. Environmental certifications such as RoHS and REACH are met, even if the packaging itself is not made from recycled materials. The sticker on the SSD looks very thin, so we do not assume that this is a factory-installed cooling pad. Considering the high performance, PCIe 5.0 SSDs should not be operated without a separate heat sink. In addition, the 8 TB variant is double-sided, which must be considered during installation and when selecting a suitable cooling concept.

Test system

For this test, we use our GPU test system based on the Asrock X870E Taichi motherboard in combination with the AMD Ryzen 7 9800X3D.

Kingston Fury Renegade G5 8 TB
Kingston Fury Renegade G5 8 TB in the test system

Transfer rates

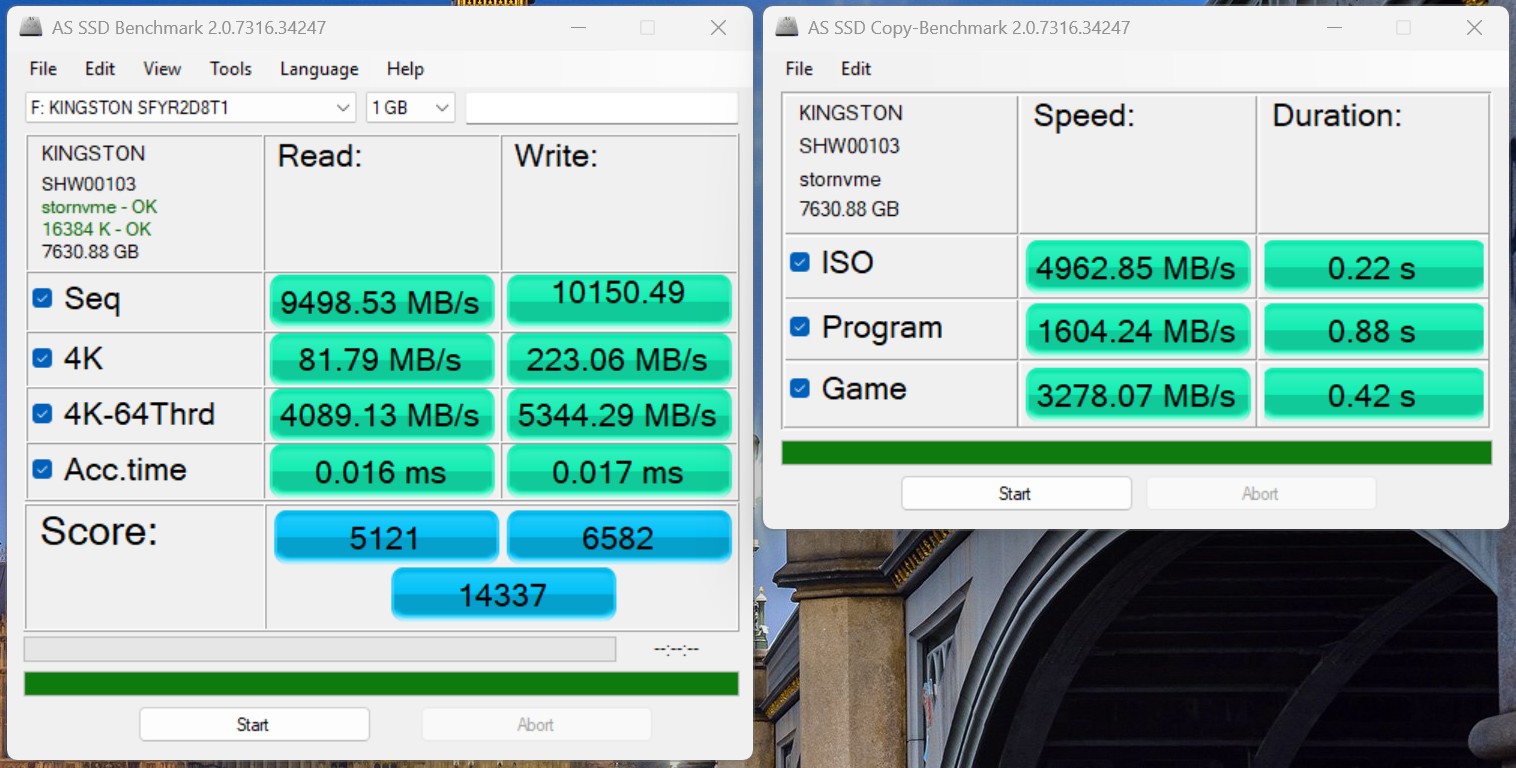
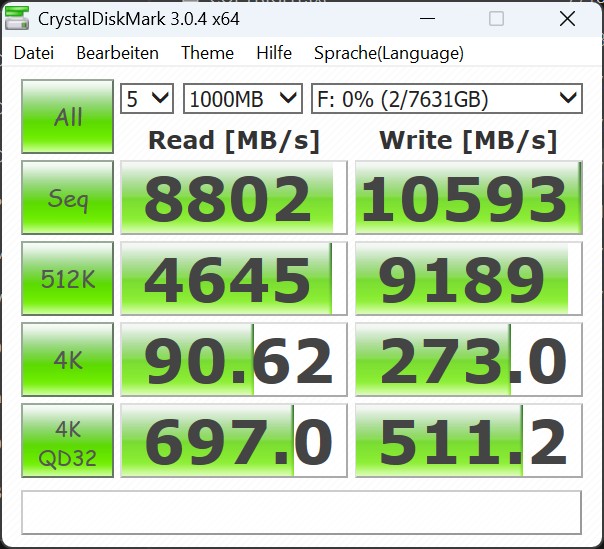
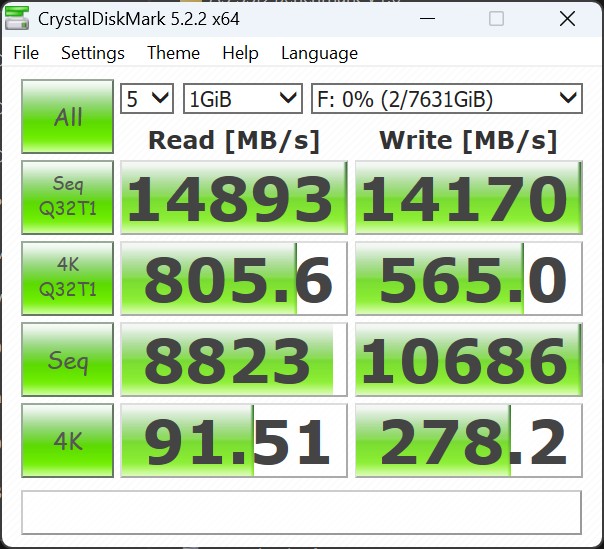
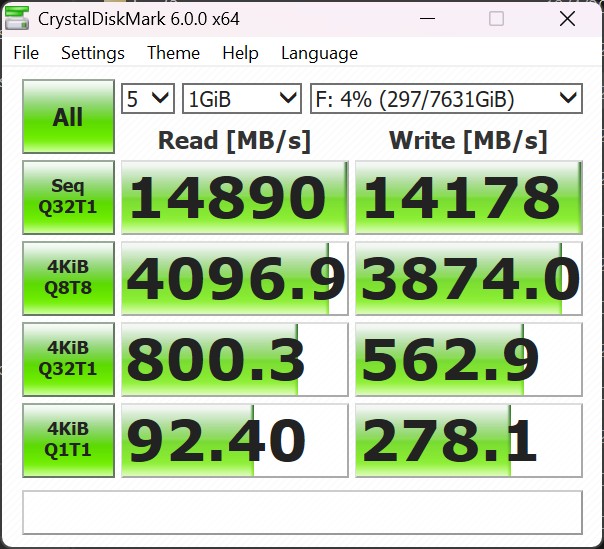
In our test system, the Kingston Fury Renegade G5 with 8 TB can almost fully exploit its enormous performance potential. In the CrystalDiskMark 6 benchmark, we measured sequential read rates of over 14,900 MB/s and write rates of around 14,200 MB/s. As expected, the results in the AS-SSD benchmark are somewhat lower. In a direct comparison with other internal high-end SSDs, the Fury Renegade G5 is clearly ahead of competitor models such as the Samsung 9100 Pro or the Kingston KC3000.

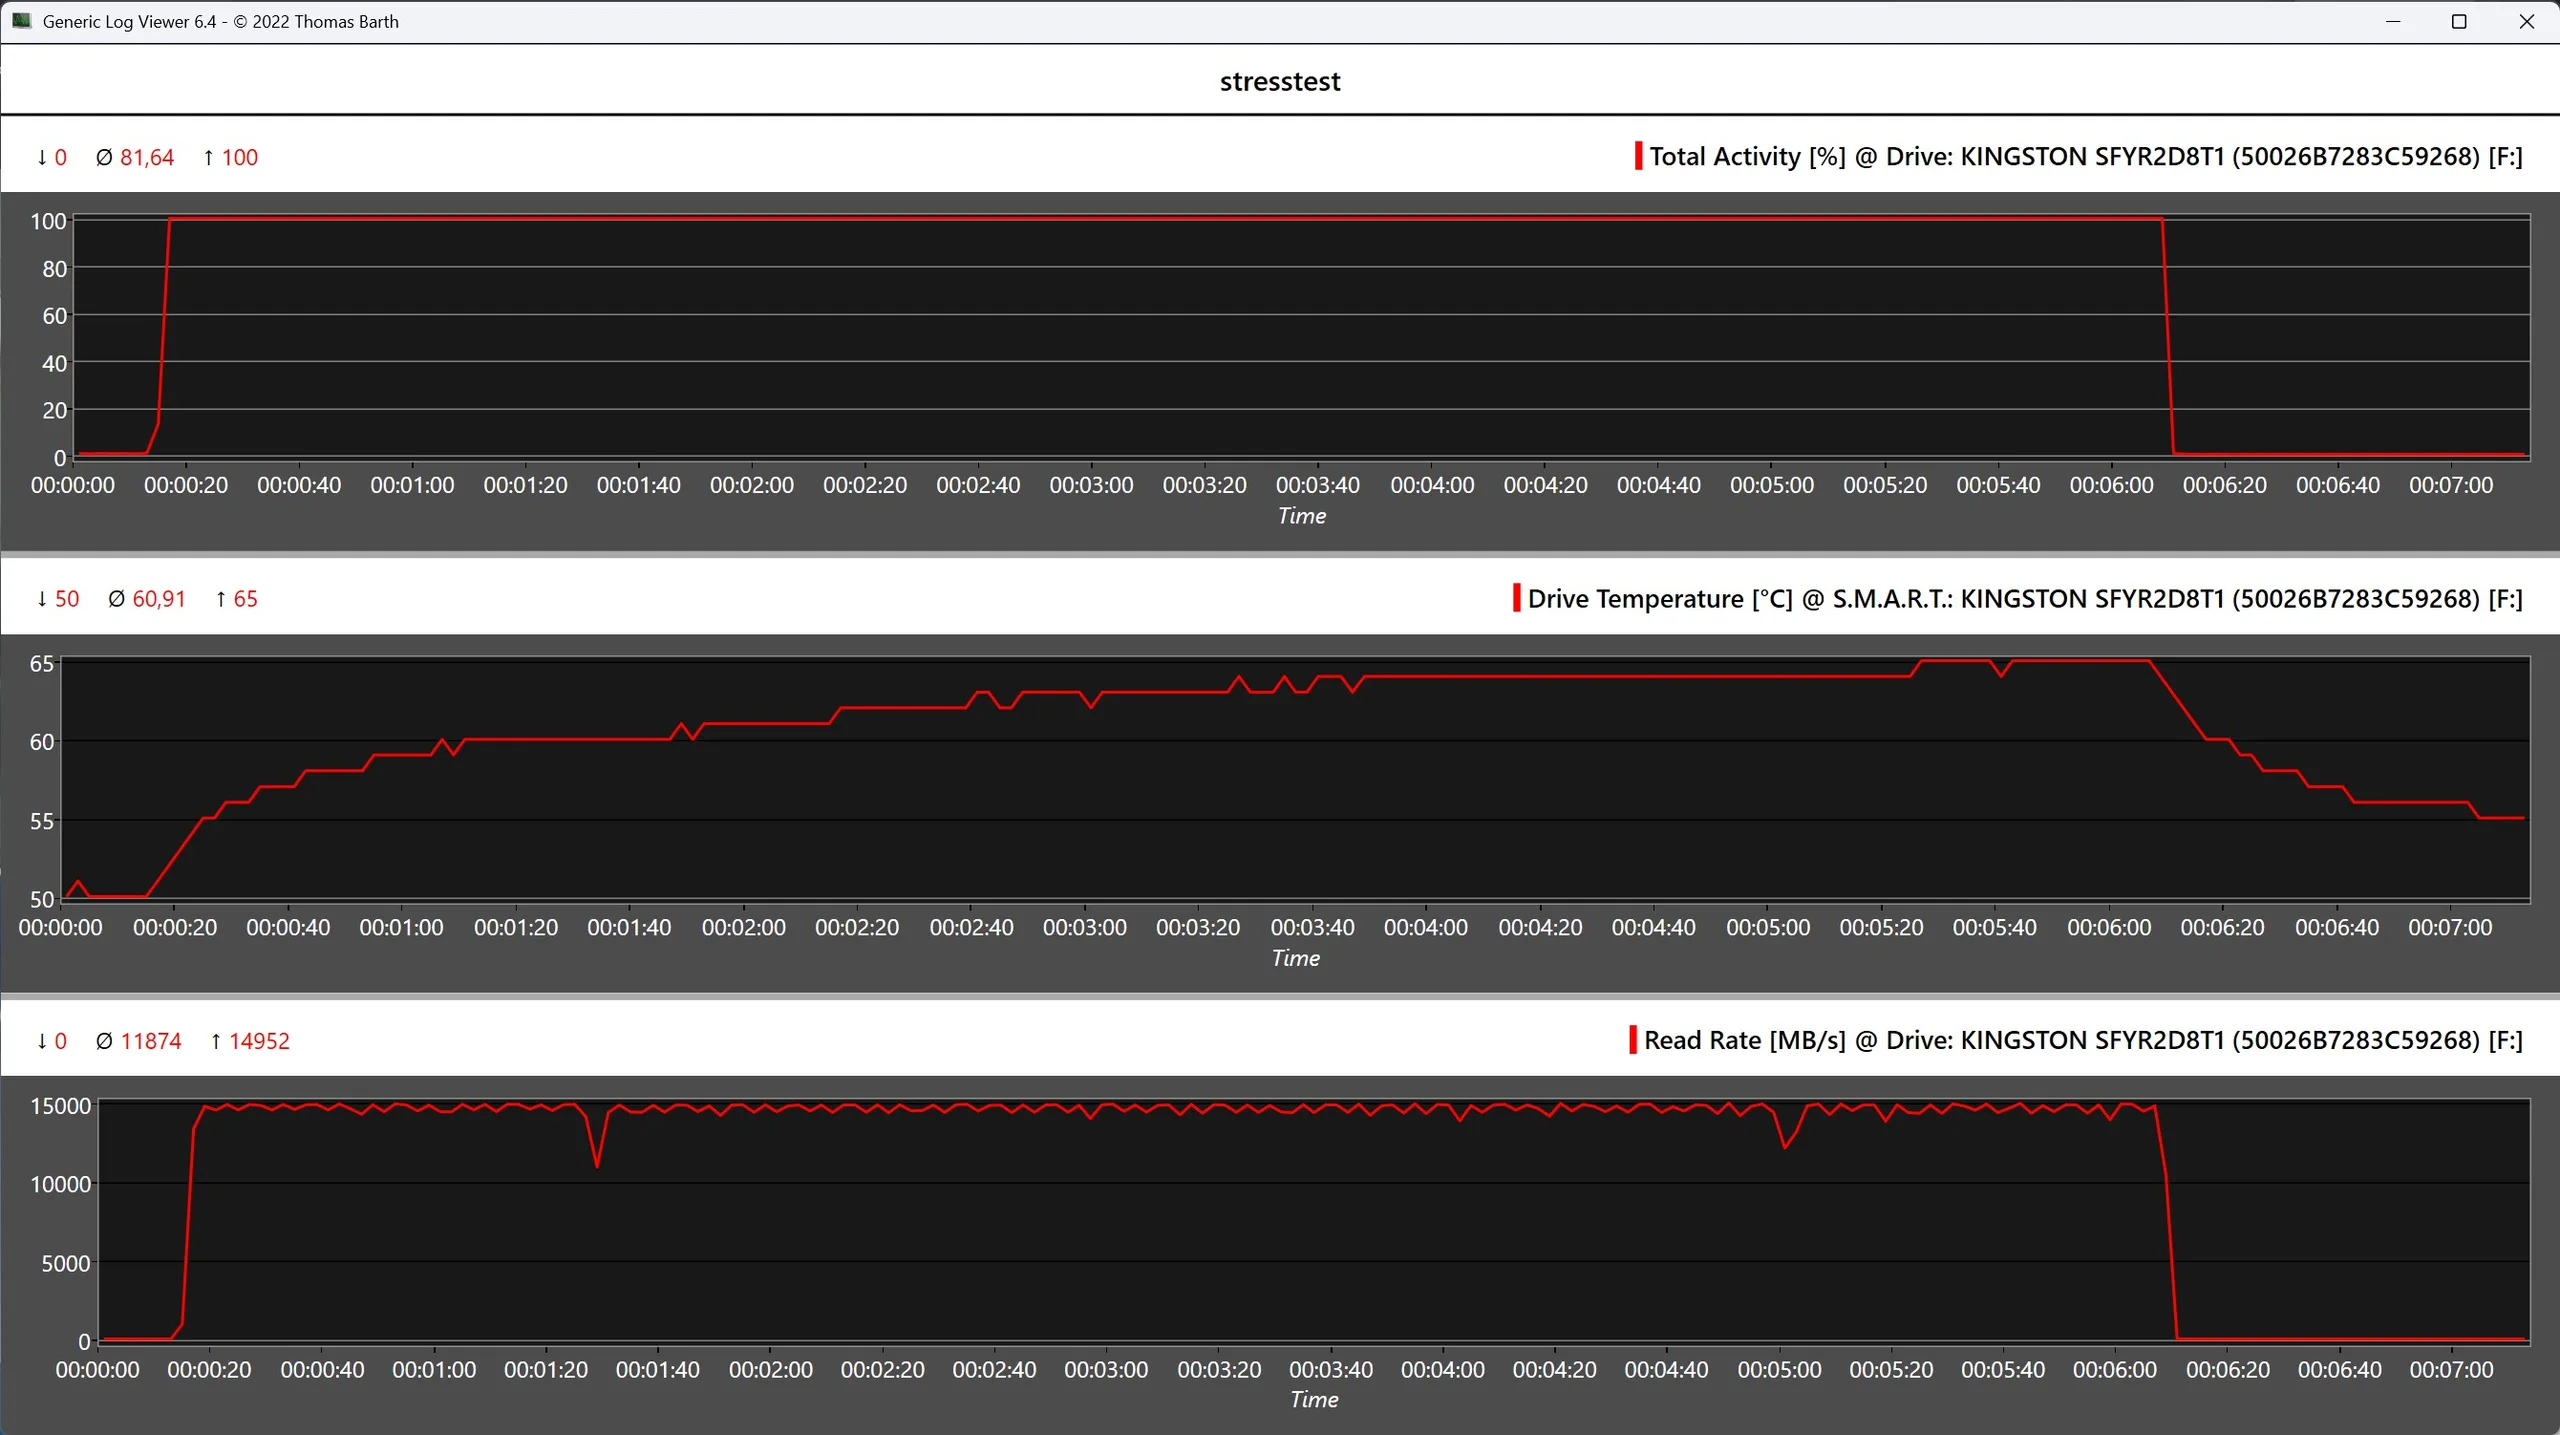
In the Diskspd endurance test, the SSD also shows largely constant performance. Although there are occasional minor fluctuations in performance, there is no significant drop over the entire test period. With an average of more than 14,000 MB/s, the Kingston Fury Renegade G5 also impresses under sustained load. While both versions of the Kingston Fury Renegade G5 deliver impressive performance, the 8 TB model scores over the 4 TB version with slightly more constant read rates under continuous load. However, this requires sufficient cooling: in combination with the heat sink of the ASRock mainboard used, this worked excellently in the test. In compact systems such as laptops or mini PCs, however, the higher temperatures could lead to significantly greater performance losses under continuous load.

AS SSD
AS SSD
CDM3
CDM3
CDM5
CDM5
CDM6
CDM6
CDI
CDI
Kingston Fury Renegade G5 8TB
Sequential Read: 8802 MB/s
Sequential Write: 10593 MB/s
512K Read: 4645 MB/s
512K Write: 9189 MB/s
4K Read: 90.62 MB/s
4K Write: 273 MB/s
4K QD32 Read: 697 MB/s
4K QD32 Write: 511.2 MB/s
Drive Performance rating - Percent
Kingston Fury Renegade G5 4 TB
Kingston Fury Renegade G5 4TB
92.7 pt
Kingston Fury Renegade G5 8 TB
Kingston Fury Renegade G5 8TB
90 pt
Average Kingston Fury Renegade G5 8TB
 
90 pt
Eurocom Raptor X17 Core i9-14900HX
Corsair MP700 Pro 2TB
82.9 pt
Kingston KC3000 2 TB
Kingston KC3000 2048G SKC3000D2048G
66.4 pt
Schenker XMG Pro 16 (E25)
Samsung 9100 Pro 1 TB
57.7 pt
AMD Ryzen 7 7800X3D
Corsair MP600
35.7 pt
Average of class
 
25.1 pt
DiskSpd
seq read
Kingston Fury Renegade G5 8 TB
Kingston Fury Renegade G5 8TB
8495 (8461.65min - 8494.72max) MB/s
Average Kingston Fury Renegade G5 8TB
  (n=1)
8495 MB/s 0%
Kingston Fury Renegade G5 4 TB
Kingston Fury Renegade G5 4TB
7350 (7164.43min - 7350.29max) MB/s -13%
Schenker XMG Pro 16 (E25)
Samsung 9100 Pro 1 TB
5359 (5332.25min - 5358.62max) MB/s -37%
Kingston KC3000 2 TB
Kingston KC3000 2048G SKC3000D2048G
3202 (3090.36min - 3201.93max) MB/s -62%
Eurocom Raptor X17 Core i9-14900HX
Corsair MP700 Pro 2TB
2672 (2652.21min - 2671.88max) MB/s -69%
Average of class
  (113.3 - 8495, n=2015)
2452 MB/s -71%
AMD Ryzen 7 7800X3D
Corsair MP600
1609 (1589.43min - 1608.94max) MB/s -81%
seq write
Kingston Fury Renegade G5 8 TB
Kingston Fury Renegade G5 8TB
10342 (10045.2min - 10342.3max) MB/s
Average Kingston Fury Renegade G5 8TB
  (n=1)
10342 MB/s 0%
Kingston Fury Renegade G5 4 TB
Kingston Fury Renegade G5 4TB
10125 (10048.8min - 10125max) MB/s -2%
Eurocom Raptor X17 Core i9-14900HX
Corsair MP700 Pro 2TB
9307 (5304.83min - 9307.21max) MB/s -10%
Kingston KC3000 2 TB
Kingston KC3000 2048G SKC3000D2048G
5094 (3418.23min - 5094.49max) MB/s -51%
Schenker XMG Pro 16 (E25)
Samsung 9100 Pro 1 TB
4147 (3521.83min - 4147.33max) MB/s -60%
Average of class
  (43 - 10342, n=2015)
2530 MB/s -76%
AMD Ryzen 7 7800X3D
Corsair MP600
1805 (559.8min - 1804.81max) MB/s -83%
seq q8 t1 read
Kingston Fury Renegade G5 8 TB
Kingston Fury Renegade G5 8TB
14890 (13415.5min - 14890max) MB/s
Average Kingston Fury Renegade G5 8TB
  (n=1)
14890 MB/s 0%
Kingston Fury Renegade G5 4 TB
Kingston Fury Renegade G5 4TB
14590 (12770min - 14590.3max) MB/s -2%
Schenker XMG Pro 16 (E25)
Samsung 9100 Pro 1 TB
12505 (9384.86min - 12505.3max) MB/s -16%
Eurocom Raptor X17 Core i9-14900HX
Corsair MP700 Pro 2TB
12029 (6621.31min - 12029.1max) MB/s -19%
Kingston KC3000 2 TB
Kingston KC3000 2048G SKC3000D2048G
7125 (6471.6min - 7125.49max) MB/s -52%
AMD Ryzen 7 7800X3D
Corsair MP600
4985 (3750.97min - 4984.83max) MB/s -67%
Average of class
  (114.5 - 16102, n=2015)
4281 MB/s -71%
seq q8 t1 write
Kingston Fury Renegade G5 4 TB
Kingston Fury Renegade G5 4TB
14206 (13728min - 14205.9max) MB/s 0%
Kingston Fury Renegade G5 8 TB
Kingston Fury Renegade G5 8TB
14166 (13706.3min - 14165.6max) MB/s
Average Kingston Fury Renegade G5 8TB
  (n=1)
14166 MB/s 0%
Eurocom Raptor X17 Core i9-14900HX
Corsair MP700 Pro 2TB
11581 (11375.7min - 11581max) MB/s -18%
Schenker XMG Pro 16 (E25)
Samsung 9100 Pro 1 TB
7451 (4926min - 7450.54max) MB/s -47%
Kingston KC3000 2 TB
Kingston KC3000 2048G SKC3000D2048G
6507 (3381.66min - 6507.24max) MB/s -54%
Average of class
  (46.7 - 14571, n=2015)
3261 MB/s -77%
AMD Ryzen 7 7800X3D
Corsair MP600
1774 (801.95min - 1773.98max) MB/s -87%
4k q1 t1 read
Eurocom Raptor X17 Core i9-14900HX
Corsair MP700 Pro 2TB
95.9 (94.45min - 95.94max) MB/s +8%
Kingston Fury Renegade G5 4 TB
Kingston Fury Renegade G5 4TB
89.4 (88.85min - 89.35max) MB/s 0%
Kingston Fury Renegade G5 8 TB
Kingston Fury Renegade G5 8TB
89 (88.35min - 88.96max) MB/s
Average Kingston Fury Renegade G5 8TB
  (n=1)
89 MB/s 0%
Schenker XMG Pro 16 (E25)
Samsung 9100 Pro 1 TB
77.6 (25.64min - 77.6max) MB/s -13%
Kingston KC3000 2 TB
Kingston KC3000 2048G SKC3000D2048G
69.4 (68.77min - 69.4max) MB/s -22%
Average of class
  (0.67 - 361, n=2015)
58.8 MB/s -34%
AMD Ryzen 7 7800X3D
Corsair MP600
42.6 (38min - 42.59max) MB/s -52%
4k q1 t1 write
Eurocom Raptor X17 Core i9-14900HX
Corsair MP700 Pro 2TB
397 (385.91min - 396.86max) MB/s +54%
AMD Ryzen 7 7800X3D
Corsair MP600
341 (235.85min - 340.94max) MB/s +32%
Kingston Fury Renegade G5 8 TB
Kingston Fury Renegade G5 8TB
258 (254.71min - 258.11max) MB/s
Average Kingston Fury Renegade G5 8TB
  (n=1)
258 MB/s 0%
Kingston Fury Renegade G5 4 TB
Kingston Fury Renegade G5 4TB
256 (251min - 256.11max) MB/s -1%
Kingston KC3000 2 TB
Kingston KC3000 2048G SKC3000D2048G
247 (243.12min - 246.98max) MB/s -4%
Average of class
  (1.23 - 435, n=2014)
166.3 MB/s -36%
Schenker XMG Pro 16 (E25)
Samsung 9100 Pro 1 TB
156.5 (155.62min - 156.47max) MB/s -39%
4k q32 t16 read
Kingston Fury Renegade G5 4 TB
Kingston Fury Renegade G5 4TB
8156 (8047.93min - 8156.46max) MB/s +1%
Kingston Fury Renegade G5 8 TB
Kingston Fury Renegade G5 8TB
8070 (7820.2min - 8070.01max) MB/s
Average Kingston Fury Renegade G5 8TB
  (n=1)
8070 MB/s 0%
Eurocom Raptor X17 Core i9-14900HX
Corsair MP700 Pro 2TB
6172 (6083.33min - 6171.85max) MB/s -24%
Kingston KC3000 2 TB
Kingston KC3000 2048G SKC3000D2048G
4242 (4201.86min - 4241.55max) MB/s -47%
AMD Ryzen 7 7800X3D
Corsair MP600
1757 (1433.31min - 1757.34max) MB/s -78%
Average of class
  (1.03 - 8156, n=2014)
1451 MB/s -82%
Schenker XMG Pro 16 (E25)
Samsung 9100 Pro 1 TB
979 (909.81min - 979max) MB/s -88%
4k q32 t16 write
Kingston Fury Renegade G5 8 TB
Kingston Fury Renegade G5 8TB
6738 (6491.09min - 6737.52max) MB/s
Average Kingston Fury Renegade G5 8TB
  (n=1)
6738 MB/s 0%
Kingston KC3000 2 TB
Kingston KC3000 2048G SKC3000D2048G
6280 (3941.51min - 6280.29max) MB/s -7%
Kingston Fury Renegade G5 4 TB
Kingston Fury Renegade G5 4TB
4911 (4872.22min - 4911max) MB/s -27%
Eurocom Raptor X17 Core i9-14900HX
Corsair MP700 Pro 2TB
4485 (4443.23min - 4484.95max) MB/s -33%
AMD Ryzen 7 7800X3D
Corsair MP600
1647 (552.25min - 1646.66max) MB/s -76%
Average of class
  (1.5 - 6738, n=2014)
1229 MB/s -82%
Schenker XMG Pro 16 (E25)
Samsung 9100 Pro 1 TB
563 (543.32min - 563.01max) MB/s -92%
AS SSD
Score Total
Kingston Fury Renegade G5 4 TB
Kingston Fury Renegade G5 4TB
16295 Points +14%
Kingston Fury Renegade G5 8 TB
Kingston Fury Renegade G5 8TB
14337 Points
Average Kingston Fury Renegade G5 8TB
  (n=1)
14337 Points 0%
Eurocom Raptor X17 Core i9-14900HX
Corsair MP700 Pro 2TB
13854 Points -3%
Kingston KC3000 2 TB
Kingston KC3000 2048G SKC3000D2048G
11741 Points -18%
Schenker XMG Pro 16 (E25)
Samsung 9100 Pro 1 TB
8609 Points -40%
AMD Ryzen 7 7800X3D
Corsair MP600
4931 Points -66%
Average of class
  (19 - 16295, n=3675)
3075 Points -79%
Score Read
Kingston Fury Renegade G5 4 TB
Kingston Fury Renegade G5 4TB
6261 Points +22%
Kingston Fury Renegade G5 8 TB
Kingston Fury Renegade G5 8TB
5121 Points
Average Kingston Fury Renegade G5 8TB
  (n=1)
5121 Points 0%
Eurocom Raptor X17 Core i9-14900HX
Corsair MP700 Pro 2TB
4345 Points -15%
Kingston KC3000 2 TB
Kingston KC3000 2048G SKC3000D2048G
4266 Points -17%
Schenker XMG Pro 16 (E25)
Samsung 9100 Pro 1 TB
1964 Points -62%
Average of class
  (6 - 6261, n=3676)
1161 Points -77%
AMD Ryzen 7 7800X3D
Corsair MP600
980 Points -81%
Score Write
Eurocom Raptor X17 Core i9-14900HX
Corsair MP700 Pro 2TB
7208 Points +10%
Kingston Fury Renegade G5 4 TB
Kingston Fury Renegade G5 4TB
6844 Points +4%
Kingston Fury Renegade G5 8 TB
Kingston Fury Renegade G5 8TB
6582 Points
Average Kingston Fury Renegade G5 8TB
  (n=1)
6582 Points 0%
Schenker XMG Pro 16 (E25)
Samsung 9100 Pro 1 TB
5809 Points -12%
Kingston KC3000 2 TB
Kingston KC3000 2048G SKC3000D2048G
5303 Points -19%
AMD Ryzen 7 7800X3D
Corsair MP600
3403 Points -48%
Average of class
  (4 - 7208, n=3676)
1352 Points -79%
Seq Read
Kingston Fury Renegade G5 4 TB
Kingston Fury Renegade G5 4TB
10753 MB/s +13%
Kingston Fury Renegade G5 8 TB
Kingston Fury Renegade G5 8TB
9499 MB/s
Average Kingston Fury Renegade G5 8TB
  (n=1)
9499 MB/s 0%
Schenker XMG Pro 16 (E25)
Samsung 9100 Pro 1 TB
9199 MB/s -3%
Eurocom Raptor X17 Core i9-14900HX
Corsair MP700 Pro 2TB
7812.91 MB/s -18%
Kingston KC3000 2 TB
Kingston KC3000 2048G SKC3000D2048G
5738 MB/s -40%
AMD Ryzen 7 7800X3D
Corsair MP600
3370.3 MB/s -65%
Average of class
  (193.2 - 12763, n=3893)
2153 MB/s -77%
Seq Write
Kingston Fury Renegade G5 4 TB
Kingston Fury Renegade G5 4TB
10950 MB/s +8%
Kingston Fury Renegade G5 8 TB
Kingston Fury Renegade G5 8TB
10151 MB/s
Average Kingston Fury Renegade G5 8TB
  (n=1)
10151 MB/s 0%
Eurocom Raptor X17 Core i9-14900HX
Corsair MP700 Pro 2TB
9485.67 MB/s -7%
Schenker XMG Pro 16 (E25)
Samsung 9100 Pro 1 TB
5793 MB/s -43%
Kingston KC3000 2 TB
Kingston KC3000 2048G SKC3000D2048G
5664 MB/s -44%
AMD Ryzen 7 7800X3D
Corsair MP600
3950.72 MB/s -61%
Average of class
  (52.2 - 11316, n=3896)
1463 MB/s -86%
4K Read
Kingston Fury Renegade G5 4 TB
Kingston Fury Renegade G5 4TB
99.5 MB/s +22%
Eurocom Raptor X17 Core i9-14900HX
Corsair MP700 Pro 2TB
89.1 MB/s +9%
Kingston KC3000 2 TB
Kingston KC3000 2048G SKC3000D2048G
84.6 MB/s +3%
Kingston Fury Renegade G5 8 TB
Kingston Fury Renegade G5 8TB
81.8 MB/s
Average Kingston Fury Renegade G5 8TB
  (n=1)
81.8 MB/s 0%
AMD Ryzen 7 7800X3D
Corsair MP600
57.25 MB/s -30%
Schenker XMG Pro 16 (E25)
Samsung 9100 Pro 1 TB
49.2 MB/s -40%
Average of class
  (6.08 - 314, n=3885)
43.6 MB/s -47%
4K Write
Eurocom Raptor X17 Core i9-14900HX
Corsair MP700 Pro 2TB
350.79 MB/s +57%
Kingston Fury Renegade G5 4 TB
Kingston Fury Renegade G5 4TB
230 MB/s +3%
Kingston KC3000 2 TB
Kingston KC3000 2048G SKC3000D2048G
227 MB/s +2%
Schenker XMG Pro 16 (E25)
Samsung 9100 Pro 1 TB
226 MB/s +1%
Kingston Fury Renegade G5 8 TB
Kingston Fury Renegade G5 8TB
223 MB/s
Average Kingston Fury Renegade G5 8TB
  (n=1)
223 MB/s 0%
AMD Ryzen 7 7800X3D
Corsair MP600
153.8 MB/s -31%
Average of class
  (13.3 - 512, n=3885)
117.5 MB/s -47%
4K-64 Read
Kingston Fury Renegade G5 4 TB
Kingston Fury Renegade G5 4TB
5086 MB/s +24%
Kingston Fury Renegade G5 8 TB
Kingston Fury Renegade G5 8TB
4089 MB/s
Average Kingston Fury Renegade G5 8TB
  (n=1)
4089 MB/s 0%
Kingston KC3000 2 TB
Kingston KC3000 2048G SKC3000D2048G
3607 MB/s -12%
Eurocom Raptor X17 Core i9-14900HX
Corsair MP700 Pro 2TB
3474.56 MB/s -15%
Schenker XMG Pro 16 (E25)
Samsung 9100 Pro 1 TB
995 MB/s -76%
Average of class
  (13.1 - 5086, n=3884)
850 MB/s -79%
AMD Ryzen 7 7800X3D
Corsair MP600
585.92 MB/s -86%
4K-64 Write
Eurocom Raptor X17 Core i9-14900HX
Corsair MP700 Pro 2TB
5908.55 MB/s +11%
Kingston Fury Renegade G5 4 TB
Kingston Fury Renegade G5 4TB
5519 MB/s +3%
Kingston Fury Renegade G5 8 TB
Kingston Fury Renegade G5 8TB
5344 MB/s
Average Kingston Fury Renegade G5 8TB
  (n=1)
5344 MB/s 0%
Schenker XMG Pro 16 (E25)
Samsung 9100 Pro 1 TB
5004 MB/s -6%
Kingston KC3000 2 TB
Kingston KC3000 2048G SKC3000D2048G
4510 MB/s -16%
AMD Ryzen 7 7800X3D
Corsair MP600
2854.41 MB/s -47%
Average of class
  (13.7 - 5909, n=3882)
1024 MB/s -81%
Access Time Read
AMD Ryzen 7 7800X3D
Corsair MP600
0.869 ms * -5331%
Average of class
  (0.012 - 33, n=3815)
0.586 ms * -3563%
Kingston KC3000 2 TB
Kingston KC3000 2048G SKC3000D2048G
0.09 ms * -463%
Eurocom Raptor X17 Core i9-14900HX
Corsair MP700 Pro 2TB
0.02 ms * -25%
Schenker XMG Pro 16 (E25)
Samsung 9100 Pro 1 TB
0.018 ms * -13%
Kingston Fury Renegade G5 8 TB
Kingston Fury Renegade G5 8TB
0.016 ms *
Average Kingston Fury Renegade G5 8TB
  (n=1)
0.016 ms * -0%
Kingston Fury Renegade G5 4 TB
Kingston Fury Renegade G5 4TB
0.015 ms * +6%
Access Time Write
Average of class
  (0.011 - 60.7, n=3858)
0.501 ms * -2847%
Eurocom Raptor X17 Core i9-14900HX
Corsair MP700 Pro 2TB
0.1 ms * -488%
Kingston KC3000 2 TB
Kingston KC3000 2048G SKC3000D2048G
0.018 ms * -6%
Kingston Fury Renegade G5 4 TB
Kingston Fury Renegade G5 4TB
0.017 ms * -0%
Kingston Fury Renegade G5 8 TB
Kingston Fury Renegade G5 8TB
0.017 ms *
Average Kingston Fury Renegade G5 8TB
  (n=1)
0.017 ms * -0%
Schenker XMG Pro 16 (E25)
Samsung 9100 Pro 1 TB
0.016 ms * +6%
AMD Ryzen 7 7800X3D
Corsair MP600
0.013 ms * +24%

* ... smaller is better

 Kingston Fury Renegade G5 8TB SSD stress test
Kingston Fury Renegade G5 8TB SSD stress test

DiskSpd Read Loop, Queue Depth 8

0750150022503000375045005250600067507500825090009750105001125012000127501350014250Tooltip
Kingston Fury Renegade G5 8 TB Kingston Fury Renegade G5 8TB; diskspd 2.0.17 f: Ø14800 (13148.3-14902.6)
HP EliteBook 865 G10 SK hynix PC801 HFS001TEJ9X101N; diskspd 2.0.17 f: Ø6918 (6258.74-6957.44)
HP Spectre x360 2-in-1 16-f1075ng SK Hynix PC711 1TB HFS001TDE9X073N: Ø3537 (3123.29-3556.33)
LG Gram 2in1 16 16T90R - G.AA78G Samsung PM9A1 MZVL21T0HCLR: Ø6206 (5714.21-6585.65)
Schenker XMG Core 15 (M24) Samsung 990 Pro 1 TB; diskspd 2.0.17 f: Ø7120 (6339.48-7142.87)
Kingston KC3000 2 TB Kingston KC3000 2048G SKC3000D2048G; diskspd 2.0.17 f: Ø7097 (6084.05-7125.91)
Kingston Fury Renegade G5 4 TB Kingston Fury Renegade G5 4TB; diskspd 2.0.17 f: Ø14176 (11971.77-14726.83)

Conclusion

The Kingston Fury Renegade G5 with 8 TB presents itself in the test as an uncompromising high-end SSD based on PCIe 5.0. With sequential read and write rates of over 14,000 MB/s, it delivers first-class performance and is one of the fastest NVMe SSDs in its class. Even under continuous load, performance remains largely constant, provided effective cooling is available. The Fury Renegade G5 is therefore clearly aimed at demanding users who expect maximum speed and high storage capacity in a desktop system.

Warning: No verdict element found (searching for content element with "#verdict" in the description, cant link to it

Transparency

The selection of devices to be reviewed is made by our editorial team. The test sample was given to the author by the manufacturer free of charge for the purposes of review. There was no third-party influence on this review, nor did the manufacturer receive a copy of this review before publication. There was no obligation to publish this review. As an independent media company, Notebookcheck is not subjected to the authority of manufacturers, retailers or publishers.

This is how Notebookcheck is testing

Every year, Notebookcheck independently reviews hundreds of laptops and smartphones using standardized procedures to ensure that all results are comparable. We have continuously developed our test methods for around 20 years and set industry standards in the process. In our test labs, high-quality measuring equipment is utilized by experienced technicians and editors. These tests involve a multi-stage validation process. Our complex rating system is based on hundreds of well-founded measurements and benchmarks, which maintains objectivity. Further information on our test methods can be found here.

static version load dynamic
Loading comments
Comment on this article
Please share our article, every link counts!
Mail Logo
Google Logo Add as a preferred
source on Google
> Expert Reviews and News on Laptops, Smartphones and Tech Innovations > Reviews > Kingston Fury Renegade G5 8 TB review - High-end PCIe 5.0 NVMe SSD with more than 14,000 MB/s for gaming & workstations
Sebastian Bade, 2025-12-23 (Update: 2025-12-23)