Notebookcheck Logo
The T-Force Z540 with graphene cooling pad

Over 12,000 MB/s and a graphene cooling pad - TeamGroup T-Force Z540 SSD for gamers and content creators reviewed

PCIe 5.0x4 SSD.

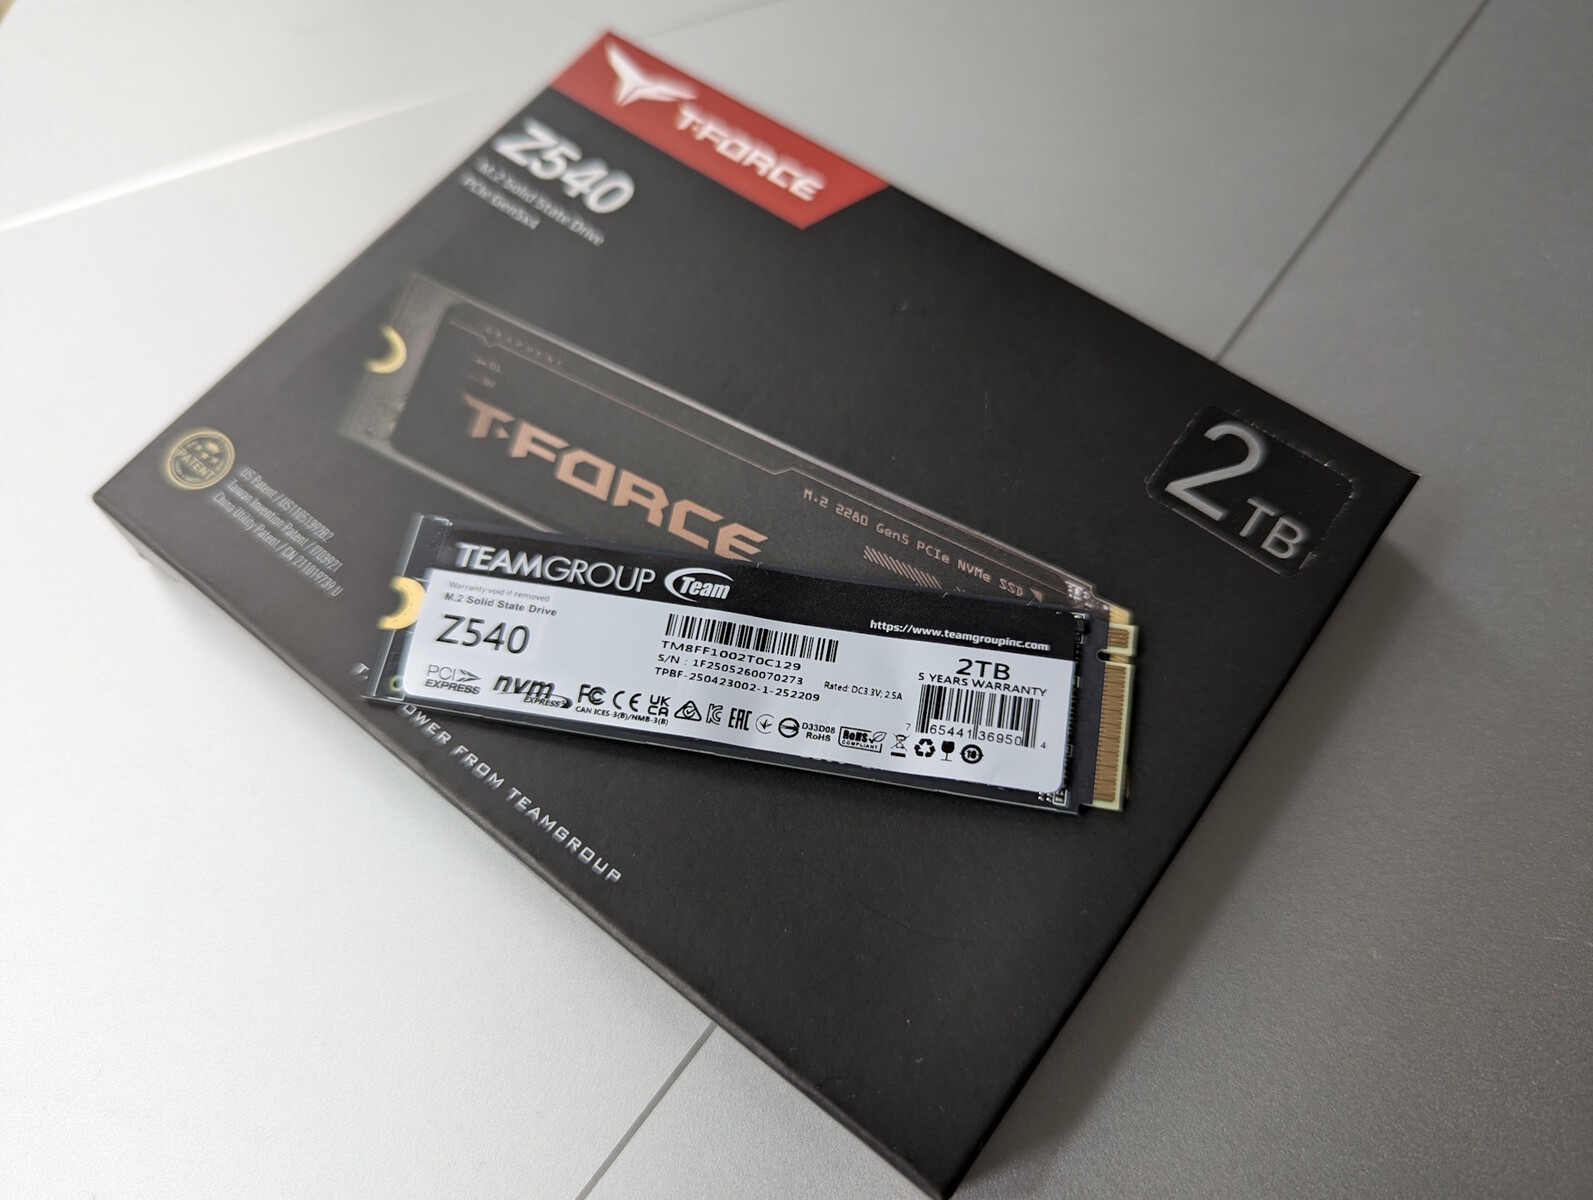
PCIe 5.0 SSDs are potentially much faster than their PCIe 4.0 predecessors. TeamGroup sent us a 2 TB sample of the T-Force Z540, rated for up to 12,400 MB/s in sequential read speed. So, we removed the SSD from the XMG Pro 16, installed the Z540, and checked whether the drive delivers on its promises!
Christian Hintze, (translated by DeepL / Ninh Duy) Published 🇩🇪
Benchmark Accessory Gadget Storage

Verdict - Fast, but graphs alone are not enough

The TeamGroup T-Force Z540 doesn't quite reach the blazing speed of the Kingston Fury Renegade G5. Even so, its results are excellent, and the SSD is impressively fast.

However, that only applies if proper cooling is ensured. Apparently, PCIe 5.0 SSDs get even hotter than their predecessors. The graphene sticker alone isn’t sufficient, especially in a tightly packed laptop case. The resulting heat initially caused the performance to drop significantly. Only with additional cooling pads and contact with the laptop chassis could the heat be dissipated, allowing the T-Force to make full use of its speed potential. Whether the graphene layer provides any real benefit or is mainly a marketing gimmick cannot be definitively determined in this test.

Pros

+ very fast transfer speeds

Cons

- Performance drops sharply without additional cooling measures

Price and availability

The 2 TB version we tested costs about €232 (approximately $272) on Amazon (Germany).

Amazon Logo
$219.99
TEAMGROUP T-Force Z540 2TB DRAM SLC Cache 3D TLC NAND NVMe Phison E26 PCIe Gen5x4 M.2 2280 Gaming SSD with Ultra-Thin Graphene Heat Spreader Read/Write 12400/11800 MB/s TM8FF1002T0C129

Our SSD leaderboard is currently dominated by the Kingston Fury Renegade G5 with 4 TB, which achieved sequential read and write speeds of over 10,000 MB/s in our test. Teamgroup sent us their new, internal PCIe Gen 5x4 SSD, the T-Force Z540, for comparison. We measure whether it works.

TeamGroup T-Force Z540
Form factor M.2 (2280)
Interface PCIe 5.0 x4
Memory 3D-NAND TLC
Cache LPDDR4 4GB
Controller Phison
Weight 13 g
Available capacities 1 TB, 2 TB, 4 TB
Sequential Read/Write (manufacturer data) 1 TB Read/Write: up to 11,700/9,500 MB/s
2 TB Read/Write: up to 12,400/11,800 MB/s
4 TB Read/Write: up to 12,400/11,800 MB/s
IOPS 1,400,000 read, 1,400,000 write
Average operating time 1,700,000 h
Warranty 5 years
Manufacturer No. TM8FF1002T0C129

Packaging & scope of delivery: Cardboard and plastic

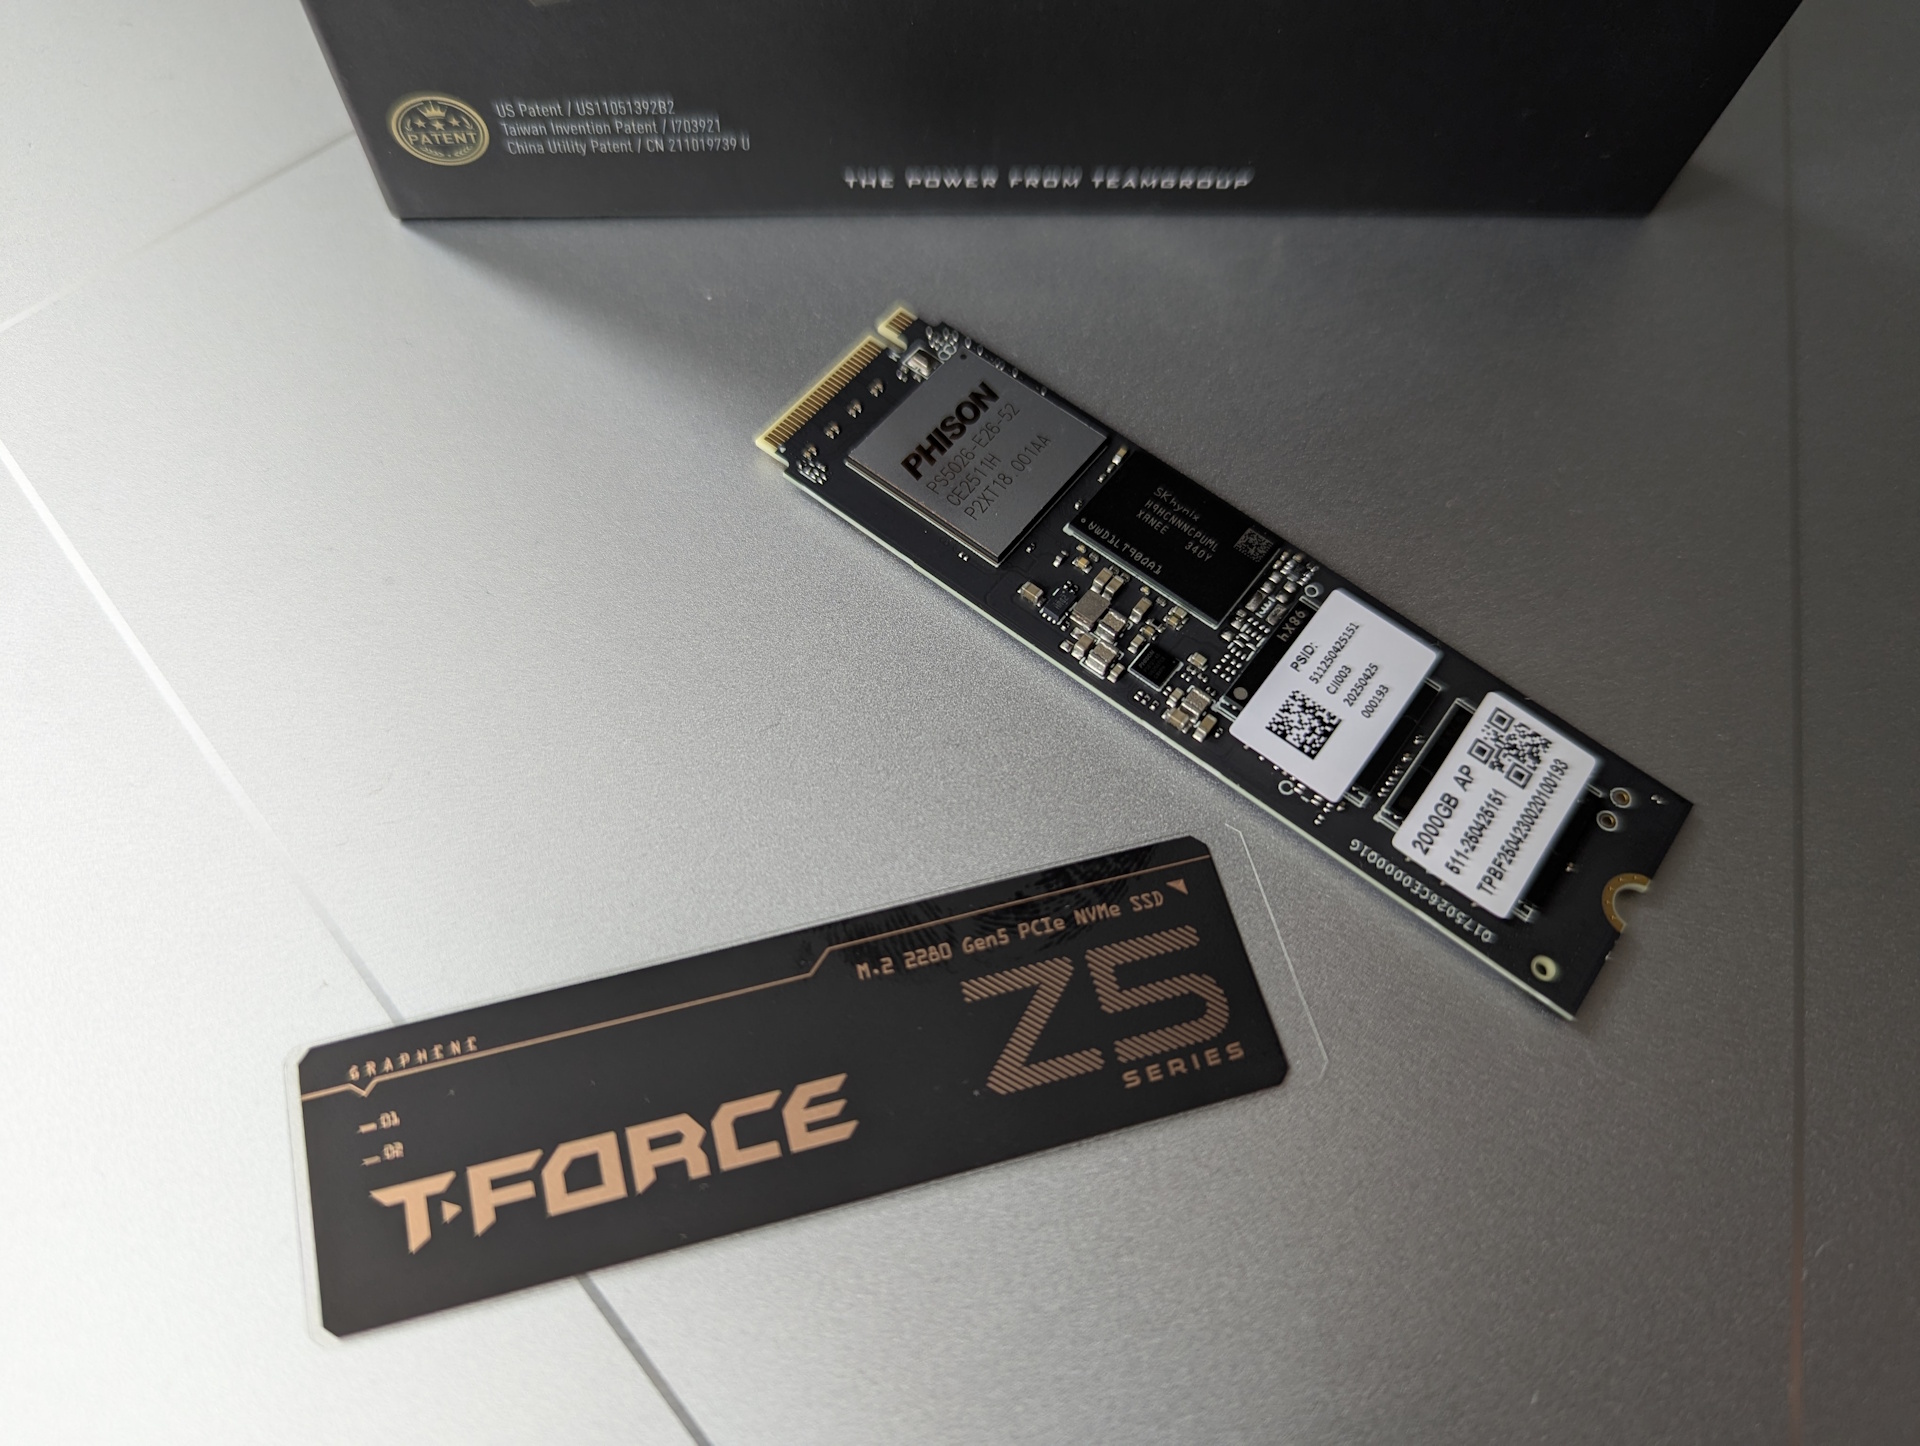
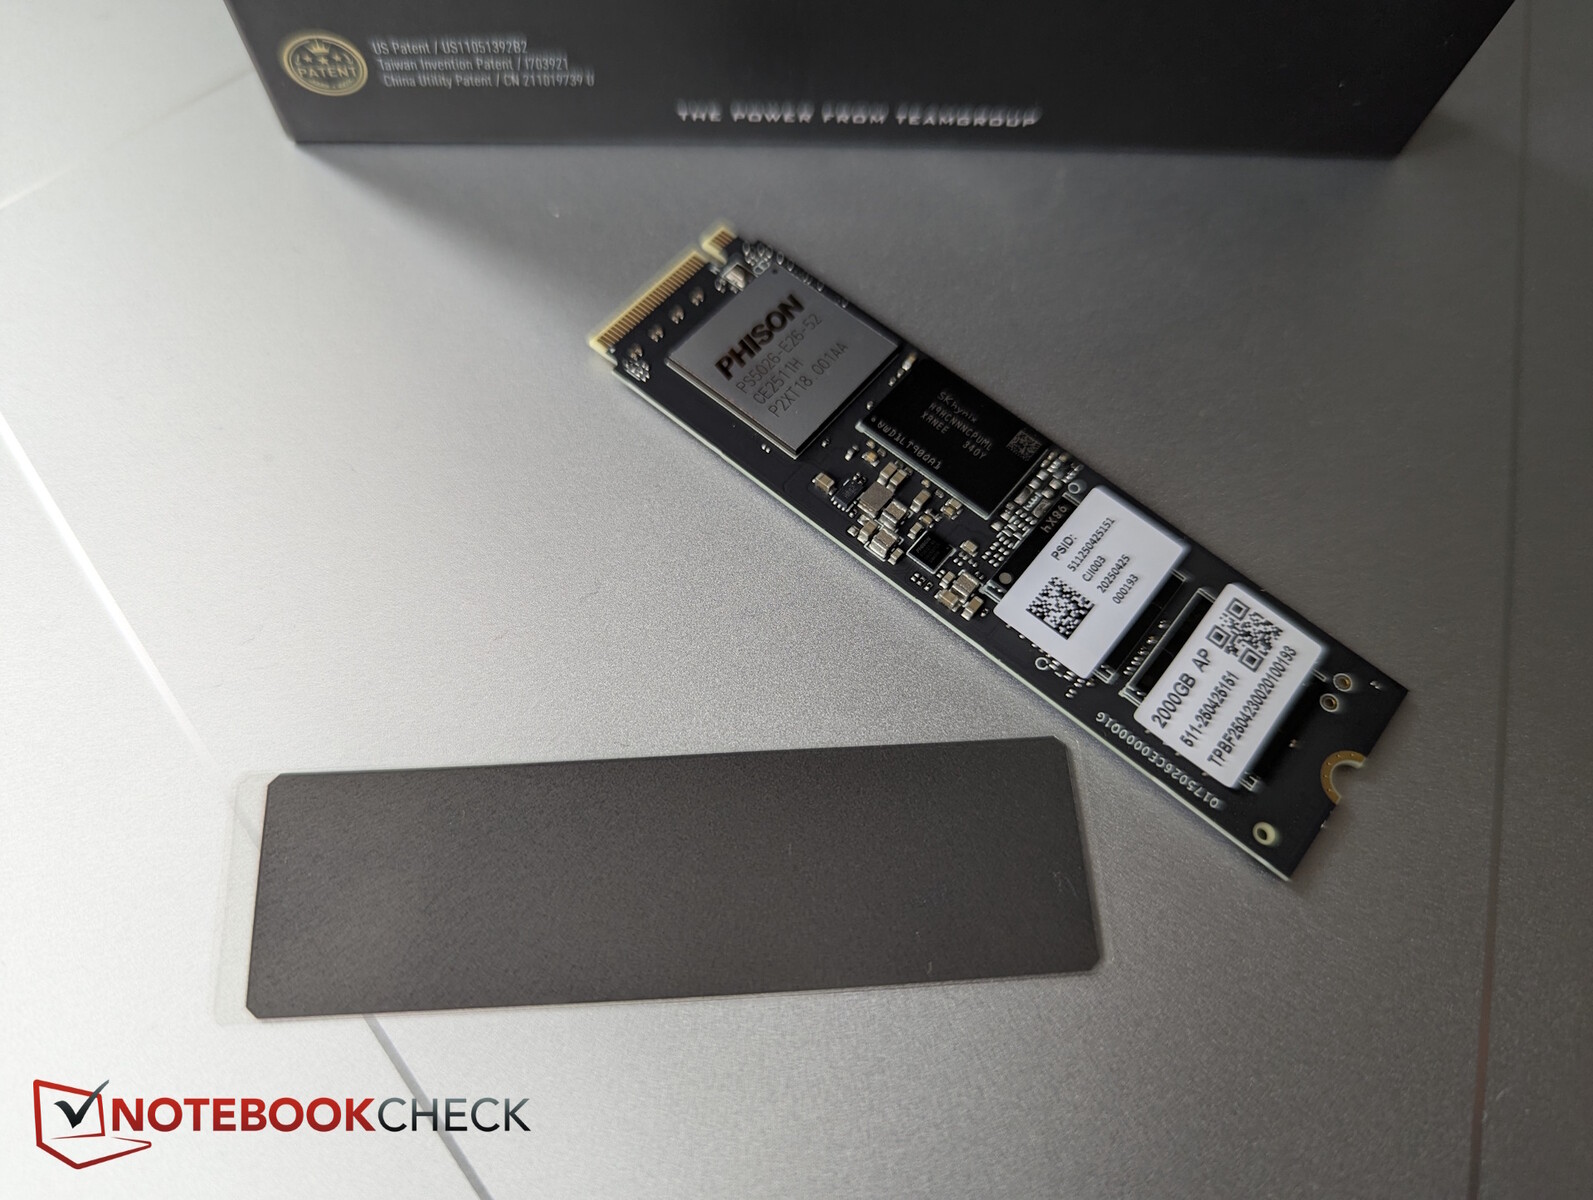
TeamGroup ships the M.2 SSD in a small black cardboard box, which contains a protective plastic cover for the storage strip. The packaging is recyclable, though it doesn’t appear to be made from recycled materials.
 

The SSD and packaging

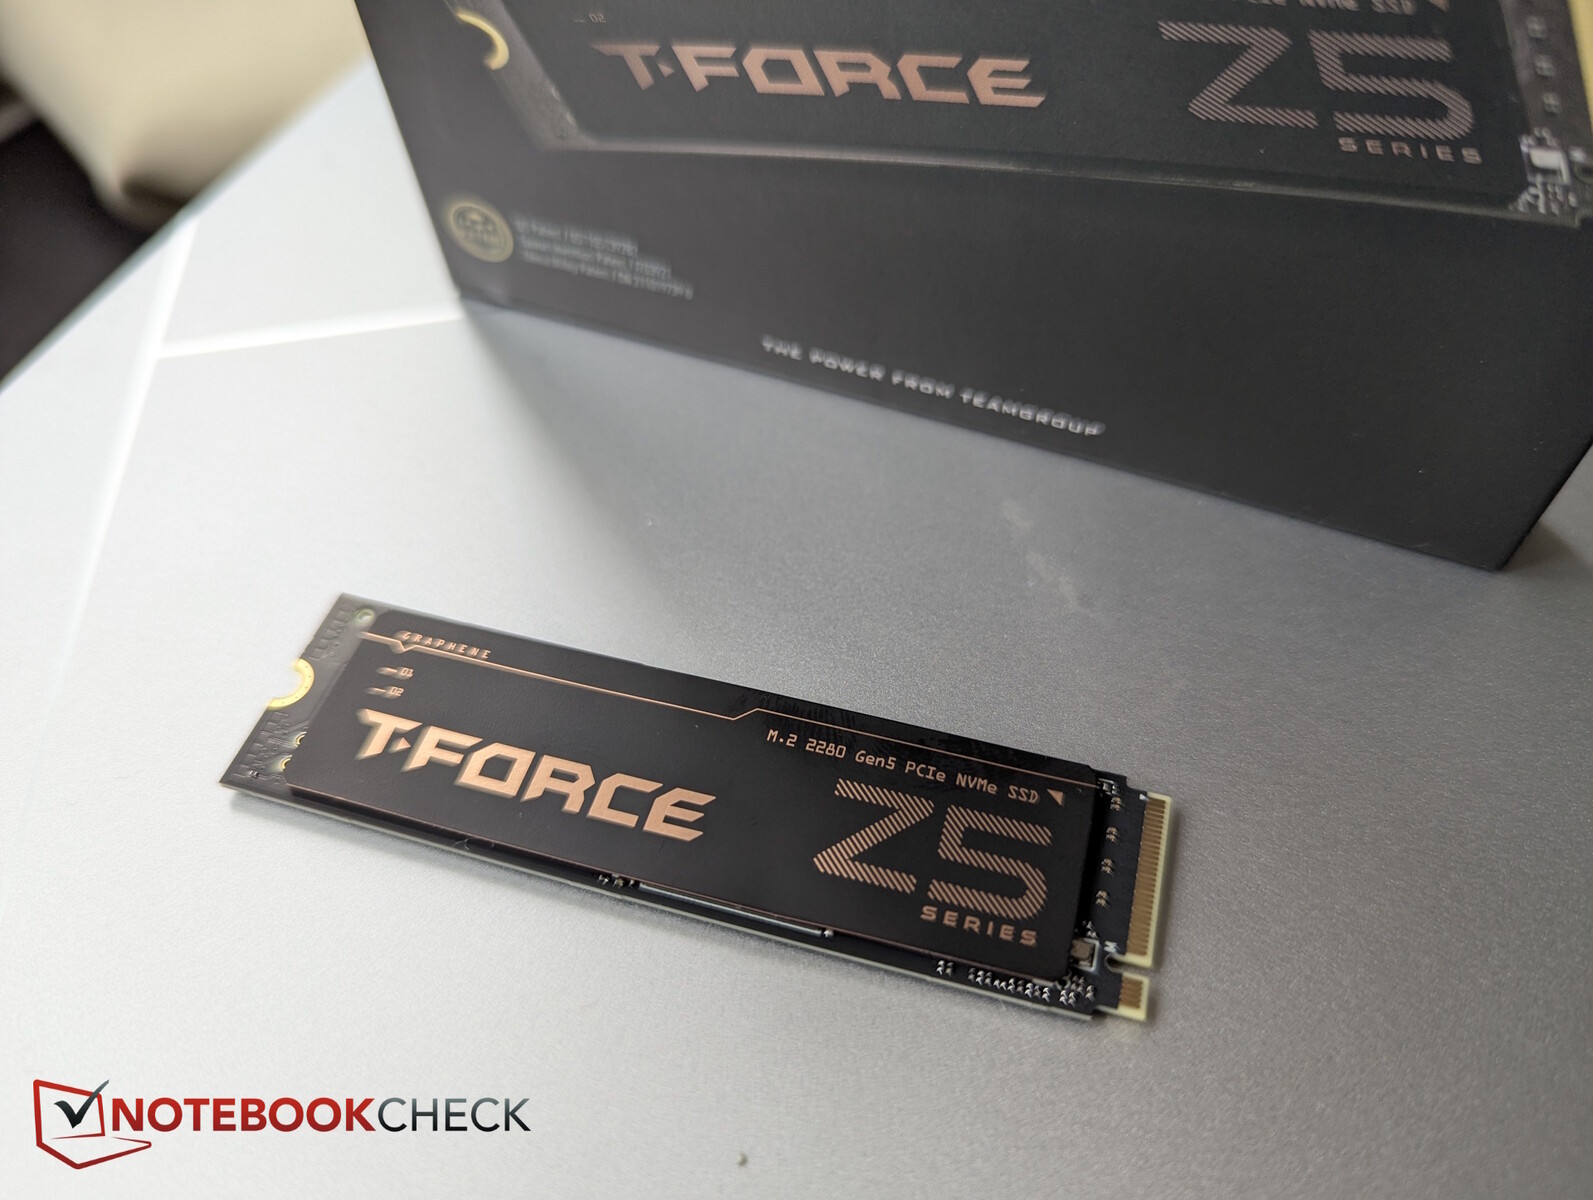
A very thin graphene cooling sticker is also included, which is simply applied to the top of the SSD. You just peel off the protective film and position the sticker as centrally as possible over the components.

T-Force with Phison controller without cooling sticker
T-Force with attached graphene sticker

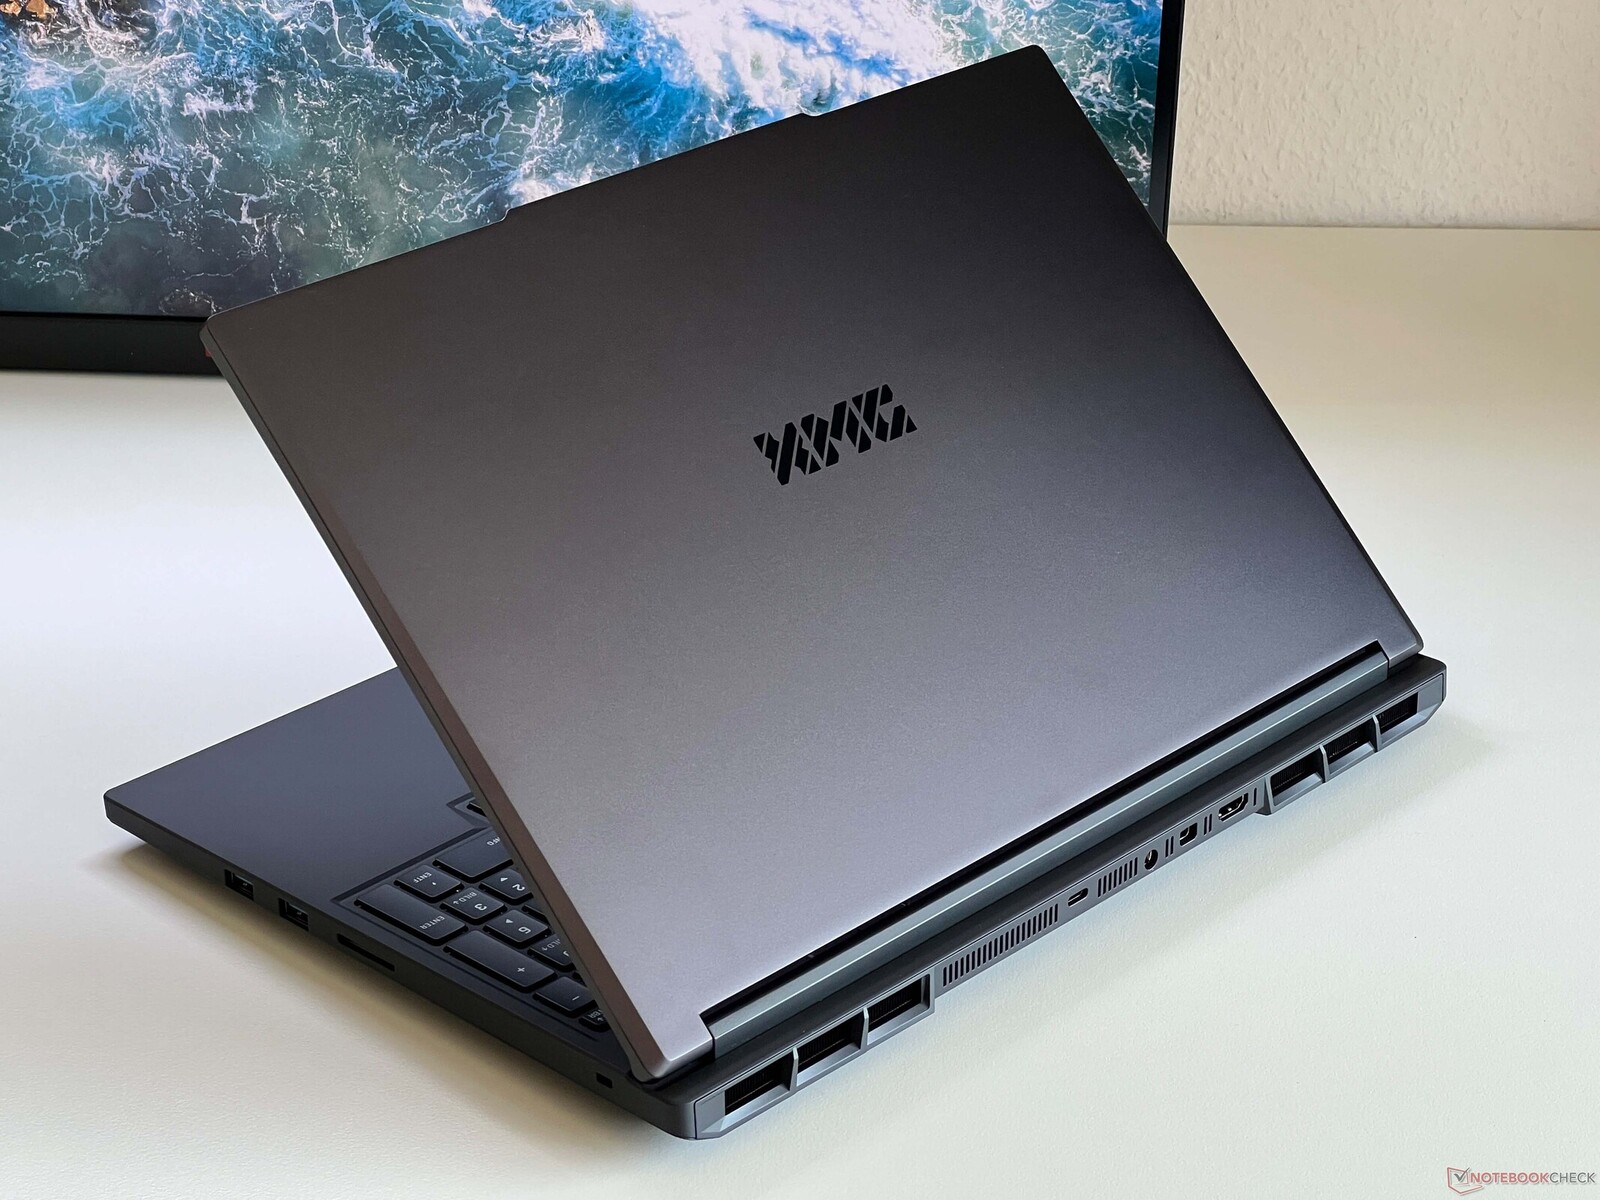
Test system - XMG Pro 16 laptop

Since maximum performance requires an M.2 slot with PCIe 5.0 x4 support, we chose the current Schenker XMG Pro 16 for our test. The laptop’s primary SSD slot supports the modern standard, while the secondary slot unfortunately only runs on PCIe 4.0.

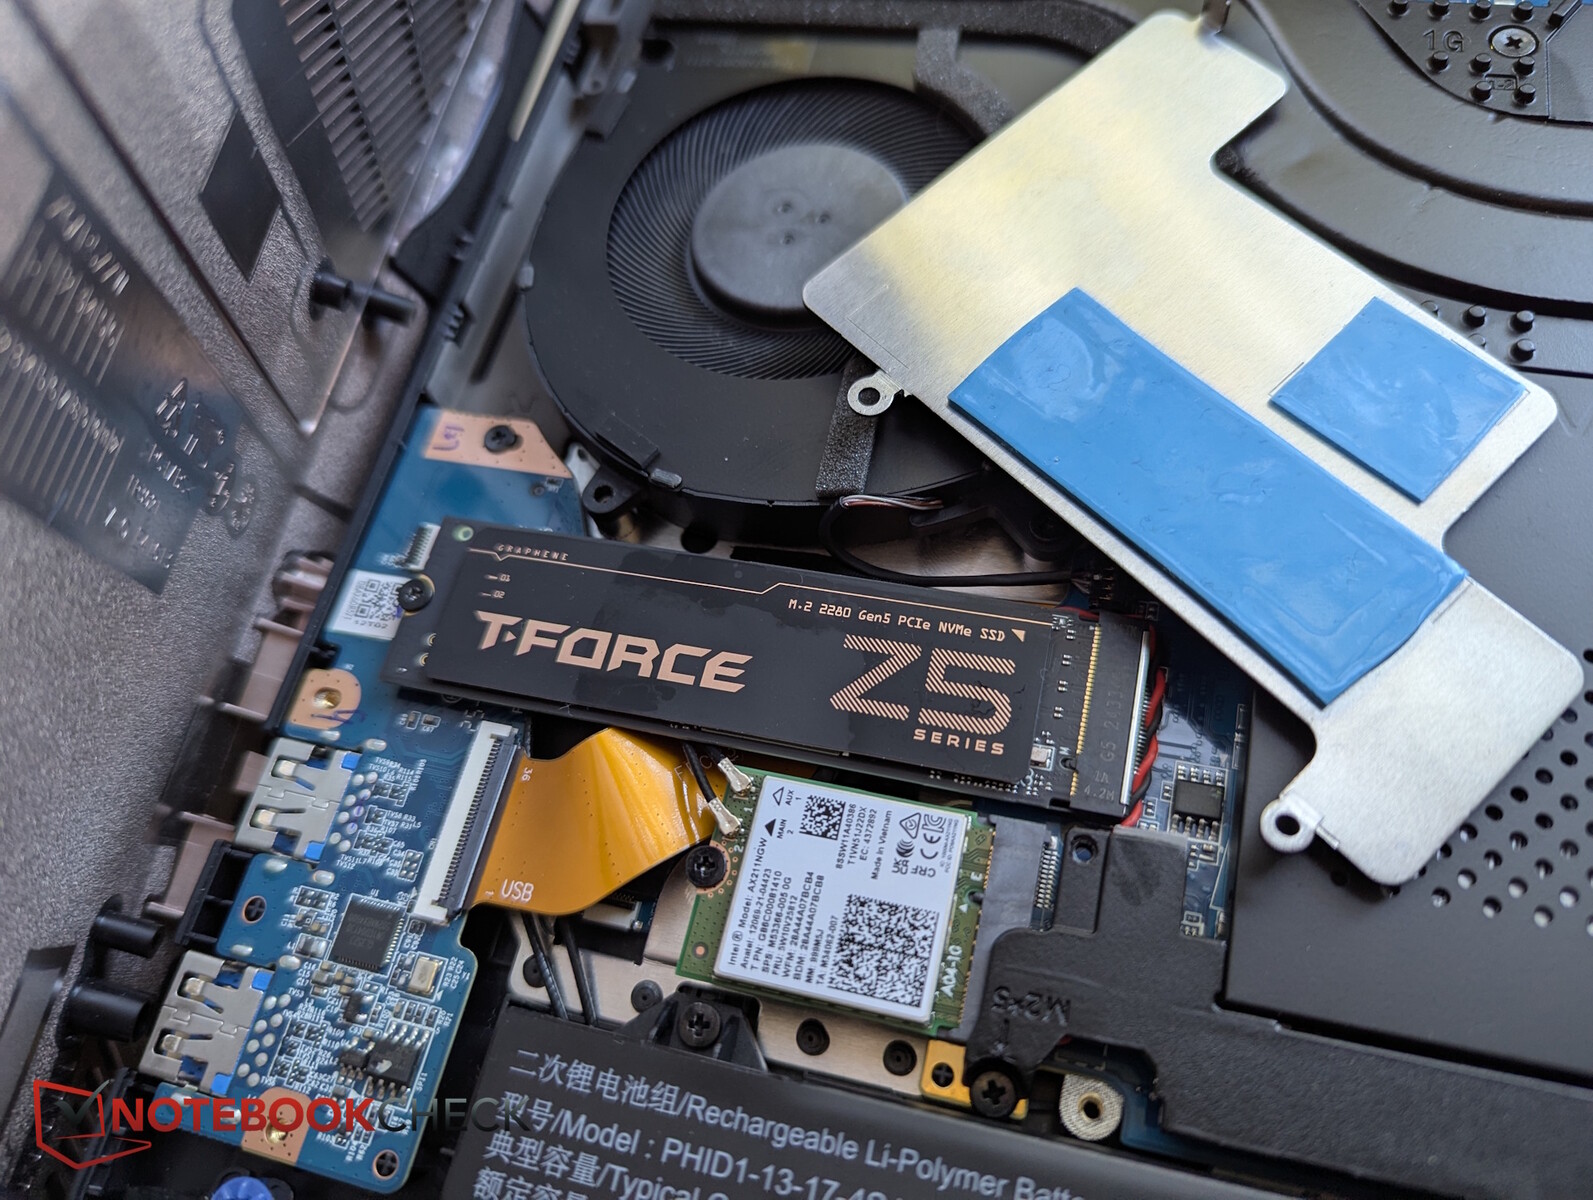
So we remove the notebook's main memory and insert our T-Force Z540. Initially, we left out XMG’s cooling plate—which normally connects to the chassis via an additional thermal pad—and relied solely on the included graphene sticker for cooling.

The XMG Pro 16 with PCIe 5.0x4 M.2 slot
We use the T-Force Z540 instead of the regular SSD
We'll leave out the XMG cooling plate for SSDs for now, can the advertised graphene sticker do that itself?

Transfer rates

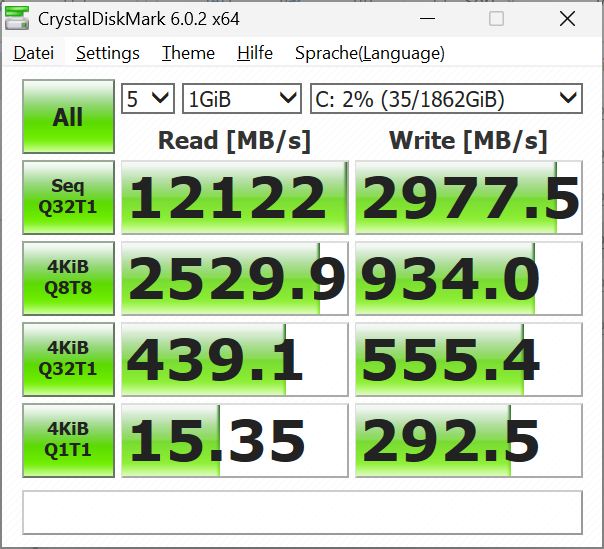
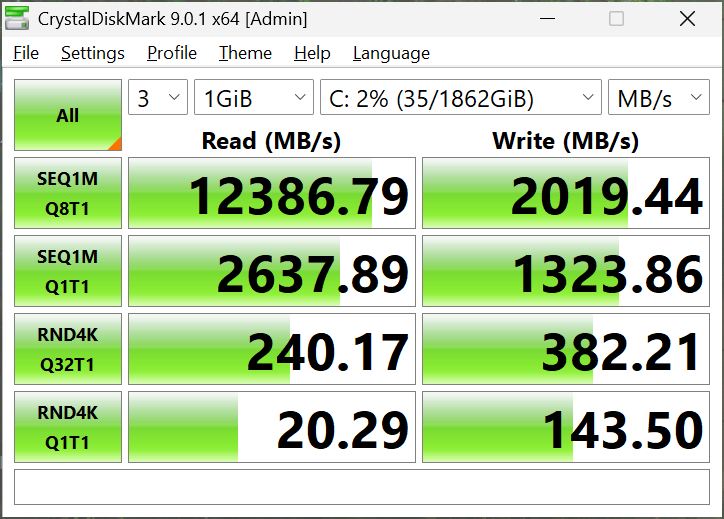
1. Test without XMG cooling plate

Without a cooling plate, the results are disappointing. Only in CrystalDiskMark 6 and 9 do the sequential read speeds come close to the specified potential, while the sequential write speeds fall far short.
 

Lousy continuous performance: Without the XMG cooling plate, the performance drops (red line), graphene cooling pad or not

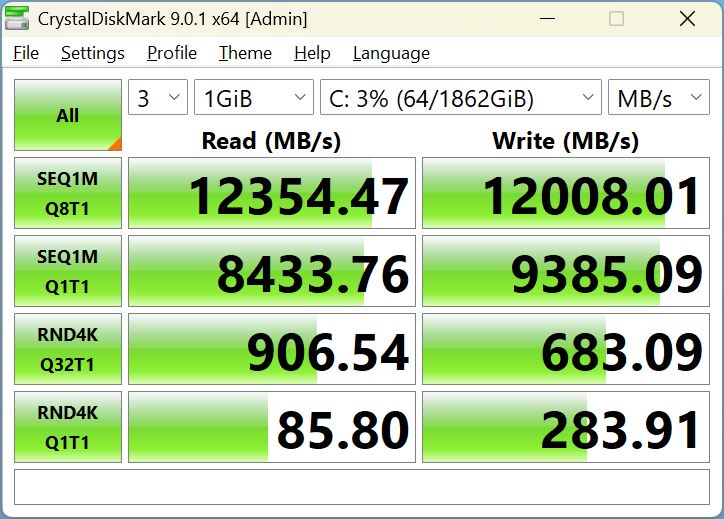
2. Test with XMG cooling plate

Since the results seemed unusual, we reinstalled the XMG cooling plate so the T-Force’s heat could be dissipated through the thermal pad into the laptop’s base plate.

Screwed-in XMG cooling plate with contact pads to the chassis

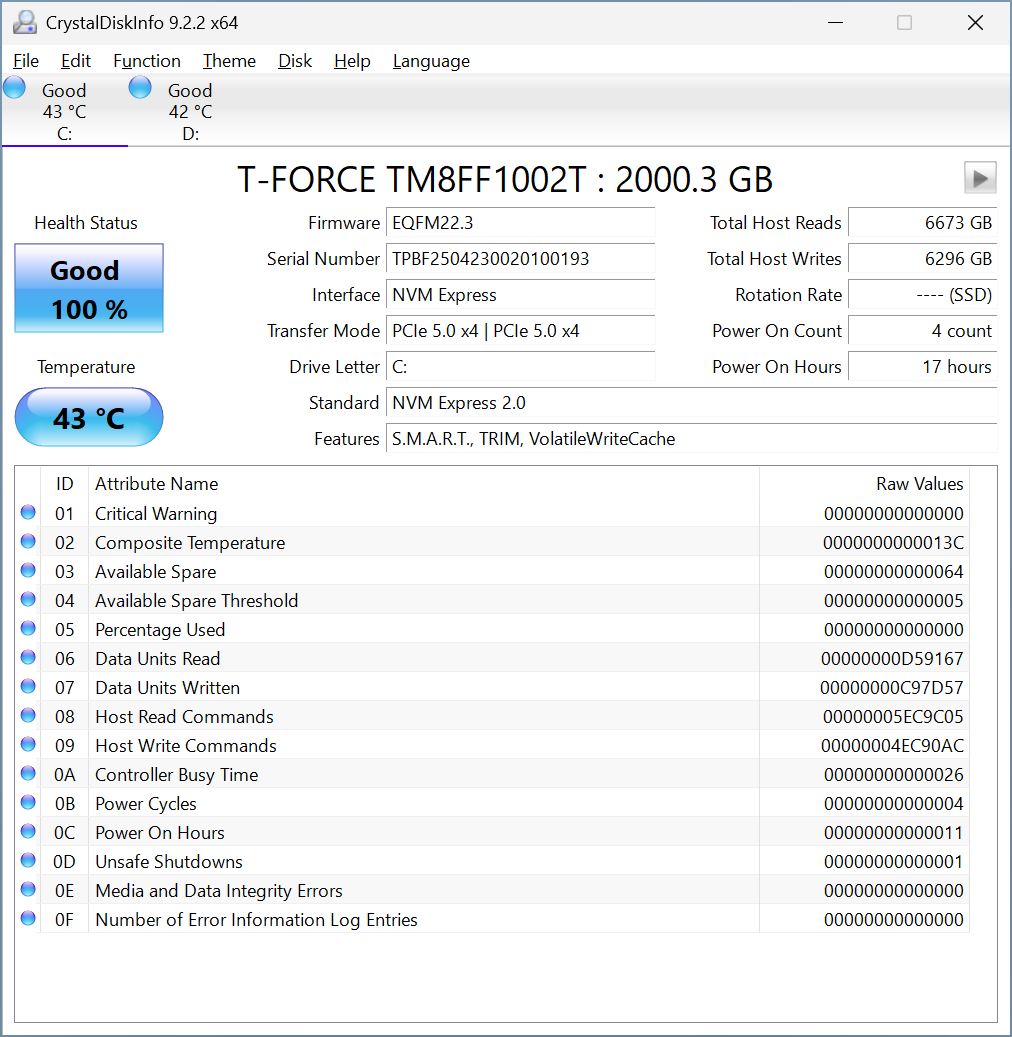
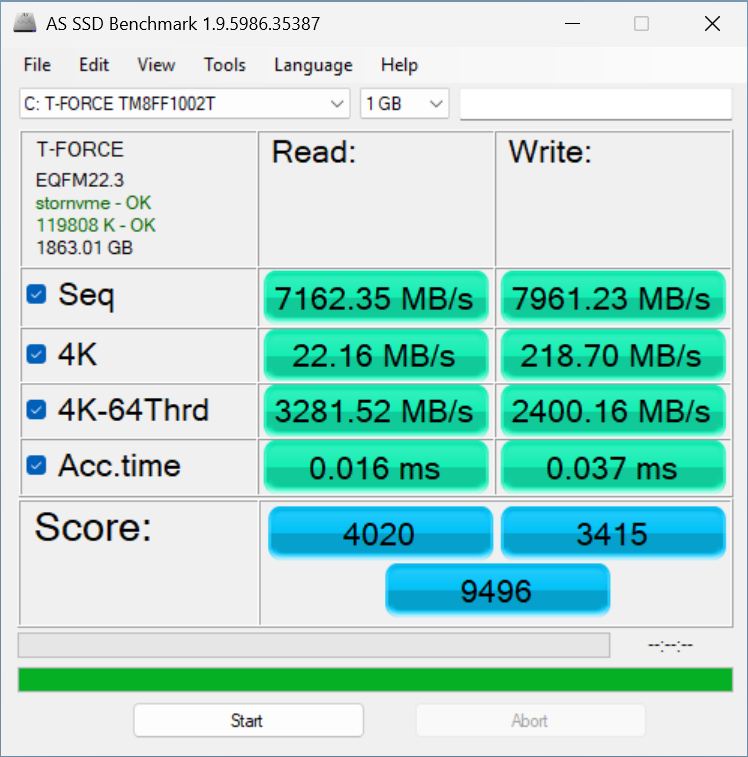
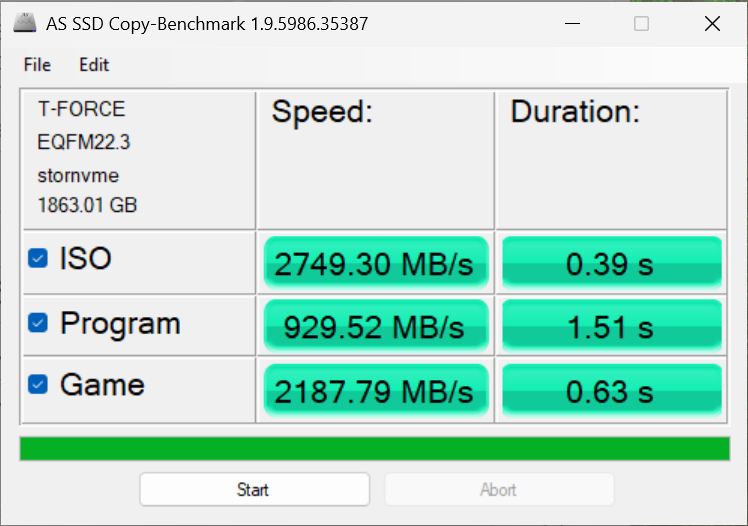
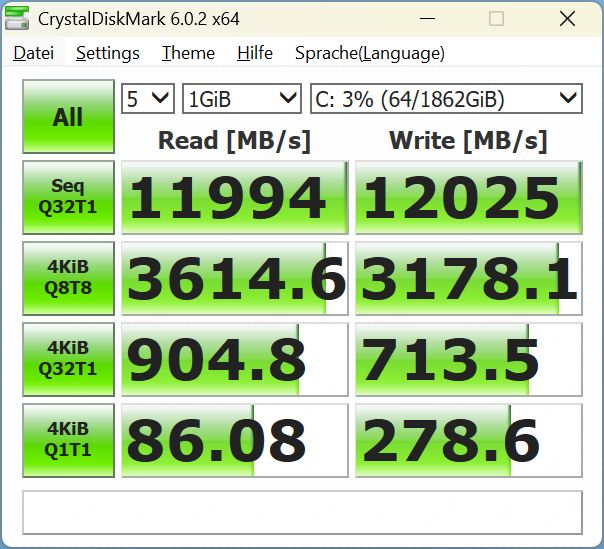
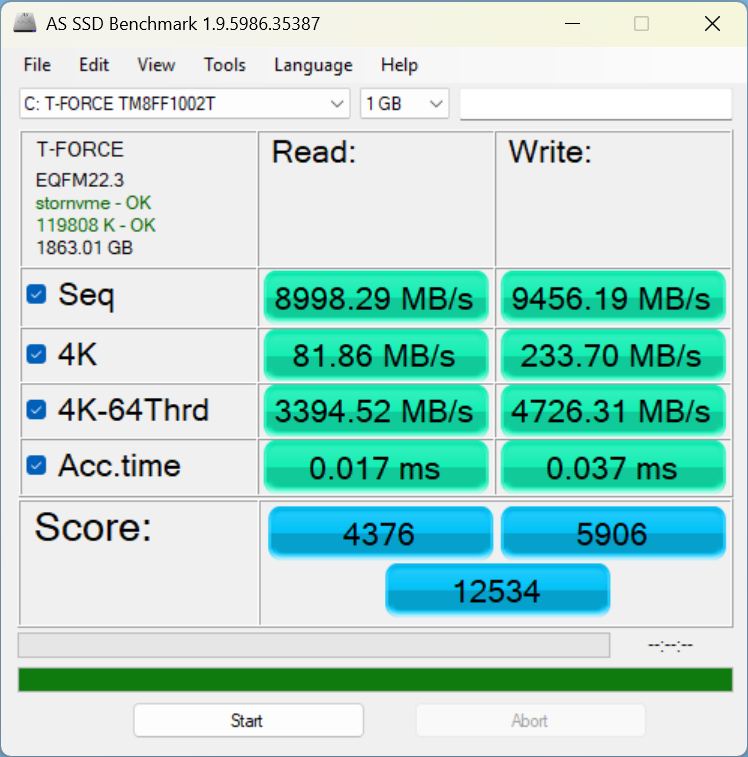
On the second attempt, the results look much better: according to CrystalDiskMark 6, the drive reaches almost 12,000 MB/s in both read and write speeds—an impressive result. CrystalDiskMark 9 shows even slightly higher numbers, while AS SSD is a bit more restrained.

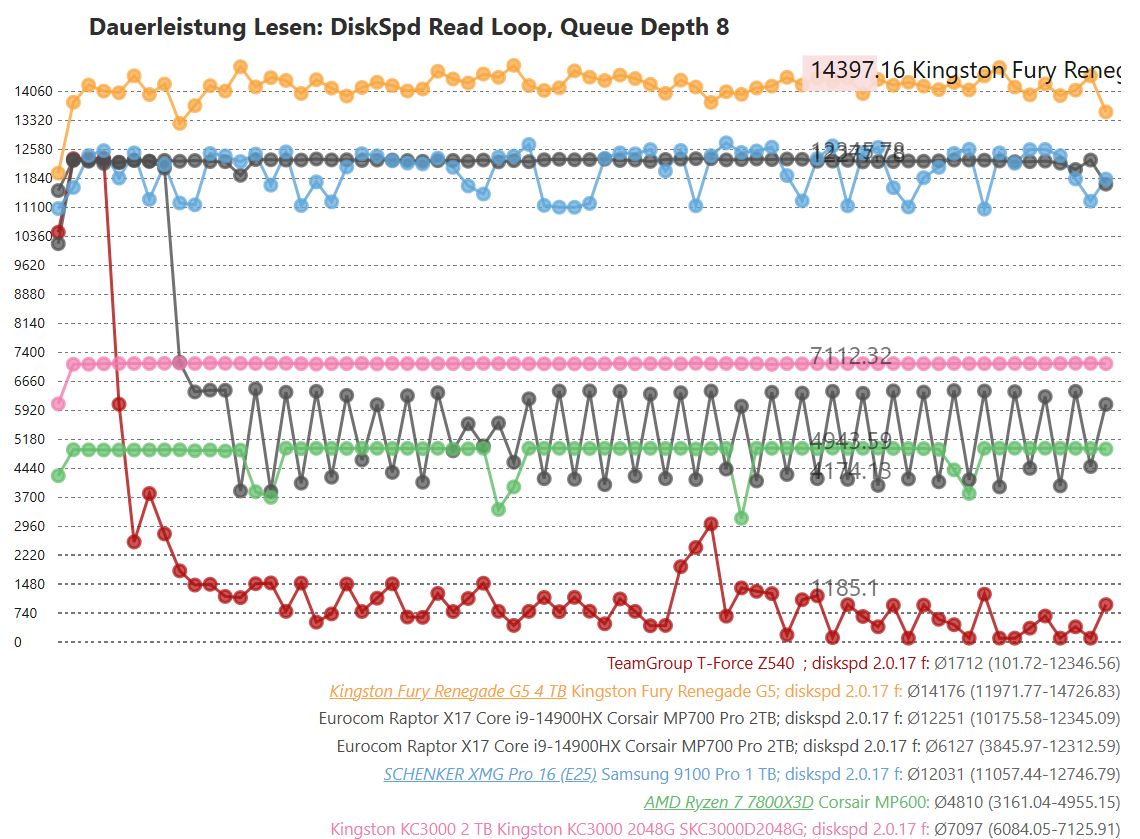
In our endurance test with DiskSpd, the T-Force Z540 also maintained consistently high performance. It doesn’t quite match the speed of the Kingston Fury Renegade G5, but the results are still remarkably strong

CDM 5/6 Read Seq Q32T1: 11994 MB/s
CDM 5/6 Write Seq Q32T1: 12026 MB/s
CDM 5/6 Read 4K Q32T1: 905 MB/s
CDM 5/6 Write 4K Q32T1: 714 MB/s
CDM 5/6 Read 4K: 86.1 MB/s
CDM 5/6 Write 4K: 279 MB/s
CDM 6 Write 4K Q8T8: 3178 MB/s
CDM 6 Read 4K Q8T8: 3615 MB/s
Drive Performance rating - Percent
Kingston Fury Renegade G5 4 TB
Kingston Fury Renegade G5
93.9 pt
Eurocom Raptor X17 Core i9-14900HX
Corsair MP700 Pro 2TB
83.6 pt
TeamGroup T-Force Z540
 
79.8 pt
Kingston KC3000 2 TB
Kingston KC3000 2048G SKC3000D2048G
67.2 pt
SCHENKER XMG Pro 16 (E25)
Samsung 9100 Pro 1 TB
58.4 pt
AMD Ryzen 7 7800X3D
Corsair MP600
36 pt
Global Average -3
 
25.3 pt
Average of class
 
25.3 pt
DiskSpd
seq read
Kingston Fury Renegade G5 4 TB
Kingston Fury Renegade G5
7350 (7164.43min - 7350.29max) MB/s +113%
SCHENKER XMG Pro 16 (E25)
Samsung 9100 Pro 1 TB
5359 (5332.25min - 5358.62max) MB/s +55%
TeamGroup T-Force Z540
 
3458 (3451.49min - 3458.41max) MB/s
Kingston KC3000 2 TB
Kingston KC3000 2048G SKC3000D2048G
3202 (3090.36min - 3201.93max) MB/s -7%
Eurocom Raptor X17 Core i9-14900HX
Corsair MP700 Pro 2TB
2672 (2652.21min - 2671.88max) MB/s -23%
Global Average -3
  (113.3 - 8300, n=1951)
2428 MB/s -30%
Average of class
  (113.3 - 8300, n=1951)
2428 MB/s -30%
AMD Ryzen 7 7800X3D
Corsair MP600
1609 (1589.43min - 1608.94max) MB/s -53%
seq write
Kingston Fury Renegade G5 4 TB
Kingston Fury Renegade G5
10125 (10048.8min - 10125max) MB/s +6%
TeamGroup T-Force Z540
 
9554 (9371.96min - 9554.21max) MB/s
Eurocom Raptor X17 Core i9-14900HX
Corsair MP700 Pro 2TB
9307 (5304.83min - 9307.21max) MB/s -3%
Kingston KC3000 2 TB
Kingston KC3000 2048G SKC3000D2048G
5094 (3418.23min - 5094.49max) MB/s -47%
SCHENKER XMG Pro 16 (E25)
Samsung 9100 Pro 1 TB
4147 (3521.83min - 4147.33max) MB/s -57%
Global Average -3
  (43 - 10125, n=1951)
2507 MB/s -74%
Average of class
  (43 - 10125, n=1951)
2507 MB/s -74%
AMD Ryzen 7 7800X3D
Corsair MP600
1805 (559.8min - 1804.81max) MB/s -81%
seq q8 t1 read
Kingston Fury Renegade G5 4 TB
Kingston Fury Renegade G5
14590 (12770min - 14590.3max) MB/s +18%
SCHENKER XMG Pro 16 (E25)
Samsung 9100 Pro 1 TB
12505 (9384.86min - 12505.3max) MB/s +1%
TeamGroup T-Force Z540
 
12345 (11208.8min - 12344.5max) MB/s
Eurocom Raptor X17 Core i9-14900HX
Corsair MP700 Pro 2TB
12029 (6621.31min - 12029.1max) MB/s -3%
Kingston KC3000 2 TB
Kingston KC3000 2048G SKC3000D2048G
7125 (6471.6min - 7125.49max) MB/s -42%
AMD Ryzen 7 7800X3D
Corsair MP600
4985 (3750.97min - 4984.83max) MB/s -60%
Global Average -3
  (114.5 - 16089, n=1951)
4211 MB/s -66%
Average of class
  (114.5 - 16089, n=1951)
4211 MB/s -66%
seq q8 t1 write
Kingston Fury Renegade G5 4 TB
Kingston Fury Renegade G5
14206 (13728min - 14205.9max) MB/s +18%
TeamGroup T-Force Z540
 
12006 (11685.5min - 12006.2max) MB/s
Eurocom Raptor X17 Core i9-14900HX
Corsair MP700 Pro 2TB
11581 (11375.7min - 11581max) MB/s -4%
SCHENKER XMG Pro 16 (E25)
Samsung 9100 Pro 1 TB
7451 (4926min - 7450.54max) MB/s -38%
Kingston KC3000 2 TB
Kingston KC3000 2048G SKC3000D2048G
6507 (3381.66min - 6507.24max) MB/s -46%
Global Average -3
  (46.7 - 14571, n=1951)
3199 MB/s -73%
Average of class
  (46.7 - 14571, n=1951)
3199 MB/s -73%
AMD Ryzen 7 7800X3D
Corsair MP600
1774 (801.95min - 1773.98max) MB/s -85%
4k q1 t1 read
Eurocom Raptor X17 Core i9-14900HX
Corsair MP700 Pro 2TB
95.9 (94.45min - 95.94max) MB/s +5%
TeamGroup T-Force Z540
 
91.1 (89.98min - 91.06max) MB/s
Kingston Fury Renegade G5 4 TB
Kingston Fury Renegade G5
89.4 (88.85min - 89.35max) MB/s -2%
SCHENKER XMG Pro 16 (E25)
Samsung 9100 Pro 1 TB
77.6 (25.64min - 77.6max) MB/s -15%
Kingston KC3000 2 TB
Kingston KC3000 2048G SKC3000D2048G
69.4 (68.77min - 69.4max) MB/s -24%
Global Average -3
  (0.67 - 361, n=1951)
58.8 MB/s -35%
Average of class
  (0.67 - 361, n=1951)
58.8 MB/s -35%
AMD Ryzen 7 7800X3D
Corsair MP600
42.6 (38min - 42.59max) MB/s -53%
4k q1 t1 write
Eurocom Raptor X17 Core i9-14900HX
Corsair MP700 Pro 2TB
397 (385.91min - 396.86max) MB/s +47%
AMD Ryzen 7 7800X3D
Corsair MP600
341 (235.85min - 340.94max) MB/s +26%
TeamGroup T-Force Z540
 
270 (256.05min - 269.56max) MB/s
Kingston Fury Renegade G5 4 TB
Kingston Fury Renegade G5
256 (251min - 256.11max) MB/s -5%
Kingston KC3000 2 TB
Kingston KC3000 2048G SKC3000D2048G
247 (243.12min - 246.98max) MB/s -9%
Global Average -3
  (1.23 - 435, n=1950)
167 MB/s -38%
Average of class
  (1.23 - 435, n=1950)
167 MB/s -38%
SCHENKER XMG Pro 16 (E25)
Samsung 9100 Pro 1 TB
156.5 (155.62min - 156.47max) MB/s -42%
4k q32 t16 read
Kingston Fury Renegade G5 4 TB
Kingston Fury Renegade G5
8156 (8047.93min - 8156.46max) MB/s +15%
TeamGroup T-Force Z540
 
7120 (7096.55min - 7120.08max) MB/s
Eurocom Raptor X17 Core i9-14900HX
Corsair MP700 Pro 2TB
6172 (6083.33min - 6171.85max) MB/s -13%
Kingston KC3000 2 TB
Kingston KC3000 2048G SKC3000D2048G
4242 (4201.86min - 4241.55max) MB/s -40%
AMD Ryzen 7 7800X3D
Corsair MP600
1757 (1433.31min - 1757.34max) MB/s -75%
Global Average -3
  (1.03 - 8156, n=1950)
1449 MB/s -80%
Average of class
  (1.03 - 8156, n=1950)
1449 MB/s -80%
SCHENKER XMG Pro 16 (E25)
Samsung 9100 Pro 1 TB
979 (909.81min - 979max) MB/s -86%
4k q32 t16 write
Kingston KC3000 2 TB
Kingston KC3000 2048G SKC3000D2048G
6280 (3941.51min - 6280.29max) MB/s +43%
Kingston Fury Renegade G5 4 TB
Kingston Fury Renegade G5
4911 (4872.22min - 4911max) MB/s +11%
Eurocom Raptor X17 Core i9-14900HX
Corsair MP700 Pro 2TB
4485 (4443.23min - 4484.95max) MB/s +2%
TeamGroup T-Force Z540
 
4405 (4267.73min - 4405.25max) MB/s
AMD Ryzen 7 7800X3D
Corsair MP600
1647 (552.25min - 1646.66max) MB/s -63%
Global Average -3
  (1.5 - 6280, n=1950)
1234 MB/s -72%
Average of class
  (1.5 - 6280, n=1950)
1234 MB/s -72%
SCHENKER XMG Pro 16 (E25)
Samsung 9100 Pro 1 TB
563 (543.32min - 563.01max) MB/s -87%
AS SSD
Score Total
Kingston Fury Renegade G5 4 TB
Kingston Fury Renegade G5
16295 Points +30%
Eurocom Raptor X17 Core i9-14900HX
Corsair MP700 Pro 2TB
13854 Points +11%
TeamGroup T-Force Z540
 
12534 Points
Kingston KC3000 2 TB
Kingston KC3000 2048G SKC3000D2048G
11741 Points -6%
SCHENKER XMG Pro 16 (E25)
Samsung 9100 Pro 1 TB
8609 Points -31%
AMD Ryzen 7 7800X3D
Corsair MP600
4931 Points -61%
Global Average -3
  (19 - 16295, n=3614)
3040 Points -76%
Average of class
  (19 - 16295, n=3614)
3040 Points -76%
Score Read
Kingston Fury Renegade G5 4 TB
Kingston Fury Renegade G5
6261 Points +43%
TeamGroup T-Force Z540
 
4376 Points
Eurocom Raptor X17 Core i9-14900HX
Corsair MP700 Pro 2TB
4345 Points -1%
Kingston KC3000 2 TB
Kingston KC3000 2048G SKC3000D2048G
4266 Points -3%
SCHENKER XMG Pro 16 (E25)
Samsung 9100 Pro 1 TB
1964 Points -55%
Global Average -3
  (6 - 6261, n=3615)
1153 Points -74%
Average of class
  (6 - 6261, n=3615)
1153 Points -74%
AMD Ryzen 7 7800X3D
Corsair MP600
980 Points -78%
Score Write
Eurocom Raptor X17 Core i9-14900HX
Corsair MP700 Pro 2TB
7208 Points +22%
Kingston Fury Renegade G5 4 TB
Kingston Fury Renegade G5
6844 Points +16%
TeamGroup T-Force Z540
 
5906 Points
SCHENKER XMG Pro 16 (E25)
Samsung 9100 Pro 1 TB
5809 Points -2%
Kingston KC3000 2 TB
Kingston KC3000 2048G SKC3000D2048G
5303 Points -10%
AMD Ryzen 7 7800X3D
Corsair MP600
3403 Points -42%
Global Average -3
  (4 - 7208, n=3615)
1329 Points -77%
Average of class
  (4 - 7208, n=3615)
1329 Points -77%
Seq Read
Kingston Fury Renegade G5 4 TB
Kingston Fury Renegade G5
10753 MB/s +20%
SCHENKER XMG Pro 16 (E25)
Samsung 9100 Pro 1 TB
9199 MB/s +2%
TeamGroup T-Force Z540
 
8998 MB/s
Eurocom Raptor X17 Core i9-14900HX
Corsair MP700 Pro 2TB
7812.91 MB/s -13%
Kingston KC3000 2 TB
Kingston KC3000 2048G SKC3000D2048G
5738 MB/s -36%
AMD Ryzen 7 7800X3D
Corsair MP600
3370.3 MB/s -63%
Global Average -3
  (193.2 - 12763, n=3832)
2110 MB/s -77%
Average of class
  (193.2 - 12763, n=3832)
2110 MB/s -77%
Seq Write
Kingston Fury Renegade G5 4 TB
Kingston Fury Renegade G5
10950 MB/s +16%
Eurocom Raptor X17 Core i9-14900HX
Corsair MP700 Pro 2TB
9485.67 MB/s 0%
TeamGroup T-Force Z540
 
9456 MB/s
SCHENKER XMG Pro 16 (E25)
Samsung 9100 Pro 1 TB
5793 MB/s -39%
Kingston KC3000 2 TB
Kingston KC3000 2048G SKC3000D2048G
5664 MB/s -40%
AMD Ryzen 7 7800X3D
Corsair MP600
3950.72 MB/s -58%
Global Average -3
  (52.2 - 11316, n=3835)
1435 MB/s -85%
Average of class
  (52.2 - 11316, n=3835)
1435 MB/s -85%
4K Read
Kingston Fury Renegade G5 4 TB
Kingston Fury Renegade G5
99.5 MB/s +21%
Eurocom Raptor X17 Core i9-14900HX
Corsair MP700 Pro 2TB
89.1 MB/s +9%
Kingston KC3000 2 TB
Kingston KC3000 2048G SKC3000D2048G
84.6 MB/s +3%
TeamGroup T-Force Z540
 
81.9 MB/s
AMD Ryzen 7 7800X3D
Corsair MP600
57.25 MB/s -30%
SCHENKER XMG Pro 16 (E25)
Samsung 9100 Pro 1 TB
49.2 MB/s -40%
Global Average -3
  (6.08 - 314, n=3824)
43.3 MB/s -47%
Average of class
  (6.08 - 314, n=3824)
43.3 MB/s -47%
4K Write
Eurocom Raptor X17 Core i9-14900HX
Corsair MP700 Pro 2TB
350.79 MB/s +50%
TeamGroup T-Force Z540
 
234 MB/s
Kingston Fury Renegade G5 4 TB
Kingston Fury Renegade G5
230 MB/s -2%
Kingston KC3000 2 TB
Kingston KC3000 2048G SKC3000D2048G
227 MB/s -3%
SCHENKER XMG Pro 16 (E25)
Samsung 9100 Pro 1 TB
226 MB/s -3%
AMD Ryzen 7 7800X3D
Corsair MP600
153.8 MB/s -34%
Global Average -3
  (13.3 - 512, n=3824)
116.6 MB/s -50%
Average of class
  (13.3 - 512, n=3824)
116.6 MB/s -50%
4K-64 Read
Kingston Fury Renegade G5 4 TB
Kingston Fury Renegade G5
5086 MB/s +50%
Kingston KC3000 2 TB
Kingston KC3000 2048G SKC3000D2048G
3607 MB/s +6%
Eurocom Raptor X17 Core i9-14900HX
Corsair MP700 Pro 2TB
3474.56 MB/s +2%
TeamGroup T-Force Z540
 
3395 MB/s
SCHENKER XMG Pro 16 (E25)
Samsung 9100 Pro 1 TB
995 MB/s -71%
Global Average -3
  (13.1 - 5086, n=3823)
846 MB/s -75%
Average of class
  (13.1 - 5086, n=3823)
846 MB/s -75%
AMD Ryzen 7 7800X3D
Corsair MP600
585.92 MB/s -83%
4K-64 Write
Eurocom Raptor X17 Core i9-14900HX
Corsair MP700 Pro 2TB
5908.55 MB/s +25%
Kingston Fury Renegade G5 4 TB
Kingston Fury Renegade G5
5519 MB/s +17%
SCHENKER XMG Pro 16 (E25)
Samsung 9100 Pro 1 TB
5004 MB/s +6%
TeamGroup T-Force Z540
 
4726 MB/s
Kingston KC3000 2 TB
Kingston KC3000 2048G SKC3000D2048G
4510 MB/s -5%
AMD Ryzen 7 7800X3D
Corsair MP600
2854.41 MB/s -40%
Global Average -3
  (13.7 - 5909, n=3821)
1005 MB/s -79%
Average of class
  (13.7 - 5909, n=3821)
1005 MB/s -79%
Access Time Read
AMD Ryzen 7 7800X3D
Corsair MP600
0.869 ms * -5012%
Global Average -3
  (0.012 - 33, n=3754)
0.594 ms * -3394%
Average of class
  (0.012 - 33, n=3754)
0.594 ms * -3394%
Kingston KC3000 2 TB
Kingston KC3000 2048G SKC3000D2048G
0.09 ms * -429%
Eurocom Raptor X17 Core i9-14900HX
Corsair MP700 Pro 2TB
0.02 ms * -18%
SCHENKER XMG Pro 16 (E25)
Samsung 9100 Pro 1 TB
0.018 ms * -6%
TeamGroup T-Force Z540
 
0.017 ms *
Kingston Fury Renegade G5 4 TB
Kingston Fury Renegade G5
0.015 ms * +12%
Access Time Write
Global Average -3
  (0.011 - 60.7, n=3797)
0.508 ms * -1273%
Average of class
  (0.011 - 60.7, n=3797)
0.508 ms * -1273%
Eurocom Raptor X17 Core i9-14900HX
Corsair MP700 Pro 2TB
0.1 ms * -170%
TeamGroup T-Force Z540
 
0.037 ms *
Kingston KC3000 2 TB
Kingston KC3000 2048G SKC3000D2048G
0.018 ms * +51%
Kingston Fury Renegade G5 4 TB
Kingston Fury Renegade G5
0.017 ms * +54%
SCHENKER XMG Pro 16 (E25)
Samsung 9100 Pro 1 TB
0.016 ms * +57%
AMD Ryzen 7 7800X3D
Corsair MP600
0.013 ms * +65%

* ... smaller is better

Read continuous performance: DiskSpd Read Loop, Queue Depth 8

0740148022202960370044405180592066607400814088809620103601110011840125801332014060Tooltip
TeamGroup T-Force Z540  ; diskspd 2.0.17 f: Ø12325 (11063.63-12364.82)
Kingston Fury Renegade G5 4 TB Kingston Fury Renegade G5; diskspd 2.0.17 f: Ø14176 (11971.77-14726.83)
Eurocom Raptor X17 Core i9-14900HX Corsair MP700 Pro 2TB; diskspd 2.0.17 f: Ø12251 (10175.58-12345.09)
Eurocom Raptor X17 Core i9-14900HX Corsair MP700 Pro 2TB; diskspd 2.0.17 f: Ø6127 (3845.97-12312.59)
SCHENKER XMG Pro 16 (E25) Samsung 9100 Pro 1 TB; diskspd 2.0.17 f: Ø12031 (11057.44-12746.79)
AMD Ryzen 7 7800X3D Corsair MP600: Ø4810 (3161.04-4955.15)
Kingston KC3000 2 TB Kingston KC3000 2048G SKC3000D2048G; diskspd 2.0.17 f: Ø7097 (6084.05-7125.91)

Conclusion

The TeamGroup T-Force Z540 is a very fast PCIe 5.0x4 SSD. However, you should not rely solely on the graphene cooling pad, as performance will drop significantly if it gets too hot.

Transparency

The selection of devices to be reviewed is made by our editorial team. The test sample was given to the author by the manufacturer free of charge for the purposes of review. There was no third-party influence on this review, nor did the manufacturer receive a copy of this review before publication. There was no obligation to publish this review. As an independent media company, Notebookcheck is not subjected to the authority of manufacturers, retailers or publishers.

static version load dynamic
Loading comments
Comment on this article
Please share our article, every link counts!
Mail Logo
> Expert Reviews and News on Laptops, Smartphones and Tech Innovations > Reviews > Over 12,000 MB/s and a graphene cooling pad - TeamGroup T-Force Z540 SSD for gamers and content creators reviewed
Christian Hintze, 2025-10- 4 (Update: 2025-10- 4)