

Mediatek Helio G99 vs Unisoc T7255 (T616)
Mediatek Helio G99
► remove from comparison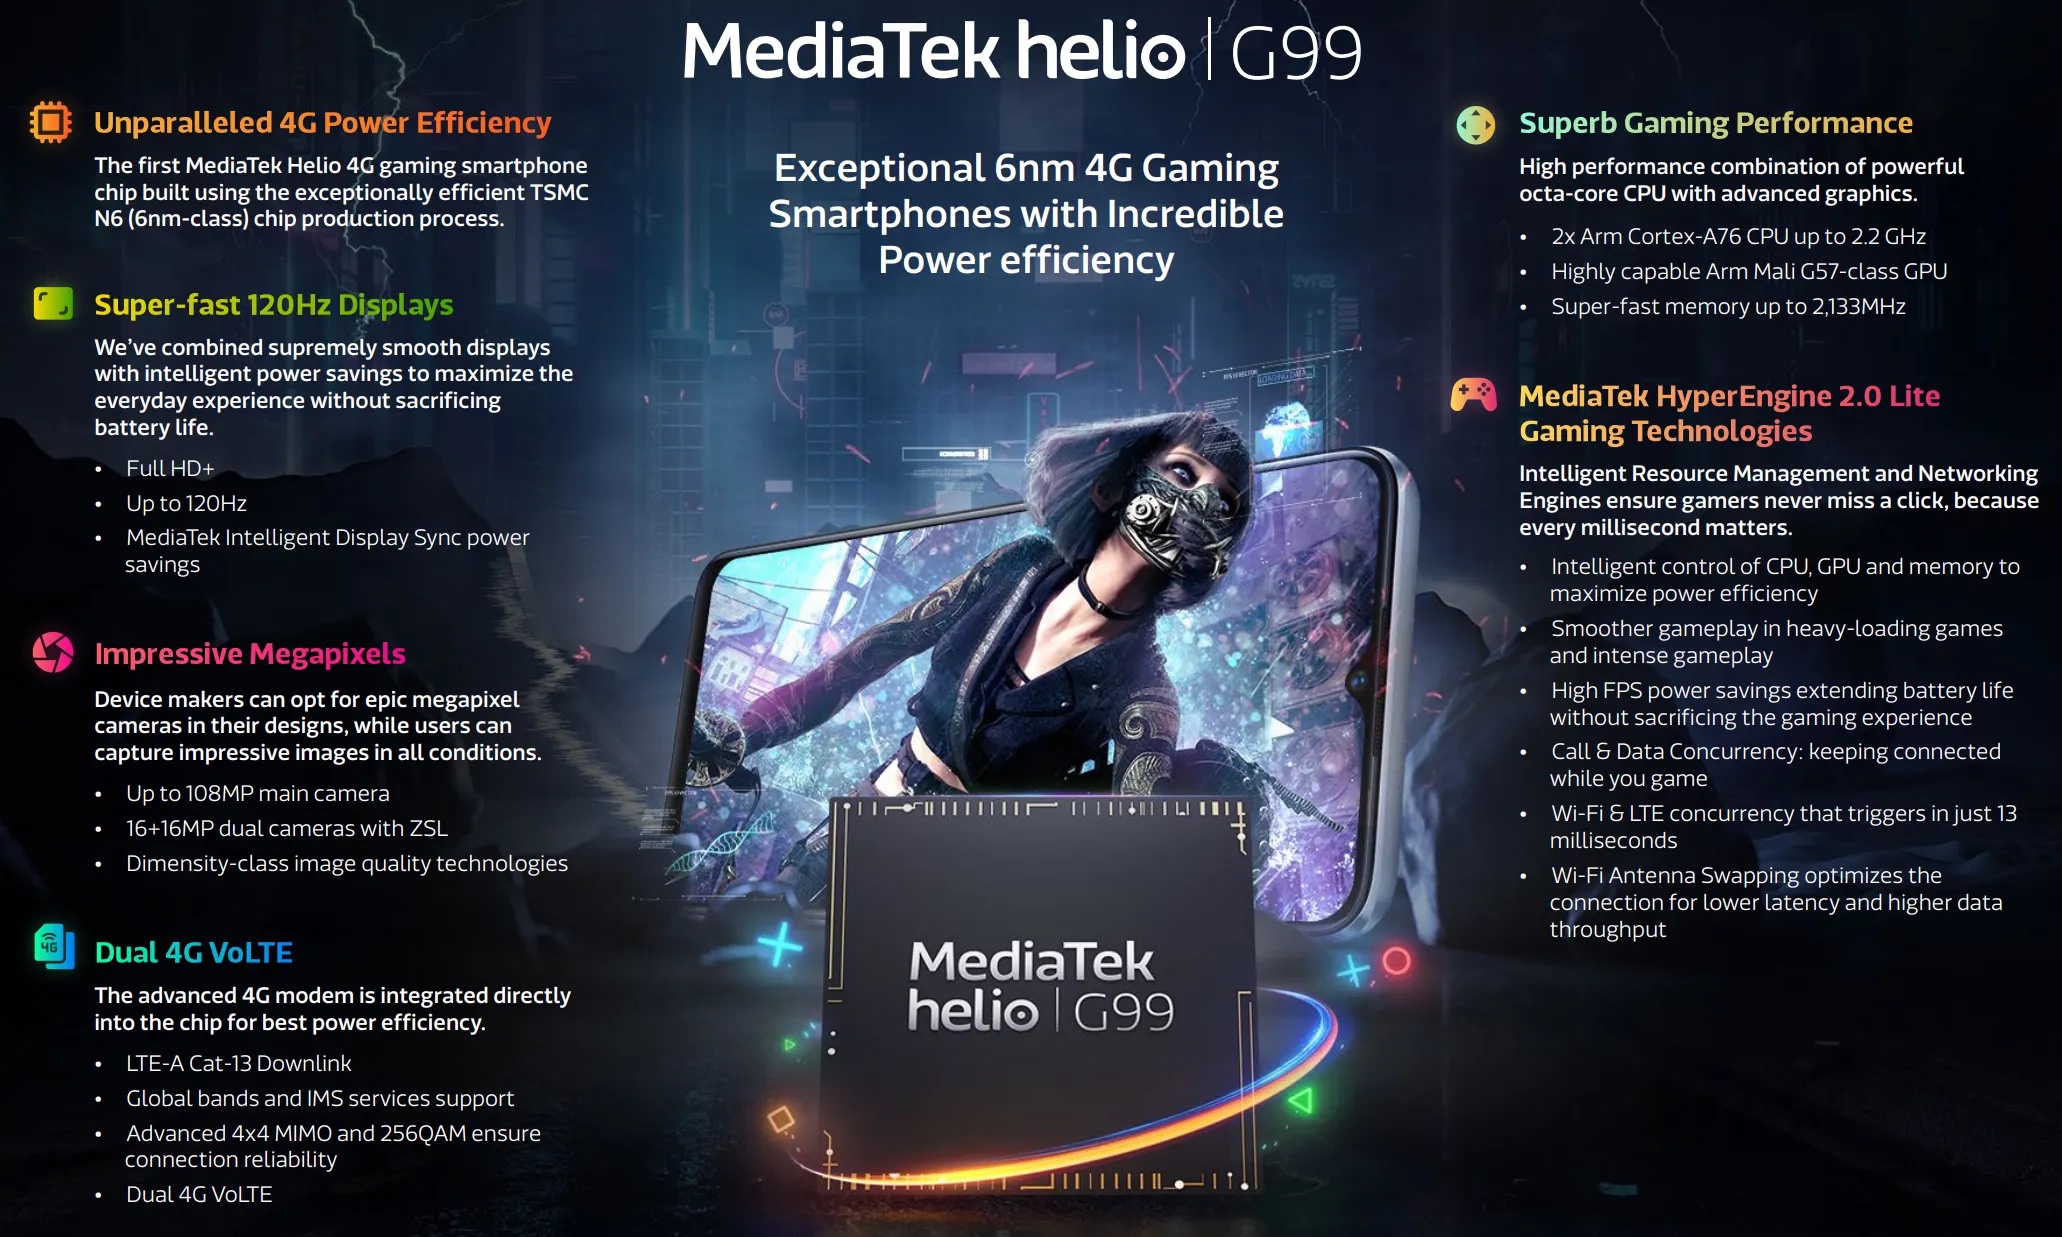
The Mediatek Helio G99 is a mainstream ARM SoC for smartphones (mainly Android based) that was introduced in 2022. It is manufactured in a 6 nm FinFET process and is equipped with 2x big ARM Cortex-A76 cores with up to 2.2 GHz and 6x small and power efficient ARM Cortex-A55 cores (max. 2 GHz) in two clusters (bigLITTLE). The chip integrates an ARM Mali-G57 MC2 (two cores). Compared to the older Helio G96, the G99 is manufactured in the more recent 6nm process and clocks higher.
Furthermore, the integrated LTE / 4G modem supports Cat-13 download speeds. Wi-Fi 5 is also integrated (a/b/g/n/ac). The memory controller supportsLPDDR4x with up to 4,266 Mbps.
Unisoc T7255 (T616)
► remove from comparison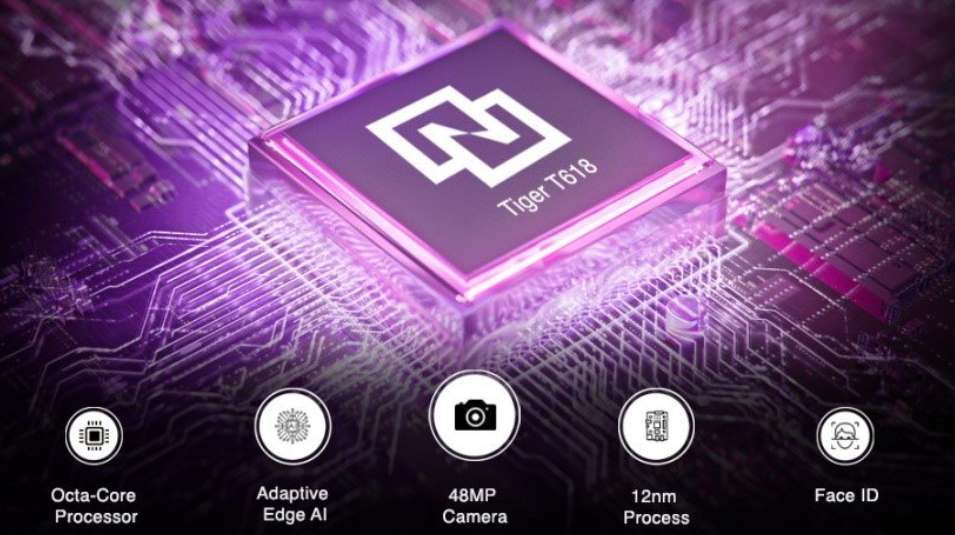
The Unisoc T7255 (formerly Unisoc T616) is an entry level octa core SoC with two fast ARM Cortex A75 cores at up to 2 GHz and six power efficient ARM Cortex A55 cores at up to 1.8 GHz. The SoC further includes an LTE modem (TDD-LTE, FDD-LTE, TDSCDMA, WCDMA, CDMA, GSM), an LPDDR4x-1866 memory controller and an ARM Mali G57 MP1 GPU (750 MHz max) and a dual core ISP (24 and 8 MPixel support). The chip is manufactured by TSMC on a 12nm FinFET process.
| Model | Mediatek Helio G99 | Unisoc T7255 (T616) | ||||||||||||||||||||
| Codename | Cortex-A76 / A55 | Cortex-A75 / A55 | ||||||||||||||||||||
| Series | Mediatek Mediatek Helio G | |||||||||||||||||||||
| Series: Mediatek Helio G Cortex-A76 / A55 |
| |||||||||||||||||||||
| Clock | 2000 - 2200 MHz | 1800 - 2000 MHz | ||||||||||||||||||||
| Cores / Threads | 8 / 8 2 x 2.2 GHz ARM Cortex-A76 6 x 2.0 GHz ARM Cortex-A55 | 8 / 8 2 x 2.0 GHz ARM Cortex-A75 6 x 1.8 GHz ARM Cortex-A55 | ||||||||||||||||||||
| Technology | 6 nm | 12 nm | ||||||||||||||||||||
| Features | 2x Cortex-A76, 6x Cortex-A55, 4G LTE Cat-12/13, 64MP AI-Camera support, LPDDR3/LPDDR4x-2133, eMMC 5.1, UFS 2.1, Beidou, Galileo, Glonass, GPS, Wi-Fi 5 (a/b/g/n/ac), AI Accelerator up to 1 TMACs, H.264 / H.265 / HEVC video encoding (4k30) | ARM Mali G57 MP1, Vivimagic 5.0 Tri-Core-ISP, LTE / 4G Modem, VDSP | ||||||||||||||||||||
| iGPU | ARM Mali-G57 MP2 | ARM Mali-G57 MP1 (750 MHz) | ||||||||||||||||||||
| Architecture | ARM | ARM | ||||||||||||||||||||
| Announced | ||||||||||||||||||||||
| Manufacturer | www.mediatek.com | |||||||||||||||||||||
| L3 Cache | 1 MB |

Benchmarks

Average Benchmarks Mediatek Helio G99 → 100% n=27
Average Benchmarks Unisoc T7255 (T616) → 68% n=27
* Smaller numbers mean a higher performance
1 This benchmark is not used for the average calculation