Notebookcheck Logo

Mediatek Helio G99 vs UNISOC T616 vs Mediatek Helio G95

Mediatek Helio G99

► remove from comparison Mediatek Helio G99

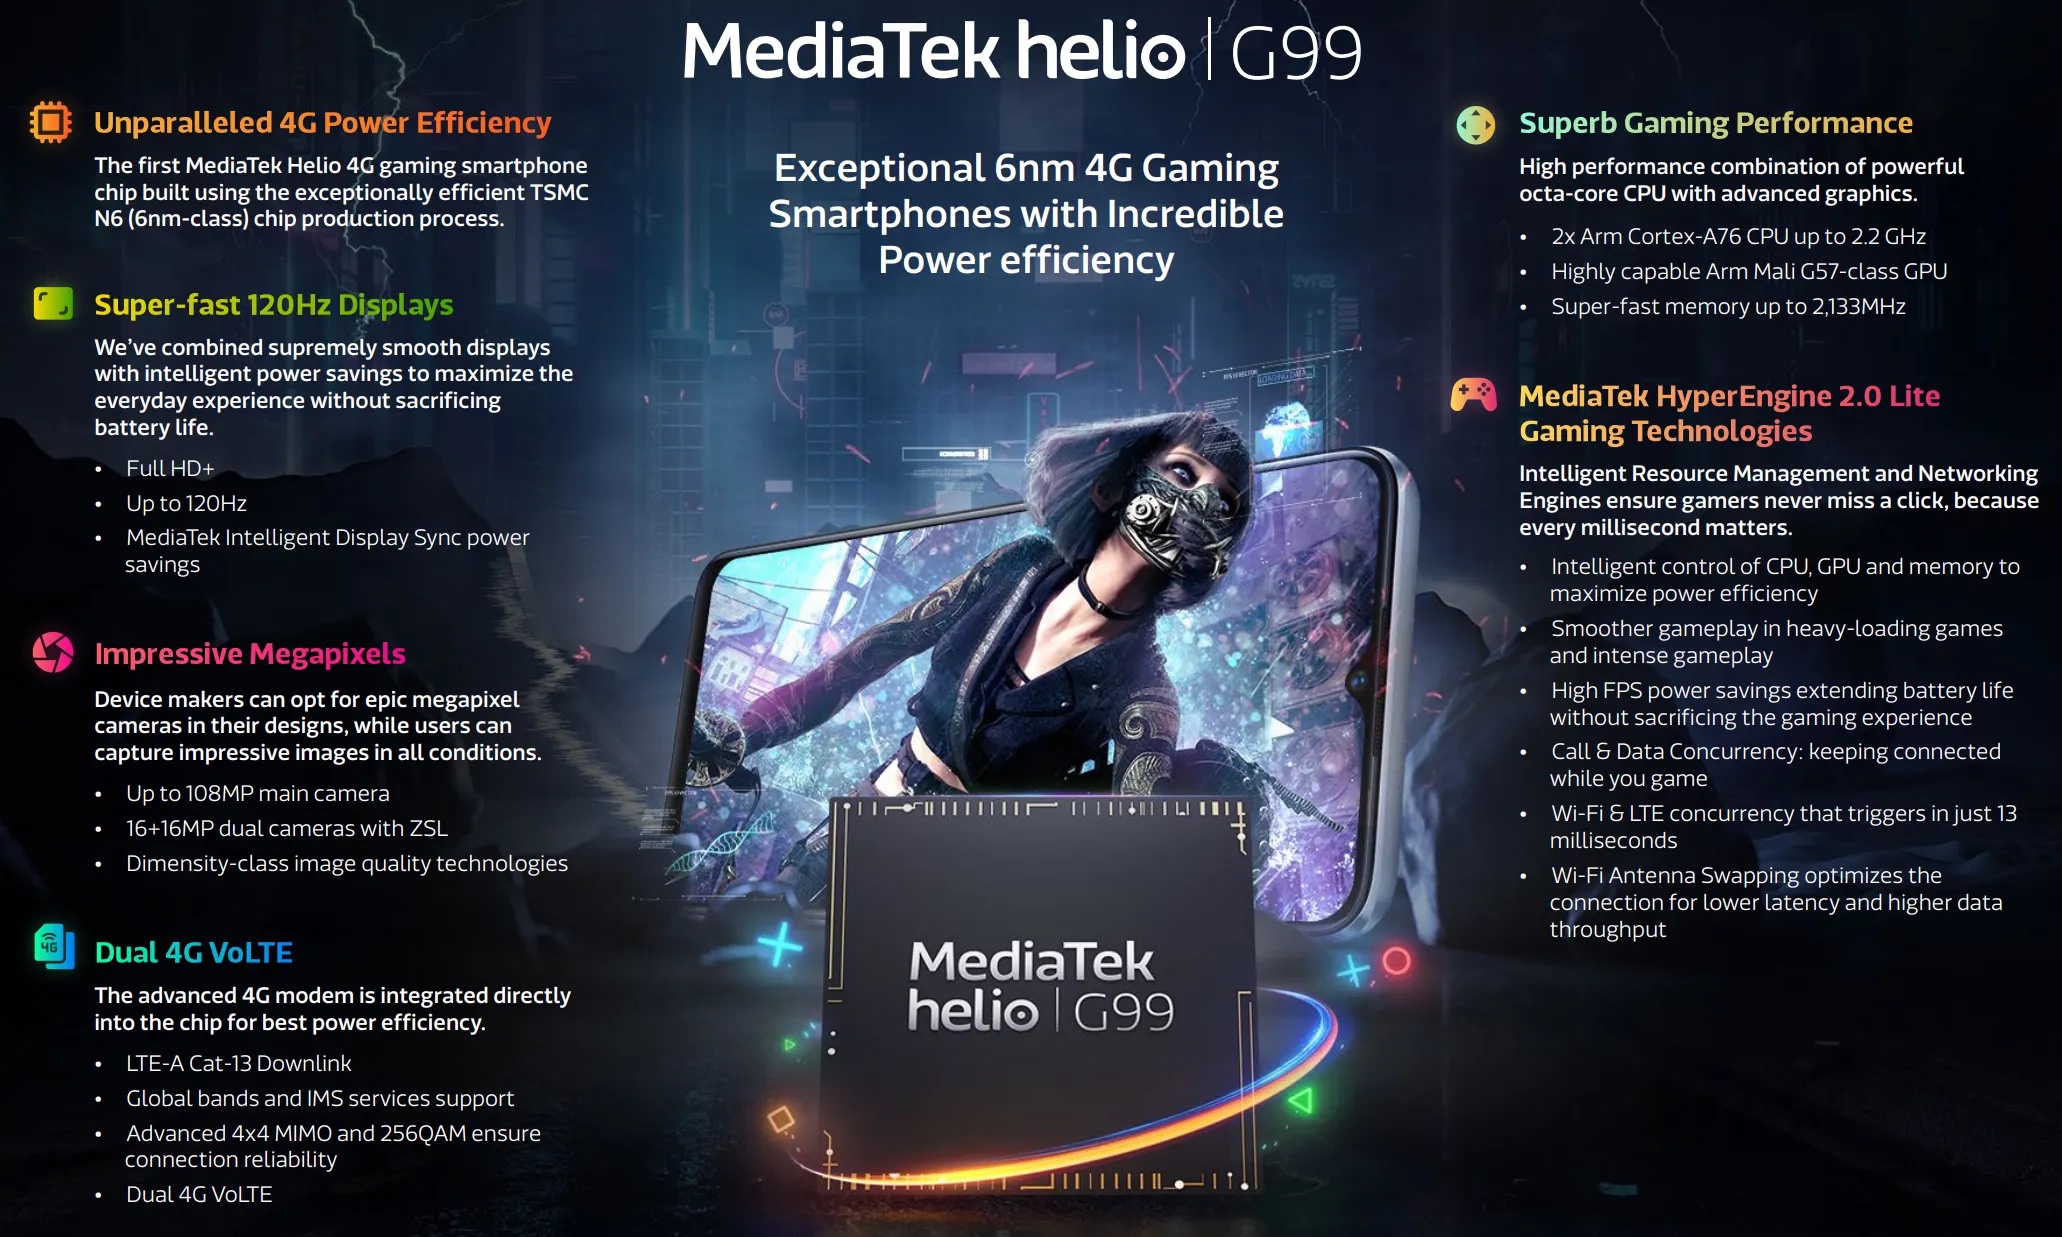
The Mediatek Helio G99 is a mainstream ARM SoC for smartphones (mainly Android based) that was introduced in 2022. It is manufactured in a 6 nm FinFET process and is equipped with 2x big ARM Cortex-A76 cores with up to 2.2 GHz and 6x small and power efficient ARM Cortex-A55 cores (max. 2 GHz) in two clusters (bigLITTLE). The chip integrates an ARM Mali-G57 MC2 (two cores). Compared to the older Helio G96, the G99 is manufactured in the more recent 6nm process and clocks higher.

Furthermore, the integrated LTE / 4G modem supports Cat-13 download speeds. Wi-Fi 5 is also integrated (a/b/g/n/ac). The memory controller supportsLPDDR4x with up to 4,266 Mbps.

UNISOC T616

► remove from comparison  T616

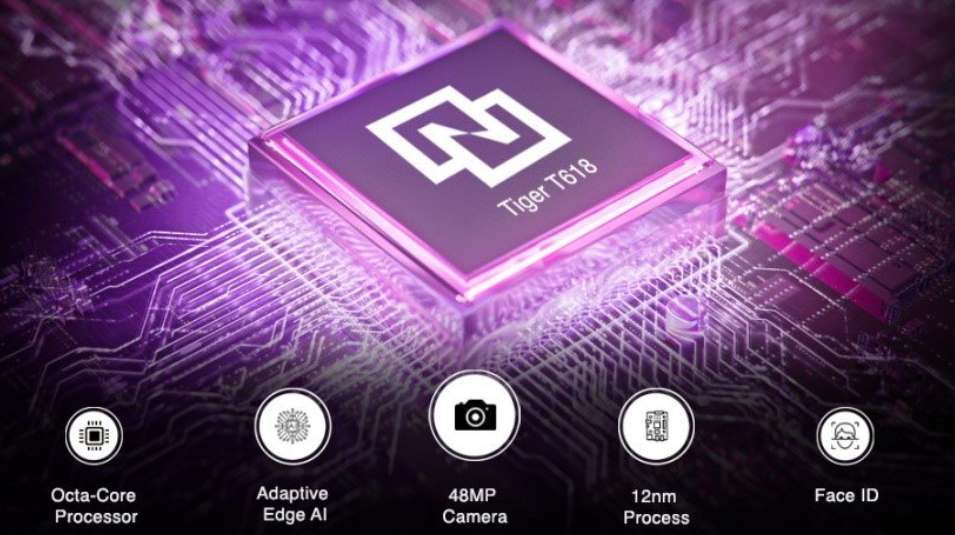
The Unisoc Tiger T616 (former Spreadtrum) is an entry level octa core SoC with two fast ARM Cortex A75 cores at up to 2 GHz and six power efficient ARM Cortex A55 cores at up to 1.8 GHz. The SoC furthermore includes an LTE modem (TDD-LTE, FDD-LTE, TDSCDMA, WCDMA, CDMA, GSM), a LPDDR4x 1866 MHz memory controller and an ARM Mali G57MP1 GPU (750 MHz max) and a dual core ISP (24 and 8 MPixel support). The chip is manufactured at TSMC in 12nm FinFET. 

Mediatek Helio G95

► remove from comparison Mediatek Helio G95

The Mediatek Helio G95 is an upper mainstream ARM SoC for smartphones (mainly Android based) that was introduced in 2020. It is manufactured in a 12 nm FinFET process and is equipped with 2x big ARM Cortex-A76 cores with up to 2.05 GHz and 6x small and power efficient ARM Cortex-A55 cores (max. 2 GHz) in two clusters (bigLITTLE). The chip also integrates a ARM Mali-G76 3EEMC4 (should be a MP4 - four cluster variant) clocked at 900 MHz. Compared to the similar Helio G90T, the difference is the 100 MHz higher clocked graphics card.

Furthermore, the integrated LTE modem supports Cat-12 600 Mbps download and Cat-13 150 Mbps upload speeds. Wi-Fi 5 is also integrated (a/b/g/n/ac). The memory controller supports LPDDR3 and LPDDR4x with up to 2,133 MHz with up to 10 GB capacity.

ModelMediatek Helio G99UNISOC T616Mediatek Helio G95
SeriesMediatek Mediatek Mediatek Mediatek
CodenameCortex-A76 / A55Cortex-A75 / A55Cortex-A76 / A55
Series: Mediatek Cortex-A76 / A55
Mediatek Helio G99 « 2 - 2.2 GHz8 / 8 cores Cortex-A76 / A55
Mediatek Helio G962 - 2.05 GHz8 / 8 cores Cortex-A76 / A55
Mediatek Helio G952 - 2.05 GHz8 / 8 cores Cortex-A76 / A55
Mediatek Helio G90T2.05 GHz8 / 8 cores Cortex-A76 / A55
UNISOC T6191.8 - 2.2 GHz8 / 8 cores1 MB L3 Cortex-A75 / A55
UNISOC T6182 - 2 GHz8 / 8 cores1 MB L3 Cortex-A75 / A55
UNISOC T616 « 1.8 - 2 GHz8 / 8 cores1 MB L3 Cortex-A75 / A55
UNISOC T6121.8 - 2 GHz8 / 8 cores1 MB L3 Cortex-A75 / A55
UNISOC T6101.8 - 2 GHz8 / 8 cores1 MB L3 Cortex-A75 / A55
UNISOC T6061.6 GHz8 / 8 cores1 MB L3 Cortex-A75 / A55
UNISOC Tangula T7001.8 - 1.8 GHz8 / 8 cores Cortex-A75 / A55
Mediatek Helio G992 - 2.2 GHz8 / 8 cores Cortex-A76 / A55
Mediatek Helio G962 - 2.05 GHz8 / 8 cores Cortex-A76 / A55
Mediatek Helio G95 « 2 - 2.05 GHz8 / 8 cores Cortex-A76 / A55
Mediatek Helio G90T2.05 GHz8 / 8 cores Cortex-A76 / A55
Clock2000 - 2200 MHz1800 - 2000 MHz2000 - 2050 MHz
Cores / Threads8 / 88 / 88 / 8
Technology6 nm12 nm12 nm
Features2x Cortex-A76, 6x Cortex-A55, 4G LTE Cat-12/13, 64MP AI-Camera support, LPDDR3/LPDDR4x-2133, eMMC 5.1, UFS 2.1, Beidou, Galileo, Glonass, GPS, Wi-Fi 5 (a/b/g/n/ac), AI Accelerator up to 1 TMACs, H.264 / H.265 / HEVC video encoding (4k30)ARM Mali G57 MP1, Vivimagic 5.0 Tri-Core-ISP, LTE / 4G Modem, VDSP2x Cortex-A76, 6x Cortex-A55, 4G LTE Cat-12/13, 64MP AI-Camera support, LPDDR3/LPDDR4x-2133, eMMC 5.1, UFS 2.1, Beidou, Galileo, Glonass, GPS, Wi-Fi 5 (a/b/g/n/ac), AI Accelerator up to 1 TMACs, H.264 / H.265 / HEVC video encoding (4k30)
iGPUARM Mali-G57 MP2ARM Mali-G57 MP1 (750 MHz)ARM Mali-G76 MP4 ( - 900 MHz)
ArchitectureARMARMARM
Announced
Manufacturerwww.mediatek.comwww.mediatek.com
L3 Cache1 MB

Benchmarks

Performance Rating - Geekbench 5.5, PCM Work, Sling Shot Physics, Antutu v8 CPU - Helio G95
0.6 pt (46%)
3DMark - 3DMark Ice Storm Unlimited Physics
min: 17643     avg: 18931     median: 18136 (15%)     max: 21013 Points
min: 2798     avg: 2956     median: 2990 (35%)     max: 3036 Points
min: 2488     avg: 3120     median: 3213 (38%)     max: 3581 Points
3DMark - 3DMark Sling Shot (ES 3.0) Unlimited Physics
min: 3508     avg: 3634     median: 3671 (42%)     max: 3685 Points
min: 2798     avg: 2954     median: 3002 (34%)     max: 3063 Points
min: 2547     avg: 3128     median: 3286 (38%)     max: 3392 Points
59%
1 T616 +
min: 427     avg: 433.5     median: 433.5 (12%)     max: 440 Points
78%
1 T616 +
min: 1474     avg: 1556     median: 1572 (6%)     max: 1606 Points
min: 298     avg: 350.9     median: 360 (15%)     max: 380 Points
min: 506     avg: 515     median: 510.5 (22%)     max: 532 Points
min: 1184     avg: 1410     median: 1464 (3%)     max: 1502 Points
min: 1622     avg: 1684     median: 1680 (3%)     max: 1778 Points
Geekbench 5.0 - Geekbench 5.0 64 Bit Single-Core
555 Points (2%)
Geekbench 5.0 - Geekbench 5.0 64 Bit Multi-Core
1921 Points (6%)
Geekbench 4.4 - Geekbench 4.1 - 4.4 64 Bit Single-Core
min: 2512     avg: 2620     median: 2672 (27%)     max: 2675 Points
min: 1663     avg: 1734     median: 1734 (17%)     max: 1805 Points
2476 Points (25%)
Geekbench 4.4 - Geekbench 4.1 - 4.4 64 Bit Multi-Core
min: 7018     avg: 7608     median: 7896 (9%)     max: 7911 Points
min: 5131     avg: 5378     median: 5377.5 (6%)     max: 5624 Points
6436 Points (7%)
Geekbench 4.0 - Geekbench 4.0 64 Bit Single-Core
2625 Points (36%)
Geekbench 4.0 - Geekbench 4.0 64 Bit Multi-Core
min: 7492     avg: 7532     median: 7531.5 (18%)     max: 7571 Points
Geekbench 3 - Geekbench 3 64 Bit Multi-Core
min: 7124     avg: 7934     median: 7933.5 (12%)     max: 8743 Points
70%
1 T616 +
5574 Points (9%)
Geekbench 3 - Geekbench 3 64 Bit Single-Core
min: 2334     avg: 2555     median: 2555 (38%)     max: 2776 Points
68%
1 T616 +
1737 Points (26%)
Mozilla Kraken 1.1 - Kraken 1.1 Total Score *
min: 1922.1     avg: 2145     median: 2213.3 (3%)     max: 2443.7 ms
min: 2530.7     avg: 2711     median: 2650.4 (3%)     max: 3013.8 ms
min: 2673     avg: 4586     median: 3298 (4%)     max: 10797 ms
Octane V2 - Octane V2 Total Score
min: 17228     avg: 20509     median: 21308 (19%)     max: 25005 Points
min: 12141     avg: 14092     median: 14522 (13%)     max: 15304 Points
min: 4808     avg: 13050     median: 15551.5 (14%)     max: 16289 Points
WebXPRT 4 - WebXPRT 4 Score
min: 39     avg: 64.3     median: 58 (17%)     max: 81 Points
min: 45     avg: 55     median: 57.5 (17%)     max: 60 Points
40 Points (11%)
WebXPRT 3 - WebXPRT 3 Score
min: 80     avg: 91.8     median: 90 (19%)     max: 112 Points
min: 68     avg: 78     median: 80 (17%)     max: 86 Points
min: 28     avg: 48     median: 53 (11%)     max: 57 Points
AnTuTu v8 - AnTuTu v8 Total Score
100%
1 T616 +
200006 Points (19%)
min: 282417     avg: 289098     median: 289098 (28%)     max: 295778 Points
AnTuTu v8 - AnTuTu v8 UX
min: 51555     avg: 52673     median: 52673 (44%)     max: 53791 Points
AnTuTu v8 - AnTuTu v8 MEM
min: 55891     avg: 58125     median: 58125 (47%)     max: 60359 Points
AnTuTu v8 - AnTuTu v8 GPU
min: 84334     avg: 88249     median: 88249 (16%)     max: 92164 Points
AnTuTu v8 - AnTuTu v8 CPU
min: 82807     avg: 90051     median: 90050.5 (33%)     max: 97294 Points
Antutu v9 - AnTuTu v9 Total Score
min: 229468     avg: 306552     median: 314263 (19%)     max: 337968 Points
min: 228124     avg: 230591     median: 229582 (14%)     max: 235075 Points
min: 326670     avg: 328773     median: 328773 (20%)     max: 330876 Points
Antutu v9 - AnTuTu v9 CPU
min: 83150     avg: 96658     median: 98338 (27%)     max: 104027 Points
min: 67445     avg: 69296     median: 69214 (19%)     max: 71312 Points
min: 87327     avg: 93026     median: 93025.5 (25%)     max: 98724 Points
PassMark PerformanceTest Mobile V1 - PerformanceTest Mobile V1 CPU Tests
100%
1 T616 +
min: 3040     avg: 3123     median: 3122.5 (0%)     max: 3205 Points
12299 Points (2%)
PCMark for Android - PCM f. Android Storage 2.0 random write internal
min: 30.8     avg: 54.6     median: 64.4 (47%)     max: 67.7 MB/s
83%
1 T616 +
min: 52.5     avg: 53.7     median: 53.7 (39%)     max: 54.8 MB/s
PCMark for Android - PCM f. Android Storage 2.0 seq write internal
min: 253.68     avg: 524     median: 509 (16%)     max: 740 MB/s
39%
1 T616 +
min: 192.9     avg: 197     median: 197 (6%)     max: 201 MB/s
PCMark for Android - PCM f. Android Storage 2.0 random read internal
min: 18.2     avg: 33.4     median: 40.4 (50%)     max: 45.4 MB/s
47%
1 T616 +
min: 17.7     avg: 19.1     median: 19.1 (23%)     max: 20.4 MB/s
PCMark for Android - PCM f. Android Storage 2.0 seq read internal
min: 719.36     avg: 775     median: 775 (22%)     max: 819 MB/s
28%
1 T616 +
min: 199.3     avg: 213.7     median: 213.7 (6%)     max: 228 MB/s
PCMark for Android - PCM f. Android Storage 2.0 score
min: 16137     avg: 21606     median: 20453 (32%)     max: 27775 Points
min: 11341     avg: 17154     median: 13300 (21%)     max: 24988 Points
min: 12839     avg: 14556     median: 14556 (23%)     max: 16273 Points
min: 7936     avg: 8004     median: 8011 (37%)     max: 8066 Points
min: 7938     avg: 8820     median: 8484 (39%)     max: 10373 Points
PCMark for Android - PCM f. Android Work Score 2.0
min: 9797     avg: 9969     median: 9957 (65%)     max: 10153 Points
PCMark for Android - PCM f. Android Work Score
14164 Points (71%)
min: 382     avg: 388     median: 388 (15%)     max: 394 Points
278 Points (11%)
Power Consumption - Geekbench 5.5 Power Consumption 150cd *
min: 2.67     avg: 3.7     median: 3.7 (2%)     max: 5.24 Watt
99%
1 T616 +
min: 3.47     avg: 5.9     median: 5.8 (3%)     max: 8.44 Watt
min: 3.35     avg: 4.4     median: 3.7 (2%)     max: 5.96 Watt
Power Consumption - Idle Power Consumption 150cd 1min *
min: 0.84     avg: 1.3     median: 1.2 (1%)     max: 2.06 Watt
100%
1 T616 +
min: 0.91     avg: 1.2     median: 1.3 (1%)     max: 1.398 Watt
min: 0.882     avg: 1.2     median: 1 (1%)     max: 1.592 Watt

Average Benchmarks Mediatek Helio G99 → 100% n=15

Average Benchmarks UNISOC T616 → 77% n=15

Average Benchmarks Mediatek Helio G95 → 83% n=15

- Range of benchmark values for this graphics card
- Average benchmark values for this graphics card
* Smaller numbers mean a higher performance
1 This benchmark is not used for the average calculation

v1.26
log 23. 20:39:39

#0 checking url part for id 14649 +0s ... 0s

#1 checking url part for id 14016 +0s ... 0s

#2 checking url part for id 12939 +0s ... 0s

#3 not redirecting to Ajax server +0s ... 0s

#4 did not recreate cache, as it is less than 5 days old! Created at Wed, 22 May 2024 05:37:27 +0200 +0.001s ... 0.001s

#5 composed specs +0.077s ... 0.078s

#6 did output specs +0s ... 0.078s

#7 getting avg benchmarks for device 14649 +0.003s ... 0.081s

#8 got single benchmarks 14649 +0.061s ... 0.142s

#9 getting avg benchmarks for device 14016 +0.003s ... 0.145s

#10 got single benchmarks 14016 +0.021s ... 0.166s

#11 getting avg benchmarks for device 12939 +0.014s ... 0.18s

#12 got single benchmarks 12939 +0.022s ... 0.202s

#13 got avg benchmarks for devices +0s ... 0.202s

#14 min, max, avg, median took s +0.187s ... 0.389s

#15 return log +0s ... 0.389s

Please share our article, every link counts!
> Expert Reviews and News on Laptops, Smartphones and Tech Innovations > Benchmarks / Tech > Processor Comparison - Head 2 Head
Redaktion, 2017-09- 8 (Update: 2023-07- 1)