Notebookcheck Logo

Apple A15 Bionic vs MediaTek Dimensity 720 vs UNISOC T820

Apple A15 Bionic

► remove from comparison Apple A15

The Apple A15 Bionic is a System on a Chip (SoC) from Apple that is found in the iPhone 13 and iPad Mini (2021) models. It was announced late 2021 and offers 6 cores divided in 2 performance cores and four power efficiency cores. The CPU performance increases only slightly compared to the A14, but GPU (in the higher end models) offers higher gains.

The chip is manufactured in 5nm and integrates 15.8 billion transistors (compared to the 11.8 of the A14).

MediaTek Dimensity 720

► remove from comparison Mediatek Dimensity 720

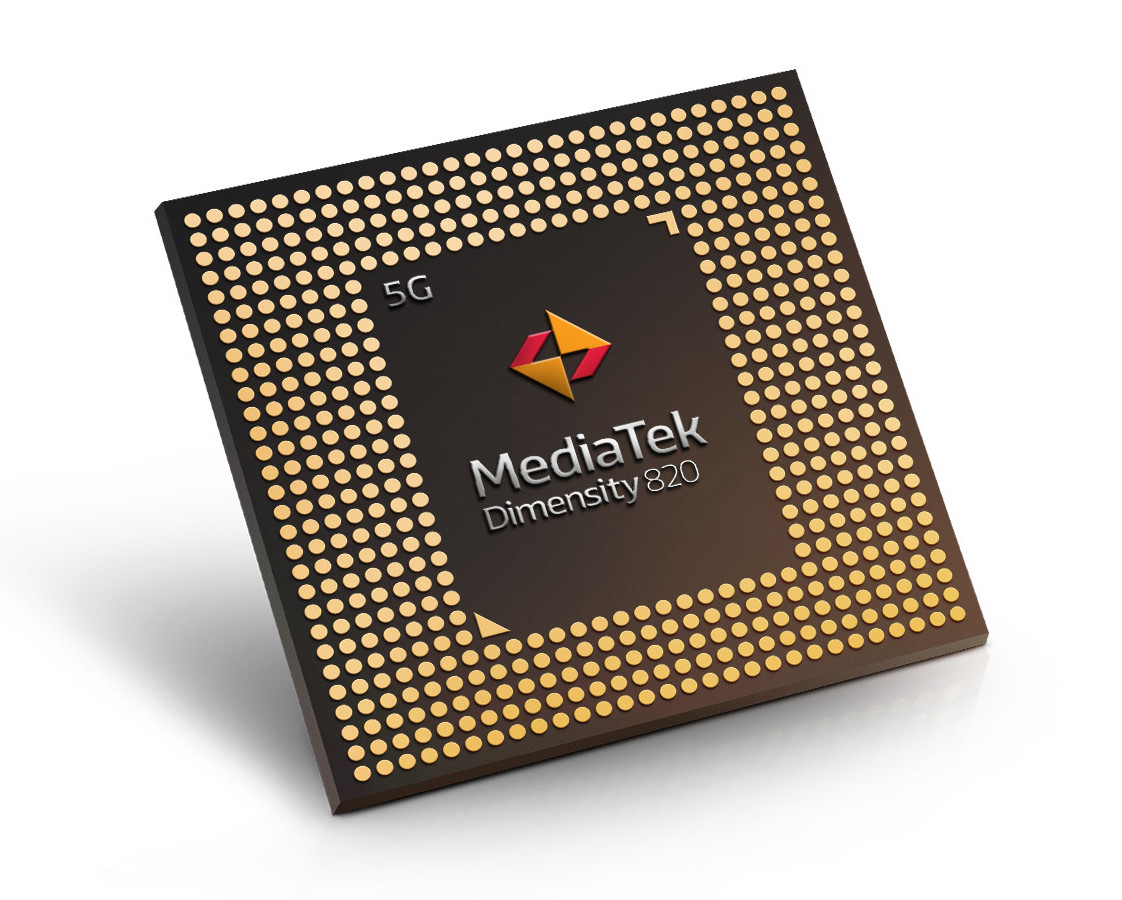
The Mediatek Dimensity 720 is a mid-range SoC with an integrated 5G modem. It includes four fast ARM Cortex-A76 cores and four power efficient Cortex-A55 cores, all clocked at up to 2 GHz (Octa-Core with Heterogeneous Multi-Processing). Furthermore, the chip integrates a 3 core ARM Mali-G57 MC3 GPU, a Wi-fi 5 modem, a LPDDR4x memory controller, a AI processing unit (APU) and video de- and encoding. Compared to the faster Dimensity 820, the CPU cores are lower clocked and the GPU offers less cores. Furthermore, all other features were slightly restricted (e.g. max. 12 GB RAM).

The Dimensity 720 is manufactured in the modern 7nm process and should be very power efficient.

UNISOC T820

► remove from comparison  Tangula T820

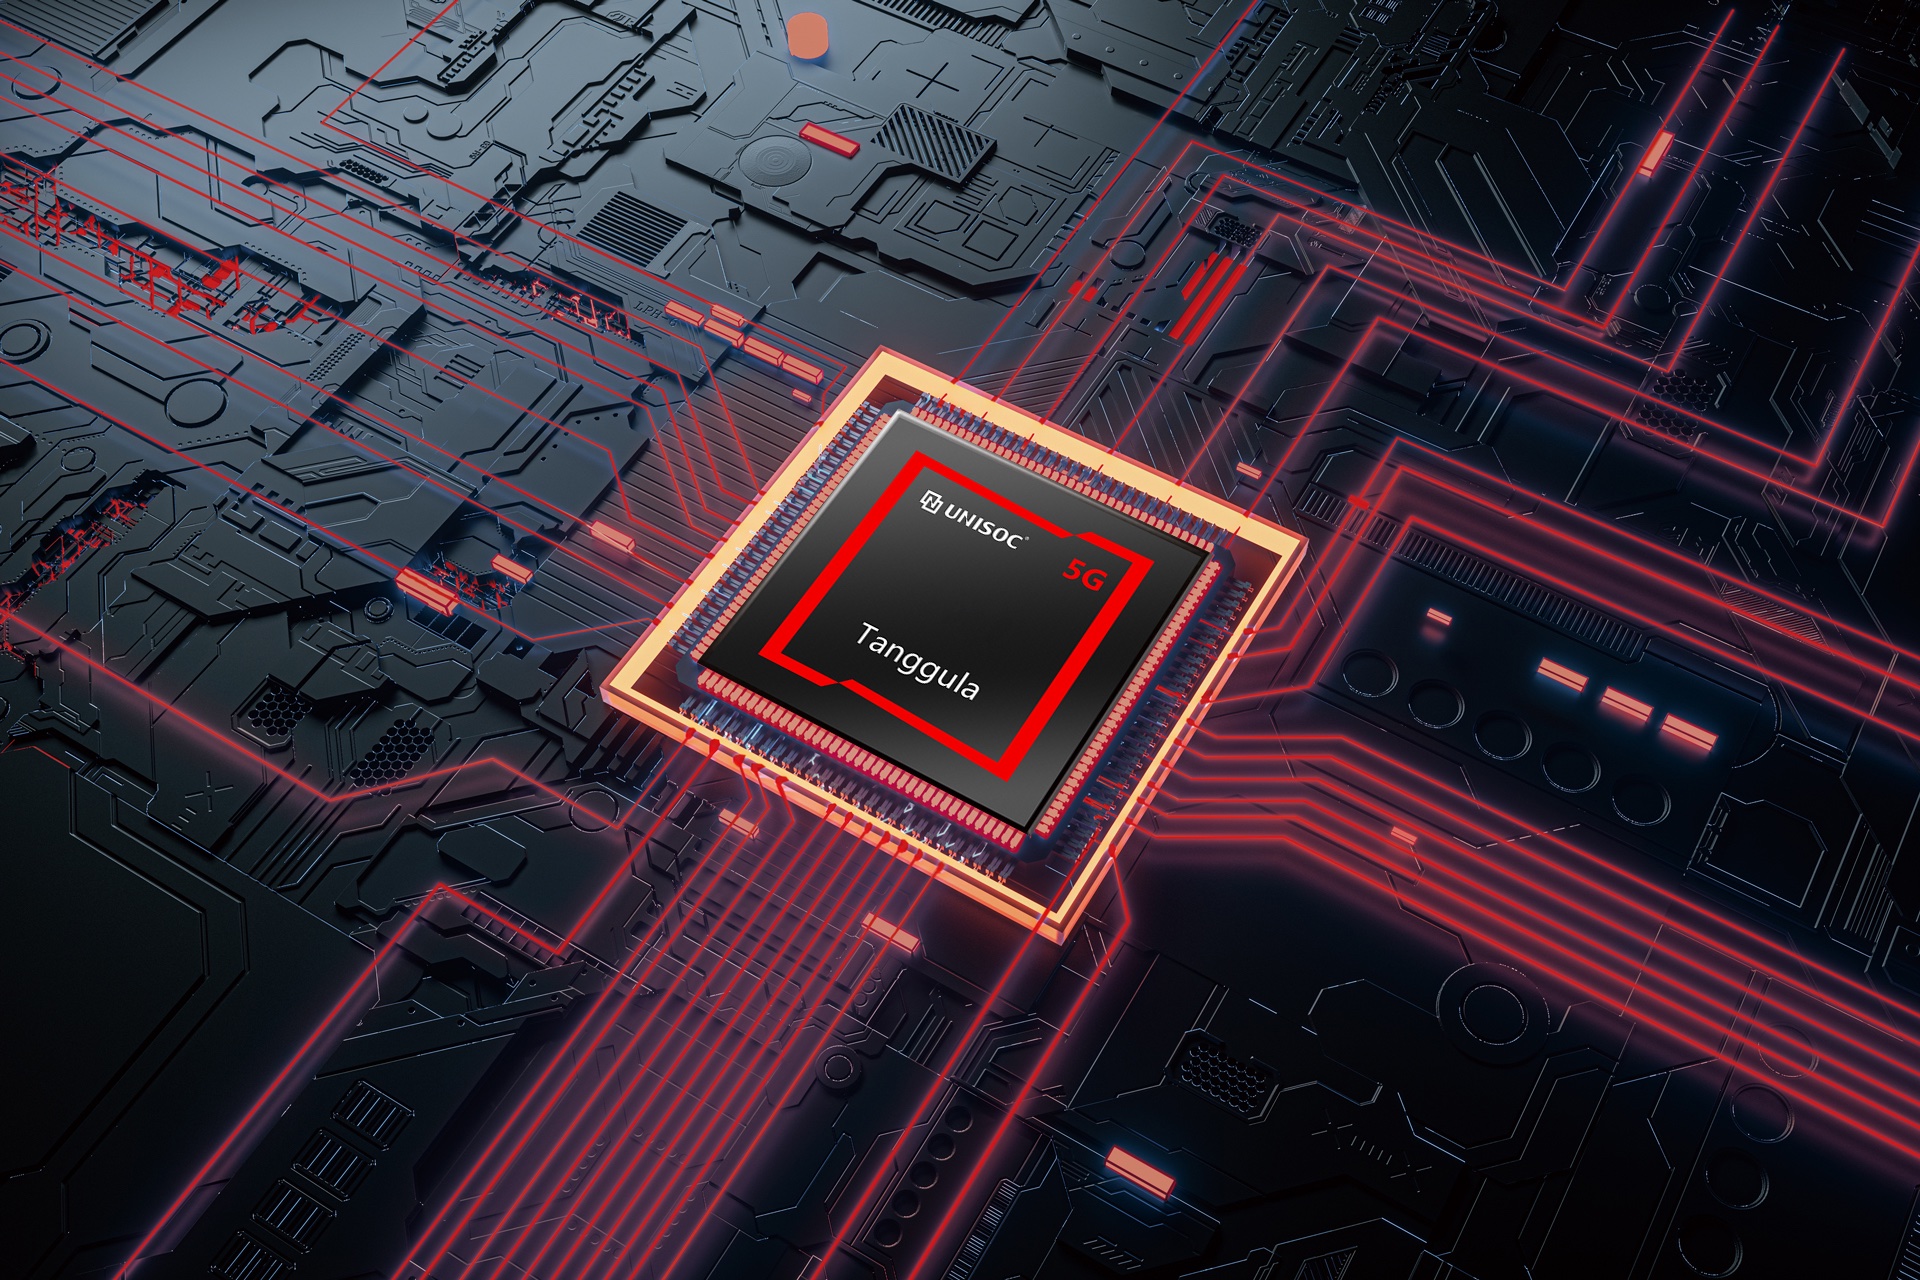
The Unisoc T820 (former Spreadtrum) is a mid range SoC for Android based smartphones and tablets. It integrates an octa-core CPU with three clusters. One fast ARM Cortex-A76 clocked at up to 2.7 GHz, three more A76 performance cores clocked at up to 2.3 GHz and a power efficiency cluster of four ARM-Cortex-A55 cores with up to 2.1 GHz. The integrated memory controller supports LPDDR4/4X with up to 2133 MHz (2x 16 Bit). The integrated ISP supports two main cameras and two subsidiary cameras (up to 108 MPix). The integrated graphics card is an ARM Mali-G57 MC4 (4 cores) at up to 850 MHz. Unisoc also specifies that the T820 offers hardware AI acceleration with up to 8.0 TOPS peak performance of the NPU.

The chip is manufactured in the modern 6nm EUV process.

ModelApple A15 BionicMediaTek Dimensity 720UNISOC T820
SeriesApple Apple A-SeriesMediatek
Series: Cortex-A76 / A55
Apple A15 Bionic « 2.02 - 3.23 GHz6 / 6 cores32 MB L3
Apple A12 Bionic - 2.49 GHz6 / 6 cores
MediaTek Dimensity 8202 - 2.6 GHz8 / 8 cores Cortex-A76 / A55
MediaTek Dimensity 8102 - 2.4 GHz8 / 8 cores Cortex-A76 / A55
MediaTek Dimensity 8002 GHz8 / 8 cores Cortex-A76 / A55
MediaTek Dimensity 800U2 - 2.4 GHz8 / 8 cores Cortex-A76 / A55
MediaTek Dimensity 6100+2 - 2.2 GHz8 / 8 cores Cortex-A76 / A55
MediaTek Dimensity 60802 - 2.4 GHz8 / 8 cores Cortex-A76 / A55
MediaTek Dimensity 60202 - 2.2 GHz8 / 8 cores Cortex-A76 / A55
UNISOC T8202.1 - 2.7 GHz8 / 8 cores Cortex-A76 / A55
UNISOC Tangula T7702 - 2.5 GHz8 / 8 cores Cortex-A76 / A55
UNISOC Tangula T7602 - 2 GHz8 / 8 cores3 MB L3 Cortex-A76 / A55
MediaTek Dimensity 7002 - 2.2 GHz8 / 8 cores Cortex-A76 / A55
UNISOC T7652.1 - 2.3 GHz8 / 8 cores Cortex-A76 / A55
MediaTek Dimensity 720 « 2 GHz8 / 8 cores Cortex-A76 / A55
UNISOC T7501.8 - 2 GHz8 / 8 cores3 MB L3 Cortex-A76 / A55
MediaTek Dimensity 8202 - 2.6 GHz8 / 8 cores Cortex-A76 / A55
MediaTek Dimensity 8102 - 2.4 GHz8 / 8 cores Cortex-A76 / A55
MediaTek Dimensity 8002 GHz8 / 8 cores Cortex-A76 / A55
MediaTek Dimensity 800U2 - 2.4 GHz8 / 8 cores Cortex-A76 / A55
MediaTek Dimensity 6100+2 - 2.2 GHz8 / 8 cores Cortex-A76 / A55
MediaTek Dimensity 60802 - 2.4 GHz8 / 8 cores Cortex-A76 / A55
MediaTek Dimensity 60202 - 2.2 GHz8 / 8 cores Cortex-A76 / A55
UNISOC T820 « 2.1 - 2.7 GHz8 / 8 cores Cortex-A76 / A55
UNISOC Tangula T7702 - 2.5 GHz8 / 8 cores Cortex-A76 / A55
UNISOC Tangula T7602 - 2 GHz8 / 8 cores3 MB L3 Cortex-A76 / A55
MediaTek Dimensity 7002 - 2.2 GHz8 / 8 cores Cortex-A76 / A55
UNISOC T7652.1 - 2.3 GHz8 / 8 cores Cortex-A76 / A55
MediaTek Dimensity 7202 GHz8 / 8 cores Cortex-A76 / A55
UNISOC T7501.8 - 2 GHz8 / 8 cores3 MB L3 Cortex-A76 / A55
Clock2020 - 3230 MHz2000 MHz2100 - 2700 MHz
L2 Cache16 MB
L3 Cache32 MB
Cores / Threads6 / 68 / 88 / 8
Transistors15800 Million
Technology5 nm7 nm6 nm
FeaturesARMv8 Instruction Set, Machine Learning Controller, 16-Core Neural Engine, Secure Enclave, Advanced Image Signal Processor4x ARM Cortex-A76 (2 GHz), 4x ARM Cortex-A55 (2 GHz), ARM Mali-G57 MC3, APU 3.0, 5G Modem, MiraVision (4K30 Video, 64MP Photo), Wi-Fi 5, Bluetooth 5.1, UFS 2.2, 12GB LPDDR4x SupportISP (2 main + 2 subsidiary, 108M 9-in-1, 64M ZSL)
iGPUApple A15 GPU 5-CoreARM Mali-G57 MP3ARM Mali-G57 MP4 ( - 850 MHz)
ArchitectureARMARMARM
Announced
CodenameCortex-A76 / A55Cortex-A76 / A55
Manufacturerwww.mediatek.com

Benchmarks

Performance Rating - Geekbench 5.5, PCM Work, Sling Shot Physics, Antutu v8 CPU - Dimensity 720
0.6 pt (44%)
3DMark - 3DMark Ice Storm Unlimited Physics
13664 Points (12%)
3DMark - 3DMark Sling Shot Extreme (ES 3.1) Unlimited Physics
100%
1 A15 +
min: 1852     avg: 2027     median: 1913 (23%)     max: 2307 Points
min: 2901     avg: 3155     median: 3113 (37%)     max: 3493 Points
3DMark - 3DMark Sling Shot (ES 3.0) Unlimited Physics
100%
1 A15 +
2130 Points (24%)
min: 3014     avg: 3045     median: 3018 (34%)     max: 3102 Points
Geekbench 6.2 - Geekbench 6.2 Single-Core
100%
1 A15 +
2332 Points (63%)
660 Points (18%)
Geekbench 6.2 - Geekbench 6.2 Multi-Core
100%
1 A15 +
5661 Points (22%)
1856 Points (7%)
Geekbench 5.5 - Geekbench 5.1 - 5.4 64 Bit Single-Core
100%
A15 +
min: 1590     avg: 1723     median: 1734 (73%)     max: 1755 Points
min: 472     avg: 496.8     median: 499.5 (21%)     max: 516 Points
639 Points (27%)
Geekbench 5.5 - Geekbench 5.1 - 5.4 64 Bit Multi-Core
100%
A15 +
min: 4559     avg: 4755     median: 4788 (9%)     max: 4914 Points
min: 1511     avg: 1589     median: 1603.5 (3%)     max: 1638 Points
2283 Points (4%)
Geekbench 4.4 - Geekbench 4.1 - 4.4 64 Bit Single-Core
min: 2296     avg: 2330     median: 2329.5 (23%)     max: 2363 Points
2857 Points (29%)
Geekbench 4.4 - Geekbench 4.1 - 4.4 64 Bit Multi-Core
min: 6166     avg: 6174     median: 6174 (7%)     max: 6182 Points
8410 Points (9%)
Mozilla Kraken 1.1 - Kraken 1.1 Total Score *
100%
1 A15 +
min: 413.6     avg: 455.6     median: 451 (1%)     max: 507.3 ms
min: 2346.2     avg: 3087     median: 2971 (3%)     max: 4059 ms
Sunspider - Sunspider 1.0 Total Score *
100%
1 A15 +
77 ms (1%)
Octane V2 - Octane V2 Total Score
100%
1 A15 +
min: 57143     avg: 63305     median: 64026.5 (58%)     max: 65969 Points
min: 14156     avg: 16470     median: 16261.5 (15%)     max: 19201 Points
WebXPRT 4 - WebXPRT 4 Score
100%
1 A15 +
min: 188     avg: 188.3     median: 188 (54%)     max: 189 Points
62 Points (18%)
WebXPRT 3 - WebXPRT 3 Score
100%
1 A15 +
min: 219     avg: 254.3     median: 250 (52%)     max: 279 Points
min: 49     avg: 52.3     median: 51 (11%)     max: 57 Points
AnTuTu v8 - AnTuTu v8 UX
min: 47476     avg: 52873     median: 52872.5 (44%)     max: 58269 Points
AnTuTu v8 - AnTuTu v8 MEM
min: 42094     avg: 51085     median: 51084.5 (41%)     max: 60075 Points
AnTuTu v8 - AnTuTu v8 GPU
min: 60295     avg: 63084     median: 63084 (12%)     max: 65873 Points
AnTuTu v8 - AnTuTu v8 CPU
min: 84462     avg: 85620     median: 85619.5 (31%)     max: 86777 Points
AnTuTu v8 - AnTuTu v8 Total Score
min: 252308     avg: 252661     median: 252660 (24%)     max: 253013 Points
Antutu v9 - AnTuTu v9 Total Score
100%
A15 +
min: 722973     avg: 788523     median: 800415 (48%)     max: 832548 Points
min: 325377     avg: 333323     median: 333323 (20%)     max: 341269 Points
473609 Points (29%)
Antutu v9 - AnTuTu v9 CPU
100%
A15 +
min: 192891     avg: 209810     median: 209802 (57%)     max: 227638 Points
min: 86204     avg: 87908     median: 87907.5 (24%)     max: 89611 Points
139602 Points (38%)
PassMark PerformanceTest Mobile V1 - PerformanceTest Mobile V1 CPU Tests
100%
1 A15 +
min: 10349     avg: 10411     median: 10410.5 (1%)     max: 10472 Points
176204 Points (23%)
PCMark for Android - PCM f. Android Storage 2.0 score
14932 Points (24%)
PCMark for Android - PCM f. Android Work Score 3.0
min: 8439     avg: 8567     median: 8566.5 (40%)     max: 8694 Points
PCMark for Android - PCM f. Android Computer Vision
min: 2711     avg: 2821     median: 2820.5 (15%)     max: 2930 Points
PCMark for Android - PCM f. Android Storage
min: 13793     avg: 14162     median: 14161.5 (30%)     max: 14530 Points
PCMark for Android - PCM f. Android Work Score 2.0
min: 6145     avg: 6770     median: 6770 (44%)     max: 7395 Points
PCMark for Android - PCM f. Android Work Score
min: 7158     avg: 8916     median: 8915.5 (45%)     max: 10673 Points
CrossMark - CrossMark Overall
100%
1 A15 +
min: 1132     avg: 1156     median: 1145 (44%)     max: 1190 Points
534 Points (20%)
Power Consumption - Geekbench 5.5 Power Consumption 150cd *
100%
1 A15 +
min: 4.54     avg: 4.9     median: 5 (2%)     max: 5.64 Watt
min: 2.53     avg: 3.8     median: 3.8 (2%)     max: 4.99 Watt
Power Consumption - Idle Power Consumption 150cd 1min *
100%
1 A15 +
min: 0     avg: 0.7     median: 0.7 (1%)     max: 1.415 Watt
min: 0.908     avg: 1.4     median: 1.4 (2%)     max: 1.812 Watt

Average Benchmarks Apple A15 Bionic → 100% n=4

Average Benchmarks MediaTek Dimensity 720 → 36% n=4

Average Benchmarks UNISOC T820 → 53% n=4

- Range of benchmark values for this graphics card
- Average benchmark values for this graphics card
* Smaller numbers mean a higher performance
1 This benchmark is not used for the average calculation

v1.26
log 29. 10:43:33

#0 checking url part for id 13825 +0s ... 0s

#1 checking url part for id 12994 +0s ... 0s

#2 checking url part for id 14598 +0s ... 0s

#3 not redirecting to Ajax server +0s ... 0s

#4 did not recreate cache, as it is less than 5 days old! Created at Tue, 28 May 2024 05:33:54 +0200 +0.001s ... 0.001s

#5 composed specs +0.097s ... 0.098s

#6 did output specs +0s ... 0.098s

#7 getting avg benchmarks for device 13825 +0.003s ... 0.101s

#8 got single benchmarks 13825 +0.02s ... 0.121s

#9 getting avg benchmarks for device 12994 +0.015s ... 0.136s

#10 got single benchmarks 12994 +0.016s ... 0.152s

#11 getting avg benchmarks for device 14598 +0.003s ... 0.155s

#12 got single benchmarks 14598 +0.008s ... 0.162s

#13 got avg benchmarks for devices +0s ... 0.162s

#14 min, max, avg, median took s +0.136s ... 0.299s

#15 return log +0s ... 0.299s

Please share our article, every link counts!
> Expert Reviews and News on Laptops, Smartphones and Tech Innovations > Benchmarks / Tech > Processor Comparison - Head 2 Head
Redaktion, 2017-09- 8 (Update: 2023-07- 1)