Deutsch
 English
 Español
 Français
 Italiano
 Nederlands
 Polski
 Português
 Русский
 Türkçe
 Svenska
 Chinese
 Magyar
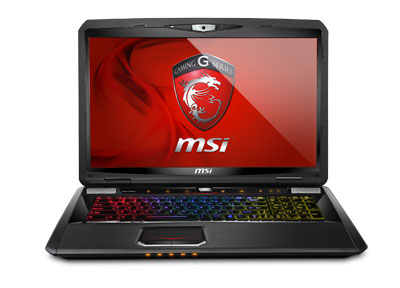
Review Update MSI GT70 2OC-065US Notebook

Generally speaking, 17-inch portable gaming rigs have the advantage over smaller 15-inch DTRs when it comes to internal hardware and configuration options. With some exceptions like the rather closed nature of the Asus ROG series, this allows manufacturers to offer high-end notebooks with very high levels of customization and various combinations of CPU/GPU and HDD/SSD options under the same chassis.
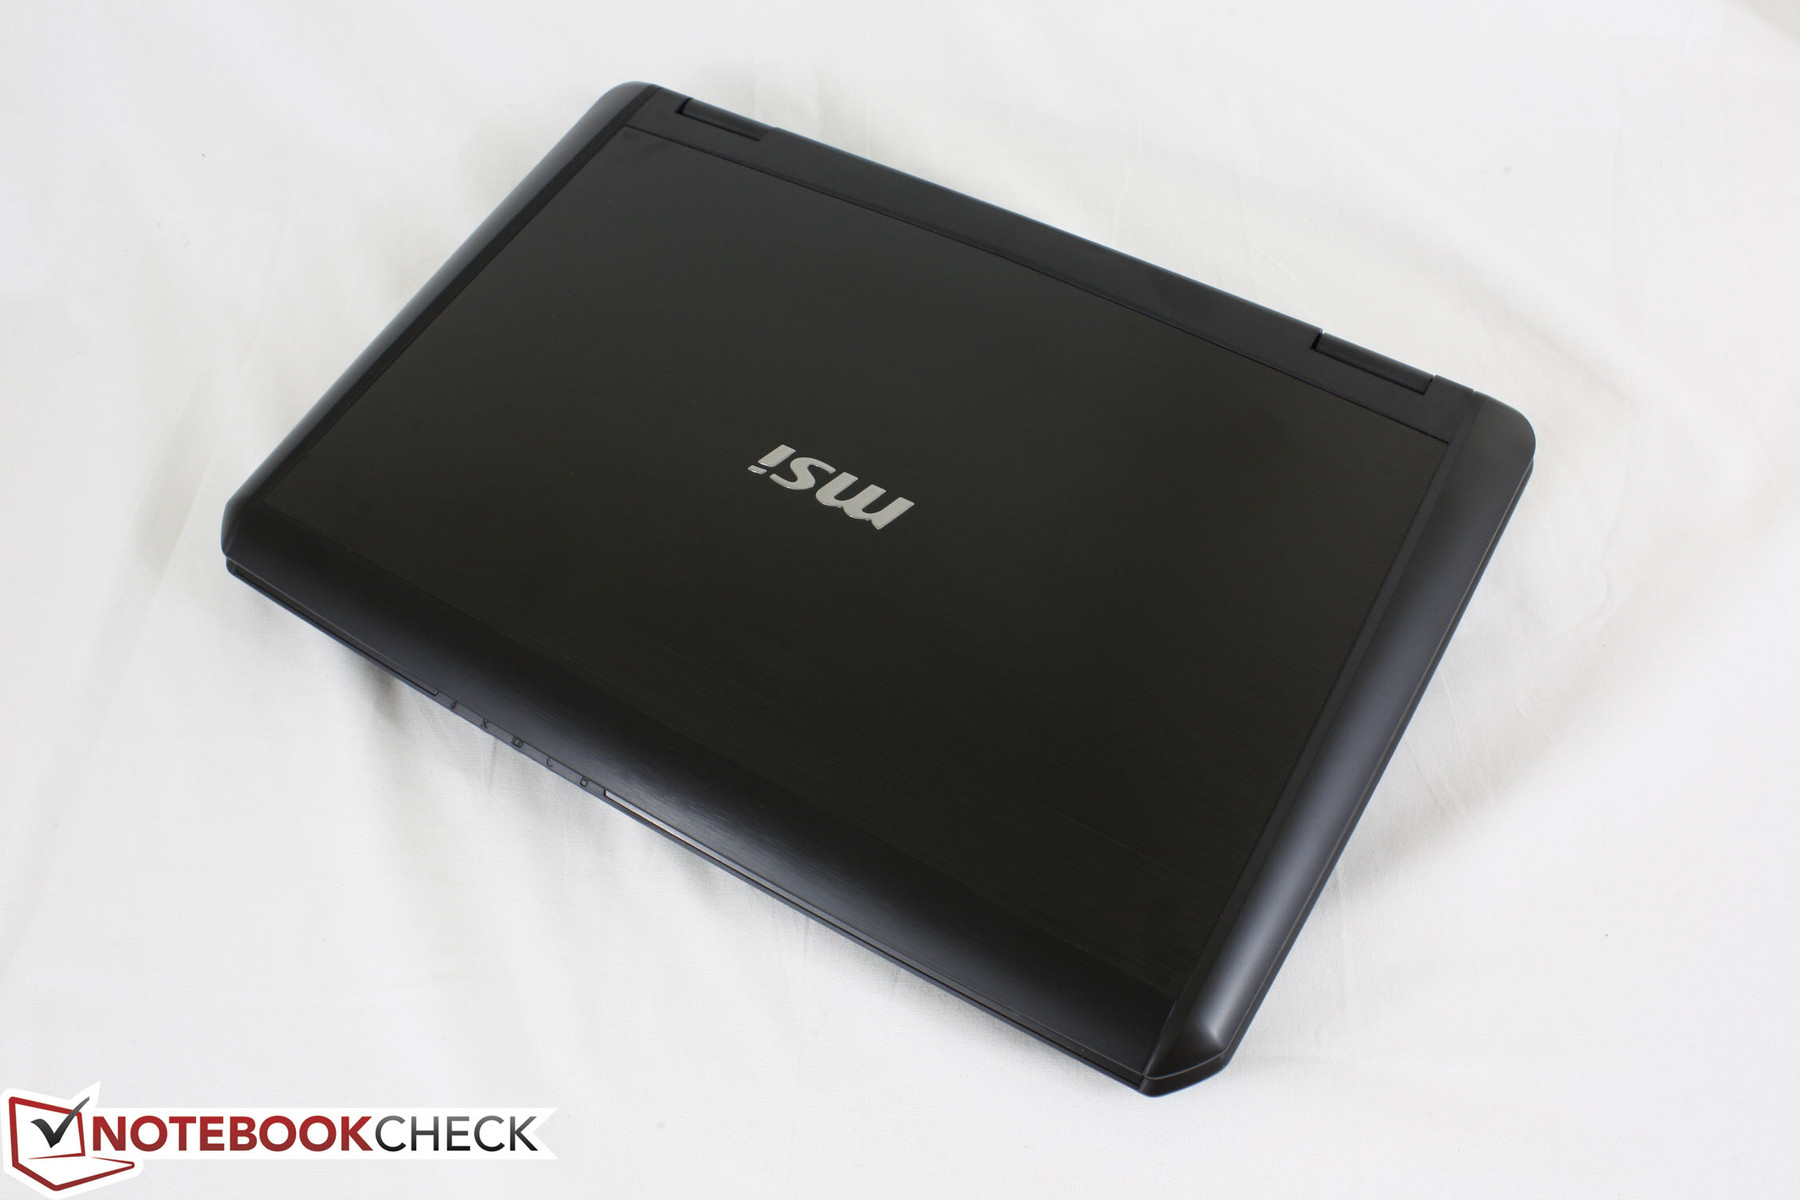
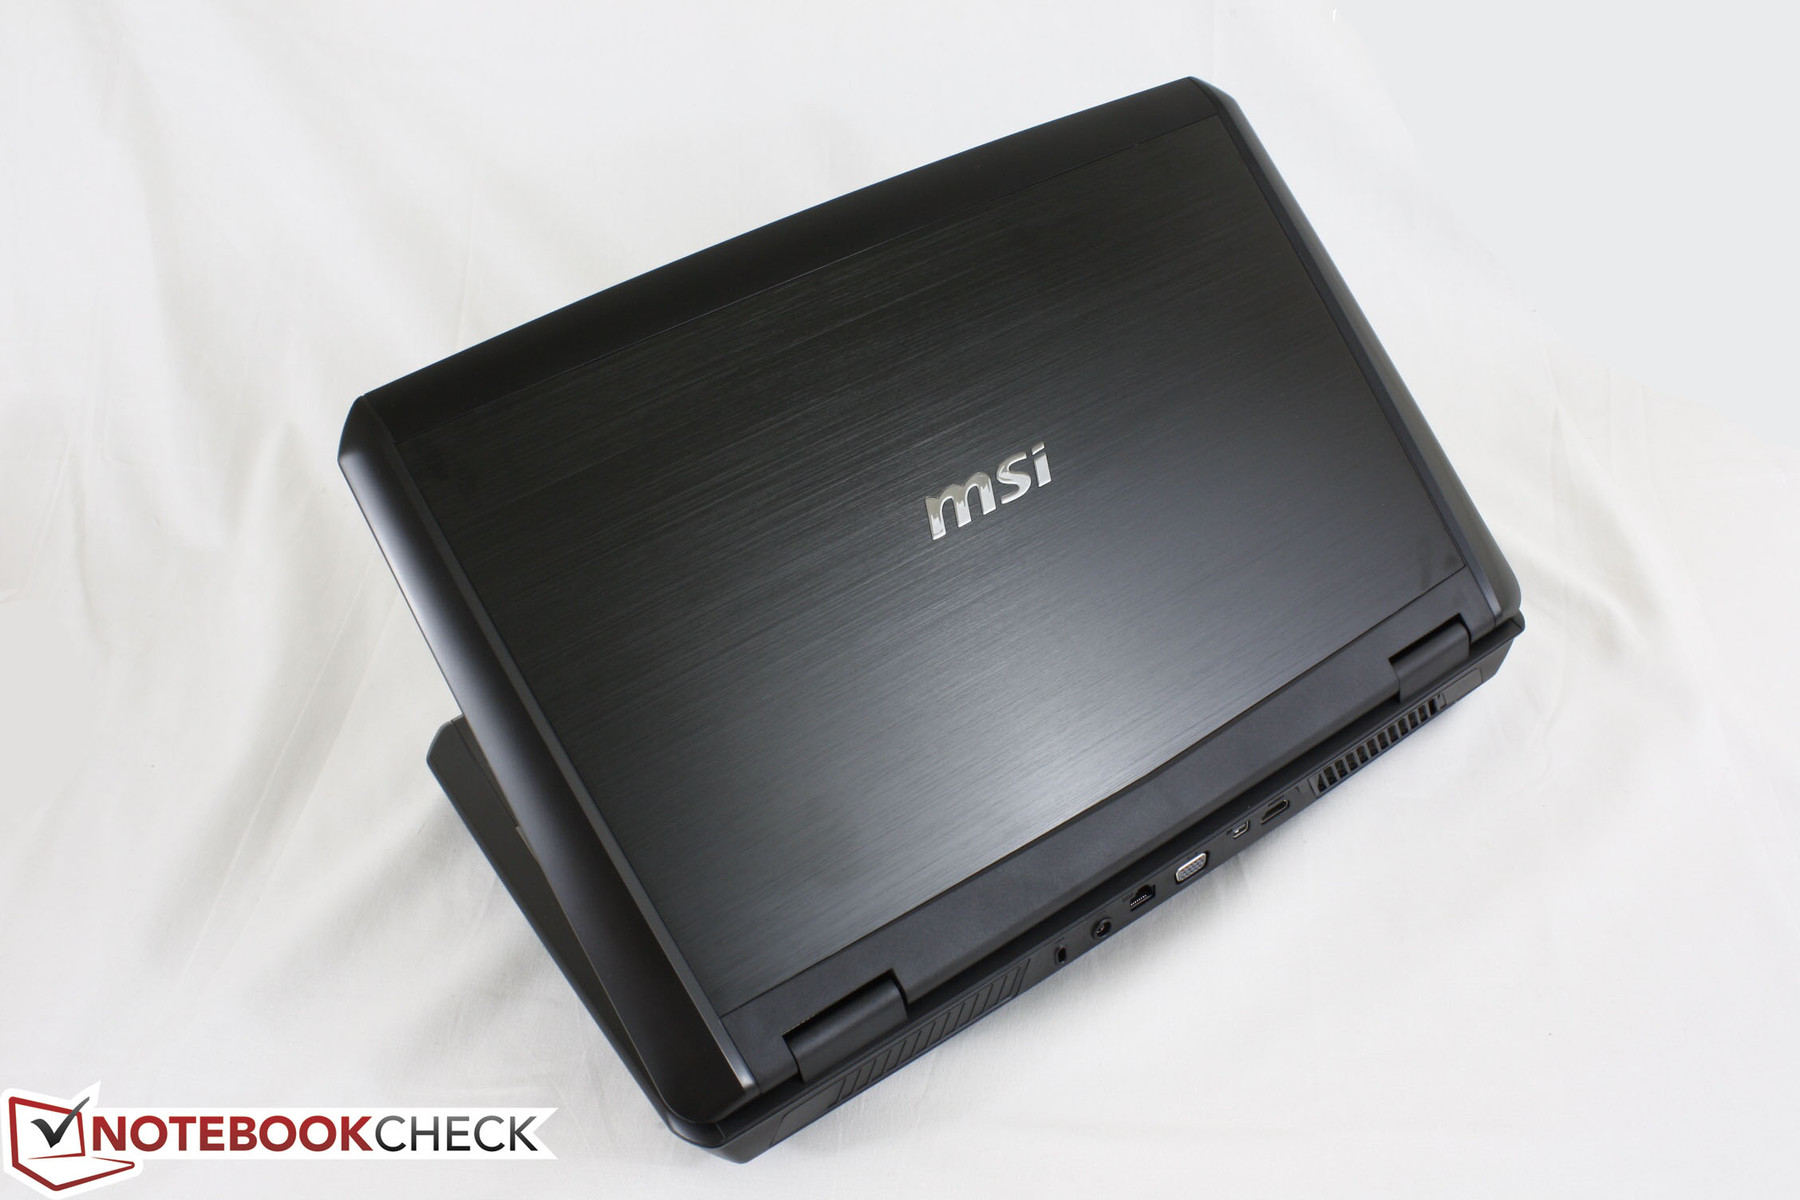
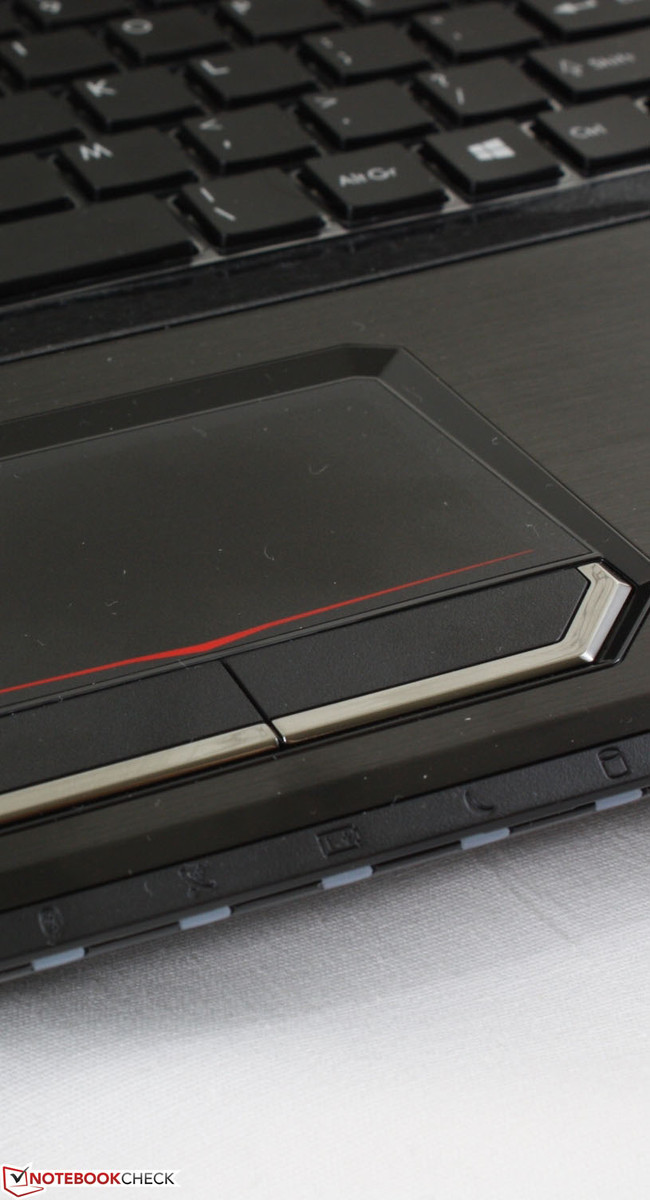
The MSI GT70 is such a model with plenty of hardware options in order to fit the specific needs of any gamer. Last year’s model with Ivy Bridge and Nvidia’s first generation Kepler returned great results and this year’s model with Haswell and Nvidia's second generation Kepler came out even better in our tests. Since the chassis has not changed between these models, we refer to their respective reviews for more detailed information on case quality, connectivity options and keyboard and touchpad performances.
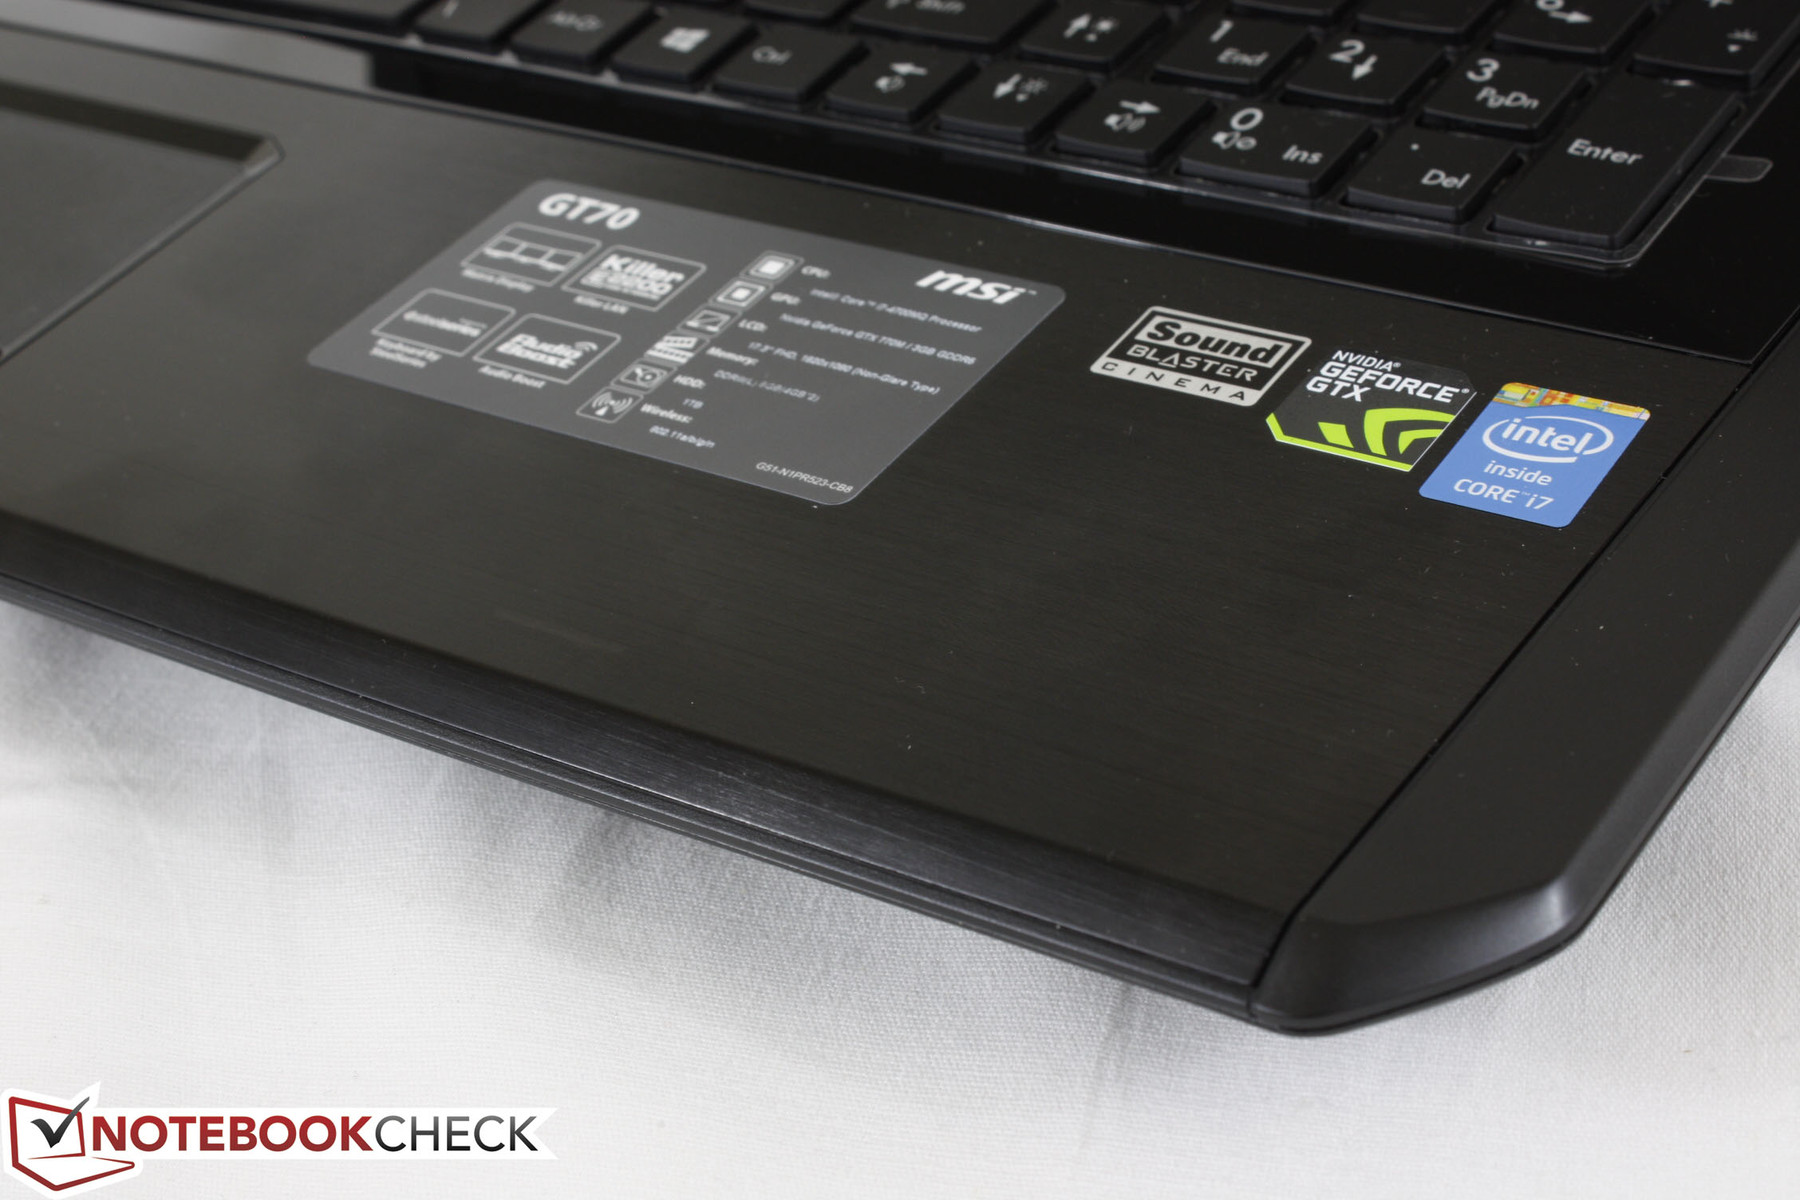
Our third GT70 model in review is equipped with the same i7-4700MQ Haswell CPU as the GT70H, but with the slightly slower GTX 770M and without the RAID SSD hardware that gave our previous review models a significant boost. Instead, our model here makes use of a standard 1 TB 5400 RPM HDD, which in turn allows for a more accessible $1499 price point compared to over $2000 when pre-configured with multiple SATA III SSDs. We find out in this review if this HDD-based configuration can stand up to its much more expensive SSD counterparts.
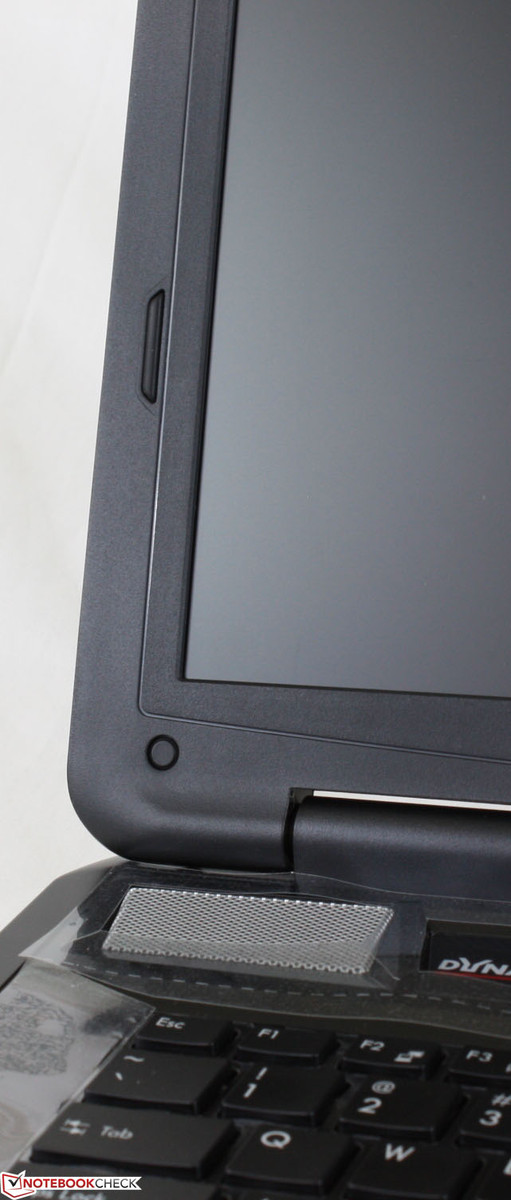
Display
The Full HD matte panel on our unit is the Chi Mei 173HGE – the same panel as found on our recent review of the 17.3-inch Asus G750JW. Owners of the new Asus DTR have been reporting black lines and flickering from the panel and we’ve noticed on our own review of the G750JW that a layer of graininess is noticeable, especially over portions of the screen where it may be displaying the color white. Unfortunately, this is again noticeable on our new MSI model and can be more easily seen when displaying bright colors as opposed to darker hues, for example when word processing or browsing through predominately white webpages. We did not experience any black lines or flickering, which admittedly may have been driver issues, but the moderate amount of graininess may annoy some users while others can simply ignore it.
Beyond the above, there are no other issues with the display with regards to color reproduction or significant light bleeding. Average brightness across nine measured quadrants is similar to last year’s GT70, but much below that of the G750JW and the newer GT70H. For typical indoor use, however, the backlight here will be more than enough to overcome distracting glare and other ambient lights.
| |||||||||||||||||||||||||
Brightness Distribution: 76 %
Center on Battery: 214 cd/m²
Contrast: 328:1 (Black: 0.808 cd/m²)
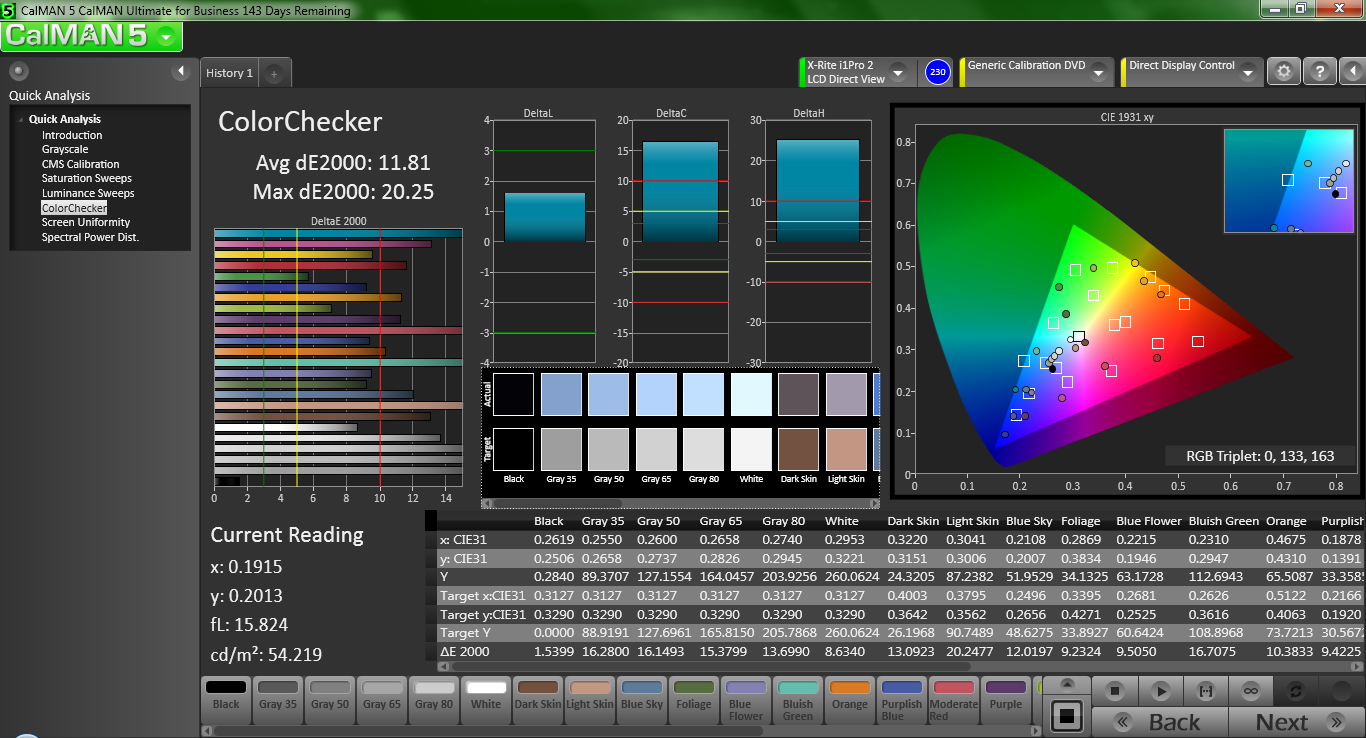
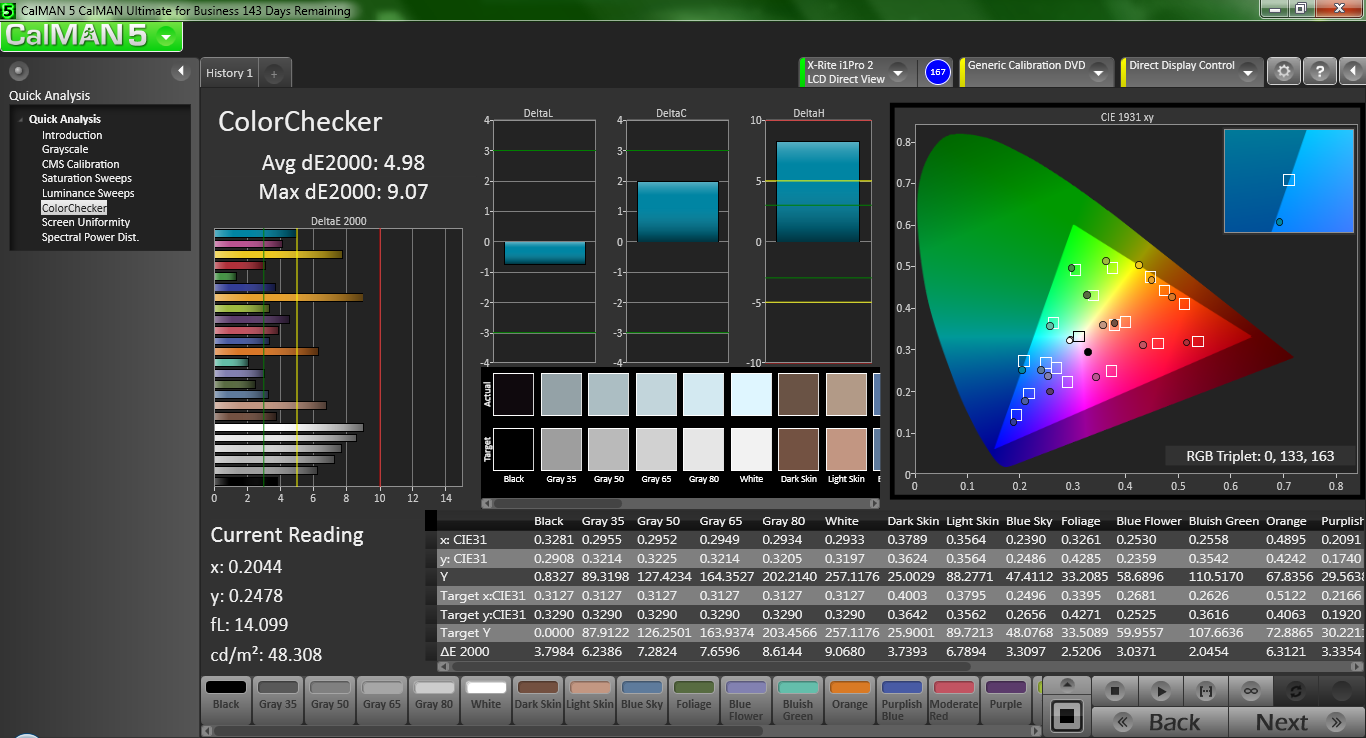
ΔE Color 4.98 | 0.5-29.43 Ø5
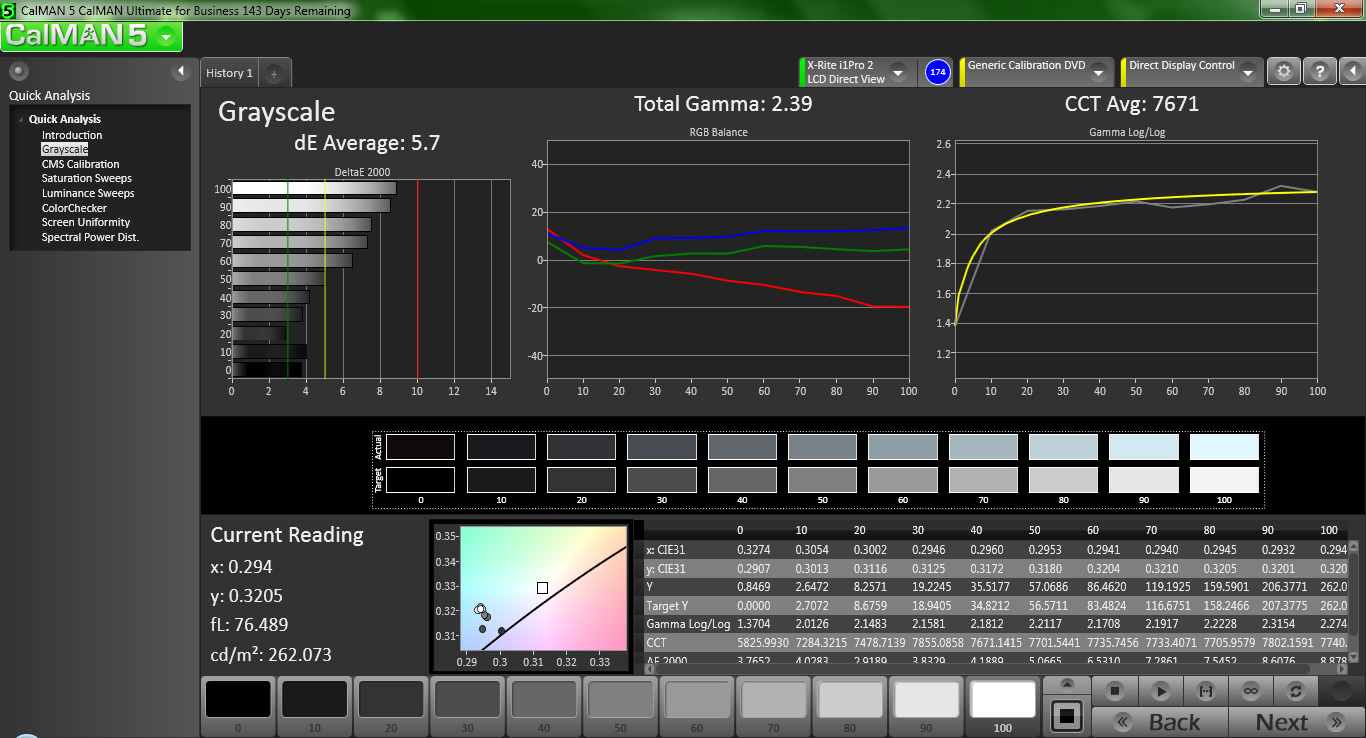
ΔE Greyscale 5.7 | 0.57-98 Ø5.3
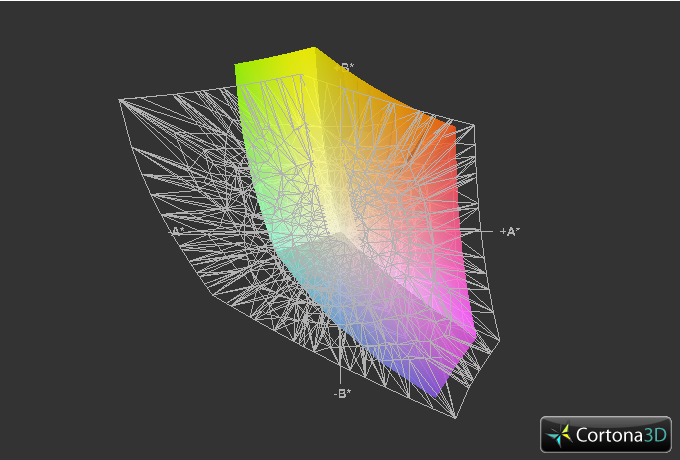
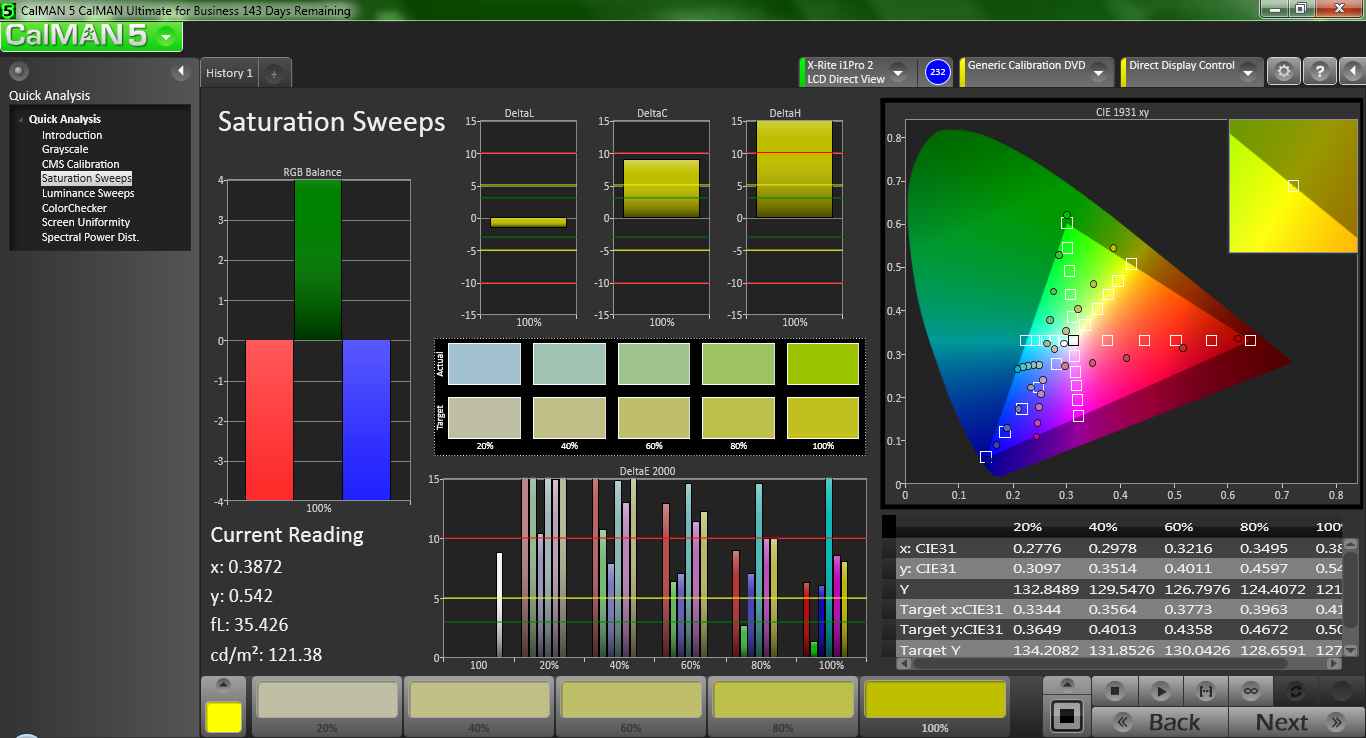
60% AdobeRGB 1998 (Argyll 1.6.3 3D)
64.1% AdobeRGB 1998 (Argyll 2.2.0 3D)
87.4% sRGB (Argyll 2.2.0 3D)
63.8% Display P3 (Argyll 2.2.0 3D)
Gamma: 2.38
Color space reproduction is approximately 60 percent of the AdobeRGB standard, which is also equal to that of the Asus G750JW and GT70H as shown below. This is trivial to most but the hardcore digital artists and editors who demand professionally tuned displays for the highest level of accuracy as gamers and other users will likely not notice the narrower color range. Colors are still subjectively deep and most certainly not washed out as they often are on low resolution budget notebooks.
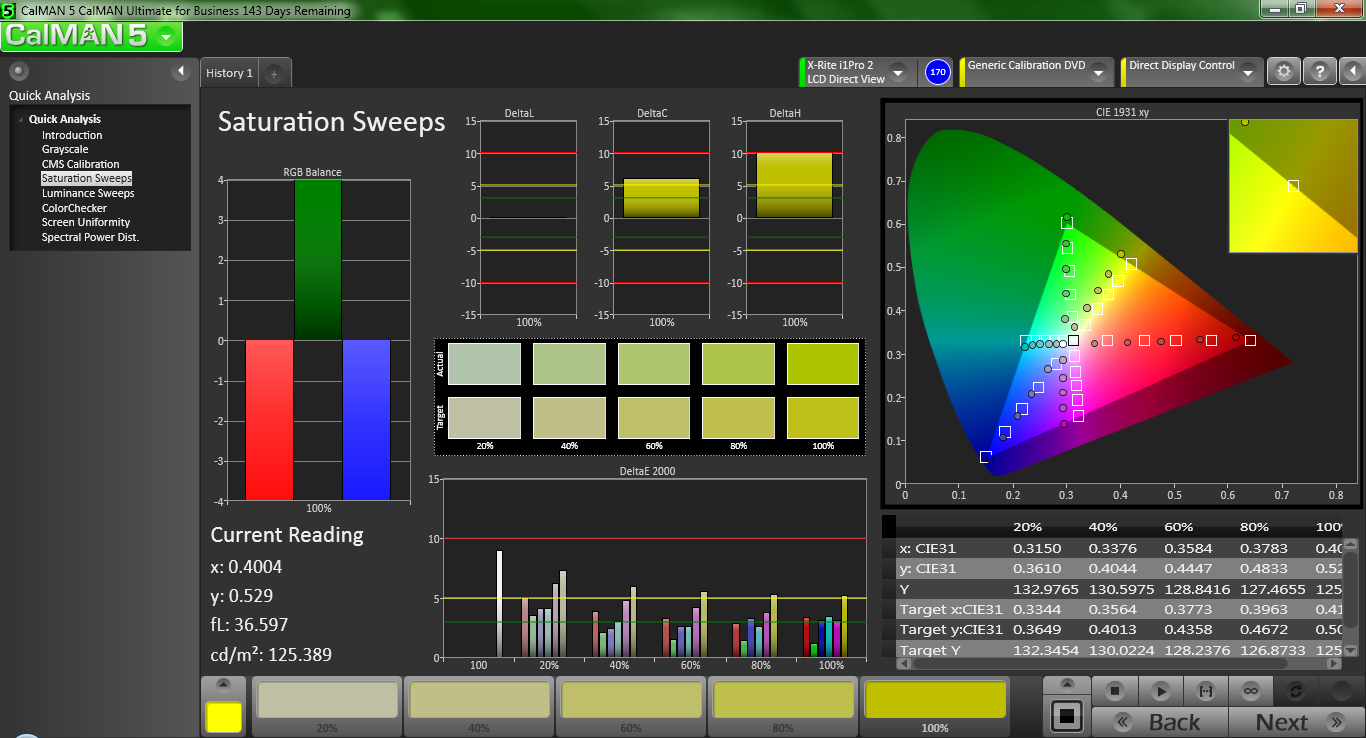
Further display measurements were performed with an X-Rite i1Basic Pro 2 spectrophotometer with the CalMAN 5 software. The display of the MSI notebook out-of-the-box performed somewhat poorly with an overly high CCT average for a very blue overcast and subsequently very high DeltaE deviation for the color cyan. After calibration, however, the display proved to be more than capable of reproducing all colors with a DeltaE deviation well below 5 units for most colors under all tested saturation levels. Yellow and orange are reproduced slightly less accurately than other colors if we had to nick pick, but the measured gamma of 2.39 is overall very close to the 2.2 ideal if conforming to the sRGB standard.


Outdoor usability is passable, but of course not recommended and certainly not the intention of the hefty DTR. Though the backlight is sufficient for indoor conditions, it was simply not designed for a high enough lumen output to make such a large screen easy to use under sunlight. Note that maximum screen brightness will indeed fall if running on batteries, even if on the High Performance profile. Thus, users are encouraged even further to work near an available power outlet if possible.

Viewing angle stability is typical of TN panels. The viewing window is wider than it is tall, so expect the picture to quickly degrade and invert if viewing from above or below the center normal as opposed to the sides. Needless to say, this is a non-issue for the sole user.
Performance
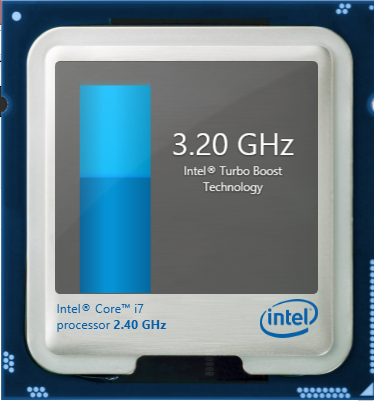
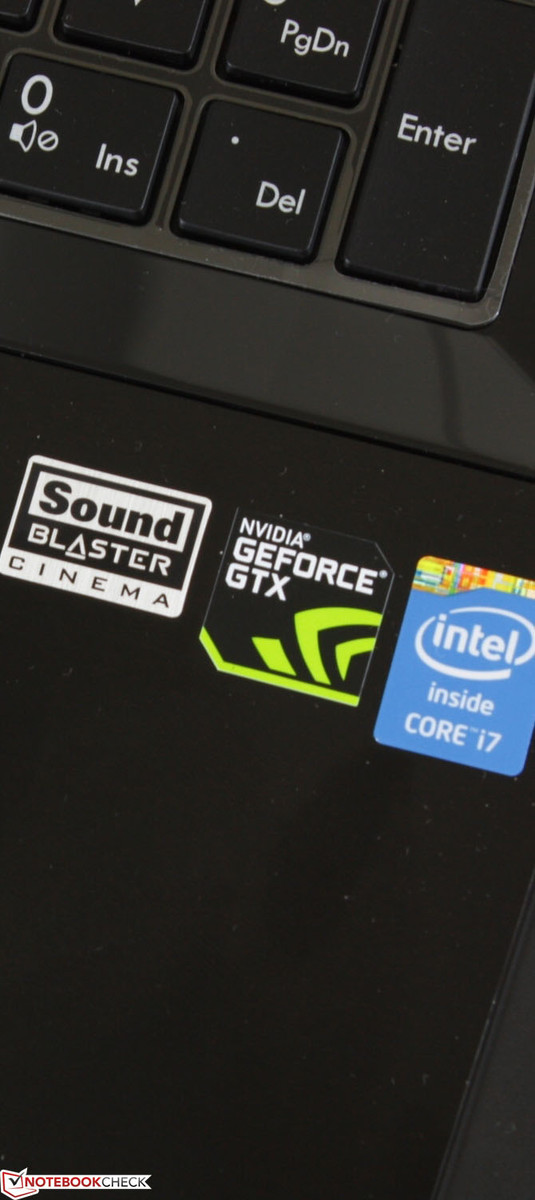
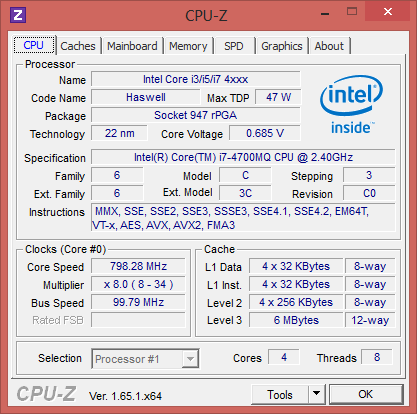
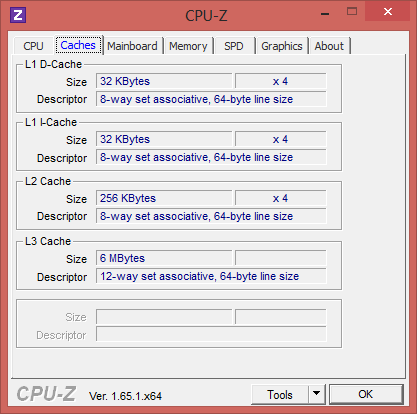
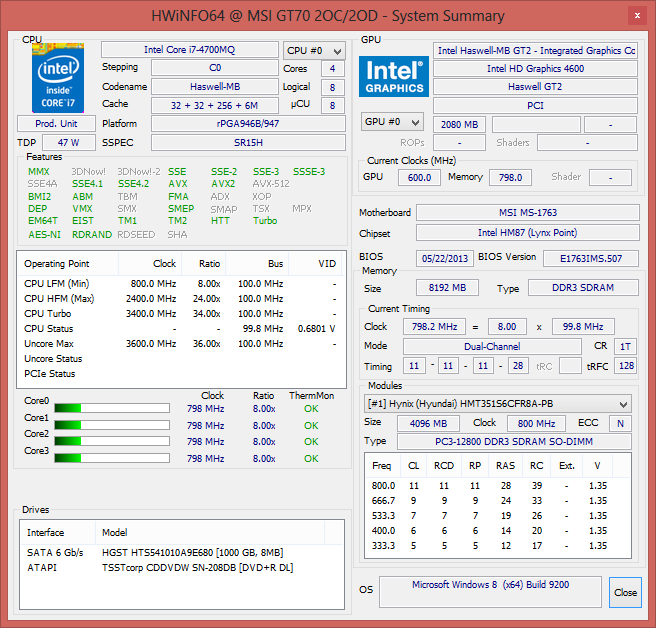
The Core i7-4700MQ CPU is a common high-end Haswell processor for high performance notebooks and is essentially similar to the i7-4700HQ in performance, but without Intel vPro support that certain business users may rely on. The 2.4 GHz CPU can Turbo Boost up to 3.4 GHz for one active core or 3.2 GHz for all four active cores. This particular quad-core processor supplants the previous generation Ivy bridge i7-3740QM while operating at slightly lower frequencies for a roughly comparable final performance output.
Aside from the CPU architectural updates, Haswell has buffed up the integrated GPU as well. The MSI GT70 includes an active HD Graphics 4600 integrated GPU with Optimus for automatic and manual graphics switching. The performance of the HD 4600 is not covered in this review as it has been well benchmarked and documented in our full dedicated overview of the Haswell graphics lineup earlier this year. Instead, all benchmarks and numbers presented here were performed with the active discrete Nvidia GPU.
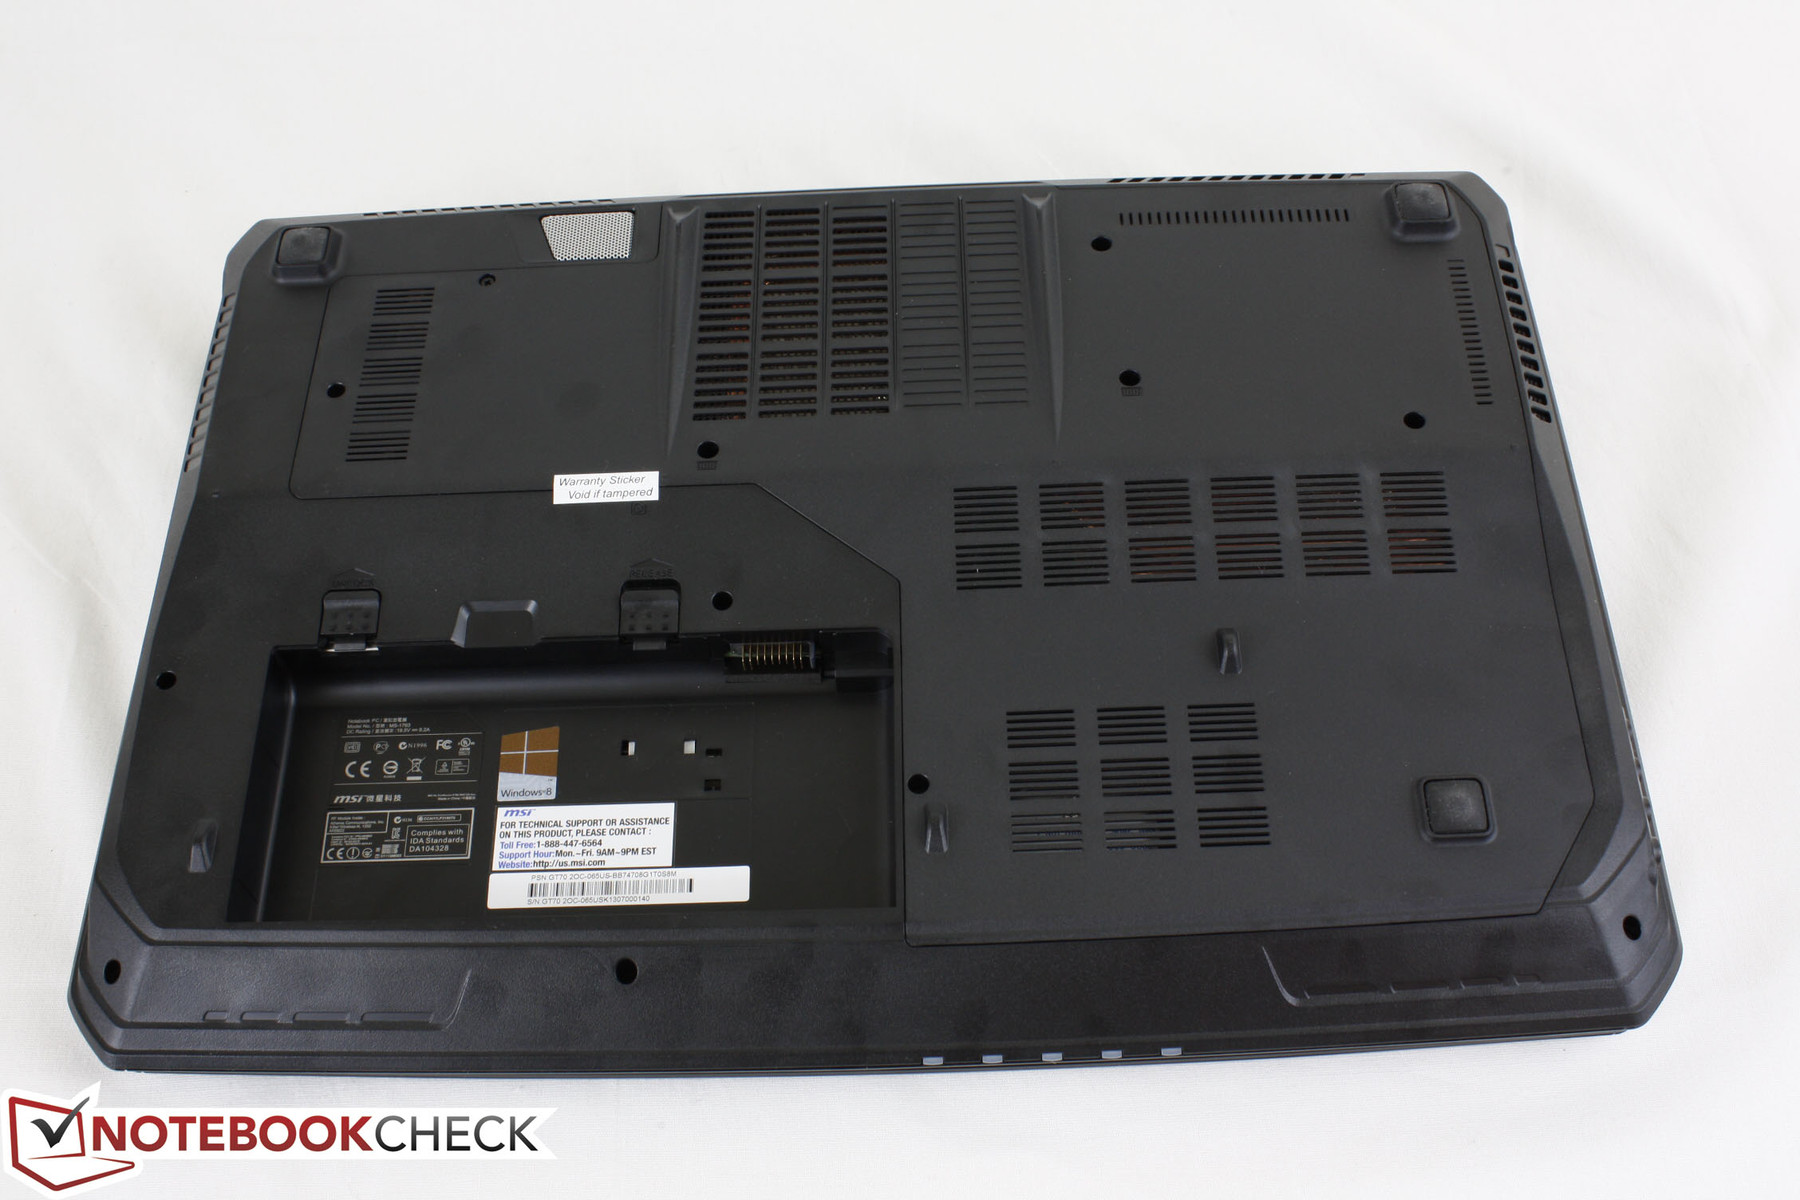
Although the MSI shell allows for easy access to internal components, users will have to break the warranty seal first before removing the maintenance panel underneath. This is extremely unfortunate as even a simple hard drive swap or RAM upgrade will entail voiding the warranty. Thus, any internal tampering is recommended only after the warranty has expired.

Processor
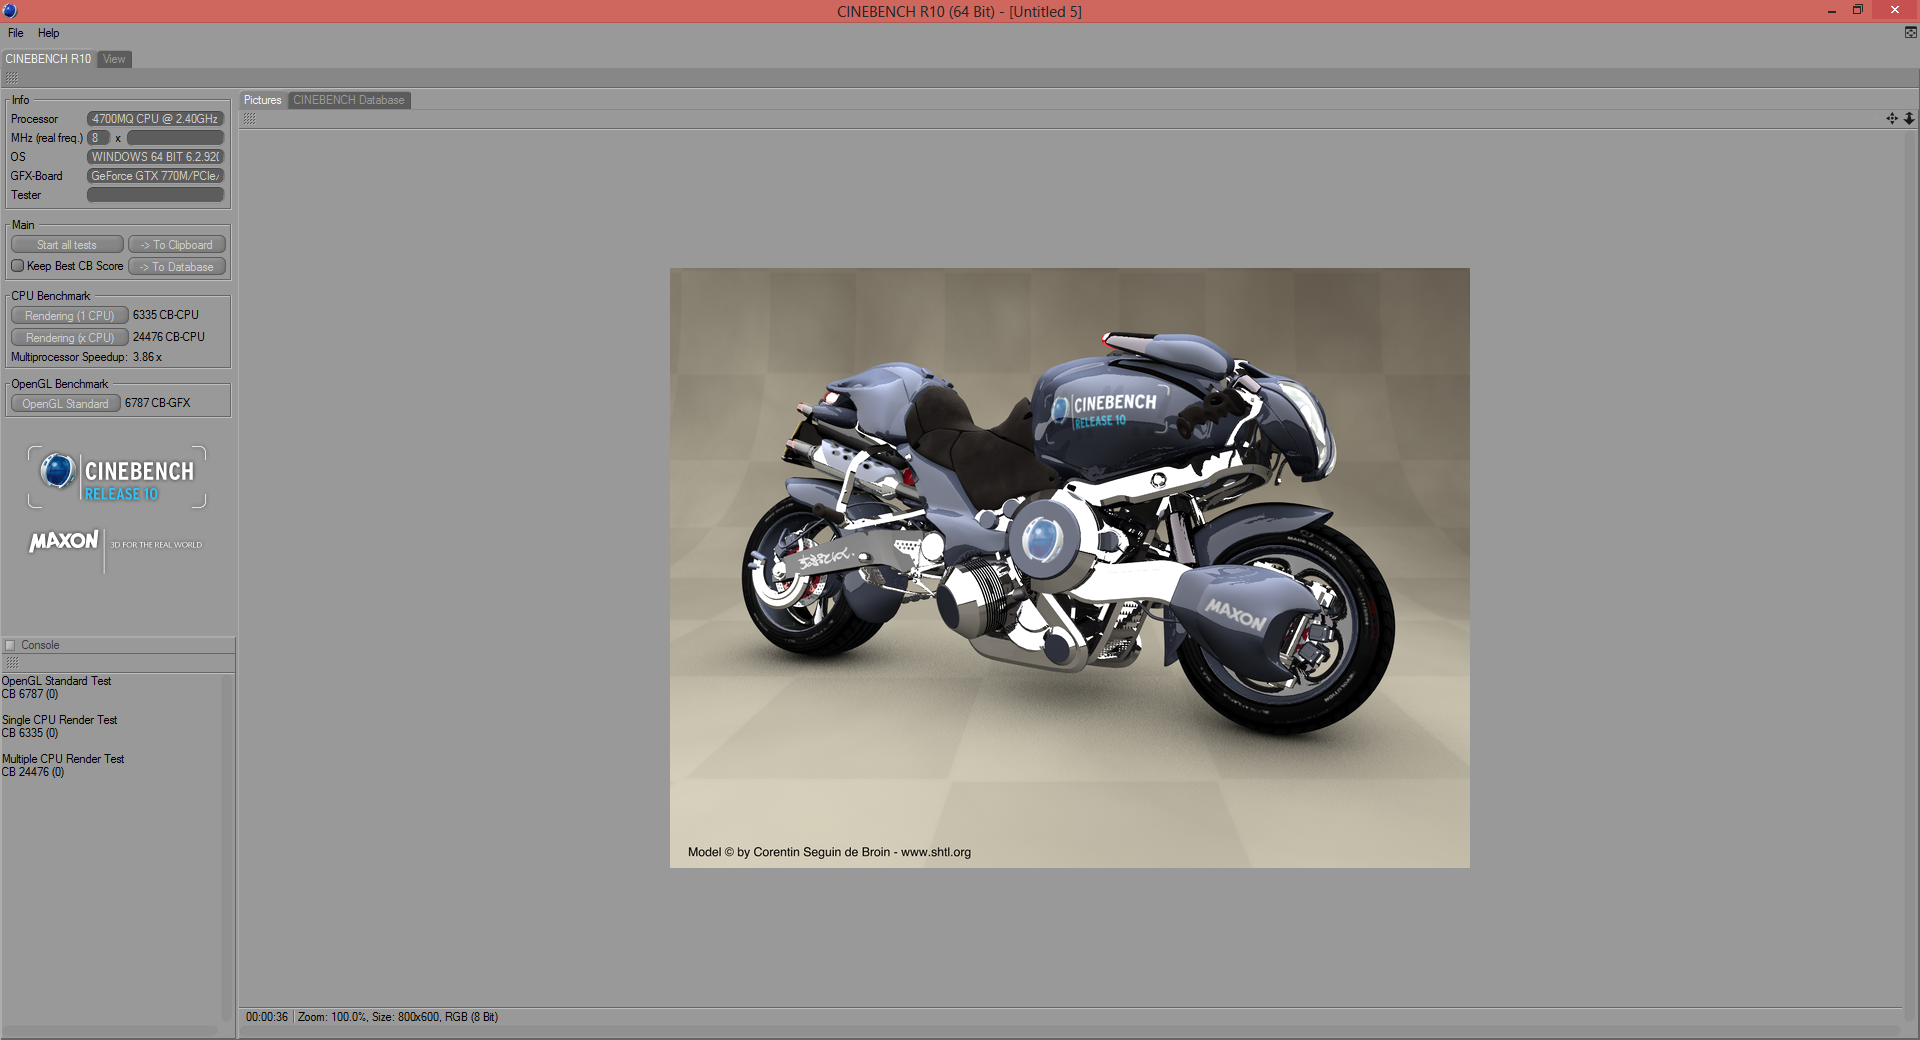
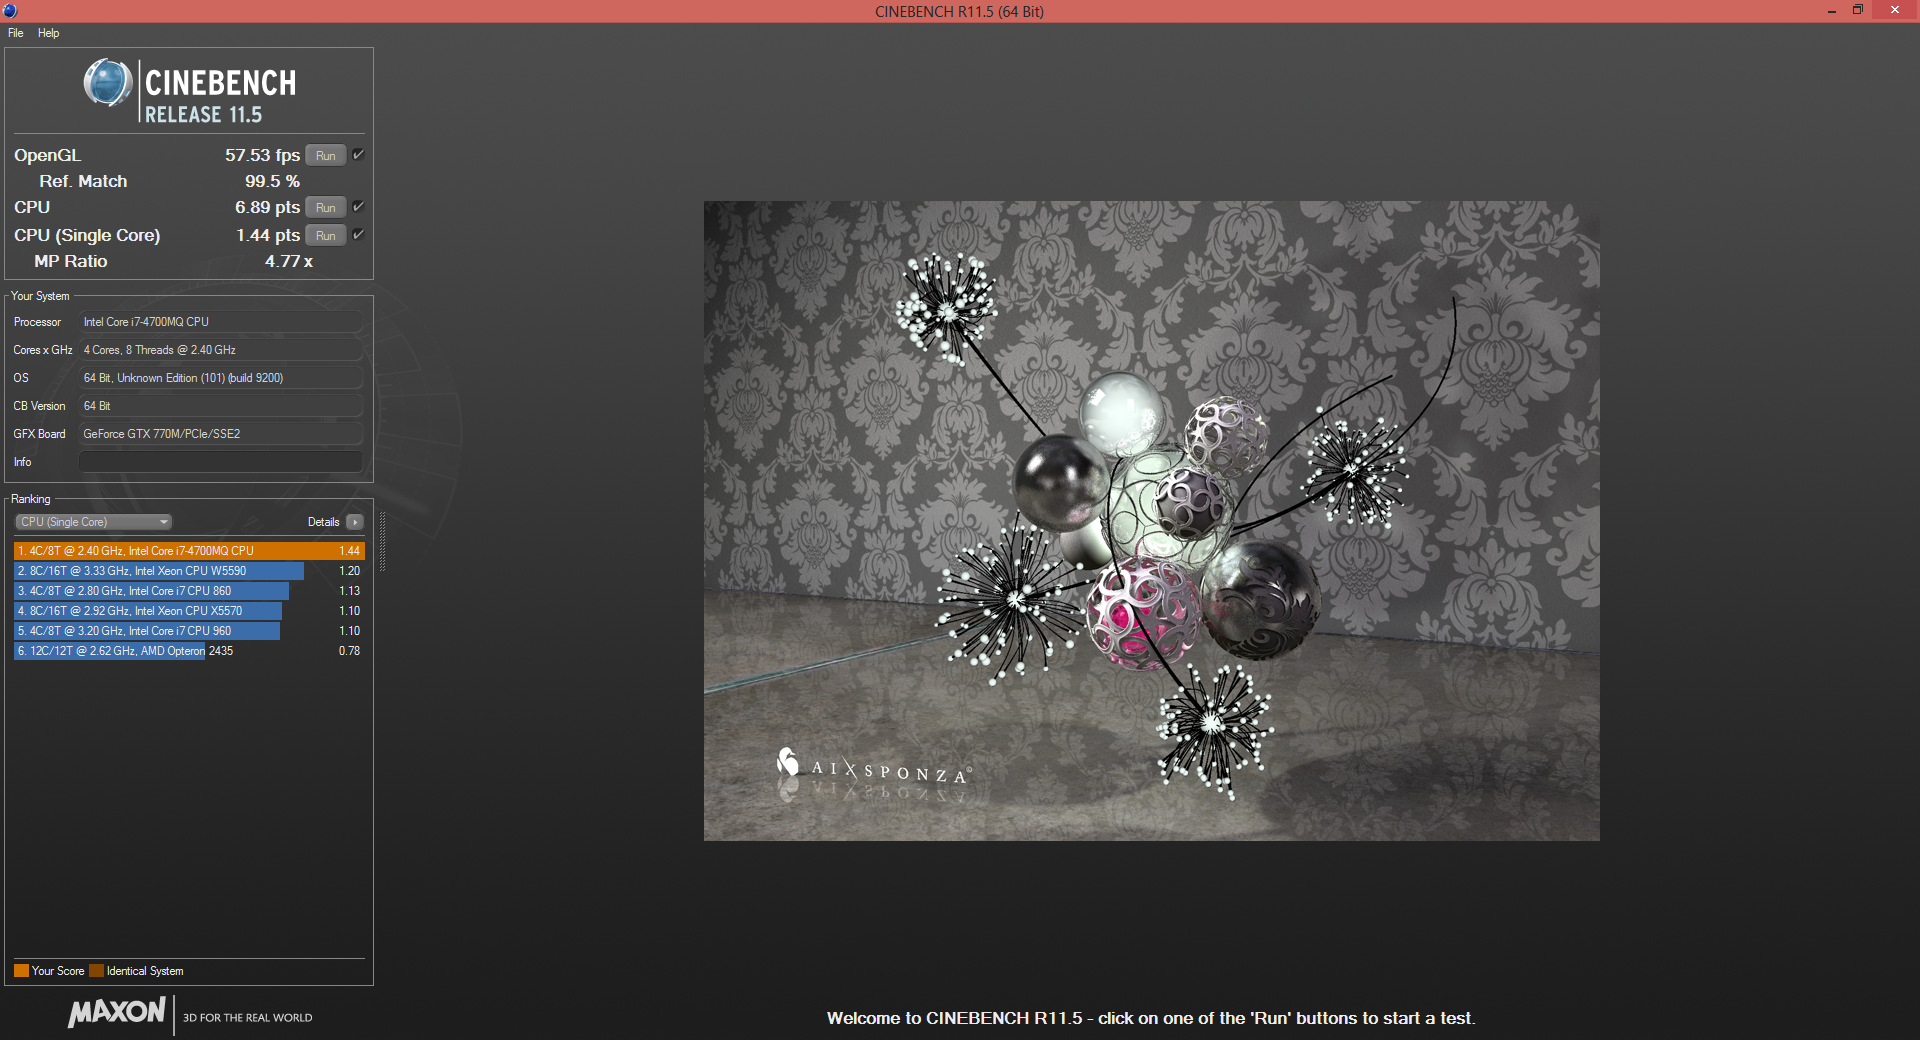
CPU-oriented benchmarks place the i7-4700MQ in the MSI at about the same level of other notebooks sporting the same CPU. Interestingly, wPrime 1024m takes around 20 seconds longer to complete than the previous generation i7-3740QM while the CineBench R11.5 64-Bit CPU Multi test scores are much more similar at about 6.9 points for both processors. The single-thread Super Pi benchmark completes at about 24 seconds for both CPUs up to the 2 millionth digit. While the performance gain from the i7-3740QM IVB core to the i7-4700MQ Haswell core may not be significant according to our tested synthetic benchmarks, users should note that the newer generation core is able to accomplish the same tasks at comparatively lower clock frequencies.
More information and benchmarks on the i7-4700MQ can be seen on our dedicated page here.

System Performance

With a final score of 3493 points in PCMark 7, the MSI GT70 shows good performance on the surface, but could have been much higher if it had been equipped with an SSD or faster HDD. The Fragbook DTX in our database, for example, uses the same Intel and Nvidia CPU and GPU, respectively, but scores 5664 points in PCMark 7. In fact, older notebooks like the Sony Vaio T15 and Lenovo IdeaPad U310 with their integrated HD 4000 graphics score nearly 3500 points as well, due mostly to their fast SSDs.
A closer look at the individual scores of the GT70 reveals a high computational score of 19037 points and a meager system storage score of just 1530 points. Its Windows 8 Experience Index confirms the bottleneck as the primary hard disk score of 5.9 points is much lower than the other measured categories, resulting in an unbalanced system.
Subjectively, launching applications take much longer than what one would expect, especially for such a high-end system. We were able to quickly notice this when we were installing our usual benchmark programs and utilities as installations felt slower and delayed while launching the apps for the first time was far from instantaneous.
| PCMark 7 Score | 3493 points | |
Help | ||
Storage Devices
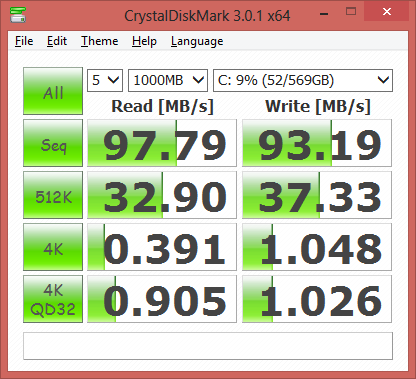
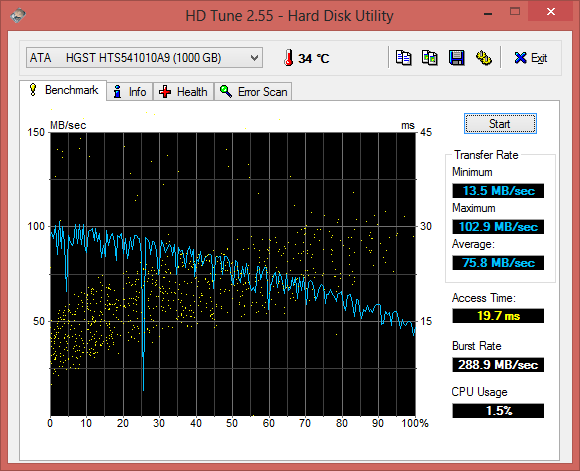
The installed 1 TB 5400 RPM Hitachi Travelstar HTS541010A9E680 provides plenty of space for game installations. The praise ends there, unfortunately, as the SATA III drive shows poor performance in both HD Tune and CrystalDiskMark. With an average transfer rate of 75.8 MB/s, this is about 10 MB/s slower than the comparable 1 TB 5400 RPM Seagate drive in the Asus G750JW and is even slower than the 7 mm 5400 RPM drive of the very inexpensive 11.6-inch Lenovo IdeaPad S210. It’s certainly a significant downgrade from the RAID 0 SSD-equipped GT70 models.
For our growing list of HDD and SSD benchmarks, see here.

Gaming Performance
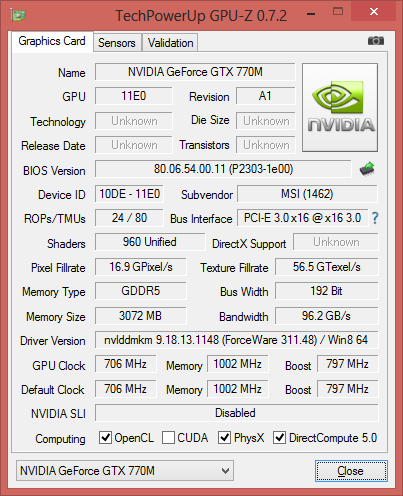
The heart of any gaming DTR is the GPU and the GTX 770M certainly doesn’t disappoint. What it lacks in CUDA cores compared to the higher-end GTX 780M and previous generation champion GTX 680M it makes up for with higher base core and memory clock rates than any first generation mobile Kepler GPU. The reduced memory interface (192-bit vs. 256-bit of the more expensive GTX models) will put some stress on the card if running games with bandwidth-heavy features enabled.
As an example, both Sleeping Dogs and Metro Last Light run at around 20 FPS at maximum settings as both titles are known to deploy a number of advanced (and demanding) graphical features such as Analytical Anti-Aliasing (AAA) or High Definition Ambient Occlusion (HD AO). In comparison, the previous generation GTX 680M was able to run both games at a steady 30 FPS on the same settings due largely to its wider bandwidth and higher number of CUDA cores despite running at lower clock and memory frequencies. As a result, titles with lots of spectacle and eye candy will need to be tuned down for users to play comfortably at 1080p with the GTX 770M.
Meanwhile, synthetic graphics-oriented benchmarks place the MSI GT70 in the same ballpark as other notebooks equipped with the same GPU, such as the recently reviewed Valkyrie CZ-15 and Asus G750JX. 3DMark 11 scores are slightly higher than the Radeon HD 8970M of the AMD-centric MSI GX70H (5031 points vs. 4922 points) and not too far from the workstation Quadro K5000M of the Dell Precision M6700 (5152 points).

| low | med. | high | ultra | |
| The Elder Scrolls V: Skyrim (2011) | 94 | 75 | 45 | |
| Sleeping Dogs (2012) | 109 | 67 | 19 | |
| Guild Wars 2 (2012) | 54 | 31 | ||
| Call of Duty: Black Ops 2 (2012) | 178 | 107 | 70 | |
| Tomb Raider (2013) | 145 | 94 | 41 | |
| StarCraft II: Heart of the Swarm (2013) | 113 | 98 | 50 | |
| BioShock Infinite (2013) | 111 | 97 | 29 | |
| Metro: Last Light (2013) | 70 | 41 | 22 | |
| Company of Heroes 2 (2013) | 46 | 31 | 15 |
| 3DMark 06 Standard Score | 22079 points | |
| 3DMark Vantage P Result | 19094 points | |
| 3DMark 11 Performance | 5031 points | |
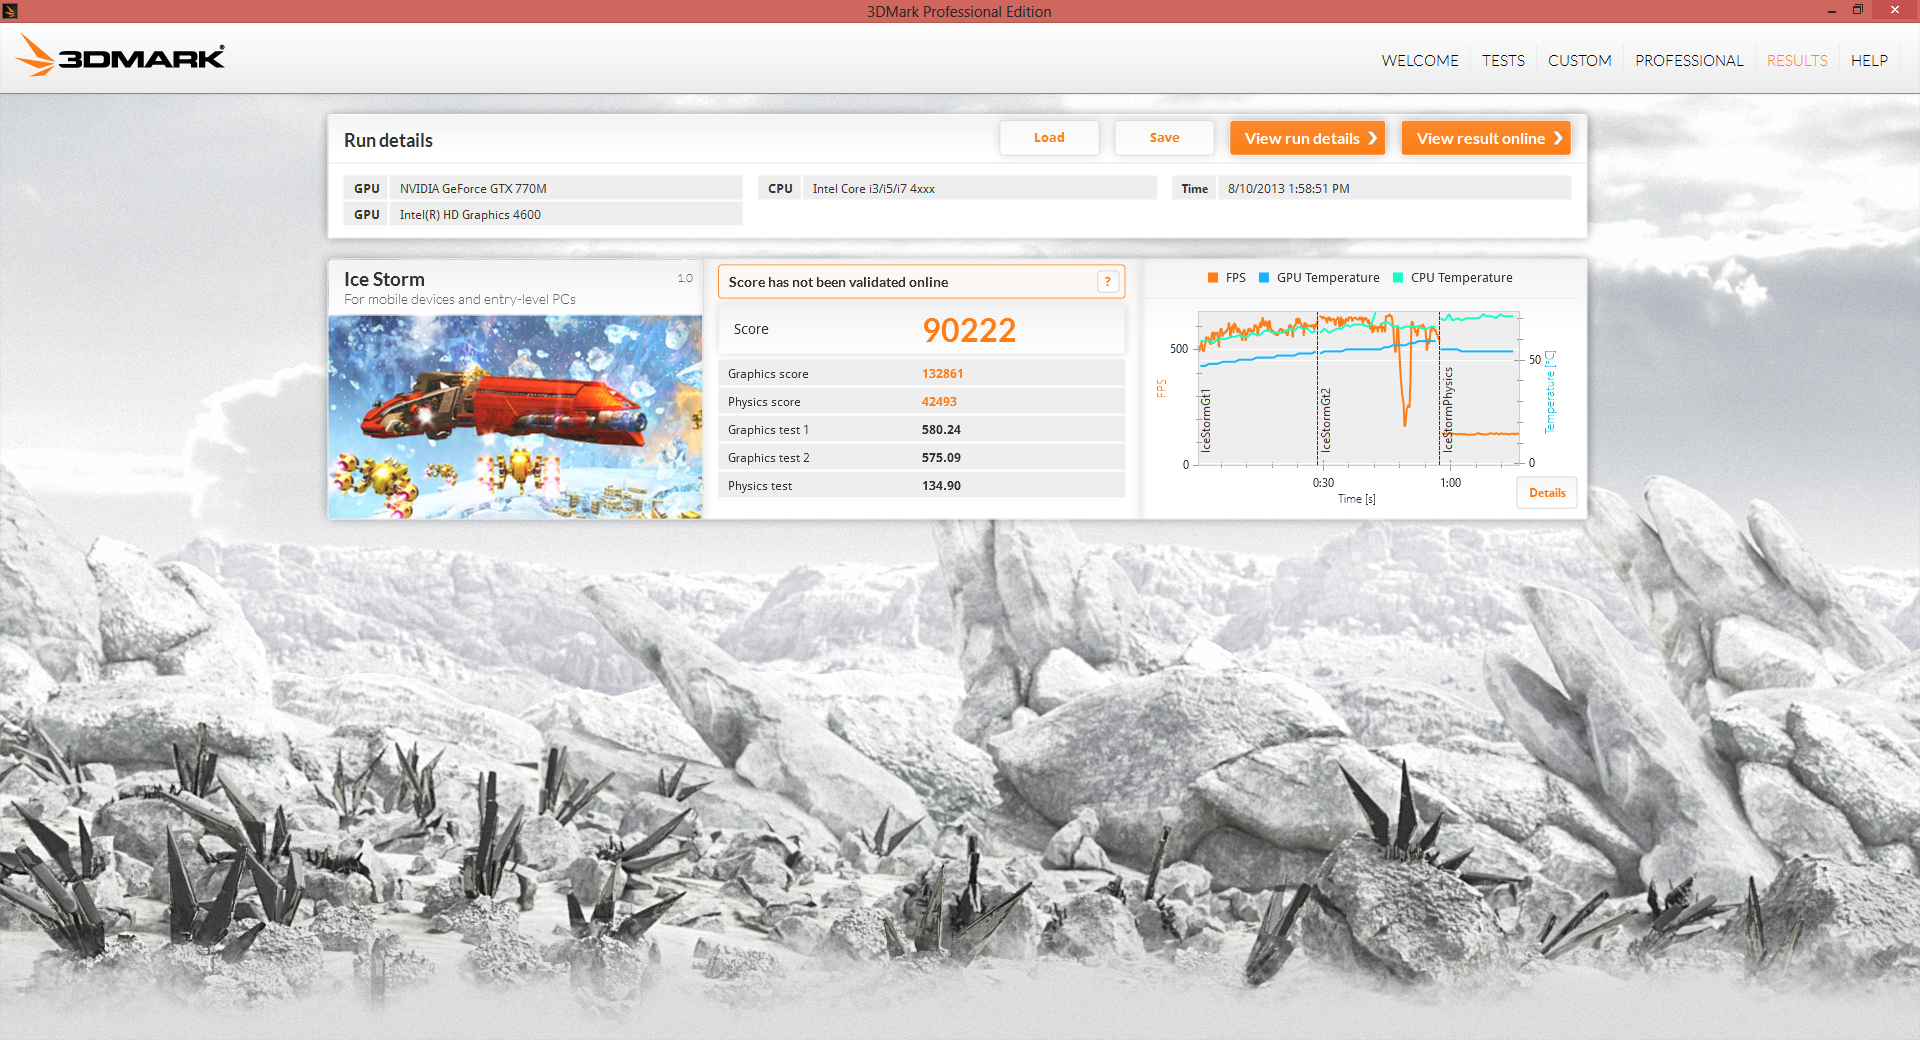
| 3DMark Ice Storm Standard Score | 90222 points | |
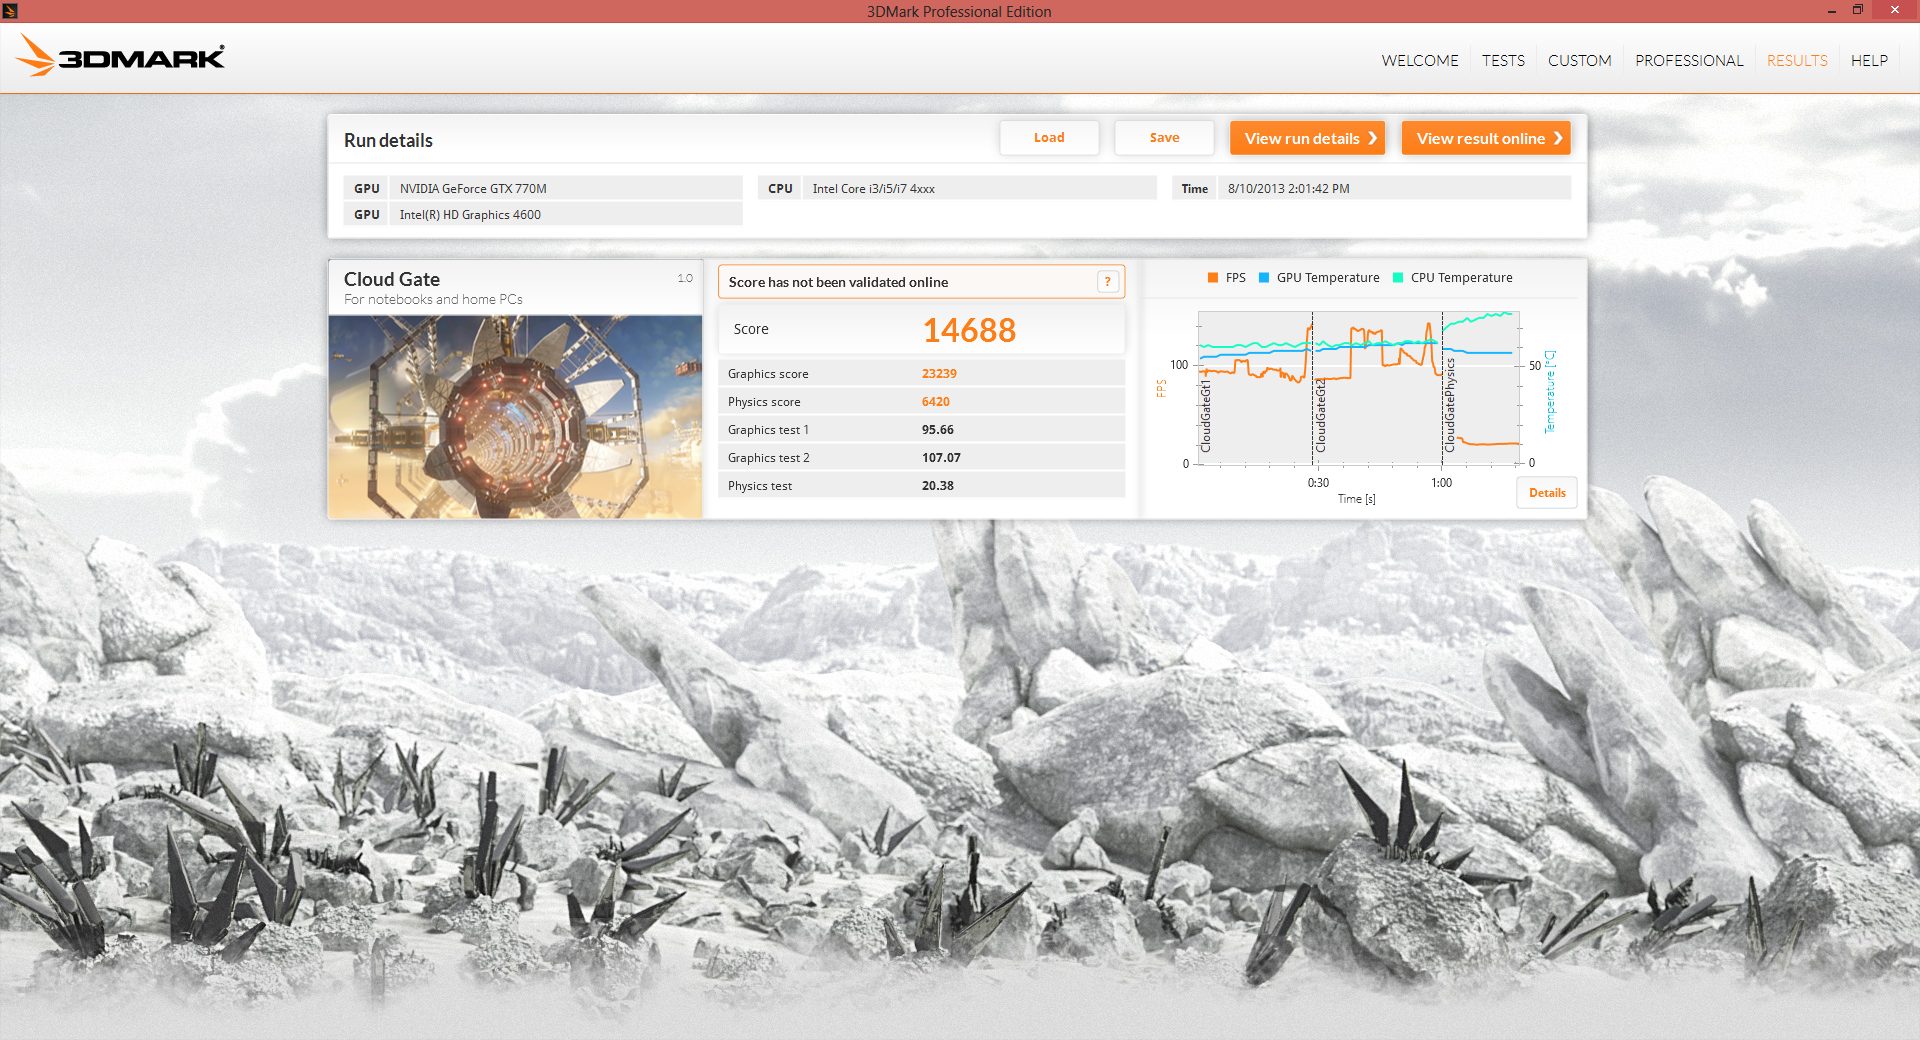
| 3DMark Cloud Gate Standard Score | 14688 points | |
| 3DMark Fire Strike Score | 3028 points | |
| 3DMark Fire Strike Extreme Score | 1498 points | |
Help | ||
Emissions
System Noise
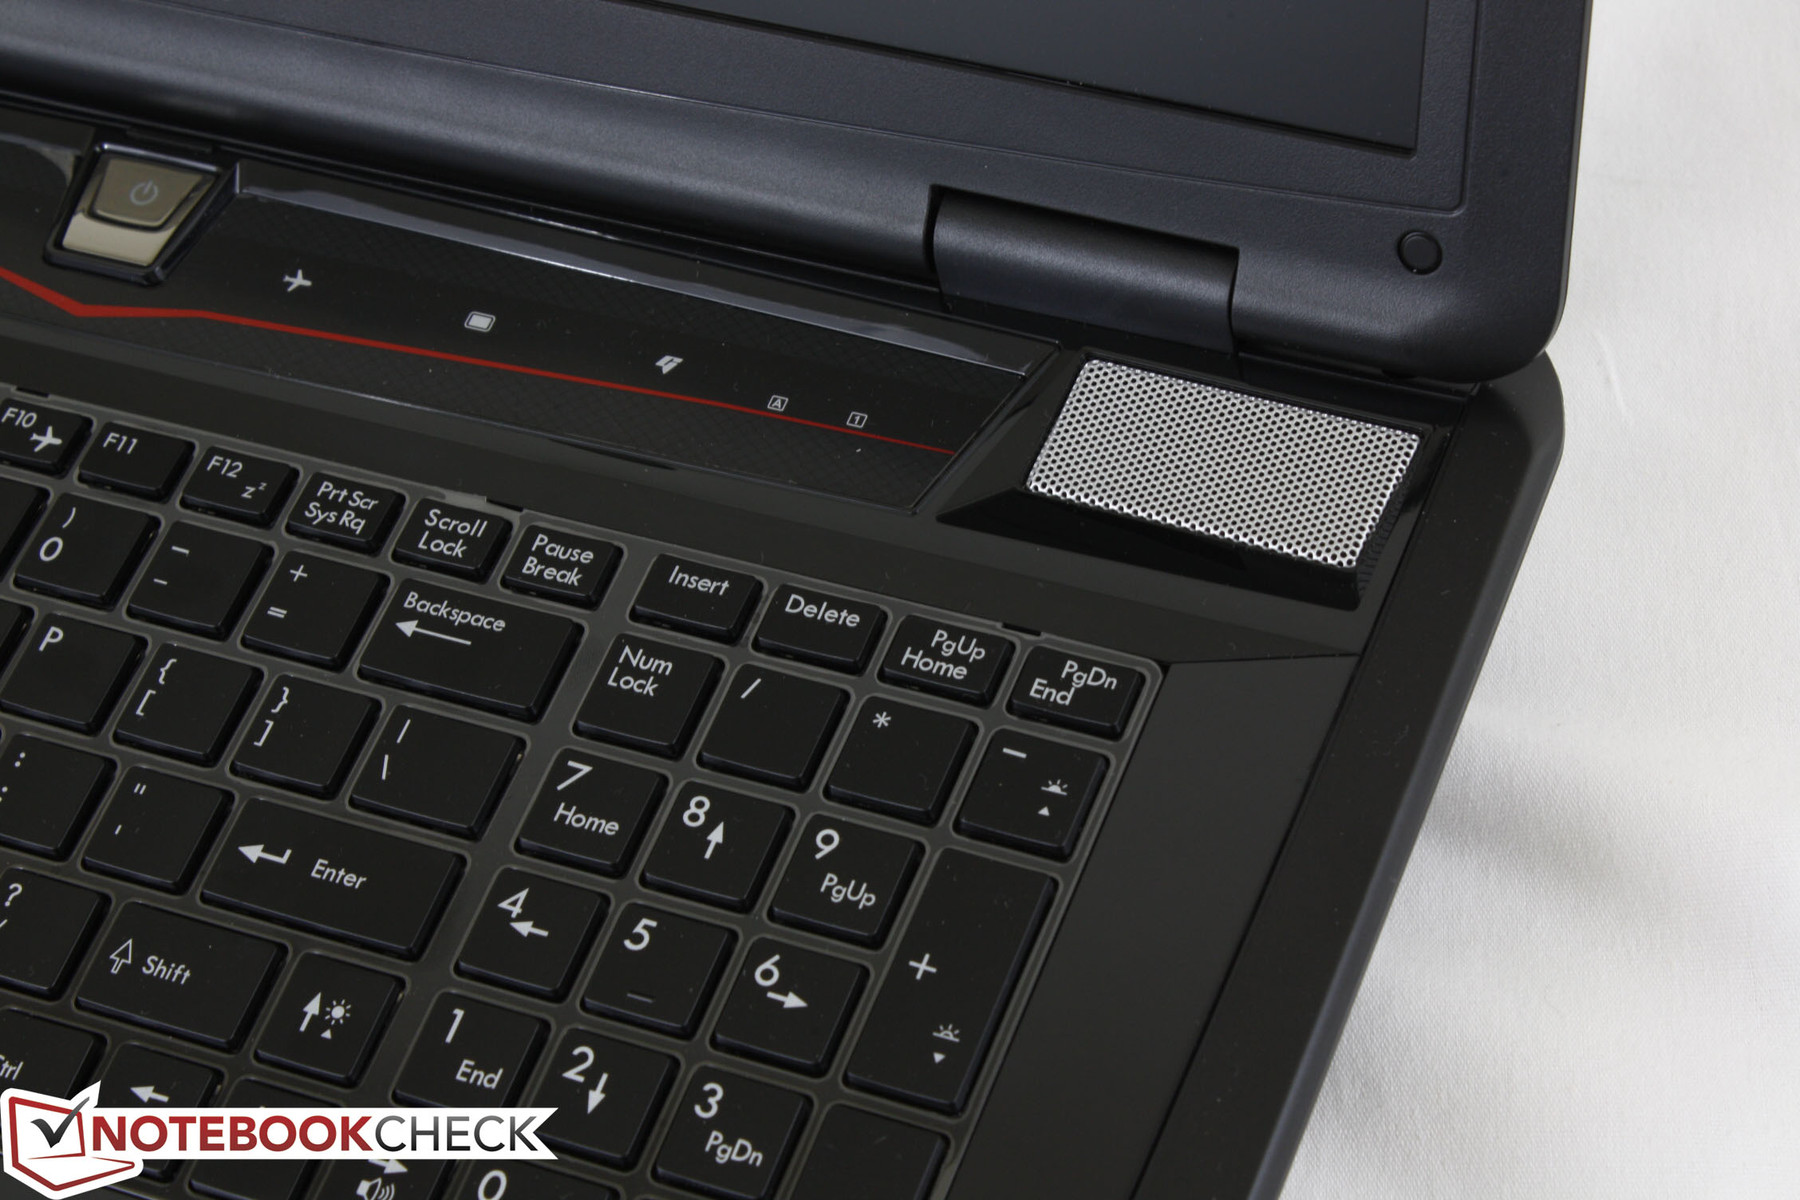
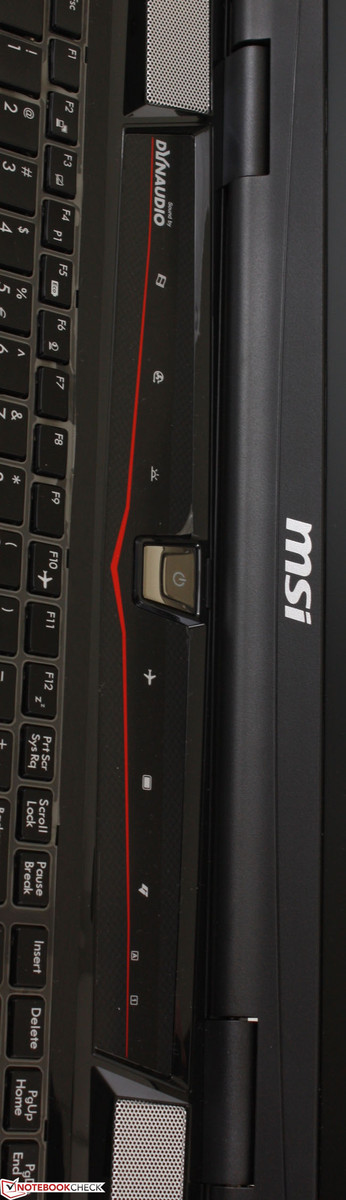
The single 60 mm system fan is responsible for cooling both the CPU and GPU, a setup that differs from a number of DTRs with dual cooling fans such as the Asus ROG models. On the GT70, the fan will always be spinning no matter the current workload and can be audible under quiet conditions. This is different from what we observed on the GT70H, though this may be due to the dissimilar ambient temperatures and really shows how sensitive the system fan can be. Its base sound level of about 37 dB(A) does not change when browsing or during movie playback, but heavier loads will increase fan noise in a stepwise manner from 37 dB(A) to 39.2 dB(A), 45.9 dB(A) and finally 48.3 dB(A) when under sustained maximum CPU and GPU loads.
The manual Turbo Fan function that is shared between the GT60 and GT70 models (and along with most MSI rebrand models) will bump fan noise to a blistering 60.7 dB(A). It’s certainly not a comfortable level, but we appreciate the option as it may come in handy for workstation setups where hours of uninterrupted processing can be common.
Noise Level
| Idle |
| 36.7 / 36.9 / 37.1 dB(A) |
| DVD |
| 40.2 / 51.2 dB(A) |
| Load |
| 45.9 / 48.3 dB(A) |
 | ||
30 dB silent 40 dB(A) audible 50 dB(A) loud |
||
min: | ||
Temperature
Surface temperatures when idle hover close to 30 degrees C on average on both the top and bottom with no areas significantly warmer than others. Under heavy stress, almost all heat concentrate on the corner back quadrant closest to the two vent grilles. This is important as it draws exhaust away from the palm rests and keyboards for more comfortable use during high processing loads. The same results were found on last year’s GT70 model and even the Valkyrie CZ-17, both of which share very similar shells. Needless to say, any objects or cables near the vents should be relocated to prevent air flow impediment and unnecessary heat buildup.
(±) The maximum temperature on the upper side is 44.2 °C / 112 F, compared to the average of 40.4 °C / 105 F, ranging from 21.2 to 68.8 °C for the class Gaming.
(-) The bottom heats up to a maximum of 50.4 °C / 123 F, compared to the average of 43.2 °C / 110 F
(+) In idle usage, the average temperature for the upper side is 29.1 °C / 84 F, compared to the device average of 33.8 °C / 93 F.
(+) The palmrests and touchpad are cooler than skin temperature with a maximum of 30.4 °C / 86.7 F and are therefore cool to the touch.
(±) The average temperature of the palmrest area of similar devices was 28.9 °C / 84 F (-1.5 °C / -2.7 F).
Stress Test
We stressed the notebook and enabled the monitoring tools CPU-Z, GPU-Z and HWiNFO64 in order to identify any instability or throttling issues. With only Prime95 active, the CPU was observed to be operating at its advertised 3.2 GHz speed for four active cores. A minute into the stress test, however, the CPU dropped to the 2.9 GHz to 3.1 GHz range. While still significantly above its base 2.4 GHz speed, the notebook was unable to sustain maximum Turbo Boost under any sort of sustained maximum stress.
With only FurMark active to stress the GPU, the GTX 770M was observed to be running at 836.1 MHz, but will similarly drop and stabilize to a lower 810 MHz speed after a minute or so.
Under full stress conditions (Prime95 and FurMark active simultaneously), the CPU and GPU dropped to 2.8 GHz to 2.9 GHz and 796.9 MHz, respectively. Both processors never dipped below these operating clock rates even after a full hour of stress, thus concluding no throttling issues. The CPU and GPU maintained stability at 92 to 95 degrees C and 83 degrees C, respectively, though the system fan kicked in at noticeably higher RPMs whenever CPU temperatures do reach 95 C. A 3DMark 11 run immediately following the stress test returned no significant drops in final scores.
If running on batteries, the situation becomes similar to what we observed on the Asus G750JW and many other gaming notebooks where GPU performance is stinted even if running on High Performance. On the GT70, the discrete GPU will be running at 405/405 MHz core/memory maximum when on batteries, thus leading to a much lower 3DMark 11 graphics score of 2306 points vs. 4839 points when connected to an outlet. Fortunately, the CPU remains unaffected. Any user intending to run graphics-heavy programs on the notebook should have the system plugged in for optimum performance.


Battery Life
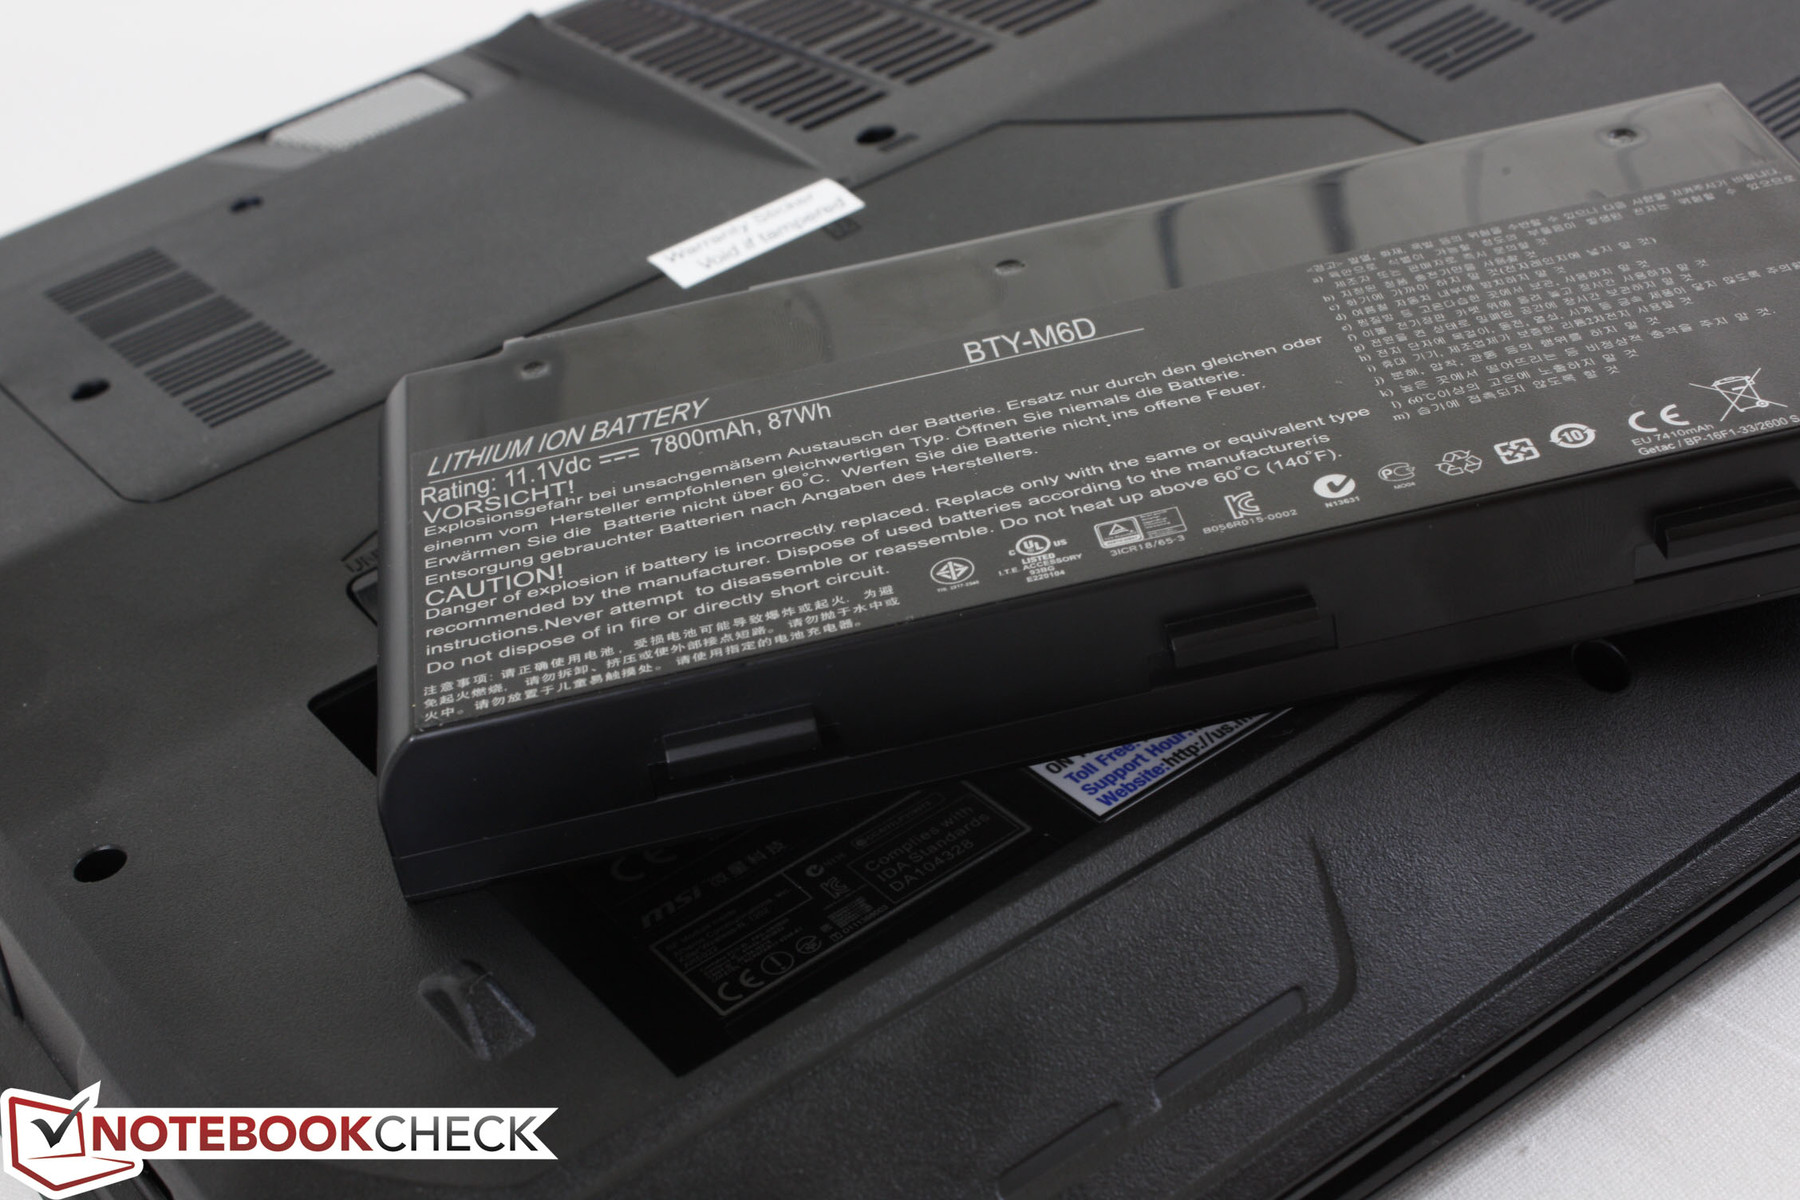
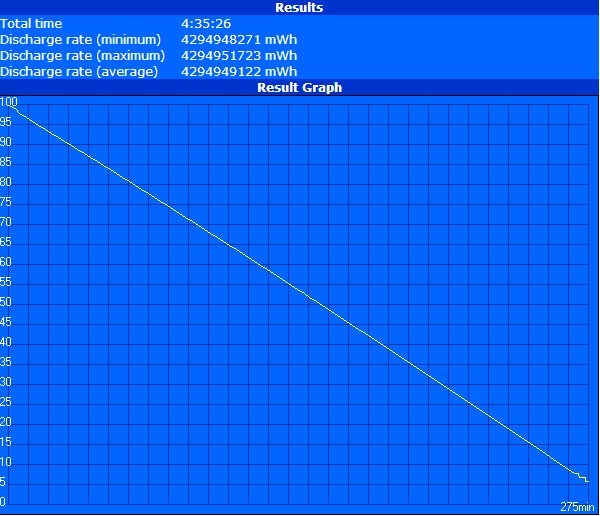
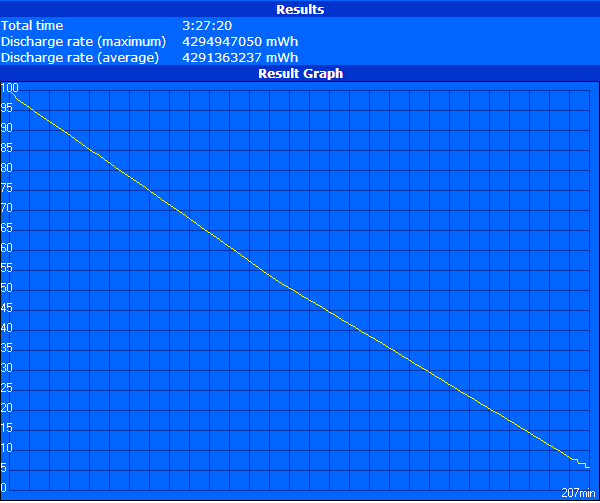
The GT70 uses an 87 Wh removable Li-Ion battery, the same module as found on the MSI GX models and the Valkyrie CZ-17, the latter of which is based on the MSI GT70 shell. Overall, runtimes are somewhat lower than the competition including the G750JW and Valkyrie CZ-17 and not much better than last year’s GT70. Its WLAN runtime of almost 3 hours and 30 minutes, for example, is almost an hour shorter than the iBuyPower model and a bit less than the Asus. Idling runtime (minimum brightness and Power Saver profile with integrated graphics enabled) is short as well at about 4 hours and 30 minutes, so lowering system settings may not stretch battery runtime as much as users would hope for.

Verdict
A common trend amongst gaming DTRs is to provide extremely powerful CPUs and GPUs paired with slower and cheaper 5400 RPM HDDs in order to cut costs and appeal to gamers with smaller budgets. After all, games will still run similarly in terms of FPS and gameplay on an HDD-based system compared to an SSD-based system if all else equal. System and application performance suffer rather appreciably to provide exceptional gaming experiences for lower prices. This may be a fair tradeoff for gamers, but it’s certainly a concept that is harder to swallow for users intending to use the GT70 for both gaming and heavy editing work equally.
For $1499, the GT70 as reviewed is still an attractive option for its easily accessible and upgradeable hardware. With that said, it’s a bit unfortunate that users must break the warranty seal just to access the RAM or HDD underneath. Buyers can certainly enjoy the gaming prowess of the system out-of-the-box, but we recommend updating the 5400 RPM HDD or even adding a secondary drive sometime down the line for longer legs to improve system performance.
| StarCraft II: Heart of the Swarm | |
| 1920x1080 Ultra / Extreme AA:on (sort by value) | |
| MSI GT70 2OC-065US | |
| Ibuypower Valkyrie CZ 17 | |
| Ibuypower Valkyrie CZ-15 | |
| Asus G750JW | |
| 1366x768 High AA:on (sort by value) | |
| MSI GT70 2OC-065US | |
| Ibuypower Valkyrie CZ 17 | |
| Ibuypower Valkyrie CZ-15 | |
| Asus G750JW | |
| 1366x768 Medium (sort by value) | |
| MSI GT70 2OC-065US | |
| Ibuypower Valkyrie CZ 17 | |
| Asus G750JW | |
| Guild Wars 2 | |
| 1920x1080 All Maximum / On AA:FX (sort by value) | |
| MSI GT70 2OC-065US | |
| Ibuypower Valkyrie CZ 17 | |
| Ibuypower Valkyrie CZ-15 | |
| MSI GT70H-80M4811B | |
| Asus G750JW | |
| 1366x768 Best Appearance Preset AA:FX (sort by value) | |
| MSI GT70 2OC-065US | |
| Ibuypower Valkyrie CZ 17 | |
| Ibuypower Valkyrie CZ-15 | |
| Asus G750JW | |
| Sleeping Dogs | |
| 1920x1080 Extreme Preset AA:Extreme (sort by value) | |
| MSI GT70 2OC-065US | |
| Ibuypower Valkyrie CZ 17 | |
| Ibuypower Valkyrie CZ-15 | |
| MSI GT70H-80M4811B | |
| Asus G750JW | |
| 1366x768 High Preset AA:High (sort by value) | |
| MSI GT70 2OC-065US | |
| Ibuypower Valkyrie CZ 17 | |
| Ibuypower Valkyrie CZ-15 | |
| Asus G750JW | |
| 1366x768 Medium Preset AA:Normal (sort by value) | |
| MSI GT70 2OC-065US | |
| Ibuypower Valkyrie CZ 17 | |
| Asus G750JW | |
| Tomb Raider | |
| 1920x1080 Ultra Preset AA:FX AF:16x (sort by value) | |
| MSI GT70 2OC-065US | |
| Ibuypower Valkyrie CZ 17 | |
| Ibuypower Valkyrie CZ-15 | |
| MSI GT70H-80M4811B | |
| Asus G750JW | |
| 1366x768 High Preset AA:FX AF:8x (sort by value) | |
| MSI GT70 2OC-065US | |
| Ibuypower Valkyrie CZ 17 | |
| Ibuypower Valkyrie CZ-15 | |
| Asus G750JW | |
| 1366x768 Normal Preset AA:FX AF:4x (sort by value) | |
| MSI GT70 2OC-065US | |
| Ibuypower Valkyrie CZ 17 | |
| Asus G750JW | |
| BioShock Infinite | |
| 1920x1080 Ultra Preset, DX11 (DDOF) (sort by value) | |
| MSI GT70 2OC-065US | |
| Ibuypower Valkyrie CZ 17 | |
| Ibuypower Valkyrie CZ-15 | |
| MSI GT70H-80M4811B | |
| Asus G750JW | |
| 1366x768 High Preset (sort by value) | |
| MSI GT70 2OC-065US | |
| Ibuypower Valkyrie CZ 17 | |
| Ibuypower Valkyrie CZ-15 | |
| Asus G750JW | |
| 1366x768 Medium Preset (sort by value) | |
| MSI GT70 2OC-065US | |
| Ibuypower Valkyrie CZ 17 | |
| Asus G750JW | |
| The Elder Scrolls V: Skyrim | |
| 1920x1080 Ultra Preset AA:8x AF:16x (sort by value) | |
| MSI GT70 2OC-065US | |
| Ibuypower Valkyrie CZ 17 | |
| Ibuypower Valkyrie CZ-15 | |
| MSI GT70H-80M4811B | |
| Asus G750JW | |
| 1366x768 High Preset AA:8x AF:8x (sort by value) | |
| MSI GT70 2OC-065US | |
| Ibuypower Valkyrie CZ 17 | |
| Ibuypower Valkyrie CZ-15 | |
| Asus G750JW | |
| 1366x768 Medium Preset AA:4x (sort by value) | |
| MSI GT70 2OC-065US | |
| Ibuypower Valkyrie CZ 17 | |
| Asus G750JW | |
| Call of Duty: Black Ops 2 | |
| 1920x1080 (Extra) High / On, FXAA AA:4xMS (sort by value) | |
| MSI GT70 2OC-065US | |
| Ibuypower Valkyrie CZ 17 | |
| Ibuypower Valkyrie CZ-15 | |
| MSI GT70H-80M4811B | |
| Asus G750JW | |
| 1366x768 High / On, FXAA AA:2xMS (sort by value) | |
| MSI GT70 2OC-065US | |
| Ibuypower Valkyrie CZ 17 | |
| Ibuypower Valkyrie CZ-15 | |
| Asus G750JW | |
| 1366x768 Medium / Off (sort by value) | |
| MSI GT70 2OC-065US | |
| Ibuypower Valkyrie CZ 17 | |
| Asus G750JW | |
| Company of Heroes 2 | |
| 1920x1080 Maximum / Higher / High AA:High (sort by value) | |
| MSI GT70 2OC-065US | |
| Ibuypower Valkyrie CZ-15 | |
| 1366x768 High AA:Medium (sort by value) | |
| MSI GT70 2OC-065US | |
| Ibuypower Valkyrie CZ-15 | |
| 1366x768 Medium AA:Off (sort by value) | |
| MSI GT70 2OC-065US | |