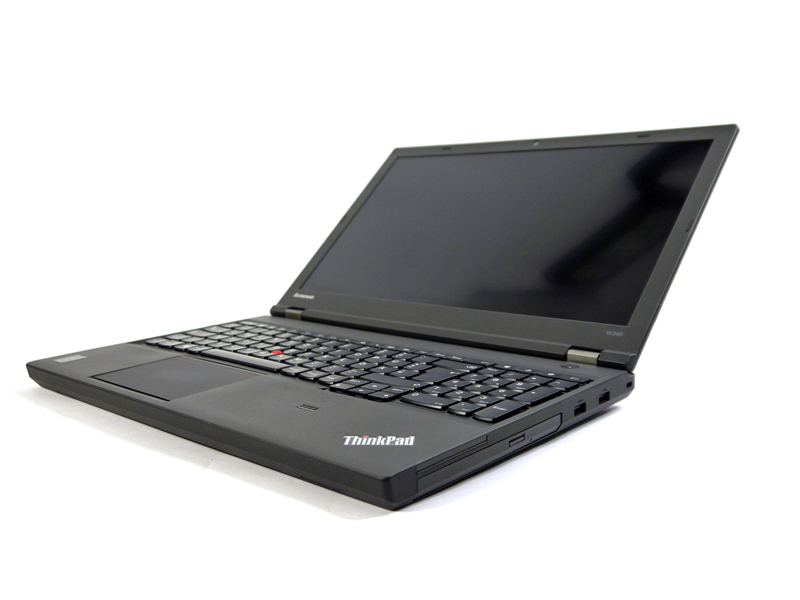
Review Update Lenovo ThinkPad W540 20BG001BGE Workstation
For the original German review, see here.
The Lenovo ThinkPad W540 belongs to those notebook models eagerly awaited by many users. So, we had many requests prior to our review. The big interest would be reason enough for an update review, but we also wanted to look again at some negative aspects of the first test sample.
We review a model with Intel Core i7-4800MQ CPU, 8 GB RAM, 256 GB SSD, Nvidia Quadro K 2100M graphics, Full HD display, and color sensor in this update review. Notebooksandmore upgraded the Lenovo with a Solid-State Drive since a model pre-configured like that was not available at the time of testing. The price of the base model with 500 GB hard drive is about 1700 Euros (~$2348); the Solid- State Drive would add about 200 Euros (~$276).
The update review only covers essential differences to the already reviewed ThinkPad W540. Please refer to the standard test for aspects not covered here.
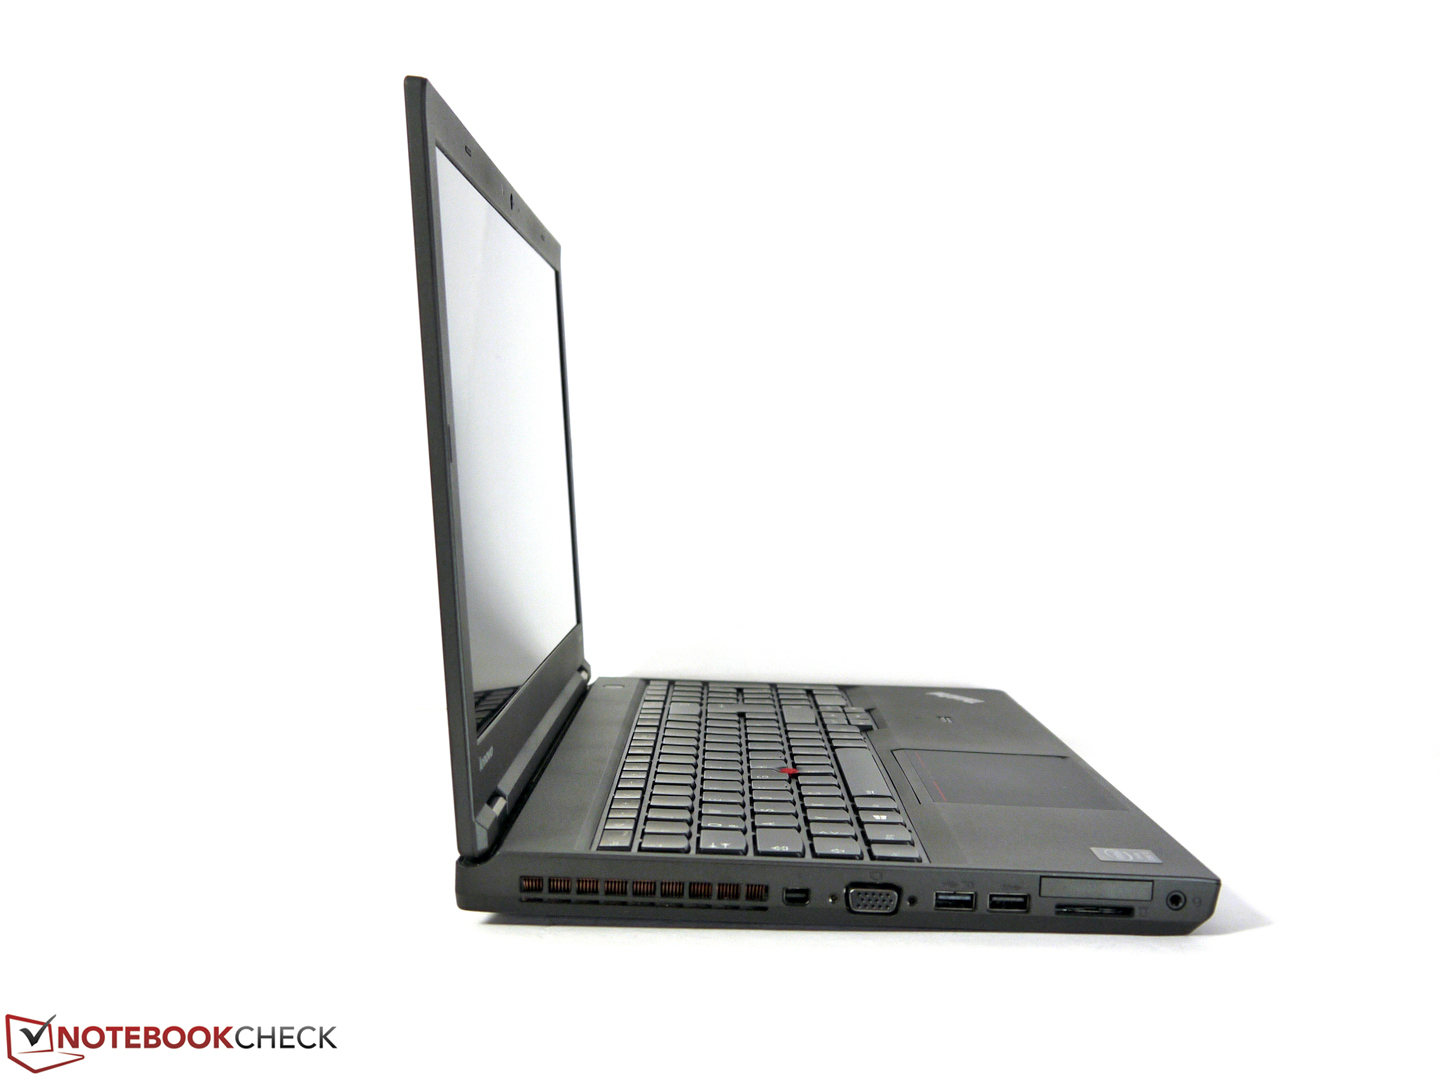
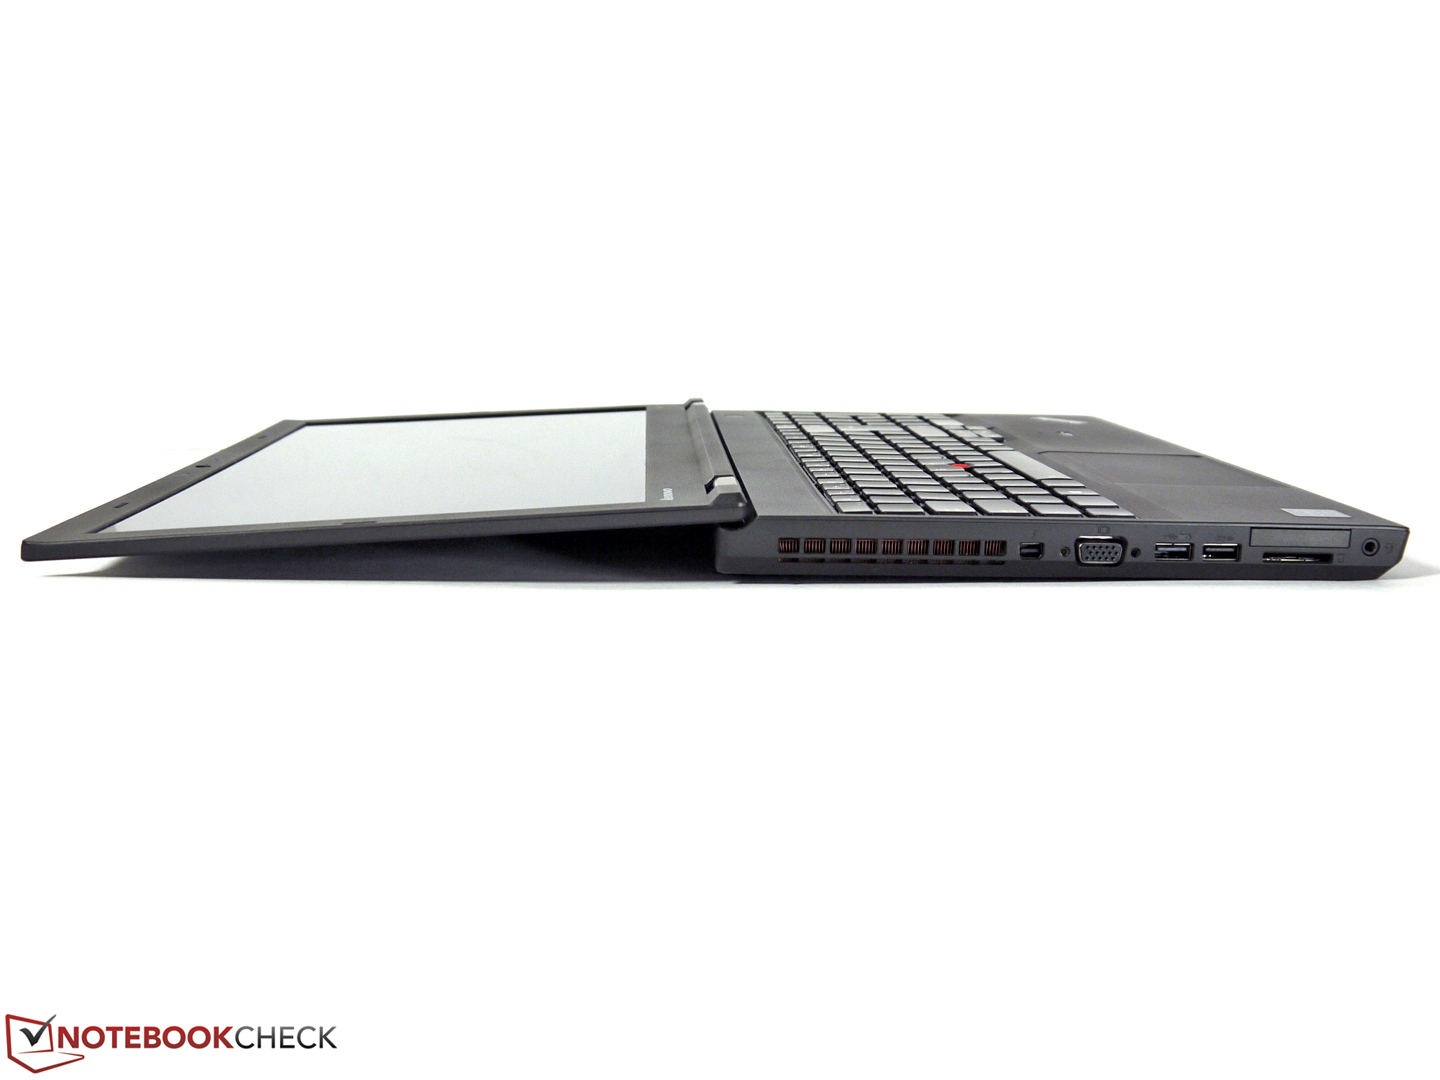
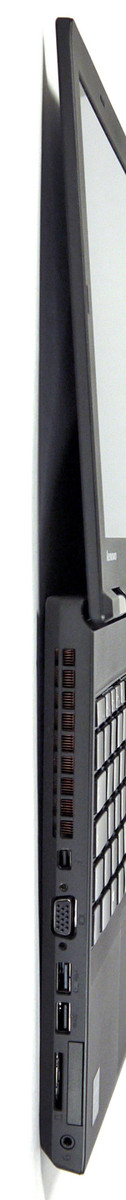
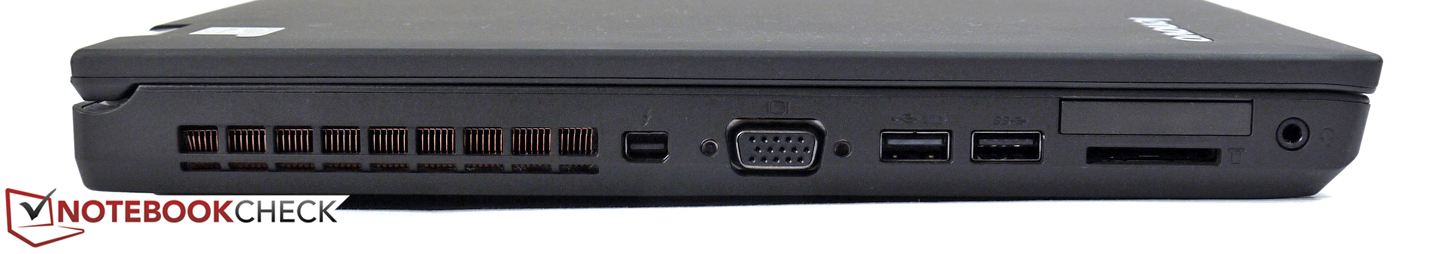
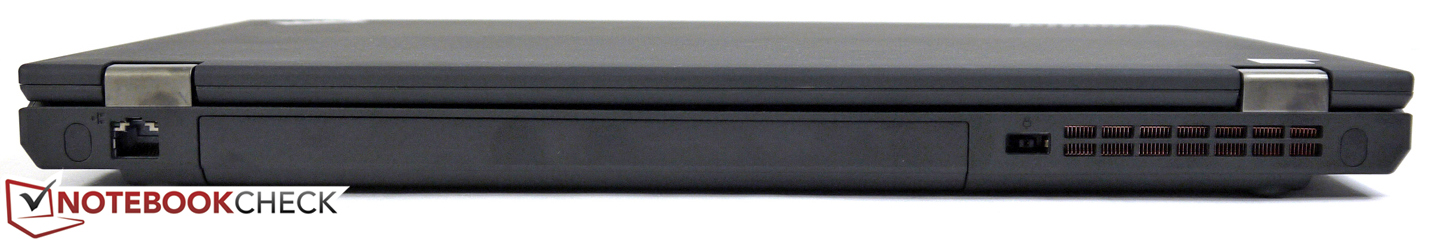
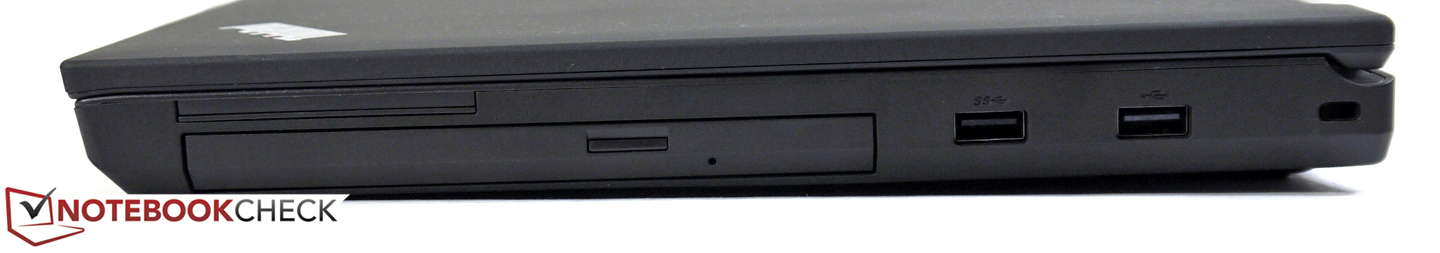
Connectivity
Input Devices
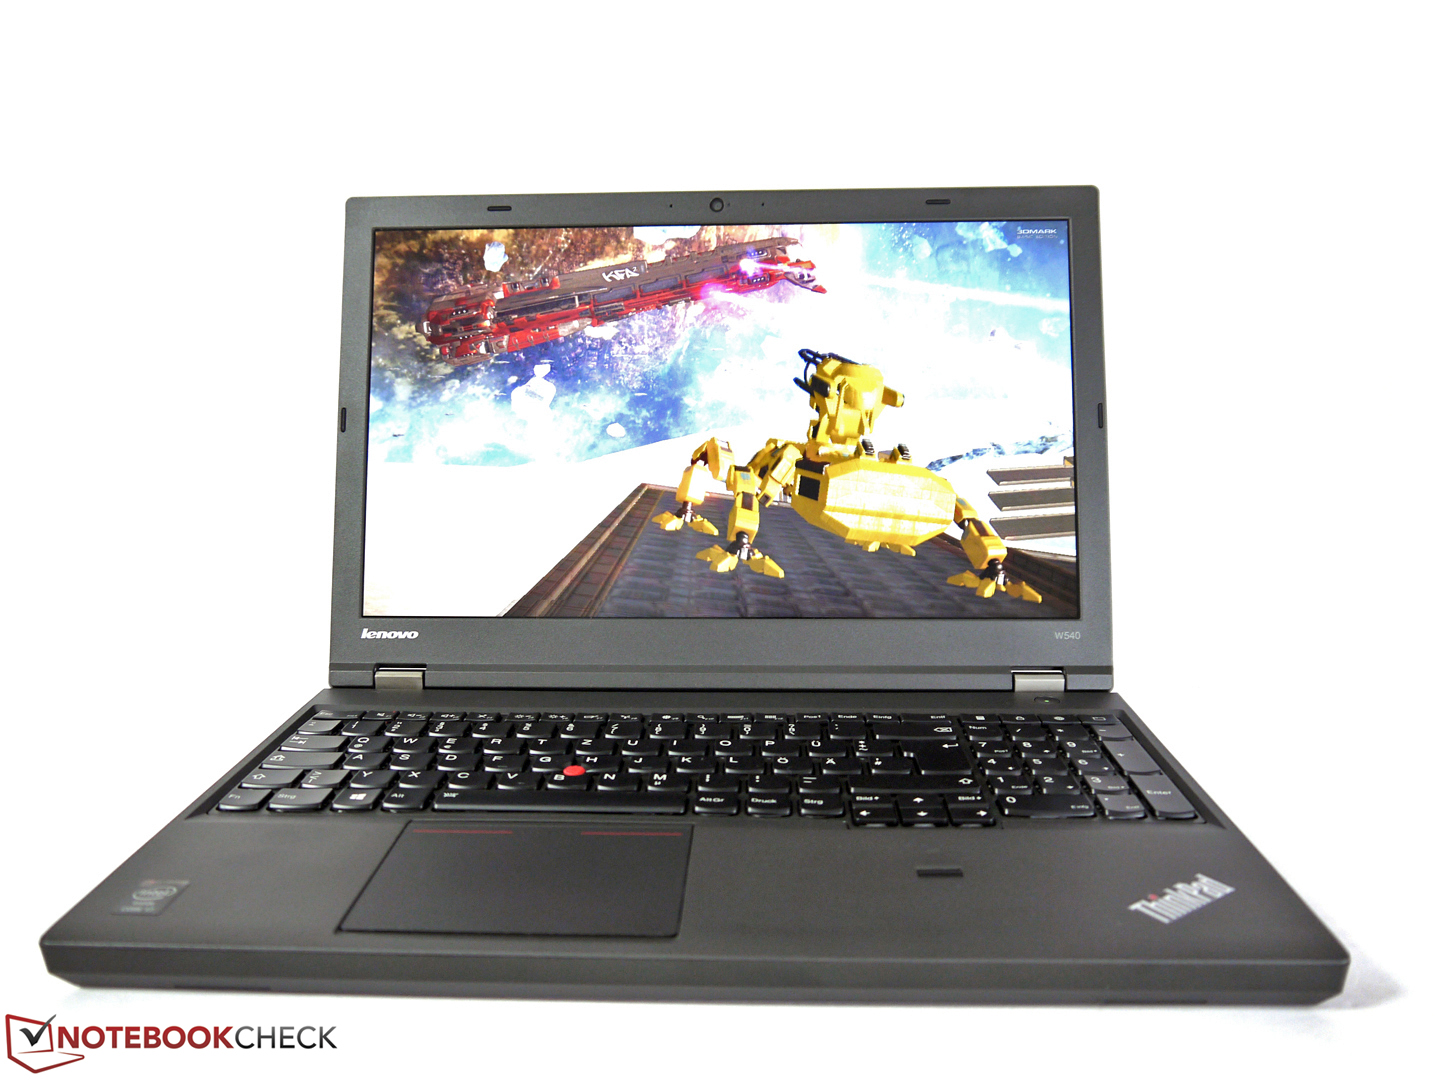
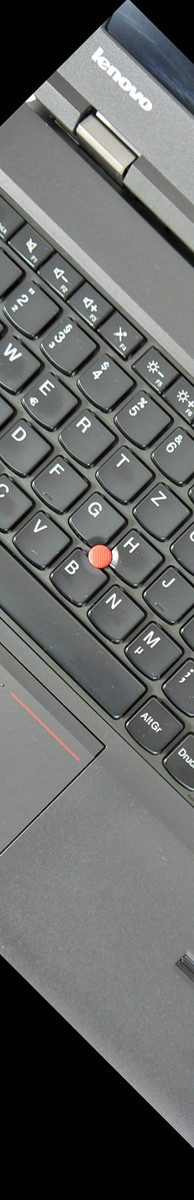
Keyboard & Touchpad
Our review unit does not face the keyboard problems of the first unit. Everything works as expected. Prolific writers will appreciate the solid keyboard bed, the good pressure point, the pleasant stroke and the rather quiet tapping. The review unit does not have issues with notchy keys on the left side, so this was an isolated incidence of the first test sample.
The first review unit also had more issues with the touchpad than usual. It did not work at all in the bottom corners. The new review unit does not have this problem and slightly makes up for the odd ClickPad concept without dedicated touchpad / TrackPoint buttons.
Display
A Full HD panel is offered as an alternative to the 3k display. Although it would not be our first choice, we wanted our second test model to feature it since we had many requests regarding which would be the better choice. The specs listed on Lenovo's data sheet are rather disappointing. It is a TN display (3k: IPS) with a specified brightness of 300 cd/m² (3k: 350 cd/m²) and a contrast of 500:1 (3k: 1000:1). The resolution is as usual 1920x1080 pixels, which gives a popular 16:9 format. We already reviewed the same kind of display in the ThinkPad S531 and S540.
| |||||||||||||||||||||||||
Brightness Distribution: 85 %
Center on Battery: 270 cd/m²
Contrast: 340:1 (Black: 0.802 cd/m²)
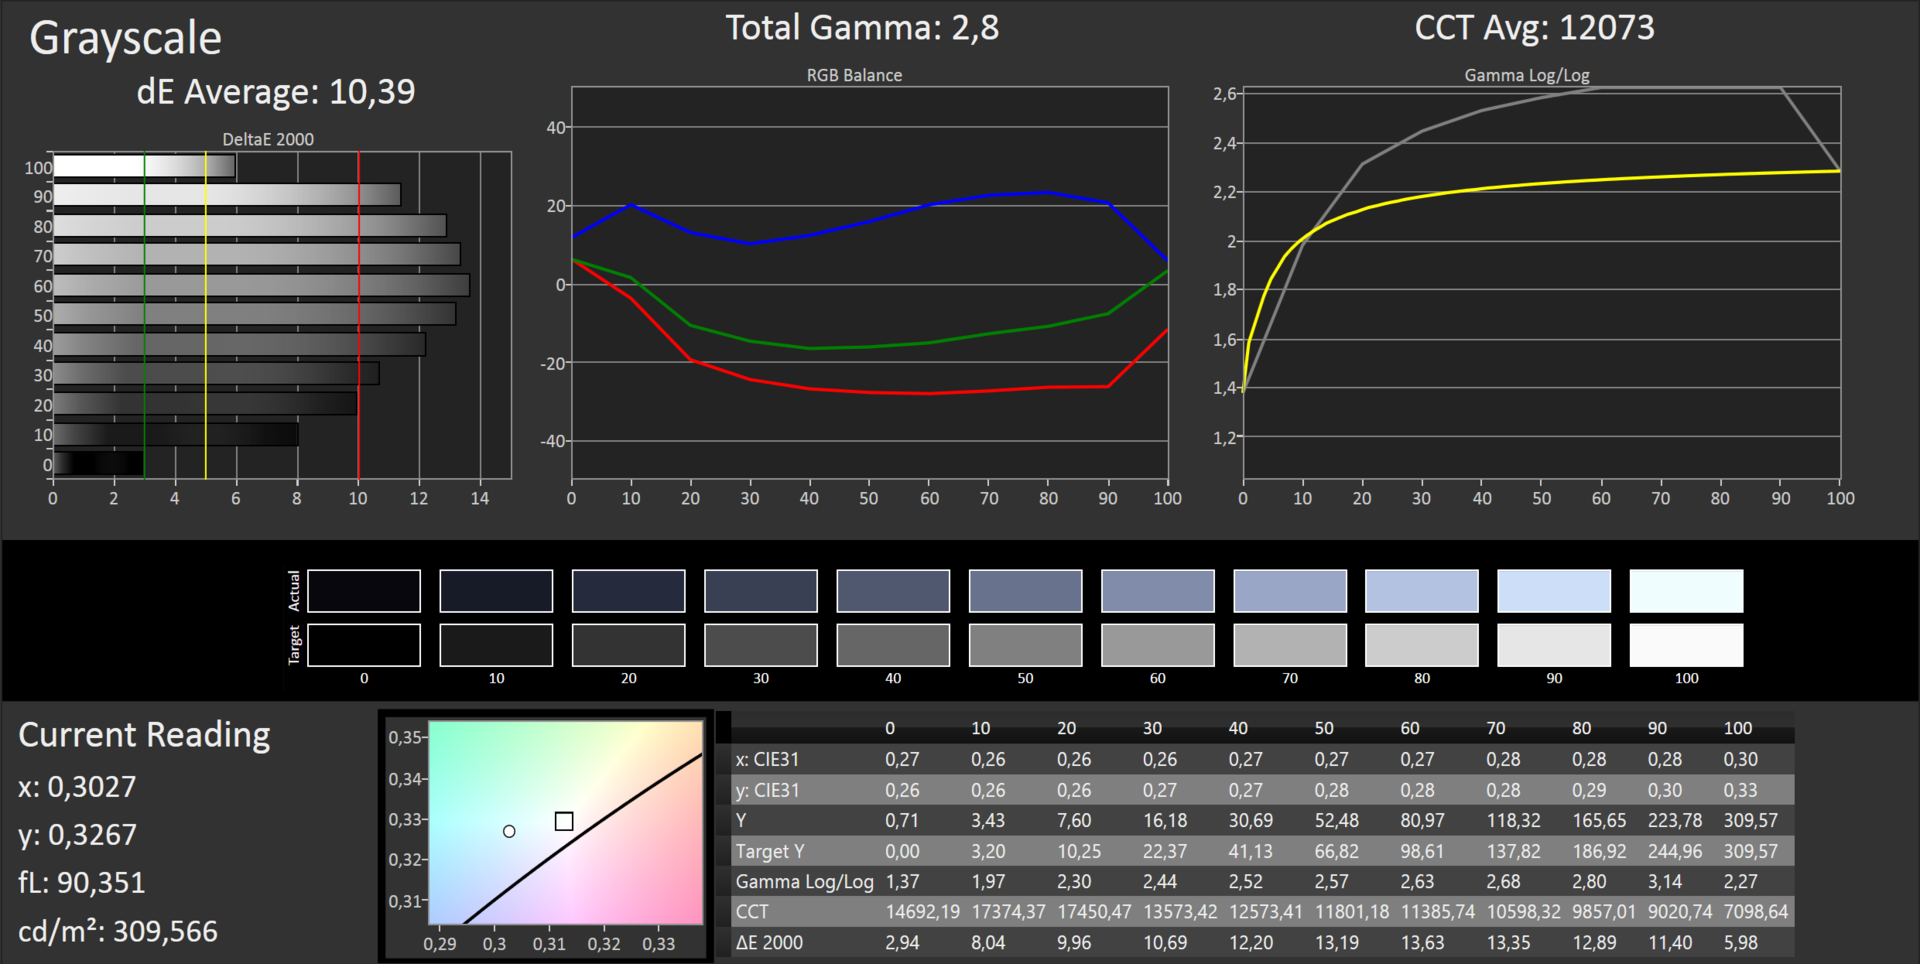
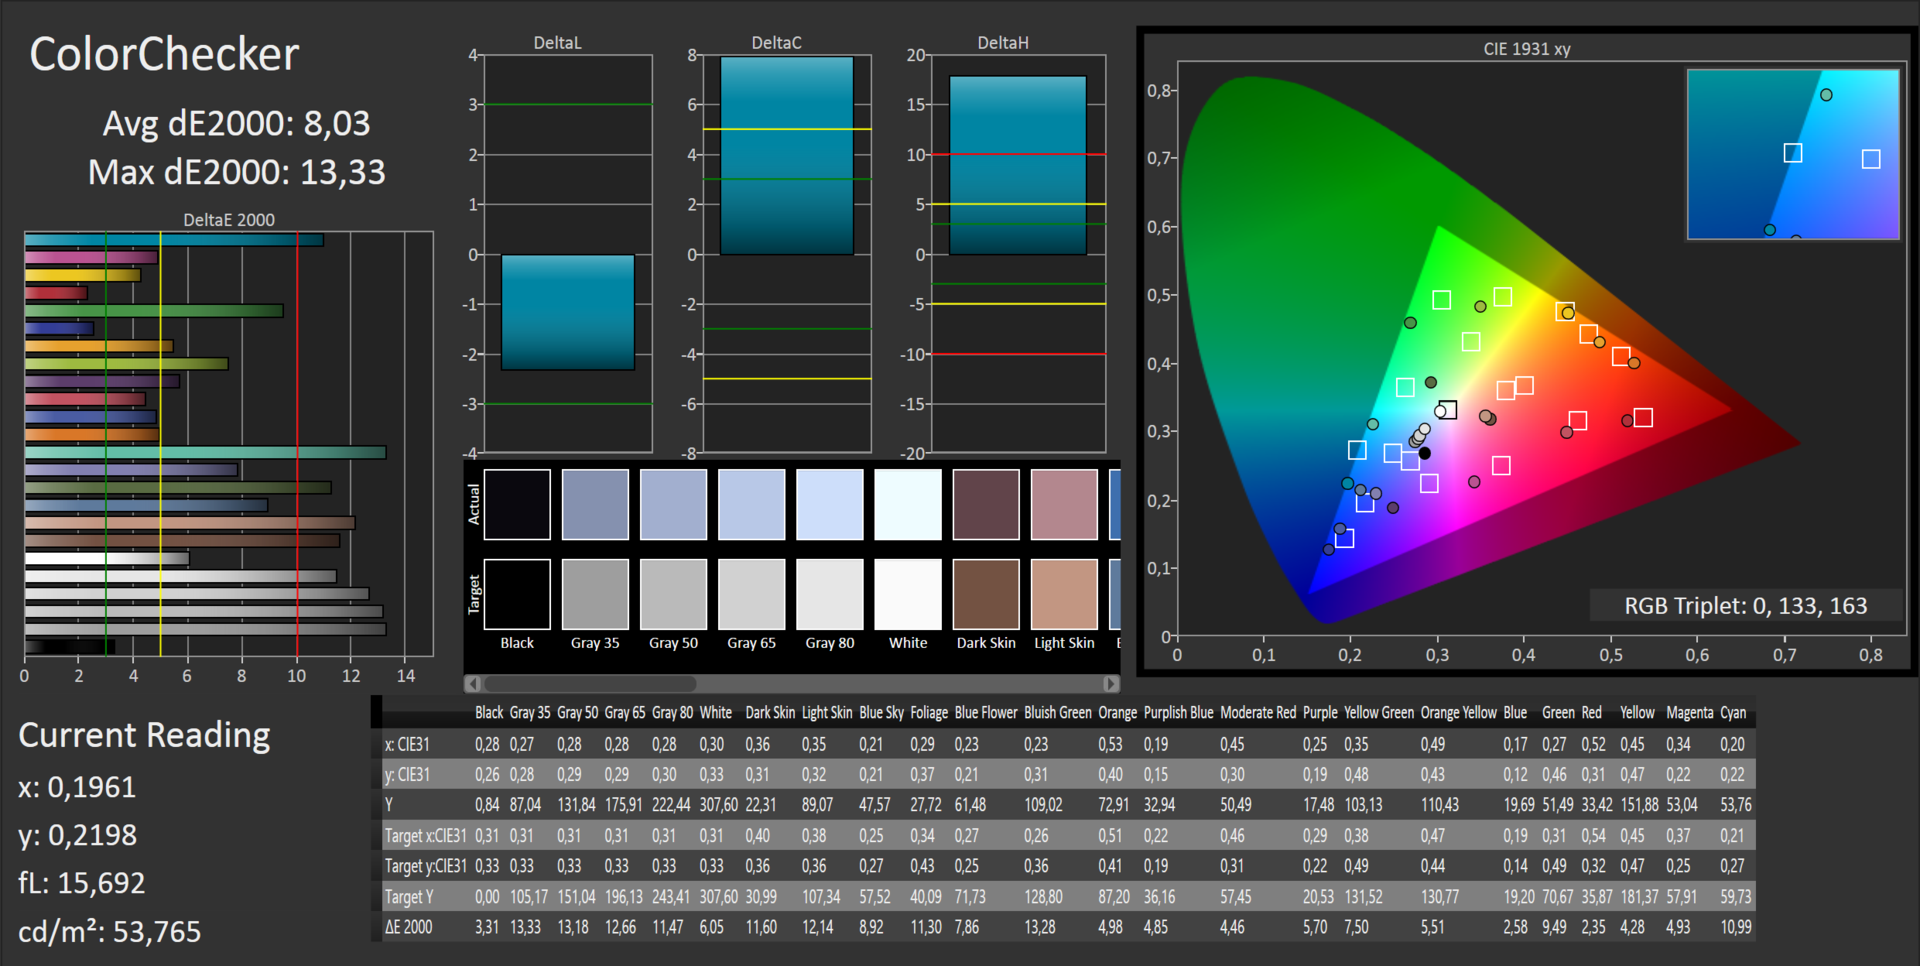
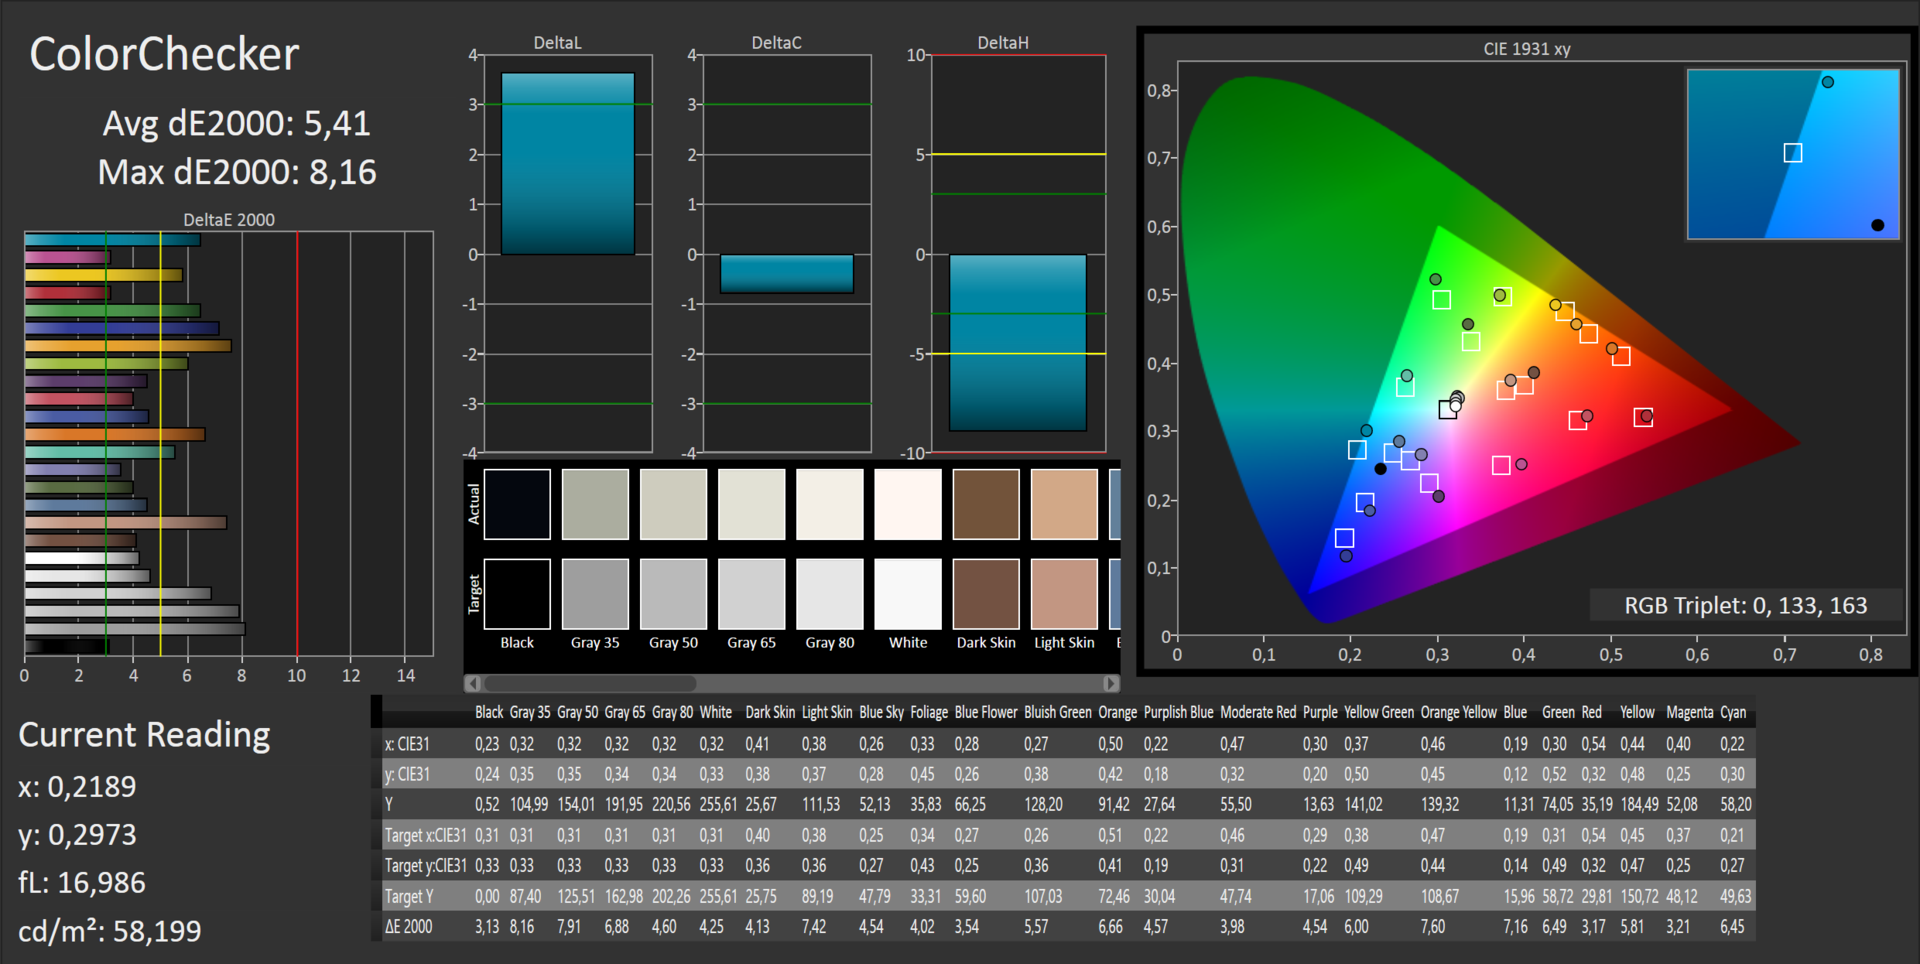
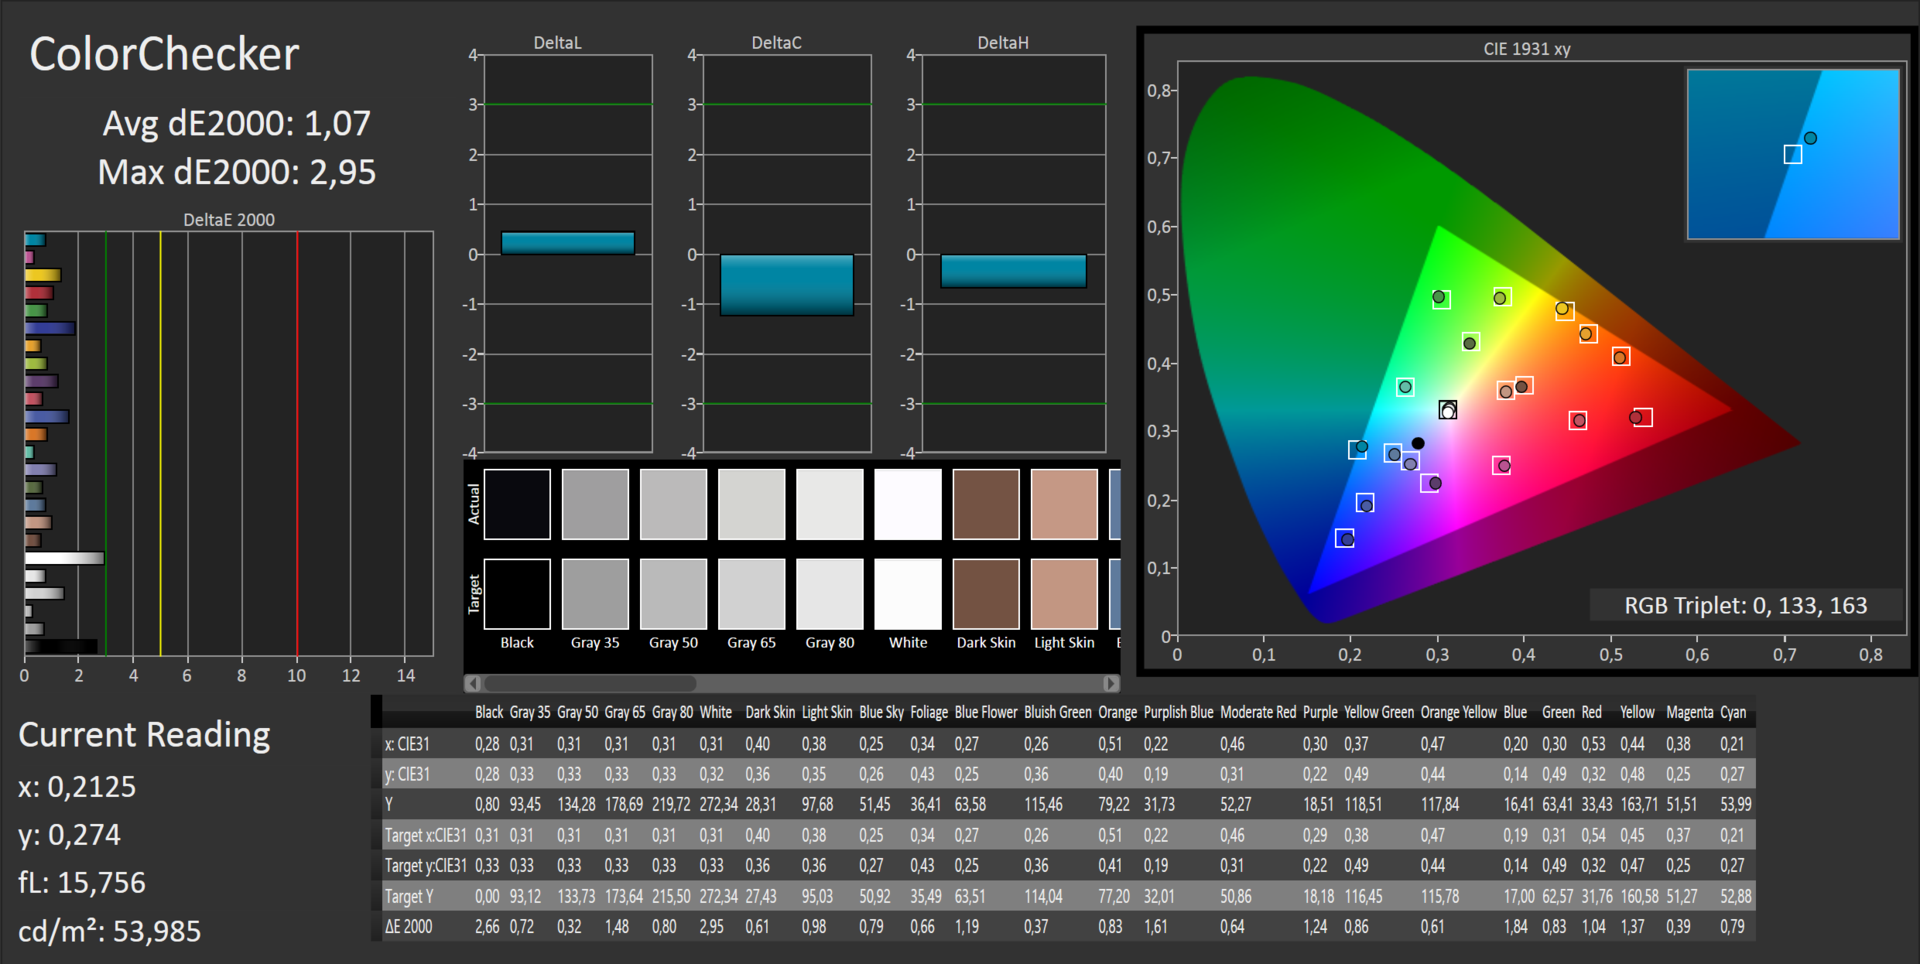
ΔE ColorChecker Calman: 8.03 | ∀{0.5-29.43 Ø4.77}
ΔE Greyscale Calman: 10.39 | ∀{0.09-98 Ø5}
60% AdobeRGB 1998 (Argyll 1.6.3 3D)
58.8% AdobeRGB 1998 (Argyll 3D)
82.1% sRGB (Argyll 3D)
56.9% Display P3 (Argyll 3D)
Gamma: 2.8
CCT: 12073 K
The measured brightness ranges from 243 cd/m² to 287 cd/m². We measured a brightness of 161 cd/m² at level 13. The contrast is 340:1 and so, not that good. Colors look dull and black parts of images appear washed out. This difference to the 3k display is apparent.
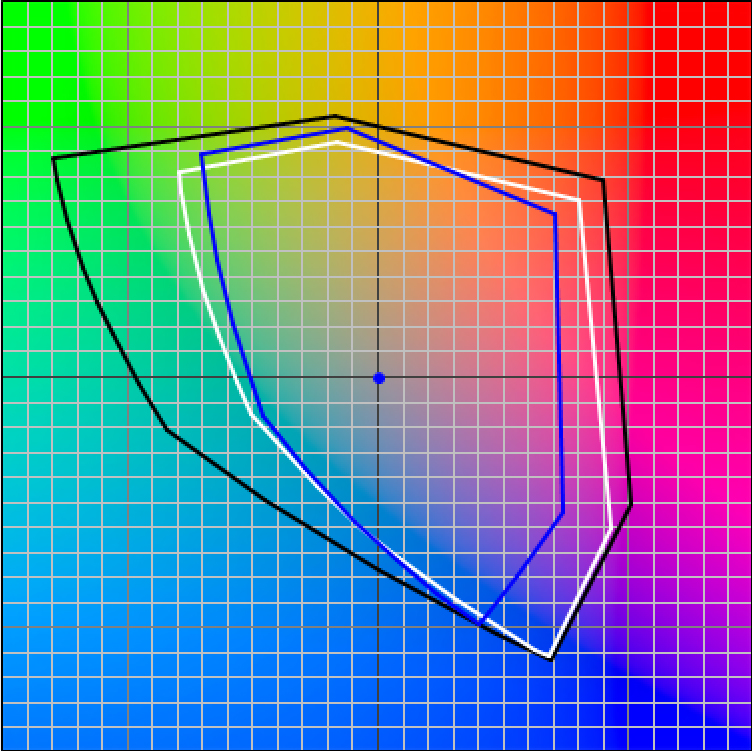
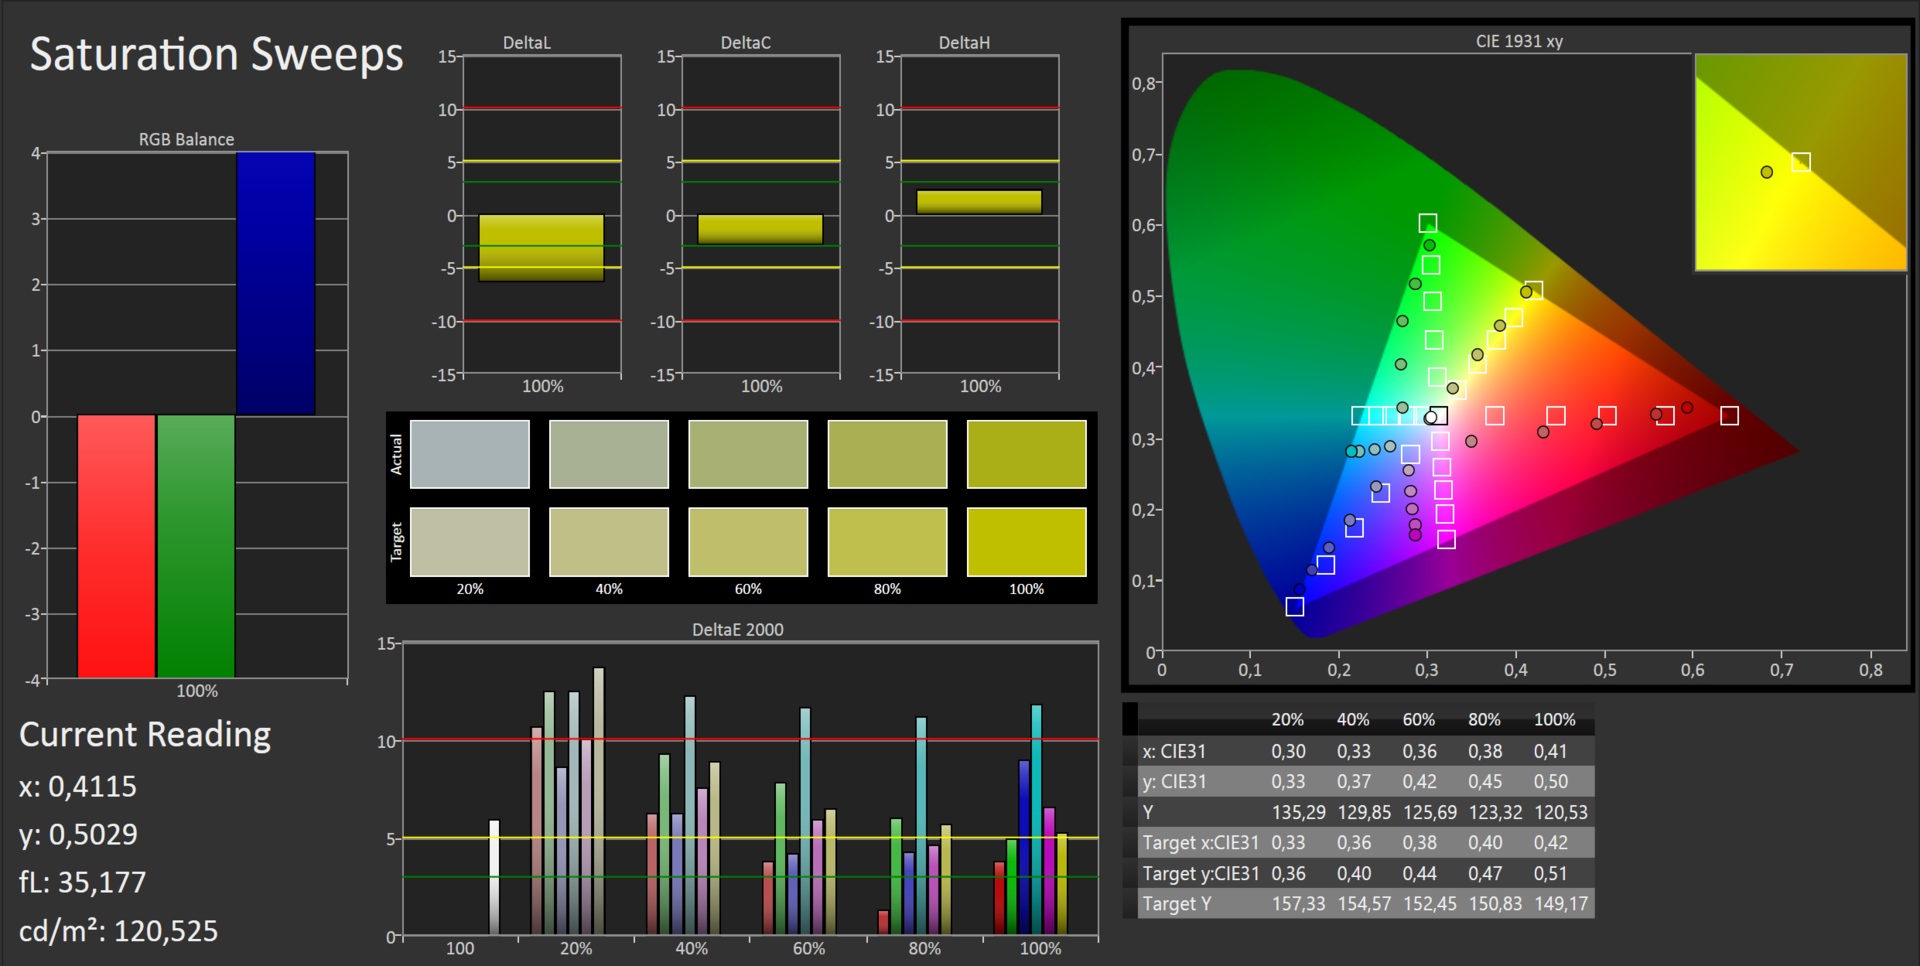
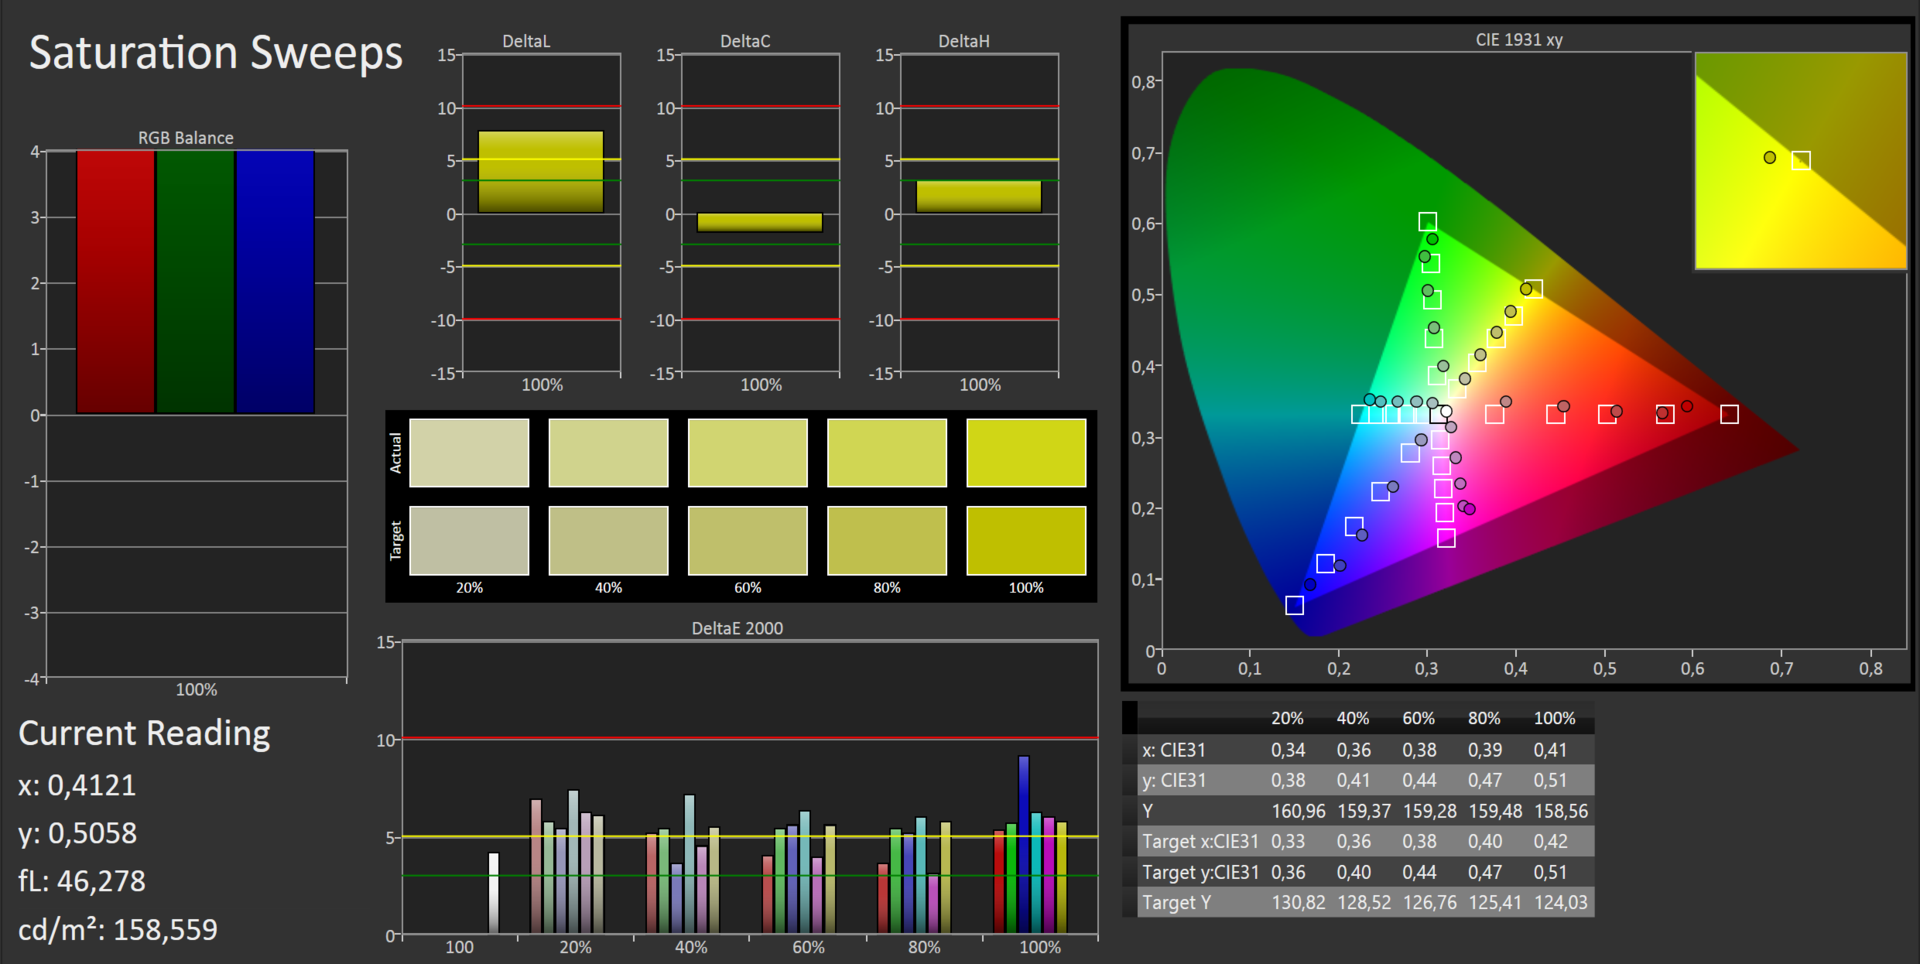
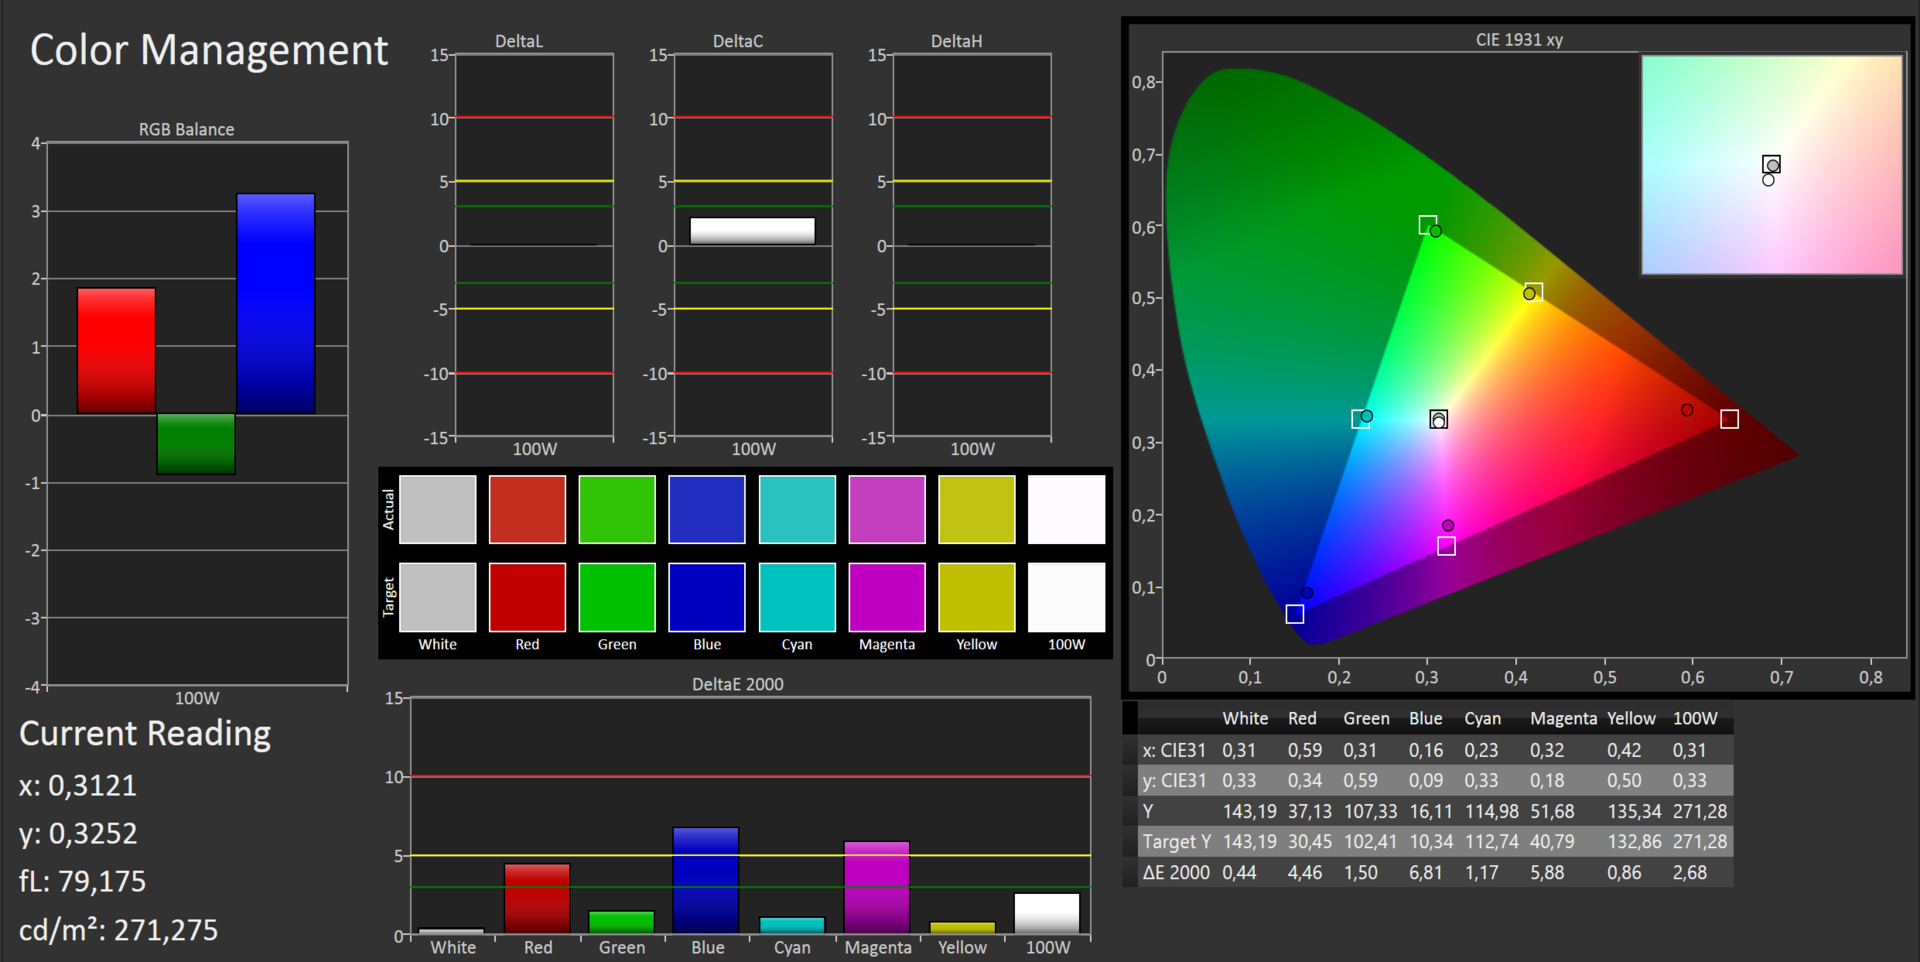
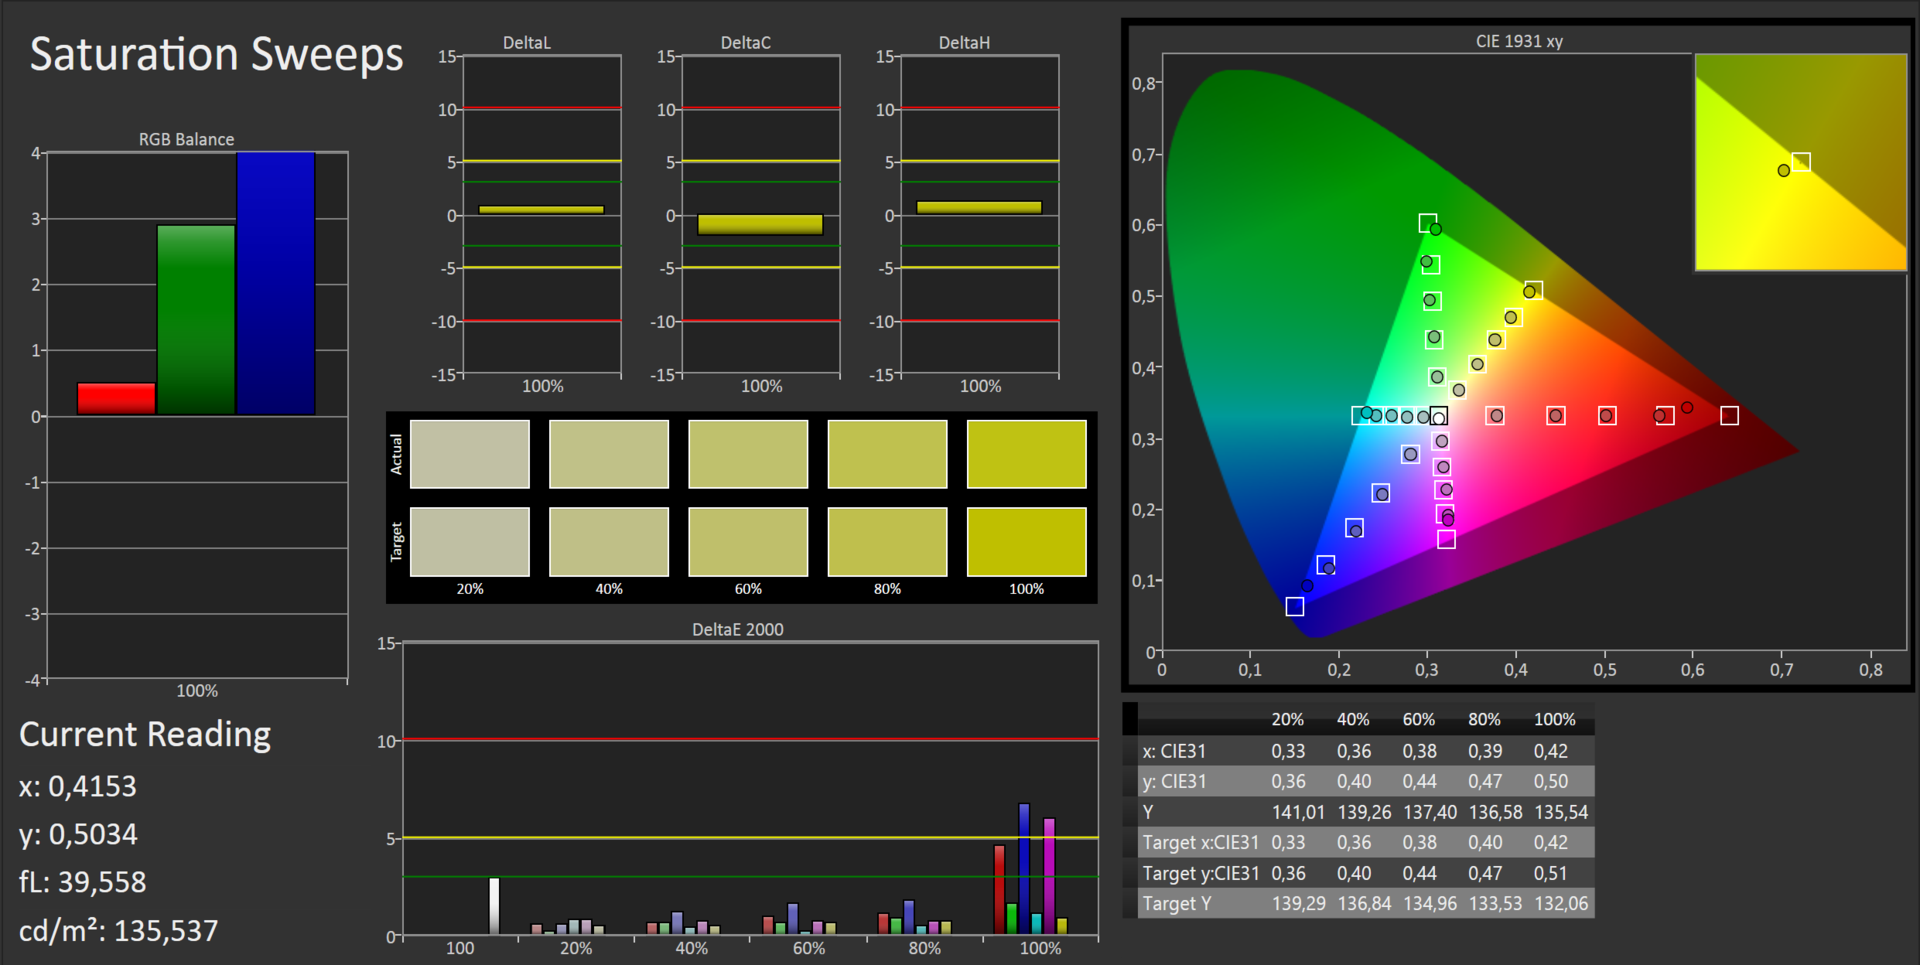
The color coverage is also worse. The display covers about 80% of sRGB. The deviation from the ideal also has an impact on color precision. The deviations are rather big in factory state. Calibration does not improve blue and magenta too much. With a DeltaE 2000 of 6.8 and 5.9 after calibration, the differences remain too big for tasks requiring accurate colors. Mixed colors perform better. Weaker base colors can be well balanced. This gives a very good average DeltaE 2000 of 1.07. Gray levels, gamma curve and RGB balance are also good.
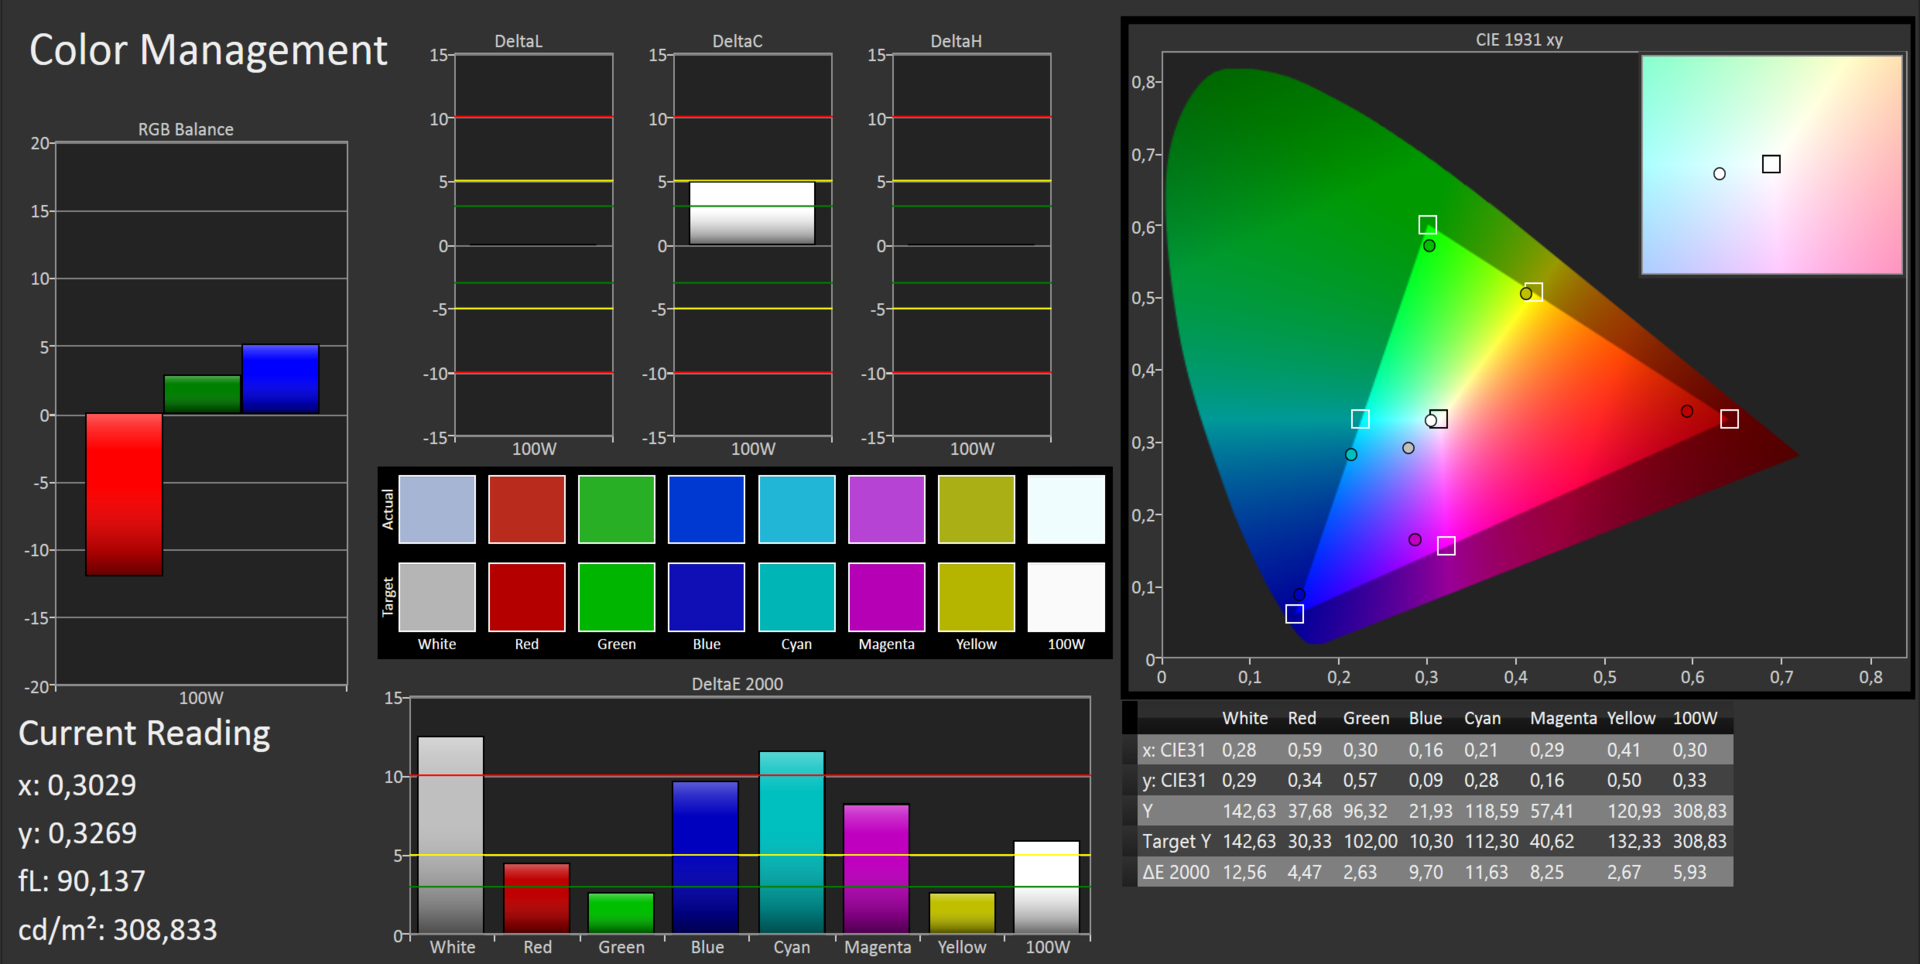
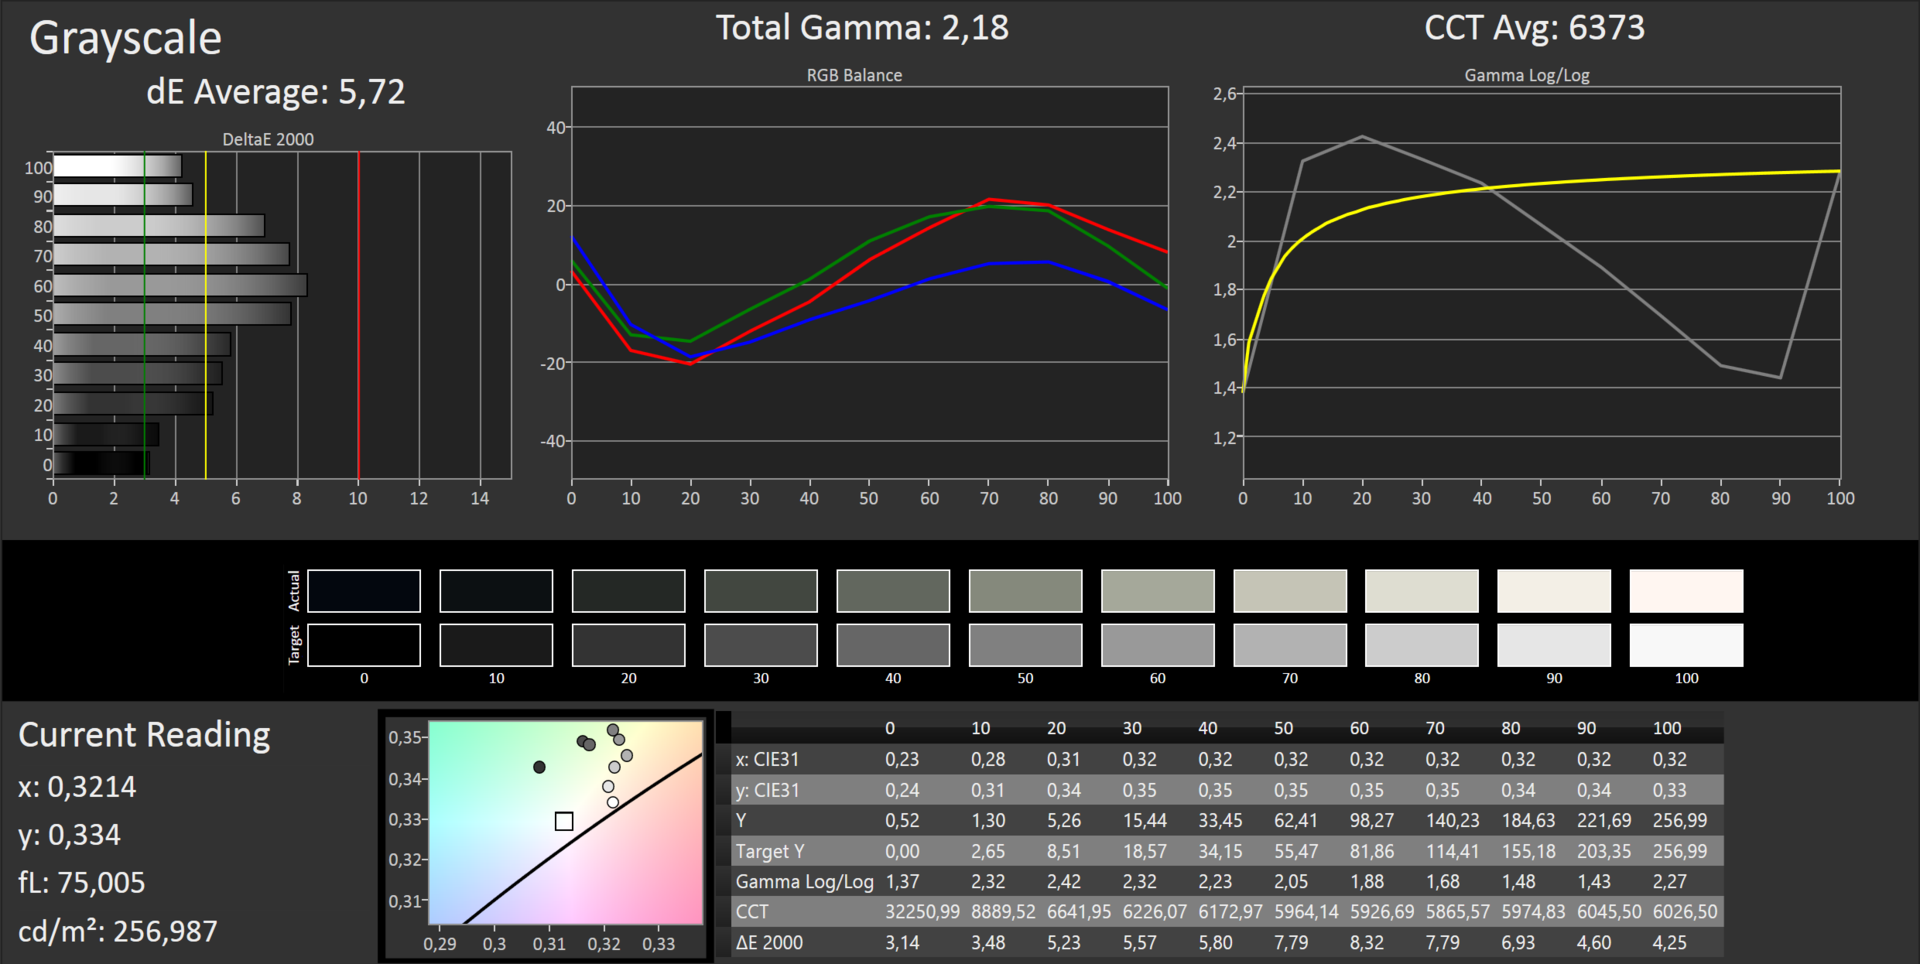
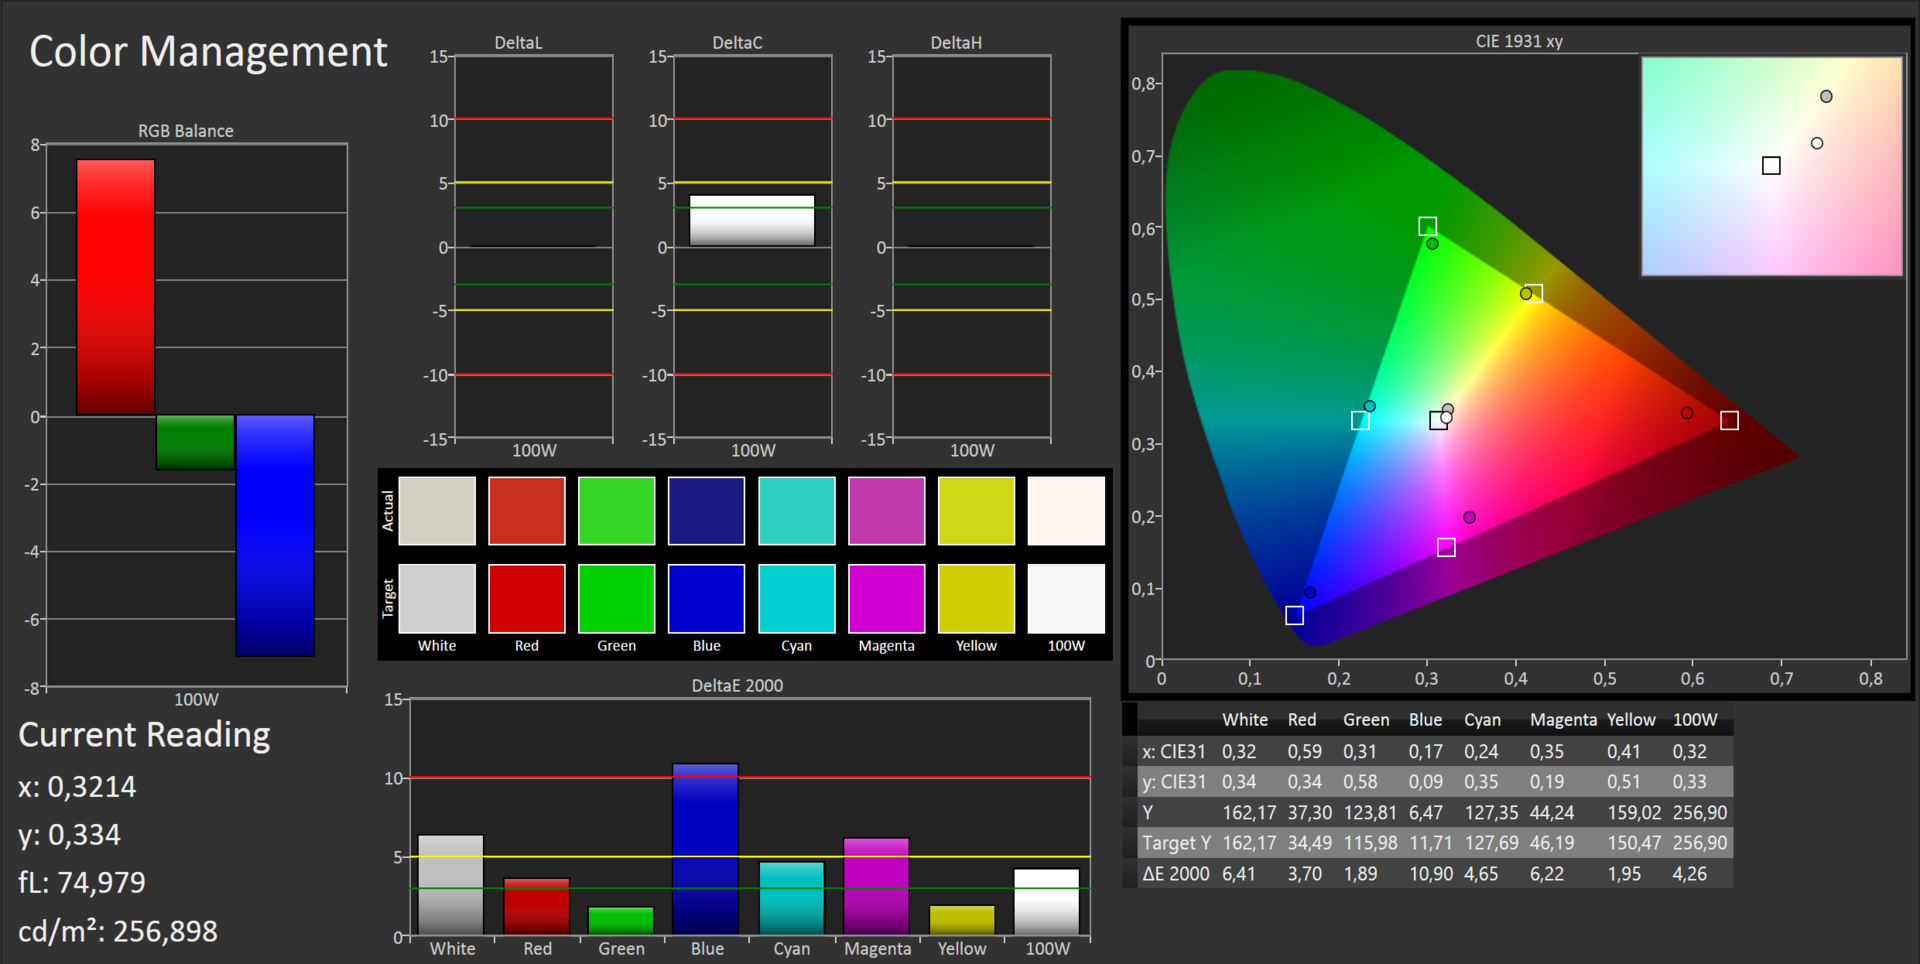
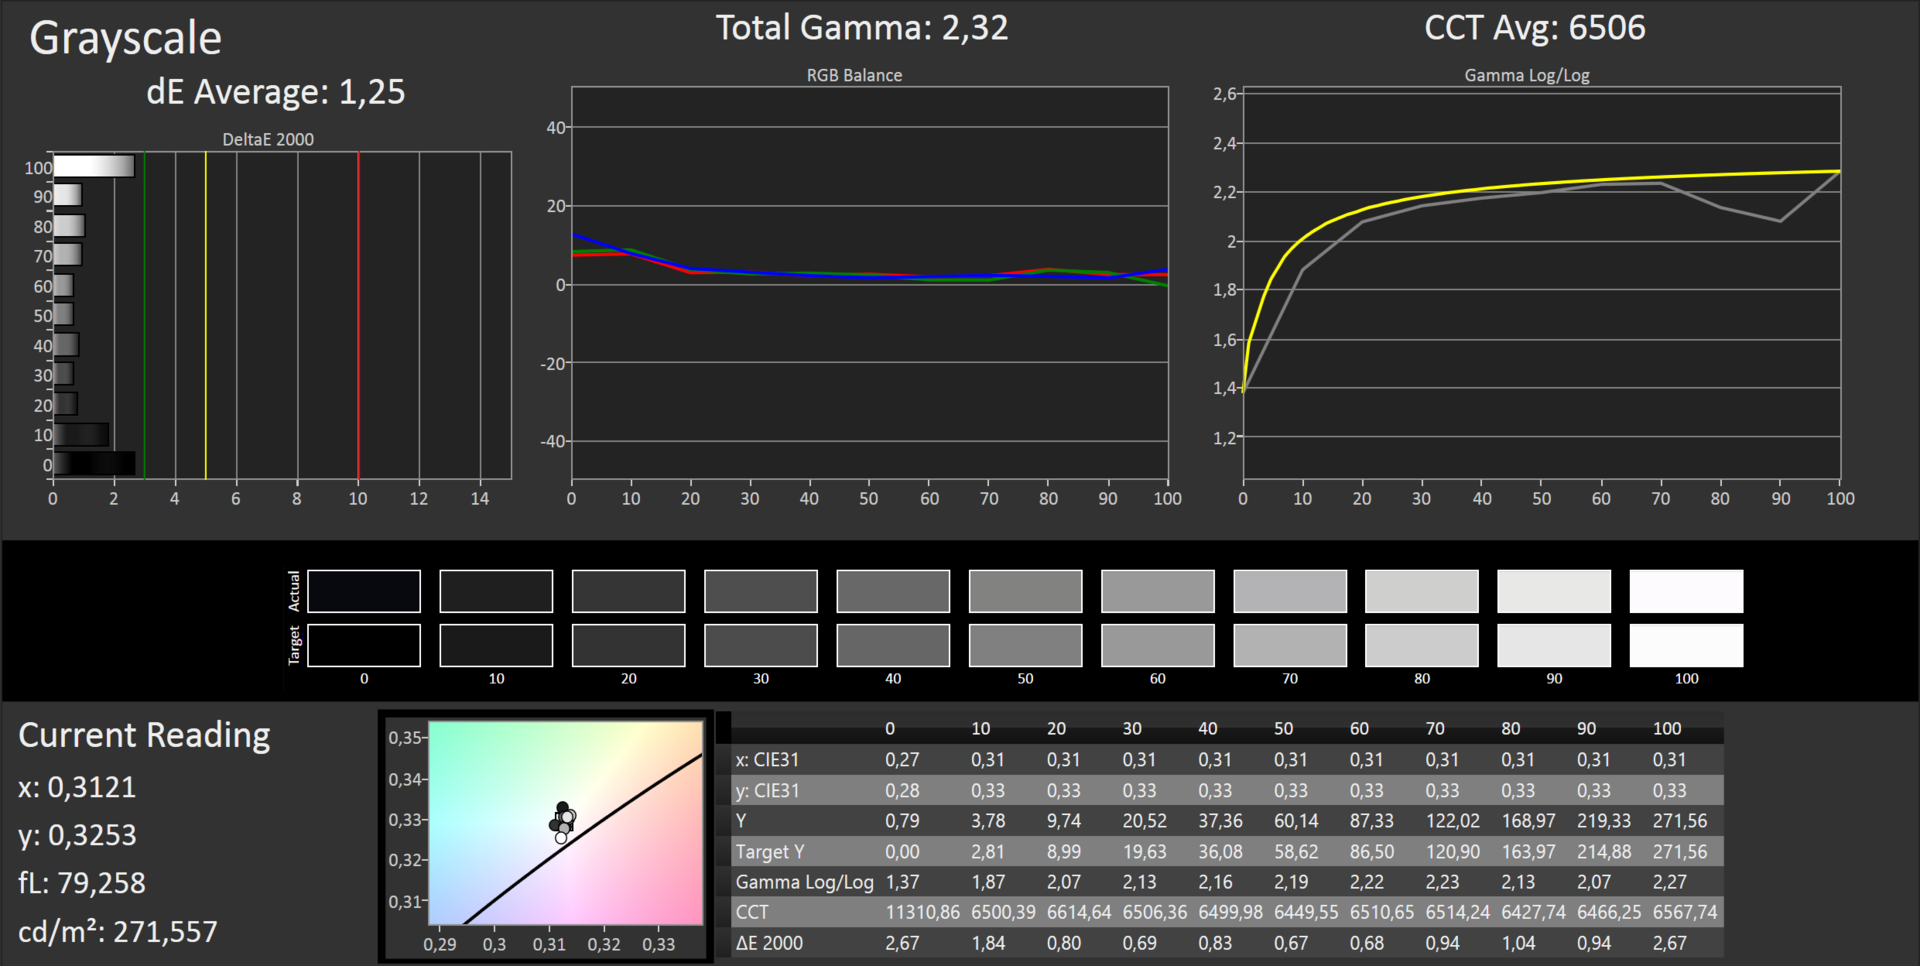
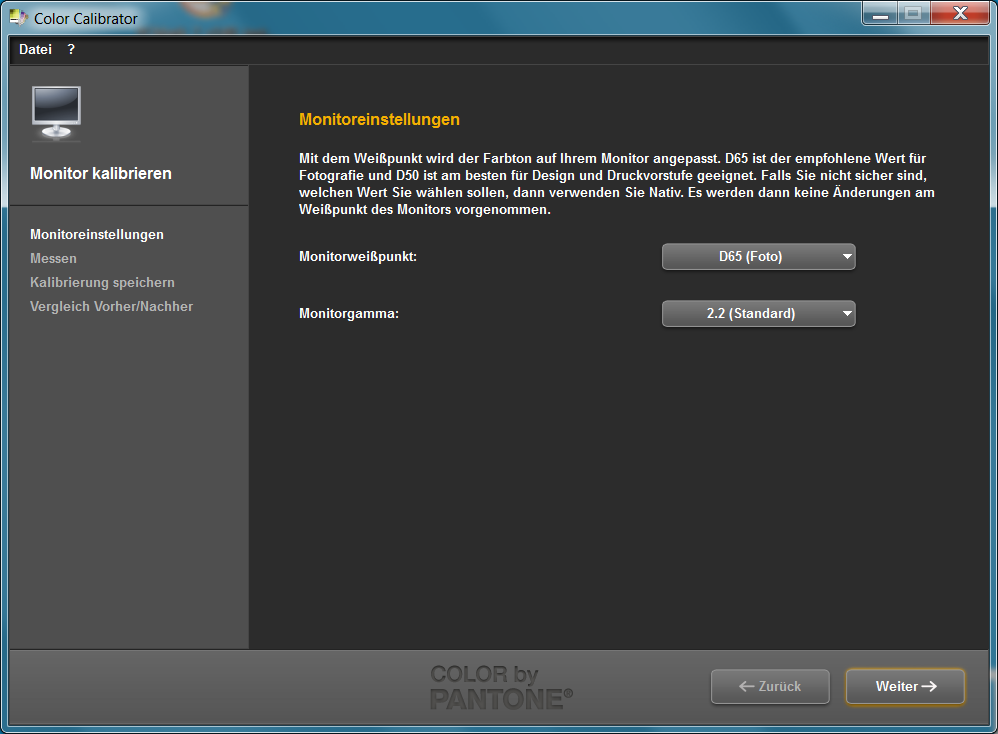
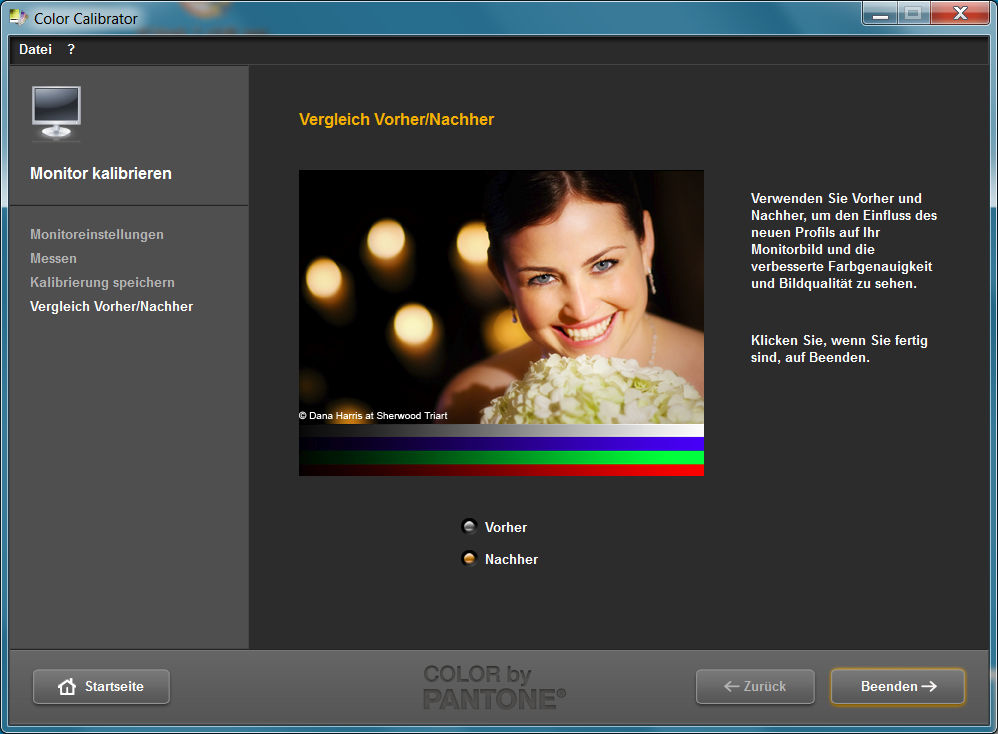
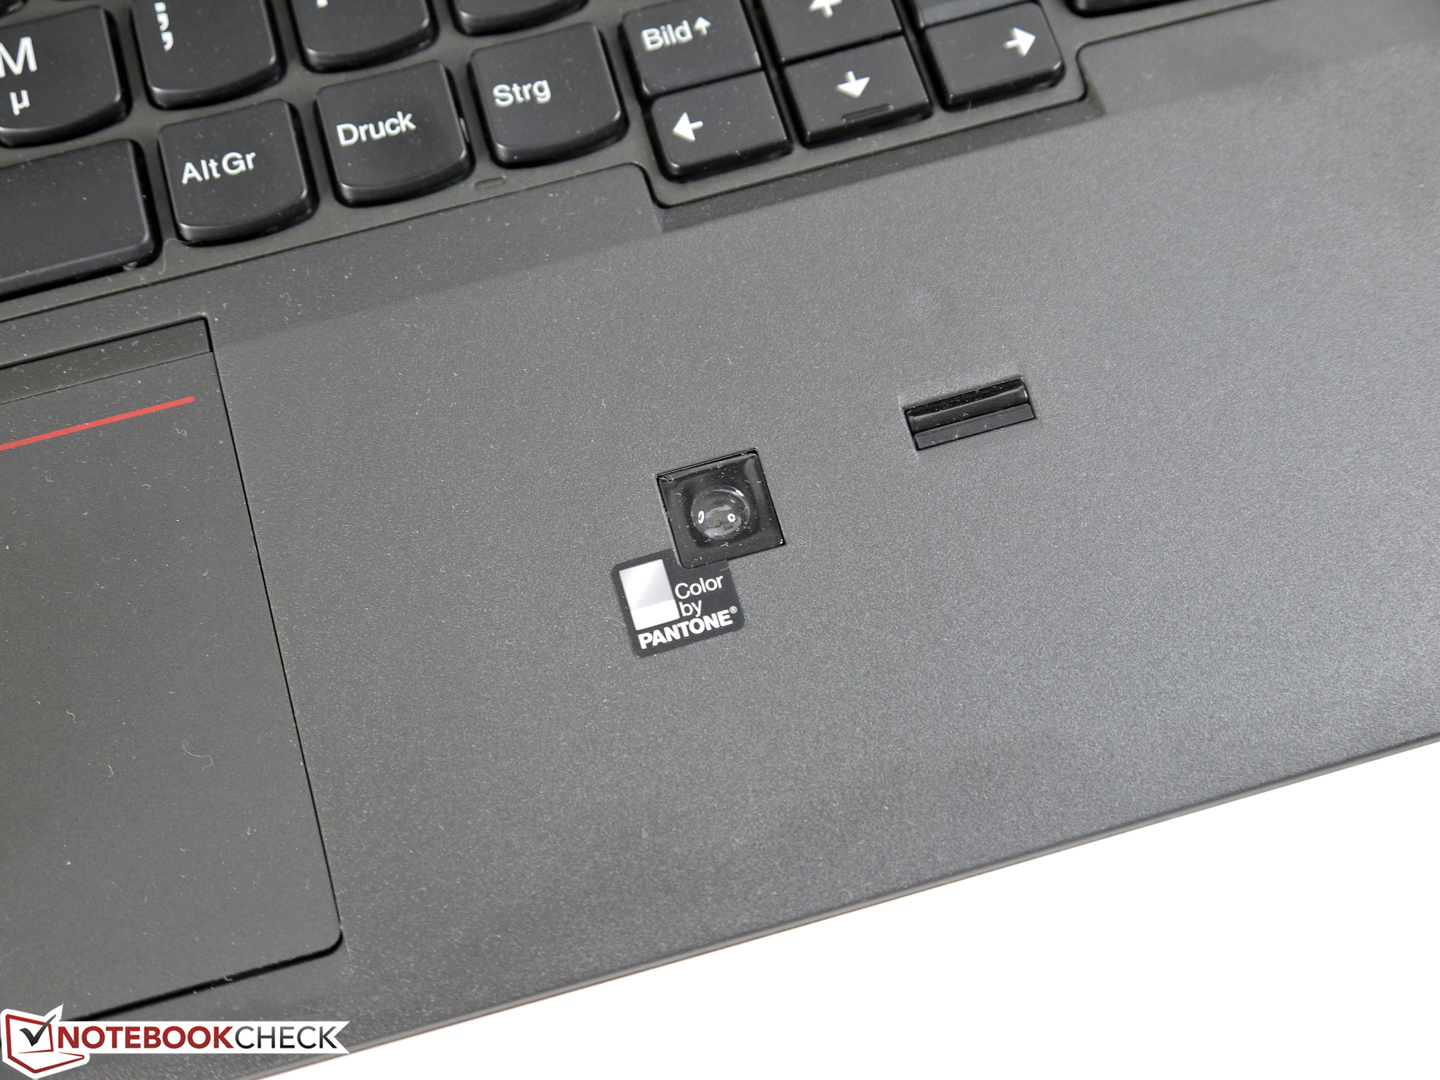
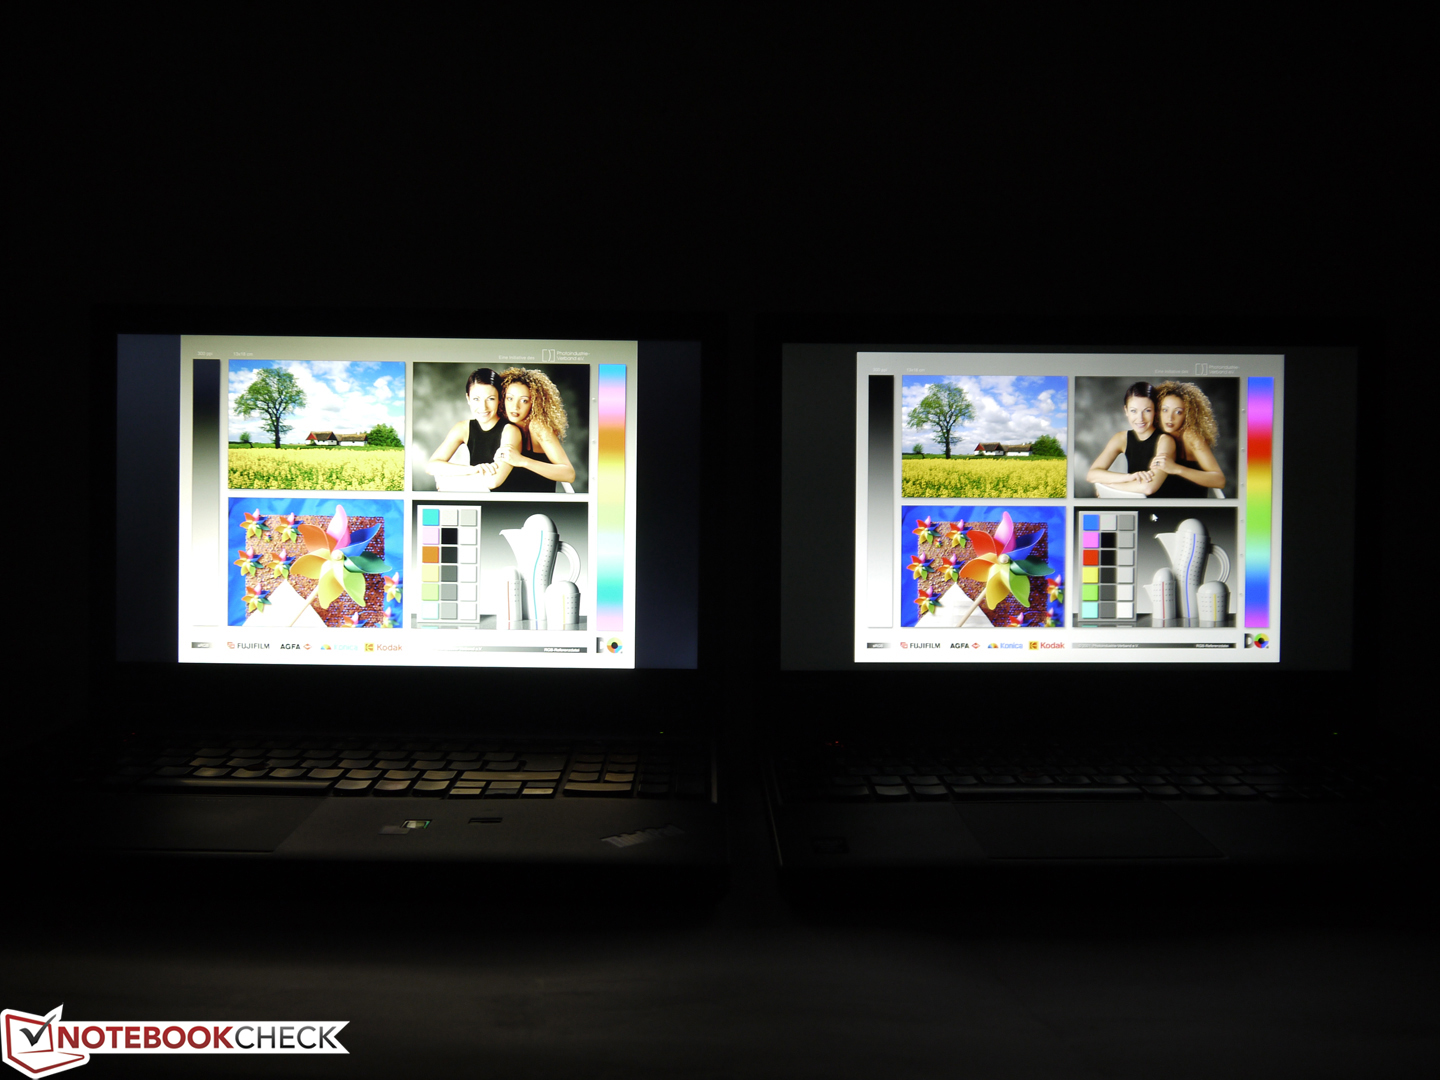
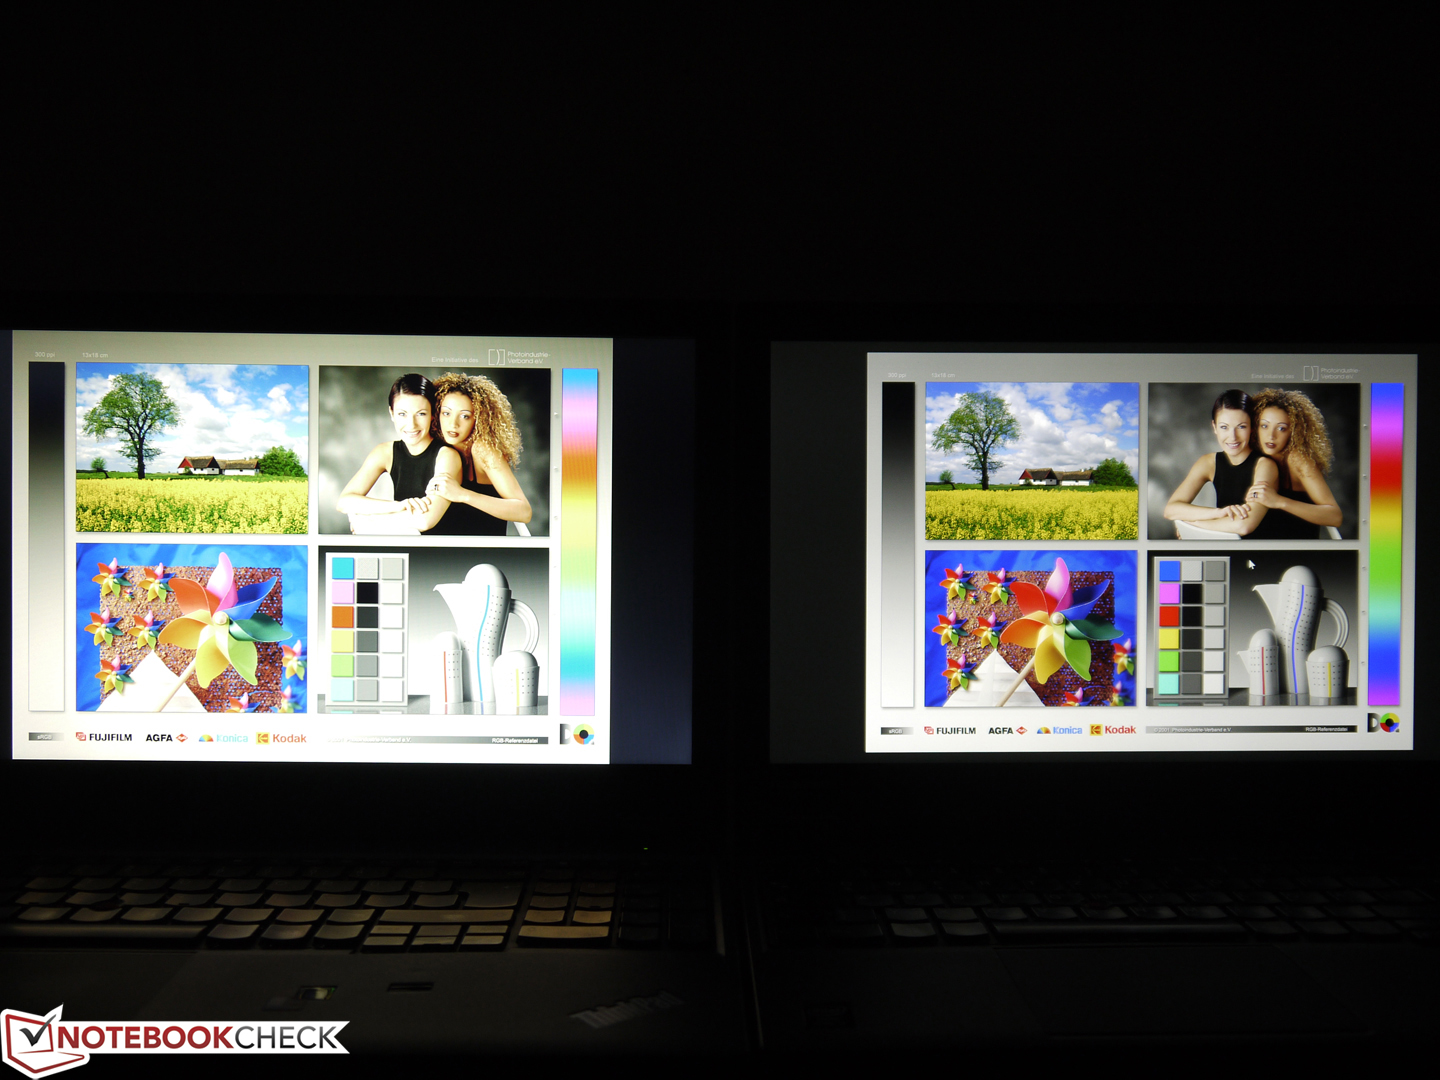
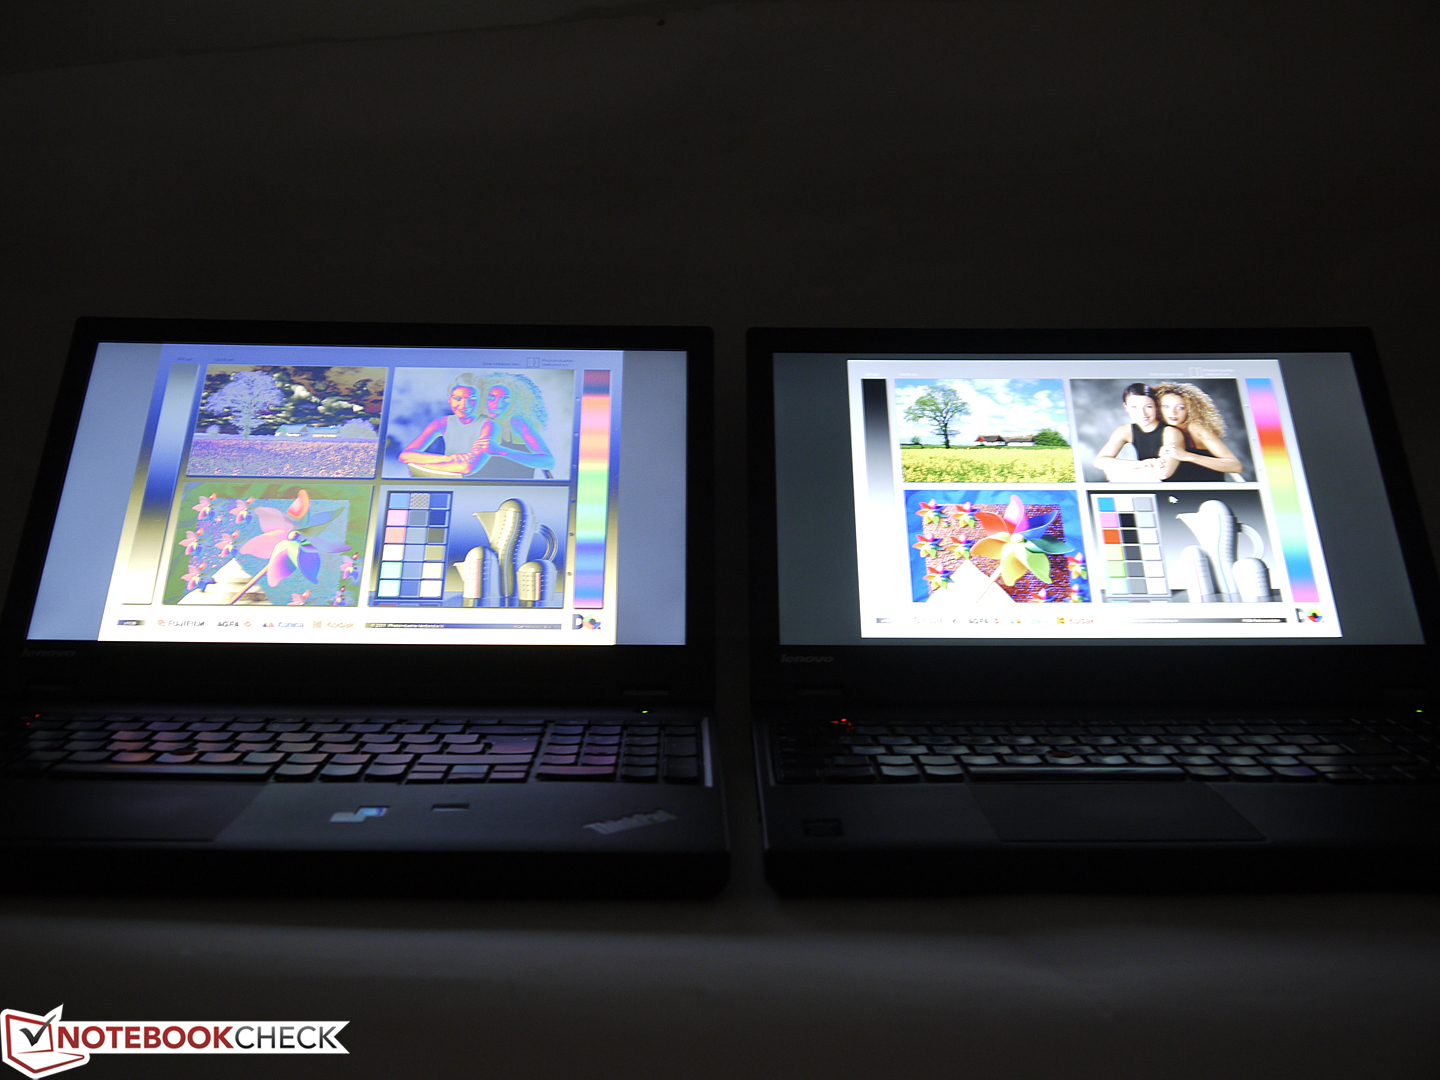
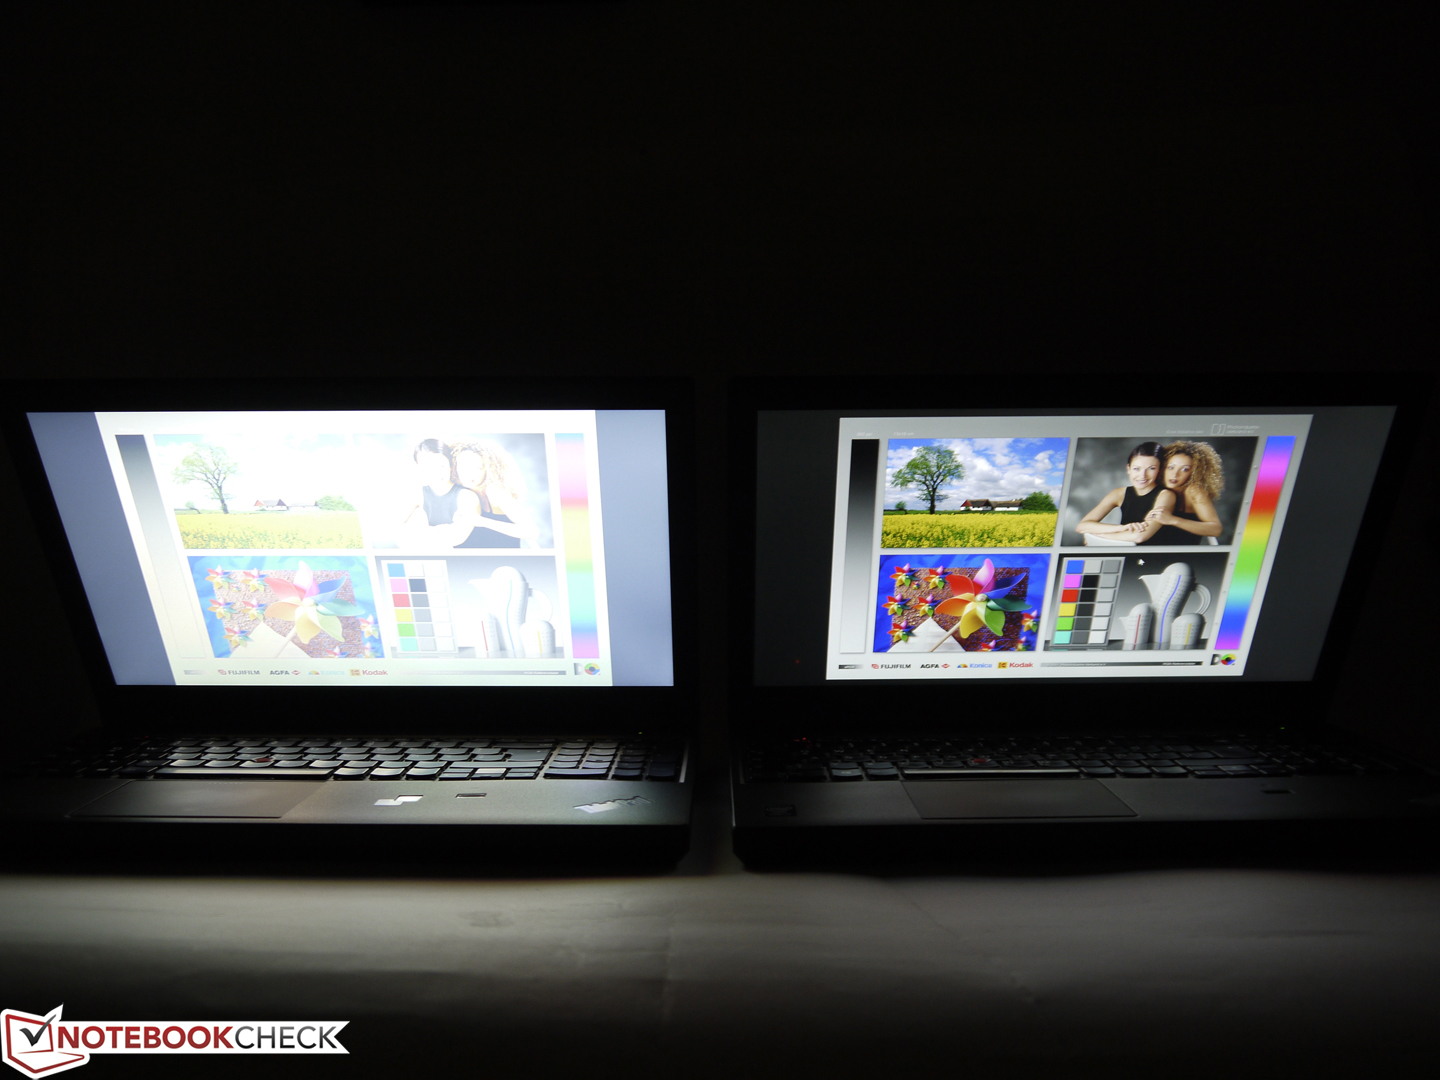
The color sensor from X-Rite integrated in the test unit should allow calibrating the display. The configuration options of the included software are very meager. Only white point and gamma can be configured. A pre-post comparison is possible afterwards. The result is disillusioning. The subjective impression is not very positive. We compared the calibration of the integrated color sensor to our i1 Pro 2's (also from X-Rite) and can say that the performance of the color sensor integrated in the palm rest is insufficient. The result is much worse than the capabilities of the display. You can see the differences in the images. In our opinion, this gimmick is not recommendable, especially for professional image editing.
While precise colors and a color space as big as possible are not necessary for routine tasks, the vertical viewing angle stability has an impact on everyday tasks in all areas. The user has to repeatedly adjust the opening angle regardless of the tasks, be it office, multimedia, or image editing, whenever the position is changed slightly since the image quality decreases. In the vertical direction, the image either fades or inverts. Looking at the screen from above, the image appears yellowish and looking at the screen from below, it looks greenish. In the horizontal direction, the colors are rather stable and do not fade or invert. But, the brightness falls visibly and diffuse reflections become slightly more visible.
Performance
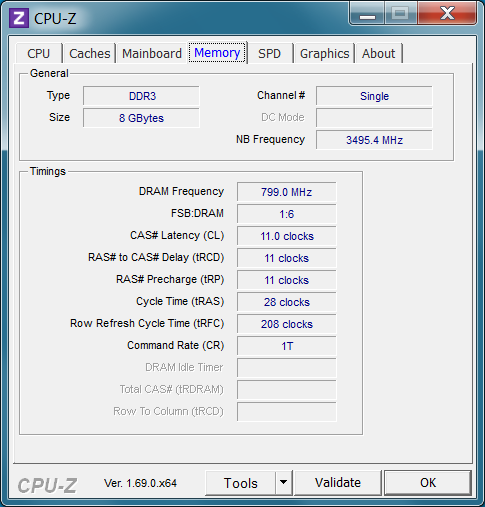
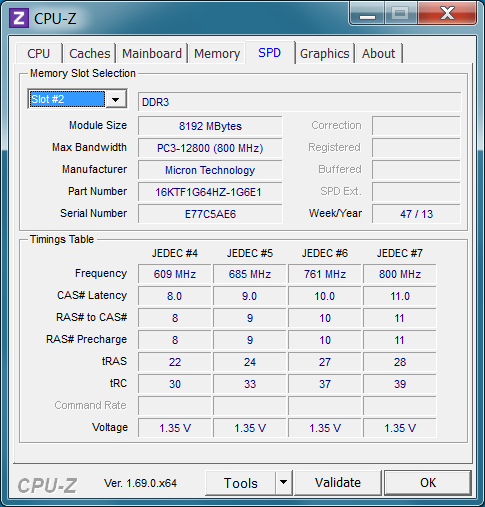
According to the data sheet, our review unit features substantially faster hardware than the first unit. Therefore, it should achieve better results throughout the tests. Apart from faster CPU and GPU, the Solid-State Drive improves the performance in everyday tasks. Except for capacity (now 8 GB), RAM did not change much since only one RAM module works in single channel mode again.
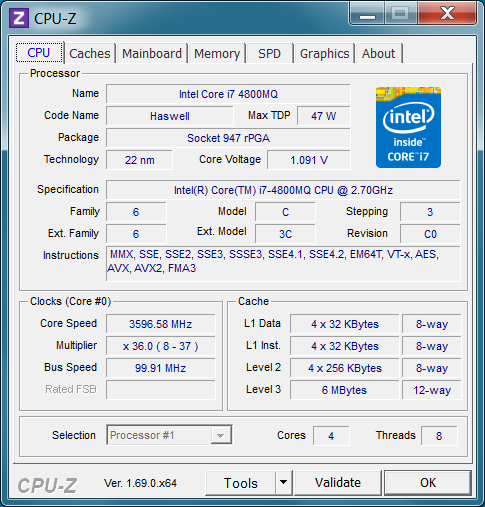
Processor
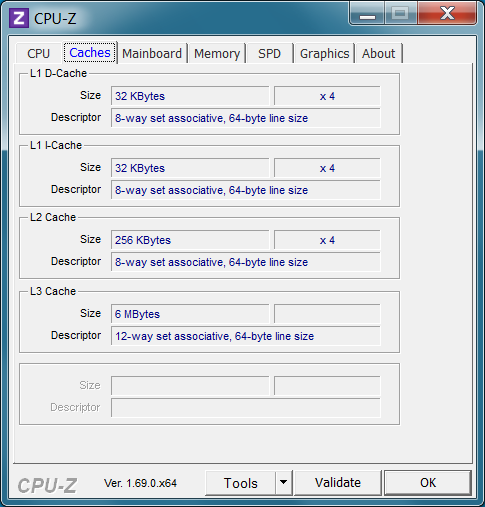
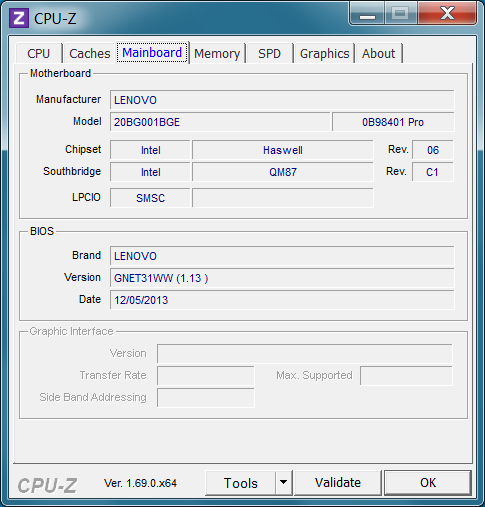
Intel's Core i7-4800MQ belongs to the most powerful mobile processors of the manufacturer's product range. It features the familiar key features like Intel Turbo Boost (up to 3700 MHz) and Hyperthreading (up to eight parallel threads). The thermal design power is 47 Watts and includes graphics unit, chipset and memory controller.
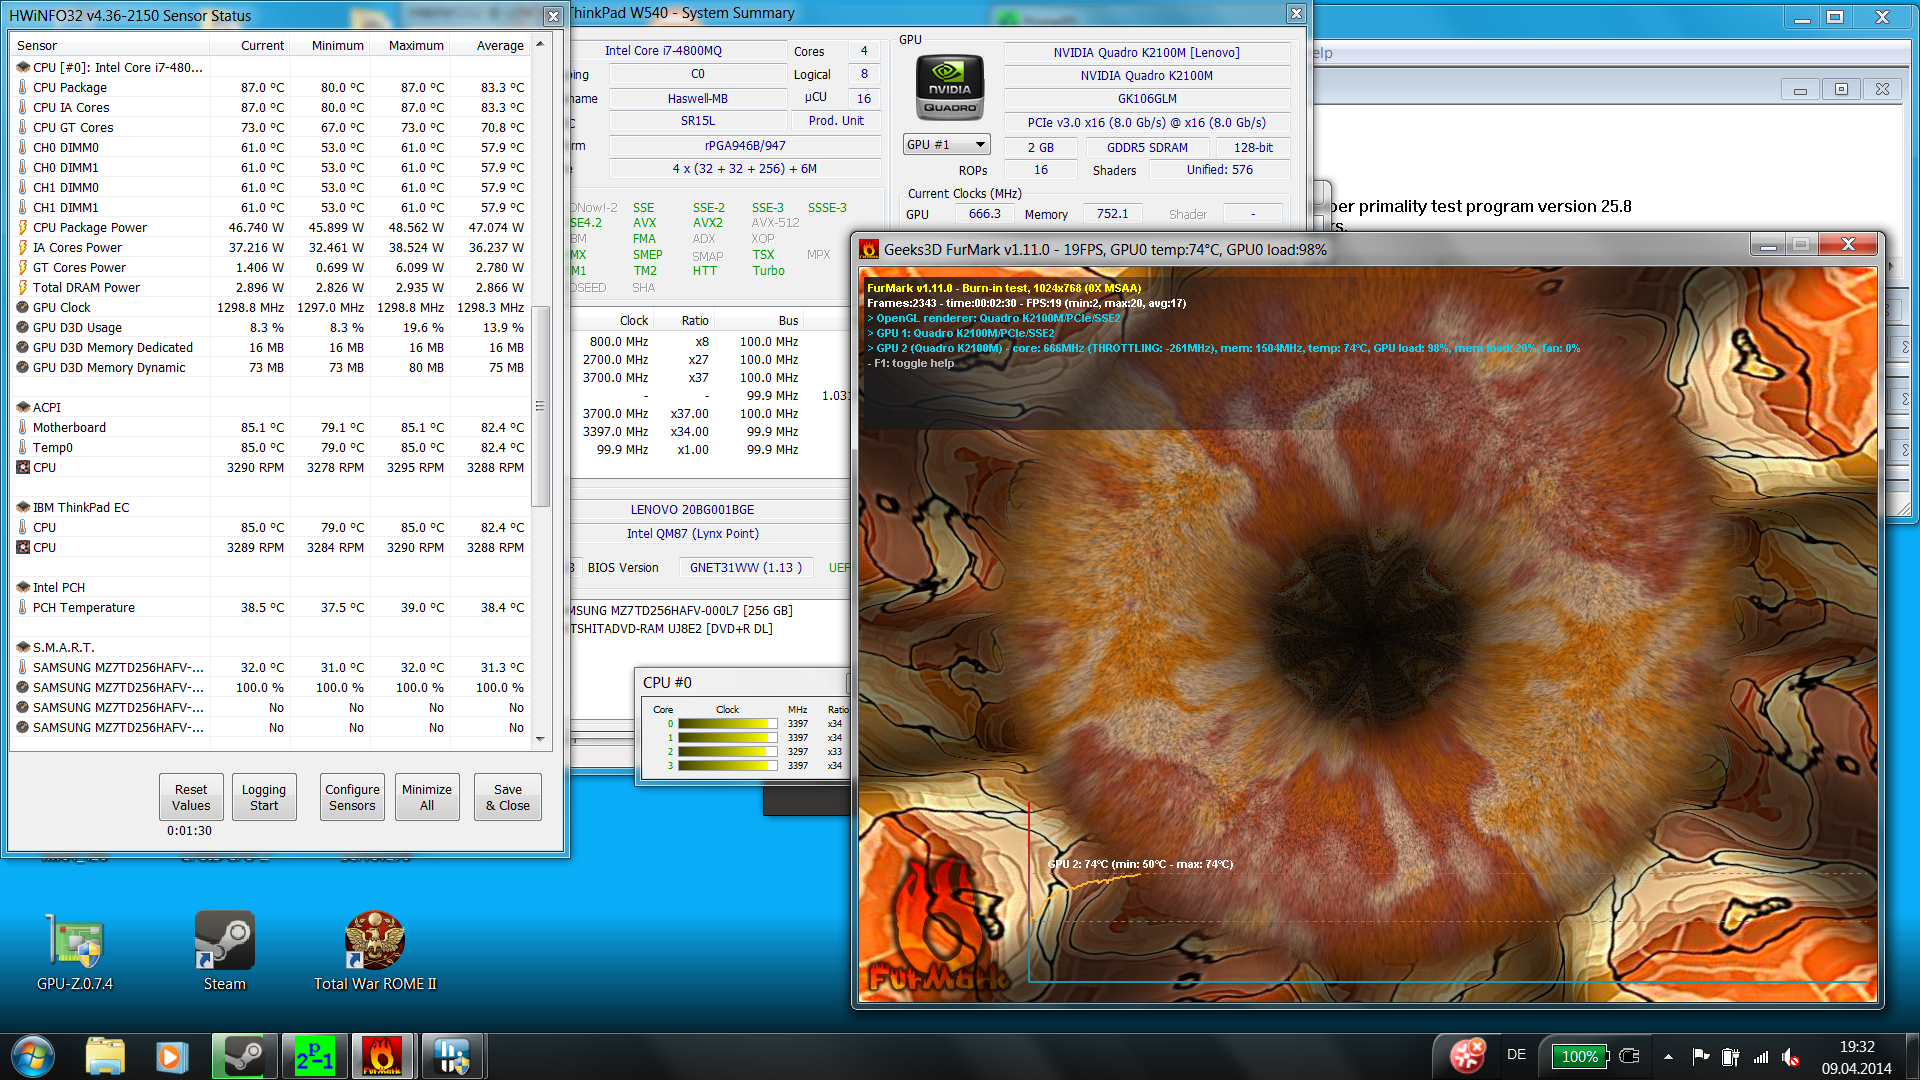
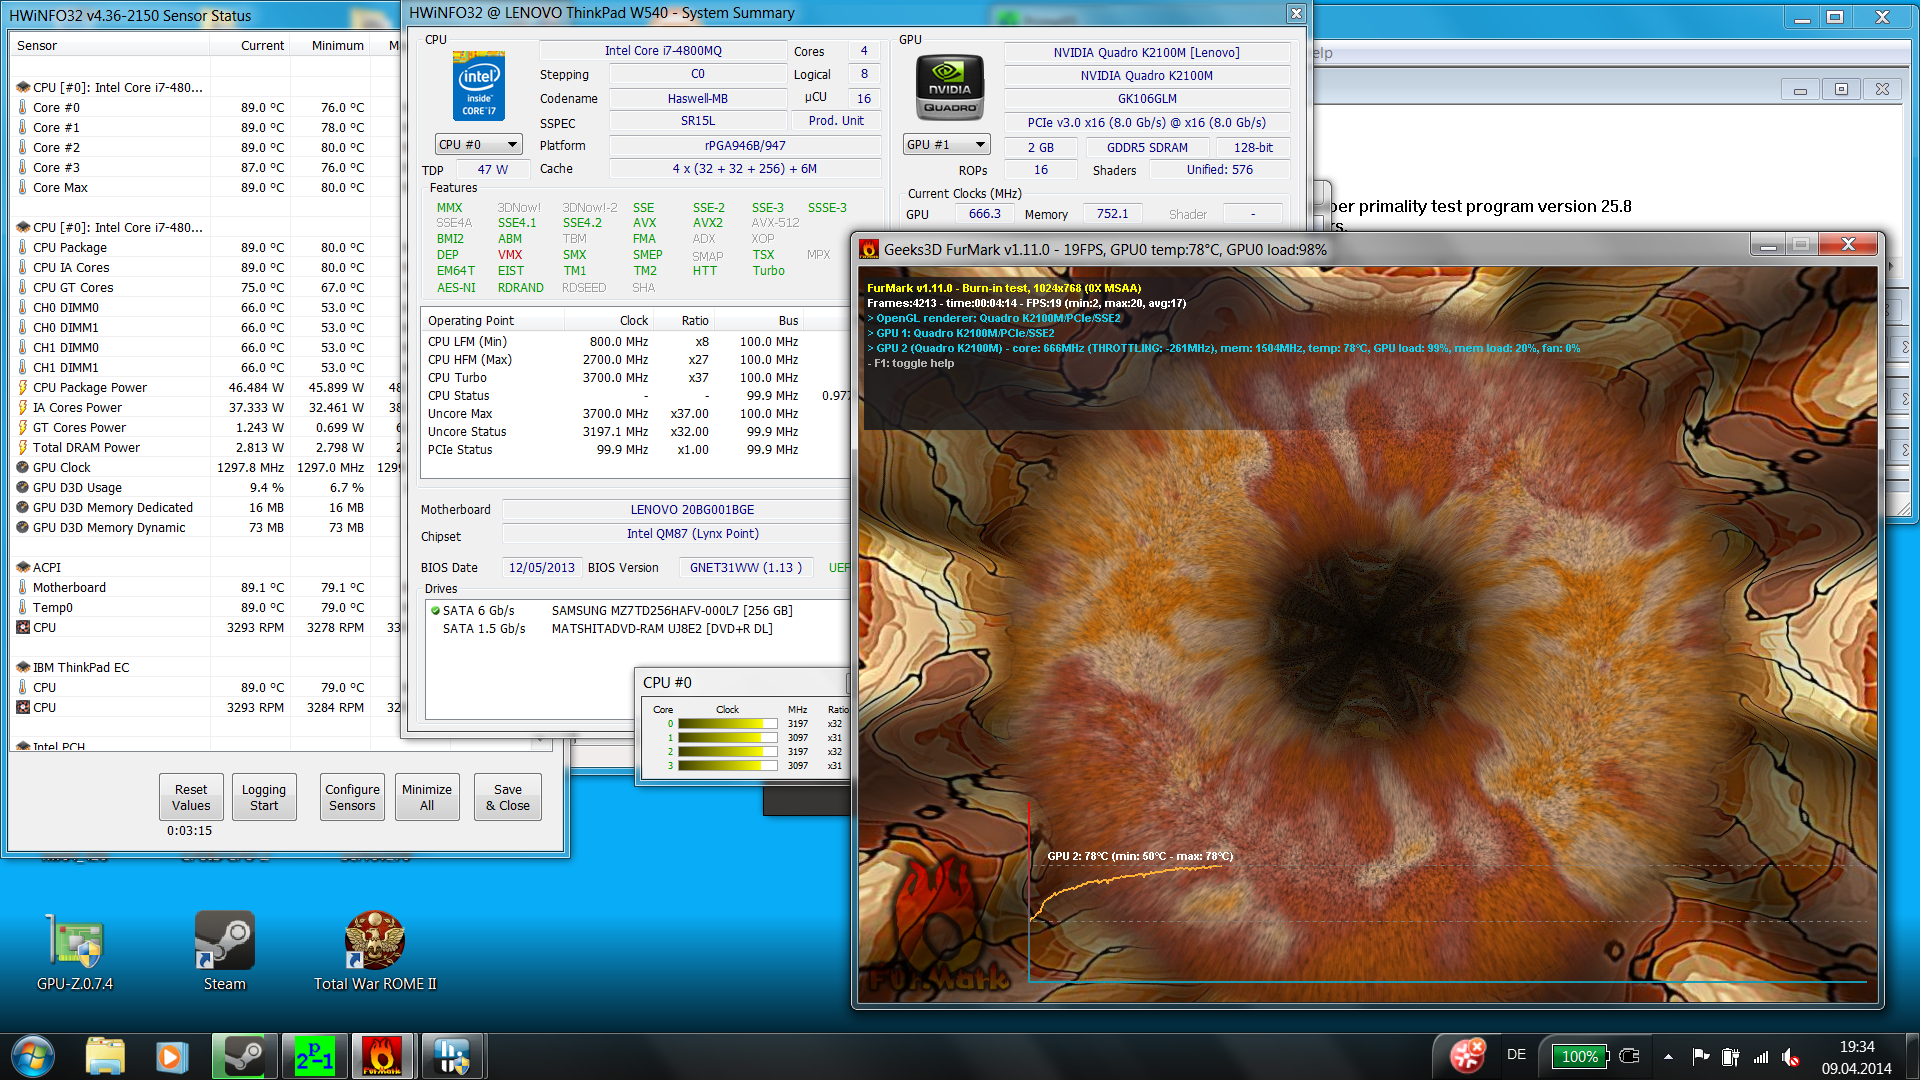
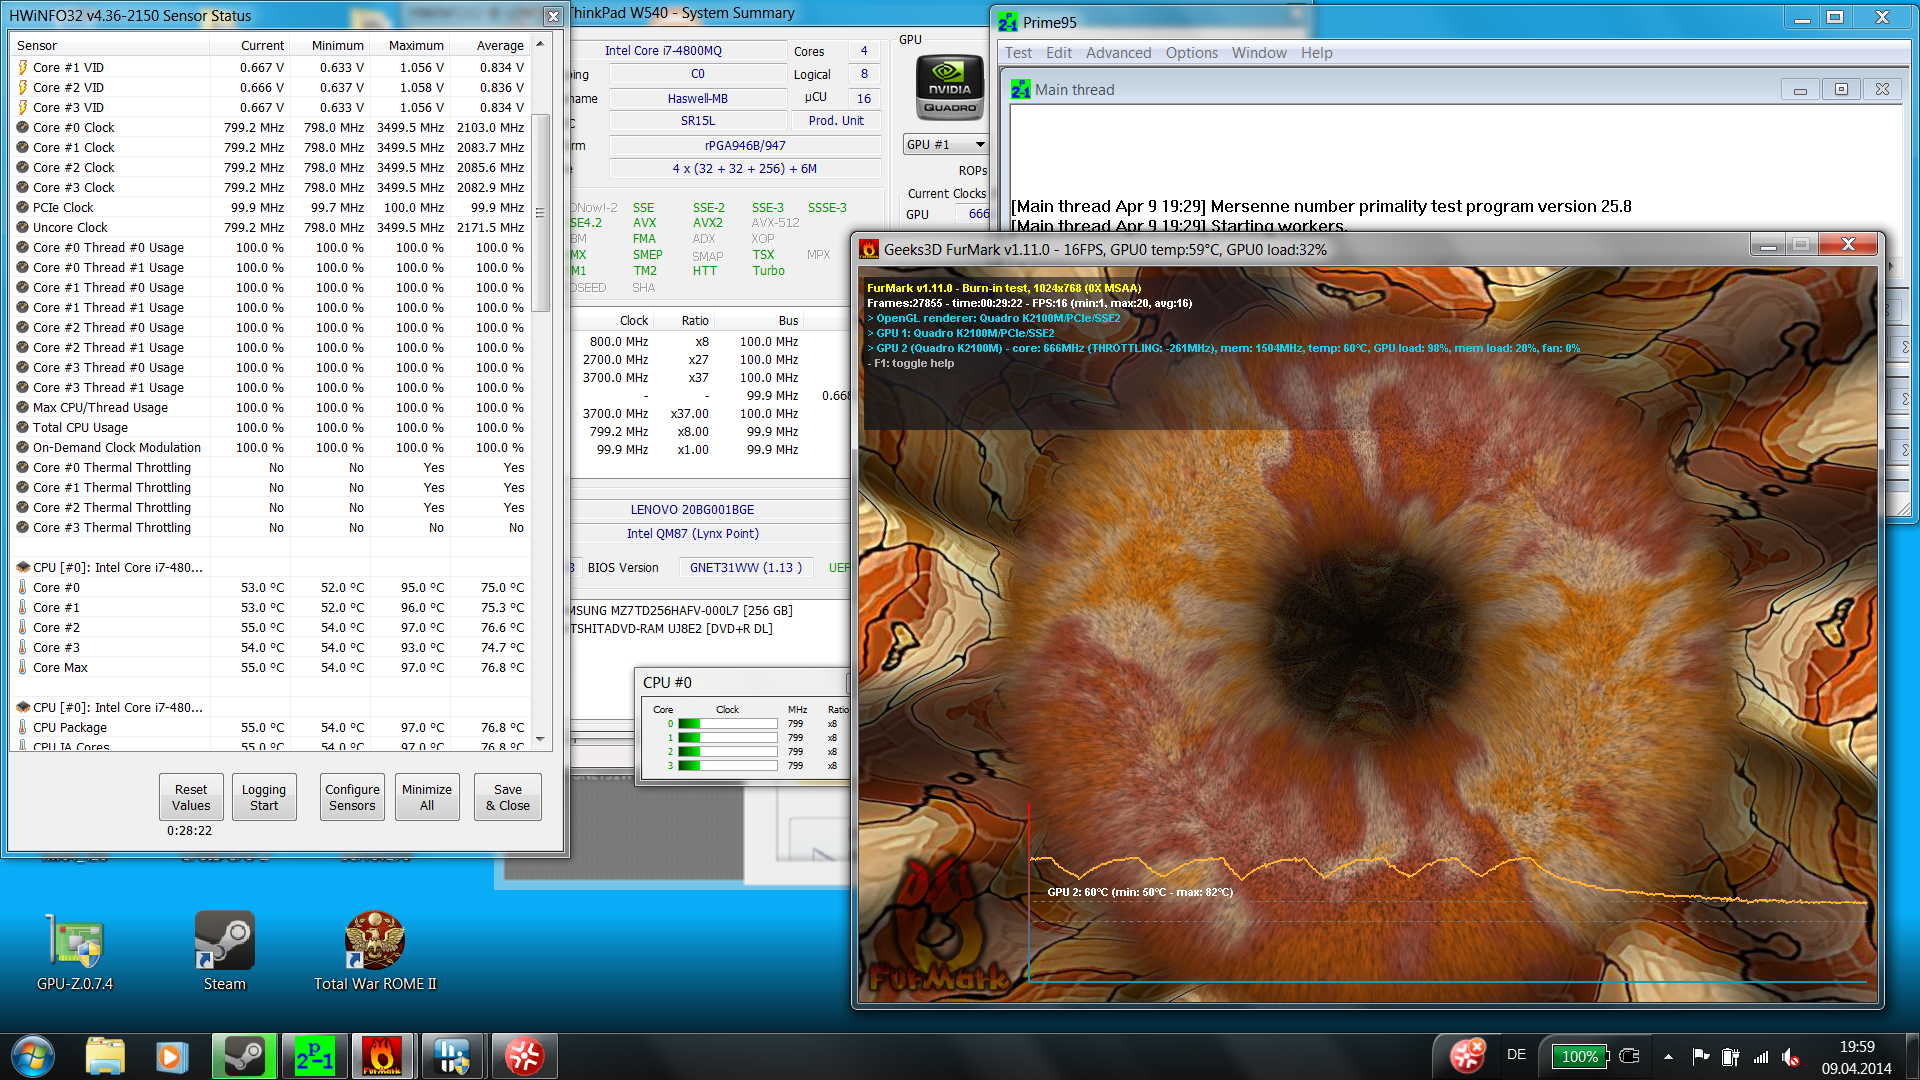
The benchmark results of Cinebench R10 32-bit of 5204 points and 20,089 points are very good and are evidence of high CPU performance. However, it seems that it is not fully available for a long period of time (BIOS 1.13, 12.05.2013). After the stress test has been running for 13 minutes (Prime95 + FurMark), HWinfo displays a clock rate of 799 MHz for about one minute. Afterwards, the clock rate increases to 3.5 GHz again and gradually falls to 3.0 GHz. From then on, the clock rate changes from 799 MHz to 3500 MHz and back, repeating in one-minute intervals for about 12 minutes. Thereafter, the clock rate remains at 799 MHz. An update to the current BIOS version 2.10 did not improve this. Quite the contrary, the CPU clock remained at 799 MHz after about 12 minutes. We used the setting "Maximize Performance" in the BIOS to maximize the performance and minimize CPU throttling.
This setting can also be used for battery mode, but it is just as ineffective here. On battery, the processor only clocks at 799 MHz from the start despite maximum performance settings. So, our current test sample, with faster hardware, only achieves 1.69 points (multi-core) and 0.36 points (single-core) in Cinebench R11.5 while the first test unit (5.09 points in Cinebench R11.5 Multi) performed significantly better.
System Performance
Since the current test sample features more powerful components than the first test unit does, it achieves significantly better benchmark results. In PC Mark 7, it reached 4900 points instead of 3204 points and it achieved 17,713 points instead of 9515 points in PC Mark Vantage. In practice, the Solid-State Drive in particular, brings a subjectively high performance gain. Booting is finished after 5 seconds and programs and files are opened without considerable delay.
| PCMark Vantage Result | 17713 points | |
| PCMark 7 Score | 4900 points | |
Help | ||
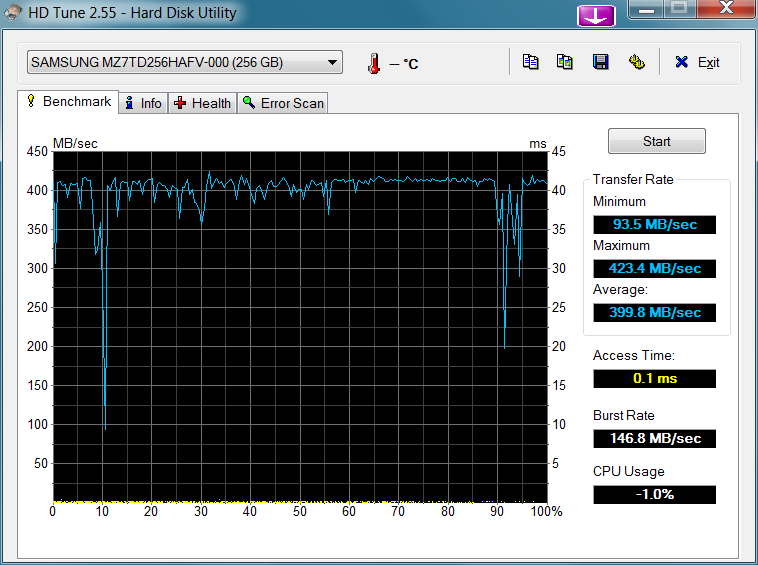
Storage Devices
As already mentioned in the system performance section, the SSD retrofitted by the dealer, provides for a very good subjective performance. With sequential transfer rates of 514 MB/s in reading and 240 MB/s in writing, very short access times and a practical capacity of 256 GB (gross), there are really only significant advantages when compared to conventional hard drives. Only its price, and so its Euros per GB ratio, are considerably worse.

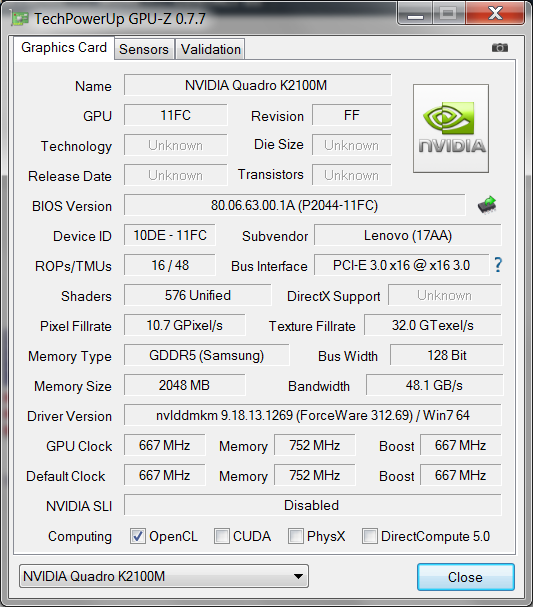
Graphics Card
The performance of the professional Nvidia Quadro K2100M graphics card is on par with the already reviewed competitors, the Toshiba Tecra W50 and the Dell Precision M4800, which feature the same graphics solution. It achieves, for example, 1504 points in 3D Mark Fire Strike and 58 fps in Cinebench R11.5 OpenGL Shading. In SPECviewperf 11, the results are close to other Quadro K2100M competitors'. Compared to the Nvidia Quadro K1100M, in the weaker ThinkPad W540 model, the performance is about 6 to 28 percent higher.
While graphics performance appears to be constant under full load, it is significantly worse on battery. In Cinebench R11.5, it falls from 58 fps to only 24.6 fps, which is less than half the original value. The dedicated graphics card only clocks at 561 MHz instead of 666 MHz here.
| 3DMark Ice Storm Standard Score | 64976 points | |
| 3DMark Cloud Gate Standard Score | 10312 points | |
| 3DMark Fire Strike Score | 1504 points | |
Help | ||
Gaming Performance
The performance of the Nvidia Quadro K2100M is sufficient for high settings in most of the games. Only demanding games like Company of Heroes 2 or Metro Last Light require medium or even minimum pre-settings. In Company of Heroes, the results are worse than the test unit with the Nvidia Quadro K1100M, although we upgraded the driver to Forceware 332.75. This could be due to different driver versions and / or different operating systems. Apart from the games tested here, the gaming results of the Toshiba Tecra W50 and the Dell Precision M4800 are the same. An extensive overview is available in our gaming table of notebook graphics cards.
| Tomb Raider | |
| 1920x1080 Ultra Preset AA:FX AF:16x (sort by value) | |
| Lenovo ThinkPad W540 20BG001BGE | |
| Lenovo ThinkPad W540 20BGCTO1WW | |
| 1366x768 High Preset AA:FX AF:8x (sort by value) | |
| Lenovo ThinkPad W540 20BG001BGE | |
| Lenovo ThinkPad W540 20BGCTO1WW | |
| 1366x768 Normal Preset AA:FX AF:4x (sort by value) | |
| Lenovo ThinkPad W540 20BG001BGE | |
| Lenovo ThinkPad W540 20BGCTO1WW | |
| 1024x768 Low Preset (sort by value) | |
| Lenovo ThinkPad W540 20BG001BGE | |
| Lenovo ThinkPad W540 20BGCTO1WW | |
| Company of Heroes 2 | |
| 1920x1080 Maximum / Higher / High AA:High (sort by value) | |
| Lenovo ThinkPad W540 20BG001BGE | |
| Lenovo ThinkPad W540 20BGCTO1WW | |
| 1366x768 High AA:Medium (sort by value) | |
| Lenovo ThinkPad W540 20BG001BGE | |
| Lenovo ThinkPad W540 20BGCTO1WW | |
| 1366x768 Medium AA:Off (sort by value) | |
| Lenovo ThinkPad W540 20BG001BGE | |
| Lenovo ThinkPad W540 20BGCTO1WW | |
| 1024x768 Minimum / Low / Off AA:Off (sort by value) | |
| Lenovo ThinkPad W540 20BG001BGE | |
| Lenovo ThinkPad W540 20BGCTO1WW | |
| Total War: Rome II | |
| 1920x1080 Extreme Preset (sort by value) | |
| Lenovo ThinkPad W540 20BG001BGE | |
| Lenovo ThinkPad W540 20BGCTO1WW | |
| 1366x768 High Preset (sort by value) | |
| Lenovo ThinkPad W540 20BG001BGE | |
| 1366x768 Medium Preset (sort by value) | |
| Lenovo ThinkPad W540 20BG001BGE | |
| 1024x768 Low Preset (sort by value) | |
| Lenovo ThinkPad W540 20BG001BGE | |
Emissions
System Noise
The test unit remains very quiet in most scenarios. It is convincing that it even works silently under low load. We measured a noise of 35.7 dB(A) under medium load. A maximum of 42.2 dB(A) under full load is still easily endurable. On battery, the fan runs continuously on a low level and is hardly audible. However, the performance is reduced heavily here.
Noise level
| Idle |
| 28 / 28 / 28 dB(A) |
| DVD |
| 31.4 / dB(A) |
| Load |
| 35.7 / 42.2 dB(A) |
 | ||
30 dB silent 40 dB(A) audible 50 dB(A) loud |
||
min: | ||
Temperature
Our test unit cannot keep up with the first one, particularly because of the power hungry Nvidia Quadro K2100M (55 Watts). However, even 47 °C (116.6 °F) under full load is nothing to worry about since the peak value is still sufficiently lower than the critical range from 50 °C (122 °F).
(-) The maximum temperature on the upper side is 47.9 °C / 118 F, compared to the average of 38.2 °C / 101 F, ranging from 22.2 to 69.8 °C for the class Workstation.
(-) The bottom heats up to a maximum of 47 °C / 117 F, compared to the average of 41.1 °C / 106 F
(+) In idle usage, the average temperature for the upper side is 26.3 °C / 79 F, compared to the device average of 32 °C / 90 F.
(-) The palmrests and touchpad can get very hot to the touch with a maximum of 47.9 °C / 118.2 F.
(-) The average temperature of the palmrest area of similar devices was 27.8 °C / 82 F (-20.1 °C / -36.2 F).
Energy Management
Power Consumption
The measured power consumption ranges from 8.5 Watts to 133.8 Watts at the mains. The display seems to have a big impact on the low power consumption, especially in low load scenarios since values with turned off and turned on display (4.3 Watts vs. 8.5 Watts) differ much less than our test sample's with 3k IPS display (5.5 Watts vs. 12.8 Watts). The latter is significantly more frugal than the alternatives from Dell or HP. During maximum load, especially the faster Nvidia Quadro K2100M graphics card increases the power consumption and contributes significantly to the measured maximum of 133.8 Watts.
| Off / Standby | |
| Idle | |
| Load |
|
Key:
min: | |
Battery Life
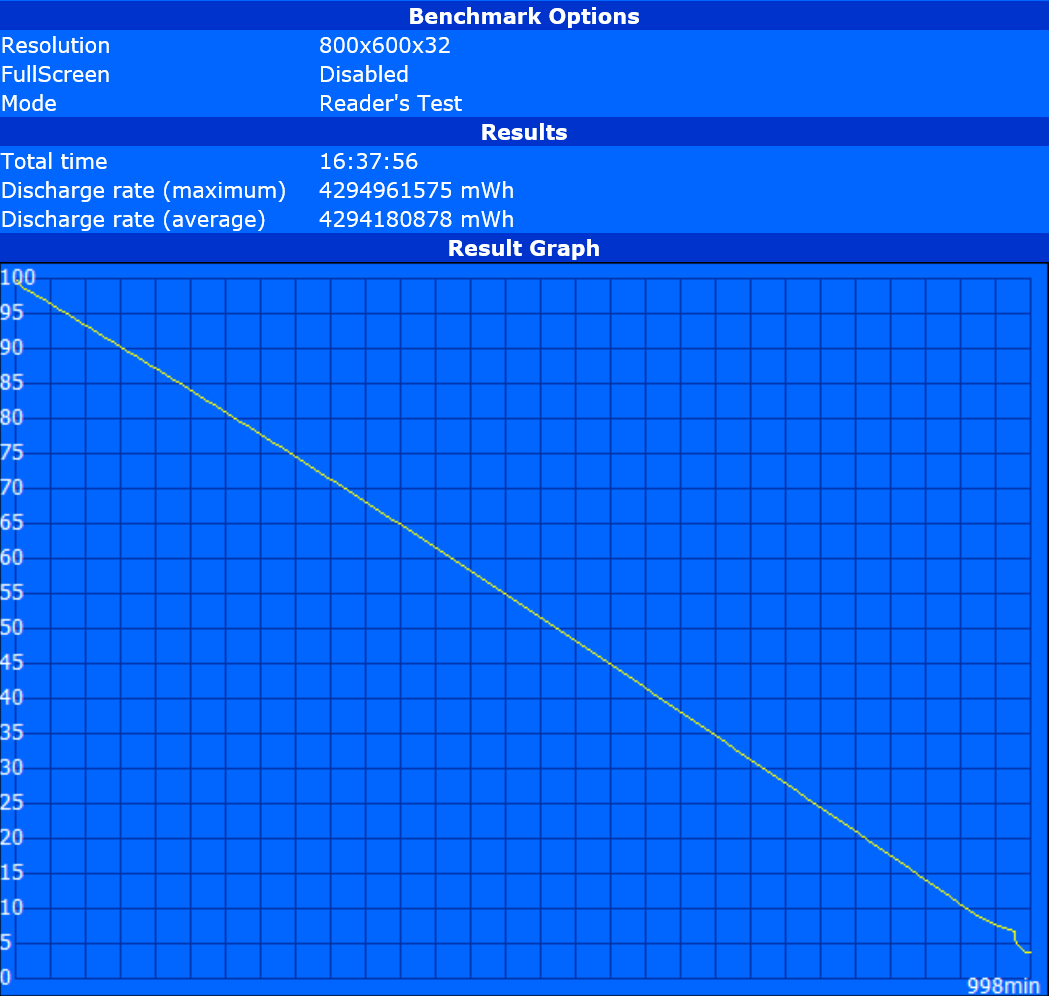
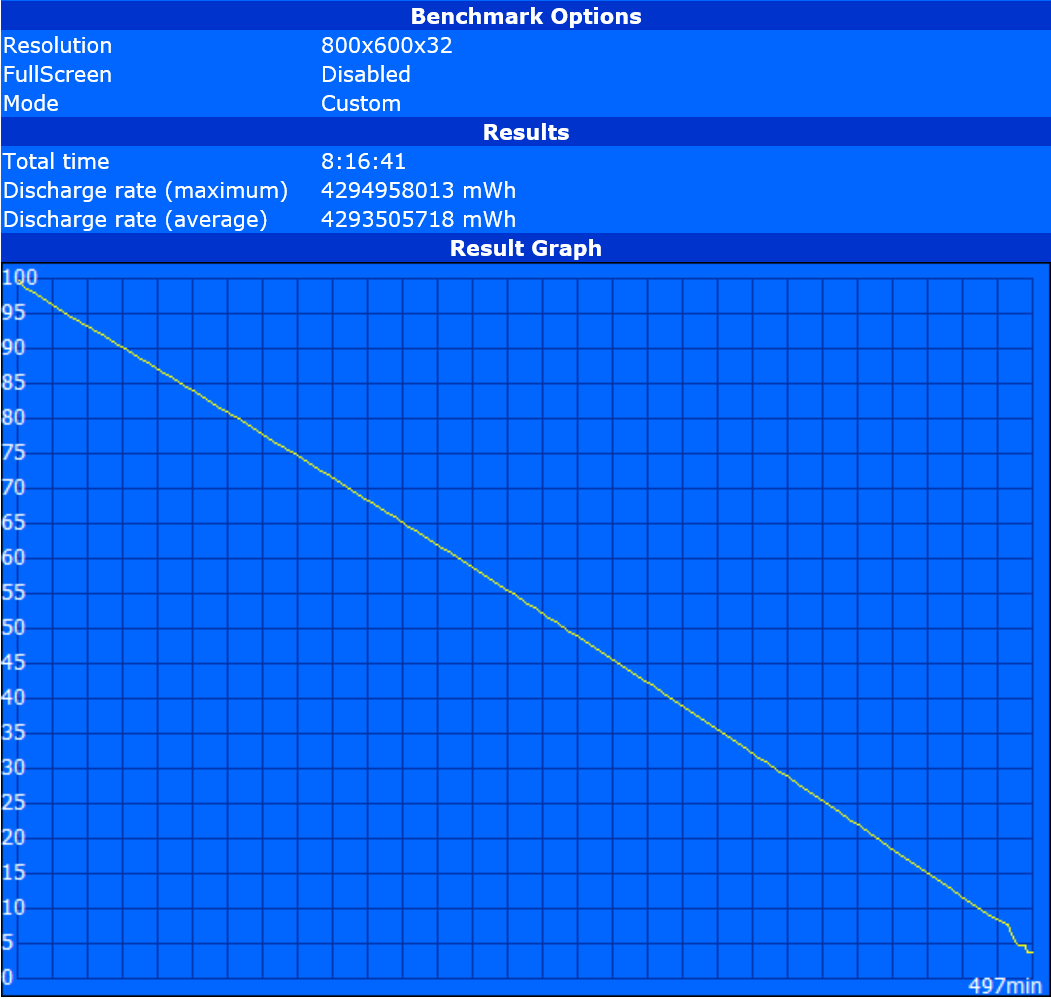
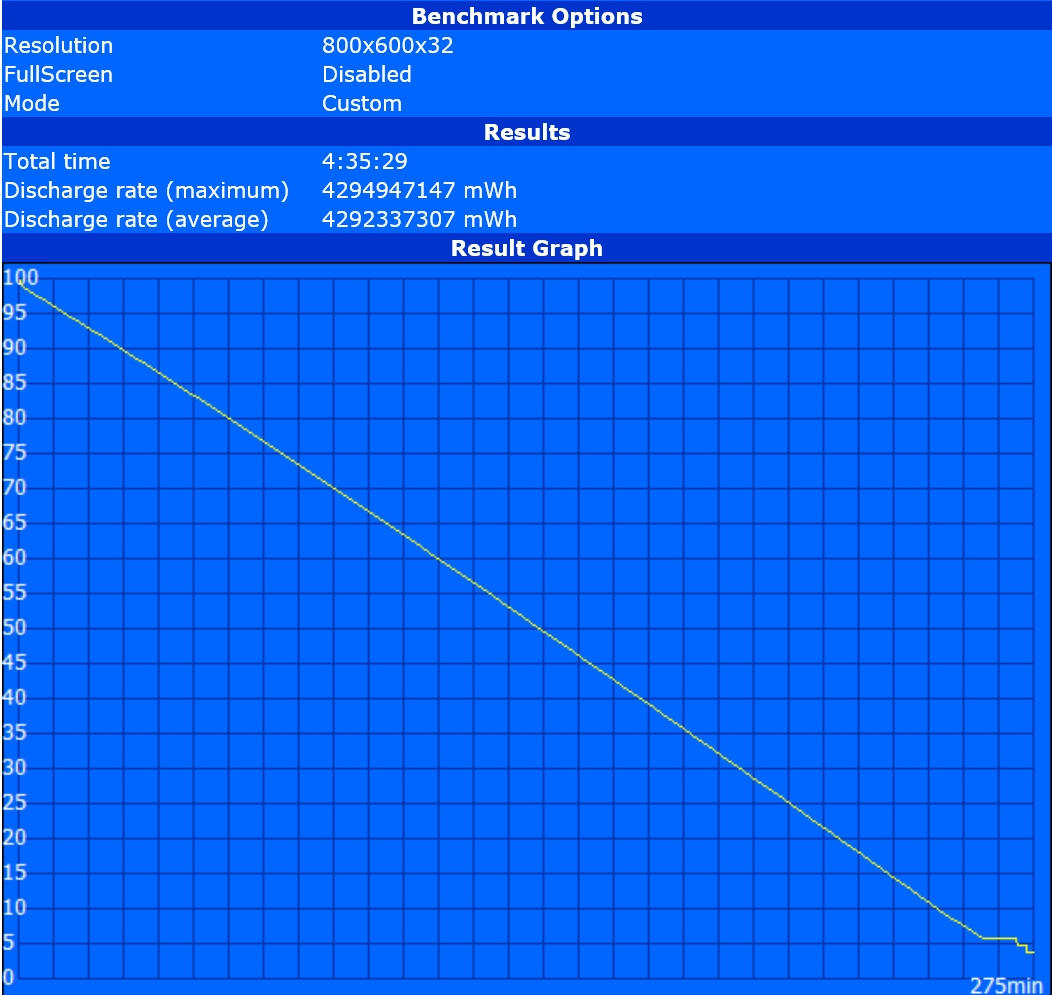
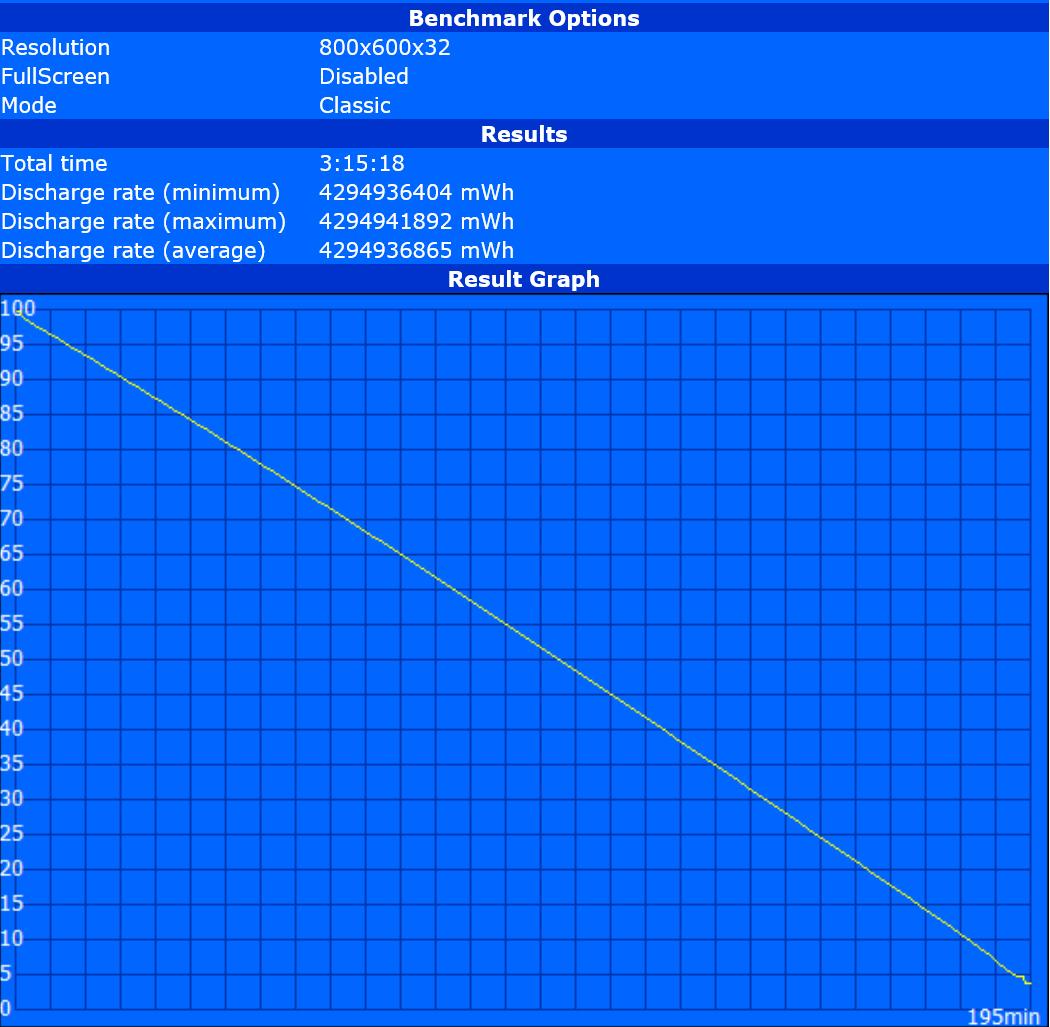
The battery runtimes profit from the low power consumption under low load and the significantly bigger battery capacity of 99 Wh. The Battery Eater Reader's test (minimum display brightness, energy-saving profile, Wi-Fi off) lasts above 16 hours, the Wi-Fi test (161 cd/m² brightness, display level: 13, Wi-Fi on) ends after above 8 hours and the video test (161 cd/m² brightness, display level: 13, Wi-Fi off, energy-saving profile, Intel graphics) takes above 4:30 hours. The Battery Eater Classic test (maximum performance, maximum brightness, all on) takes significantly longer than expected from the maximum power consumption. Reduced performance allows working unplugged for 3:15 hours.
Verdict
Reconciled? Partly! We appreciate that the keyboard works flawlessly and that the ClickPad is fully functional over its full extent. Therefore, two essential points of criticism are gone, giving a nicely improved product.
In general, the performance is suitable for the target group. Apart from CPU performance, the system scores points in special tasks like CAD- or GPGPU applications. Although the hardware is significantly faster than the first test model, this hardly has a negative impact on emissions. Quite the contrary. Thanks to the SSD, the workstation even works silently in low load scenarios, which makes comfortable office use possible. The reduced performance under continuous load and an even bigger performance loss on battery is not understandable. It seems a BIOS update of the manufacturer has a negative impact here.
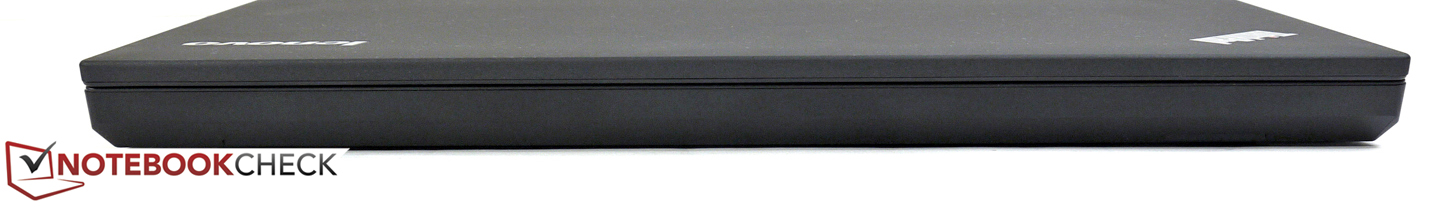
If you are willing to accept a slightly bigger height and a bigger size, you will get very long battery runtimes with the big 9-cell battery. It allows working unplugged for about double the time than the smaller 56 Wh model.
In our opinion, the Full HD display is not so good. It performs worse than the 3K display in almost all aspects. Especially the modest viewing angles and the low contrast weigh heavily, since not only specialists but also all users are affected by these. The incorporated color sensor is not recommendable. Apart from only a few configuration options, its performance is not convincing.
After the exceptionally poor device in our first test, the Lenovo ThinkPad W540 performs better now and is more likely to make it into the shortlist of workstation users. Sophisticatedly pre-configured models can be adjusted to your demands in Lenovo's online shop. This allows you to either replace not so good components or deselect them before ordering.