Wiko View 2 Go Smartphone Review

The Wiko View 2 Go follows in the wake of the View 2 Plus, which we reviewed earlier this week. The View 2 Go is another affordable smartphone by the French manufacturer that should offer enough for those who do not require much from their smartphones. Wiko currently sells the View 2 Go for 159 Euros (~$181) and has equipped the device with a large screen that has an equally large notch, an old Qualcomm SoC, 3 GB RAM and 32 GB of eMMC flash storage. The View 2 Plus also comes in a choice of stylish colours, with a single rear-facing camera and a 4,000 mAh battery.
A fingerprint sensor is the only notable absence, but Wiko markets the View 2 Go as having “Face Unlock” instead, although we doubt that this is as secure as Apple’s FaceID. We have chosen to compare the View 2 Go against the Huawei Y7 2018, the Honor 7A, the Moto G6 Play, and the test unit's sibling, the Wiko View 2 Plus.
Case
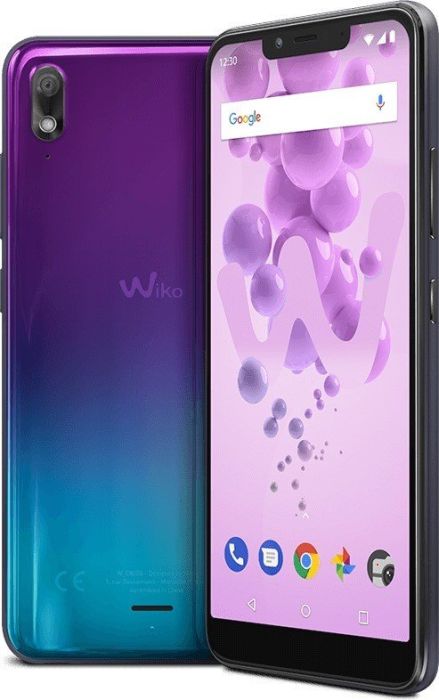
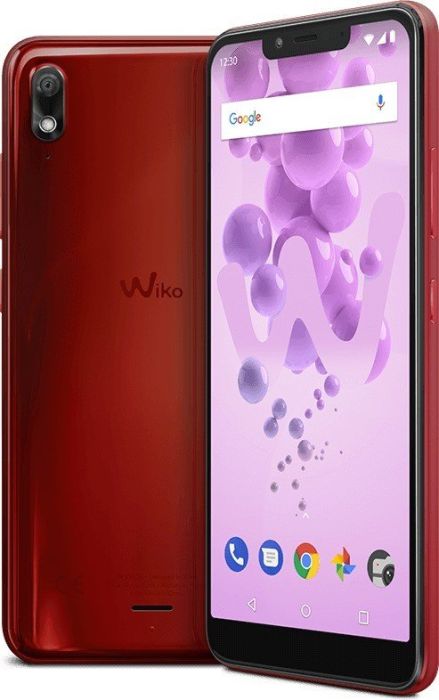
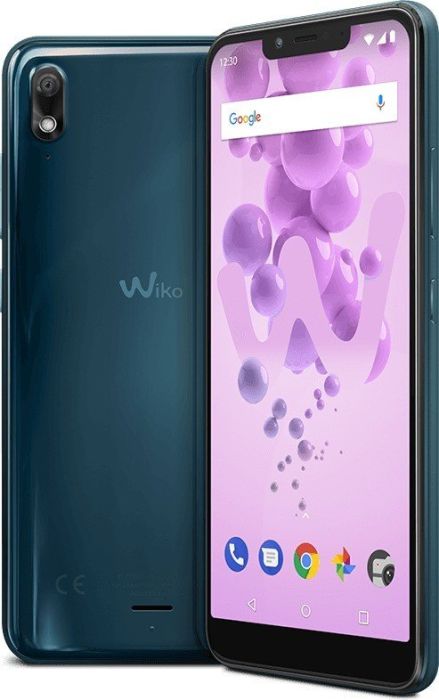
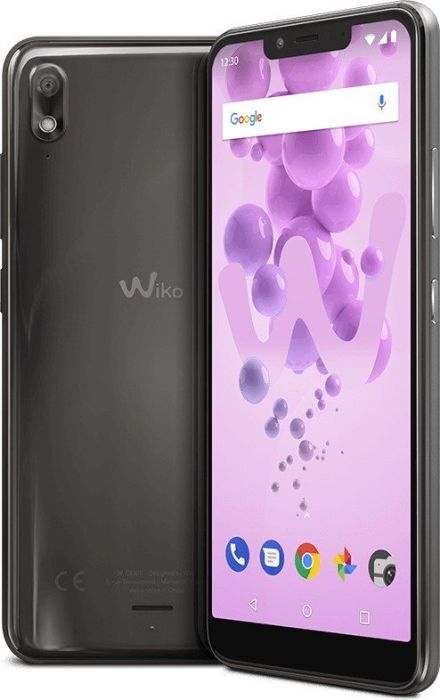
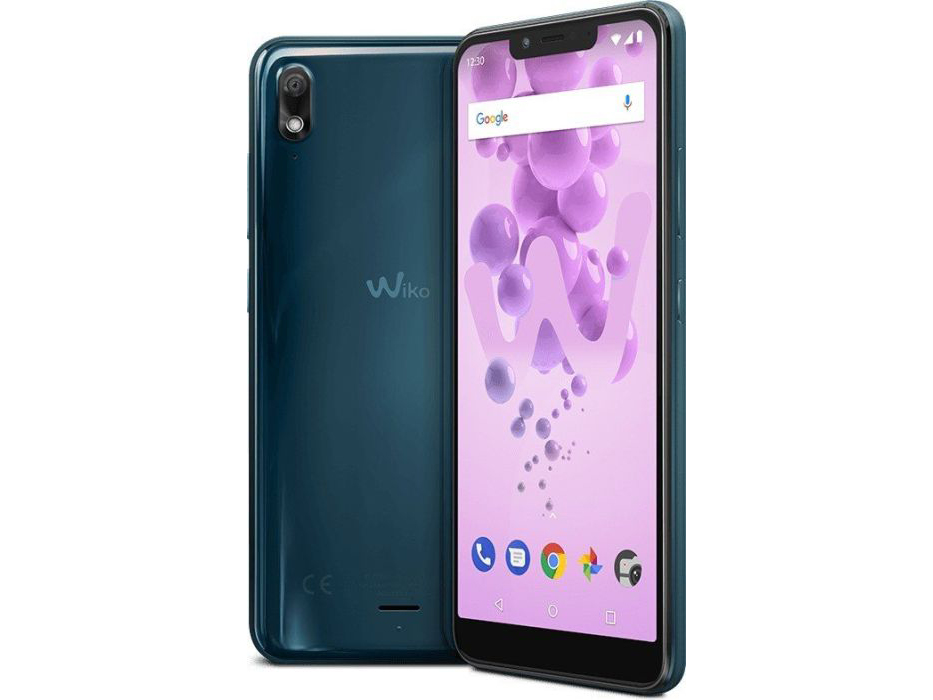
Wiko sells the View 2 Go in four colours, which the company markets as “Anthracite”, “Cherry red”, “Deep Bleen” and “Supernova”. Our test device is the “Deep Bleen” version, which is a mixture of blue, green and grey to our eyes. Before you go searching for other examples of “Bleen”, it is just a contraction of "blue" and "green". The “Supernova” variant is the most visually exciting colour in our opinion, but it does not shimmer in the light like the Supernova version of the View 2 Plus.
Our test device is well-built, but we did notice a slight indent next to the rear-facing camera, which is indicative of the device’s weak back case. Moreover, we can get the screen to deform by applying pressure to the case. Additionally, while our test device looks lovely, the back case is prone to picking up fingerprints because of its glossy finish, which is unfortunate.
Connectivity
Wiko sells the View 2 Go with either 16 GB or 32 GB of eMMC flash storage, of which our test device is equipped with the latter. The device supports microSD-card expansion, for which it has a dedicated card slot, and it has two nano SIMs just like the View 2 Plus. In short, the View 2 Go is well-equipped for a device at this price.
There is also an FM radio, should you like to listen to the radio on your smartphone. Wiko has included a notification LED too.
Software
The View 2 Go ships with Android 8.1 Oreo. The French manufacturer had only released August 2018 Android security patches for our test device at the time of testing though, which were by then over four months old. We had the same experience with the View 2 Plus too, so we would be surprised if Wiko updates either device to Android 9 Pie or beyond.
Wiko has left Android 8.1 Oreo untouched, which is pleasing to see and not always the case with budget devices. Our test device has no preinstalled third-party apps either, which keeps the device’s usable storage to a maximum.
Communication & GPS
The View 2 Go supports all major GSM and 3G frequencies, but it has limited LTE coverage with support for only five LTE bands. You should have no problem with connecting to an LTE network in Central Europe, but you will have to do without an LTE connection if you live or regularly travel elsewhere.
The device supports LTE Cat. 6 for up to 300 Mb/s download and 50 Mb/s upload speeds, the former of which is faster than what the View 2 Plus can theoretically achieve. We experienced no reception issues during our tests in a built-up area too.
The View 2 Go supports most modern Wi-Fi standards up to IEEE 802.11n and can connect to 2.4 GHz Wi-Fi networks. Wiko appears to have equipped the View 2 Go and the View 2 Plus with the same Wi-Fi module as both devices performed equally well in our iperf3 Client Wi-Fi tests with our Linksys EA8500 reference router. The Honor 7A and the Moto G6 Play achieved slightly slower transfer speeds than our test device, but all devices in our comparison table are slower than the class average.
| Networking | |
| iperf3 transmit AX12 | |
| Huawei Y7 2018 | |
| Wiko View 2 Plus | |
| Wiko View 2 Go | |
| Motorola Moto G6 Play | |
| Honor 7A | |
| iperf3 receive AX12 | |
| Huawei Y7 2018 | |
| Wiko View 2 Go | |
| Wiko View 2 Plus | |
| Honor 7A | |
| Motorola Moto G6 Play | |
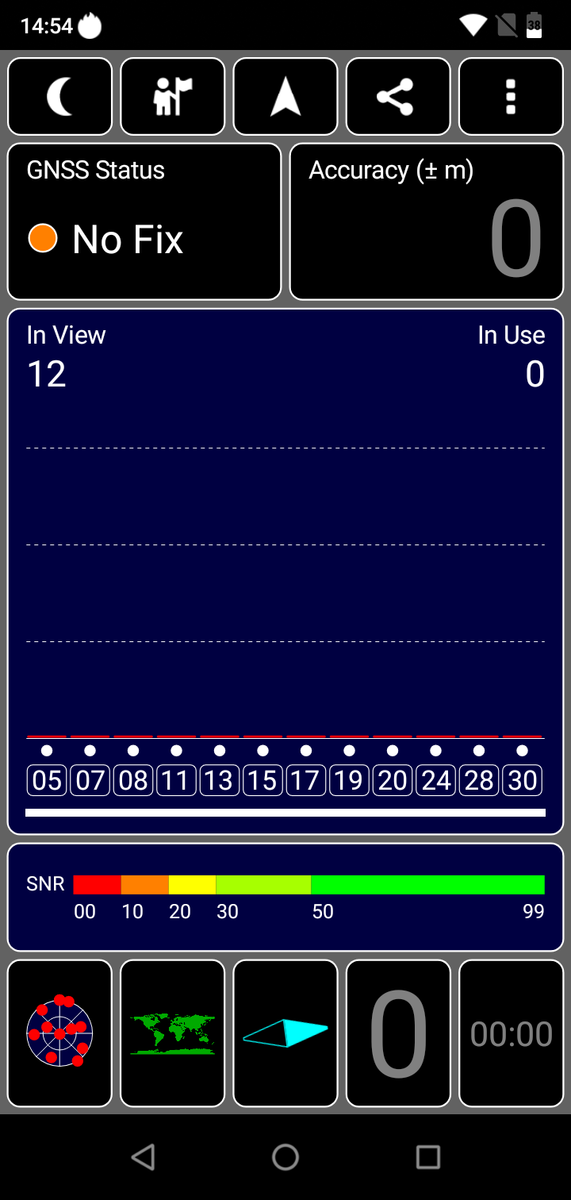
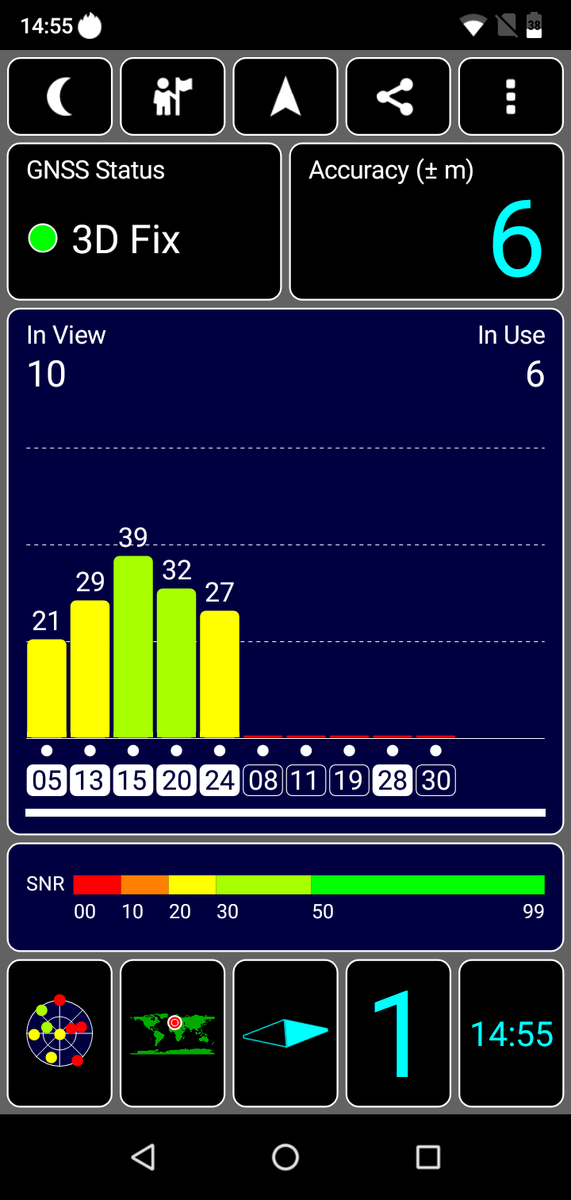
The View 2 Go uses GPS and A-GPS for location services. Our test device cannot locate us indoors, but it found a satellite fix with up to six metres accuracy when we tested it outside.
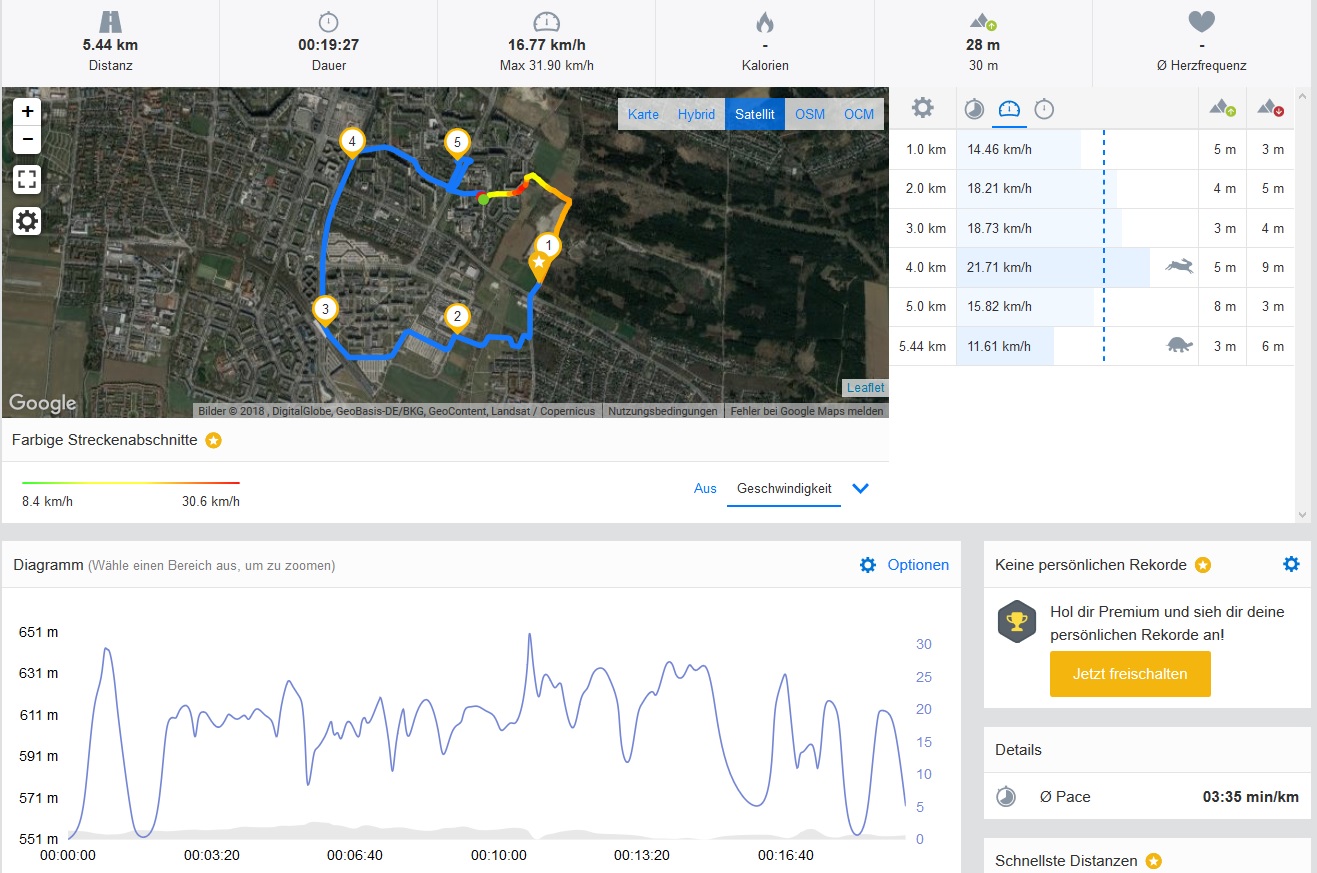
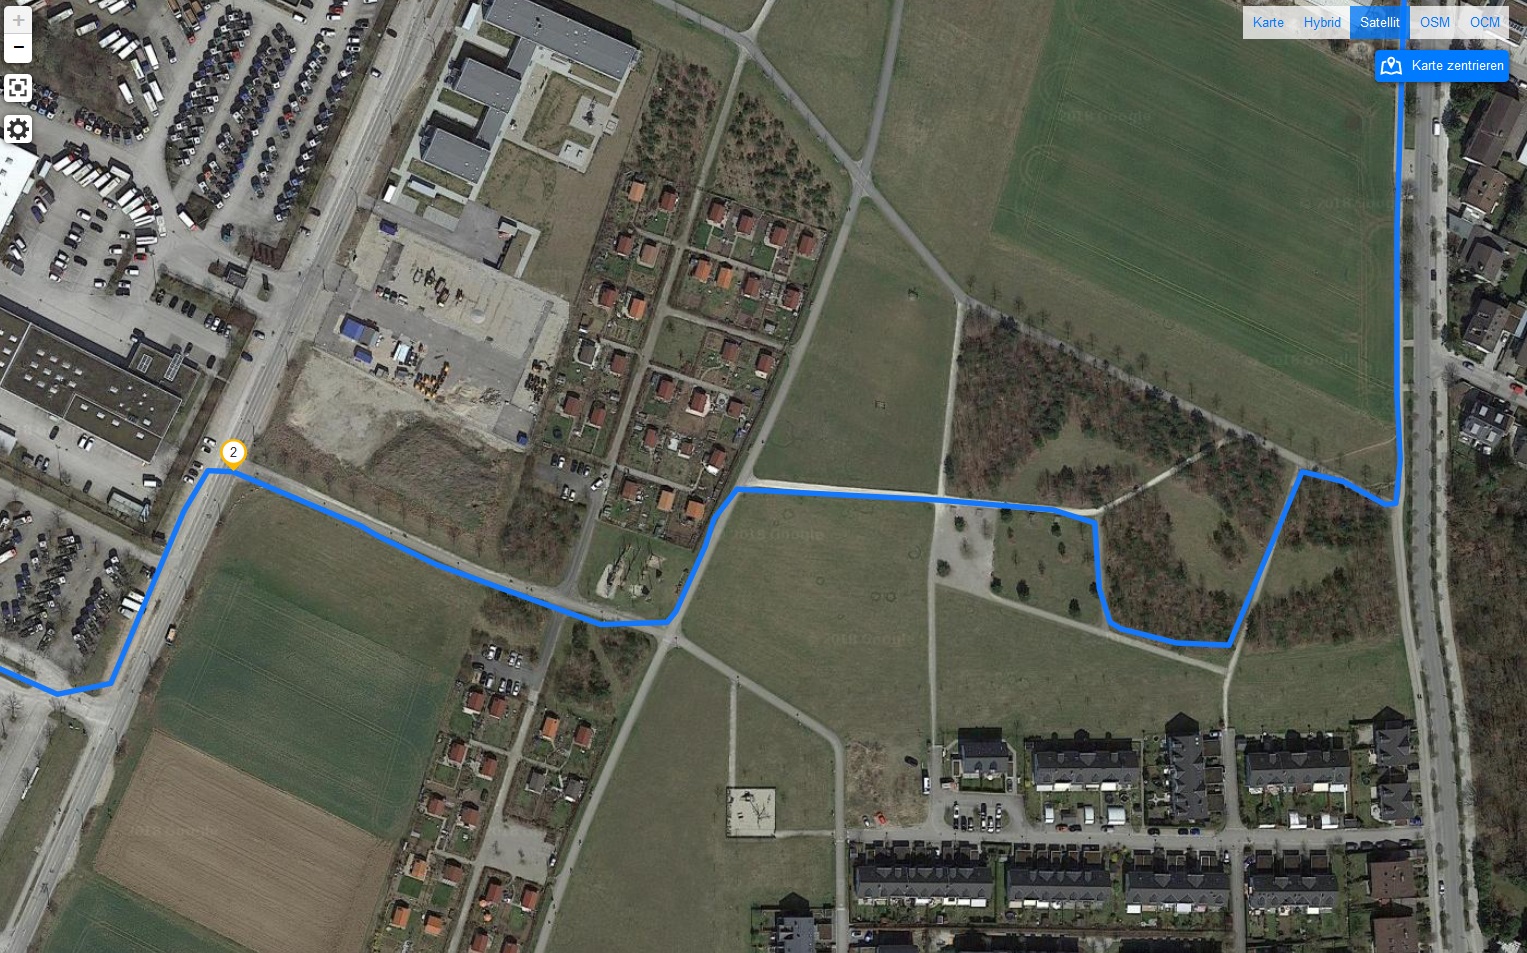
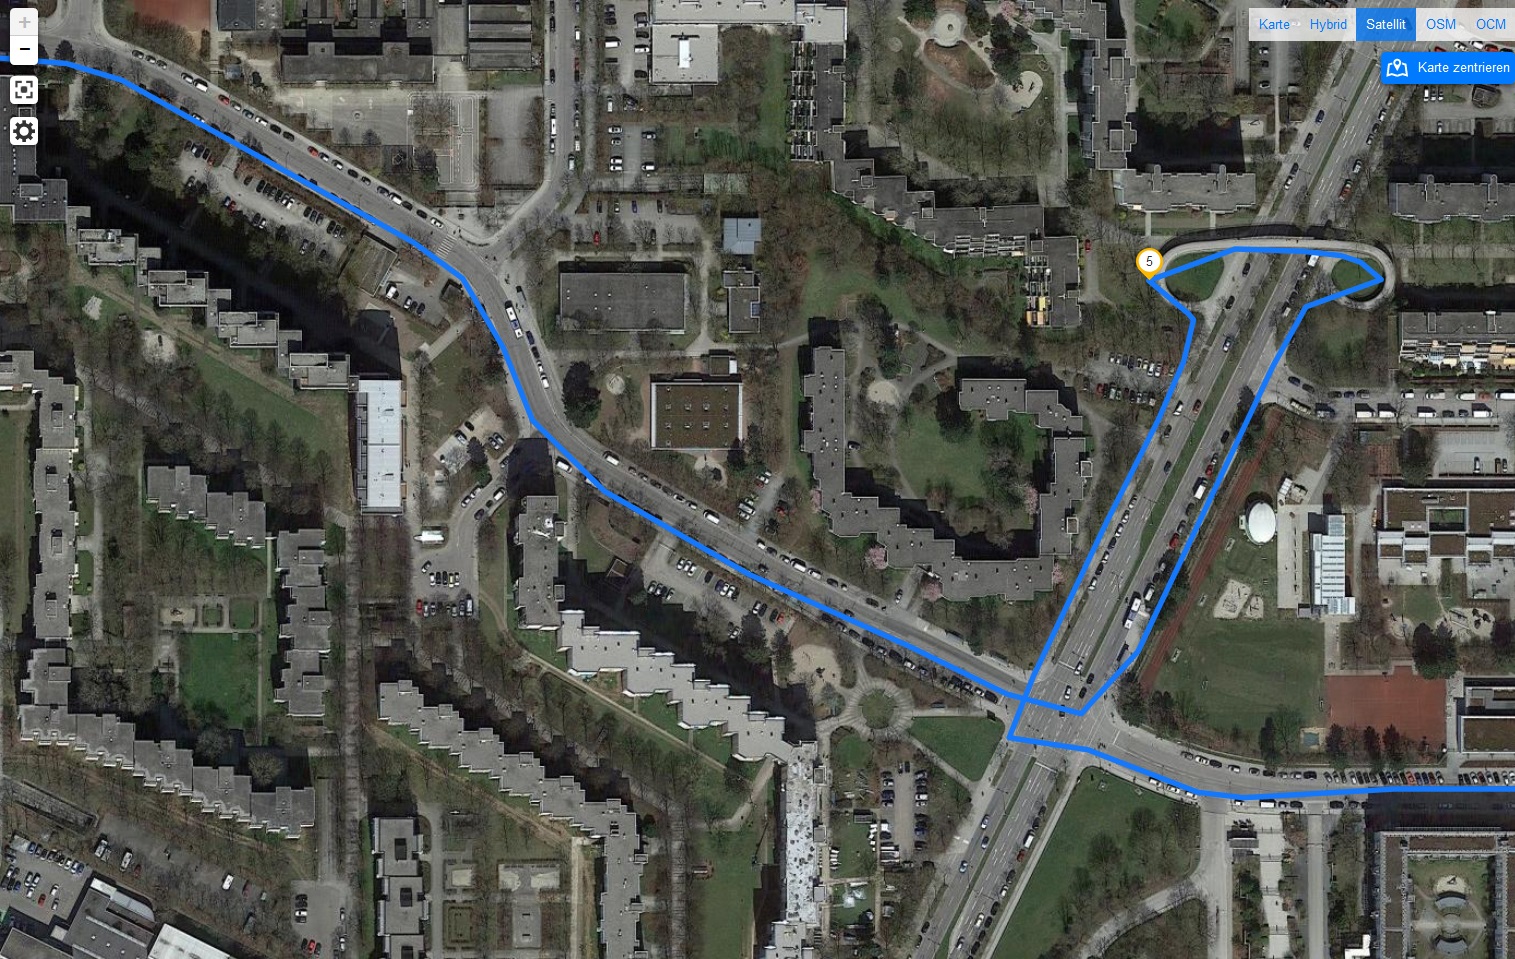
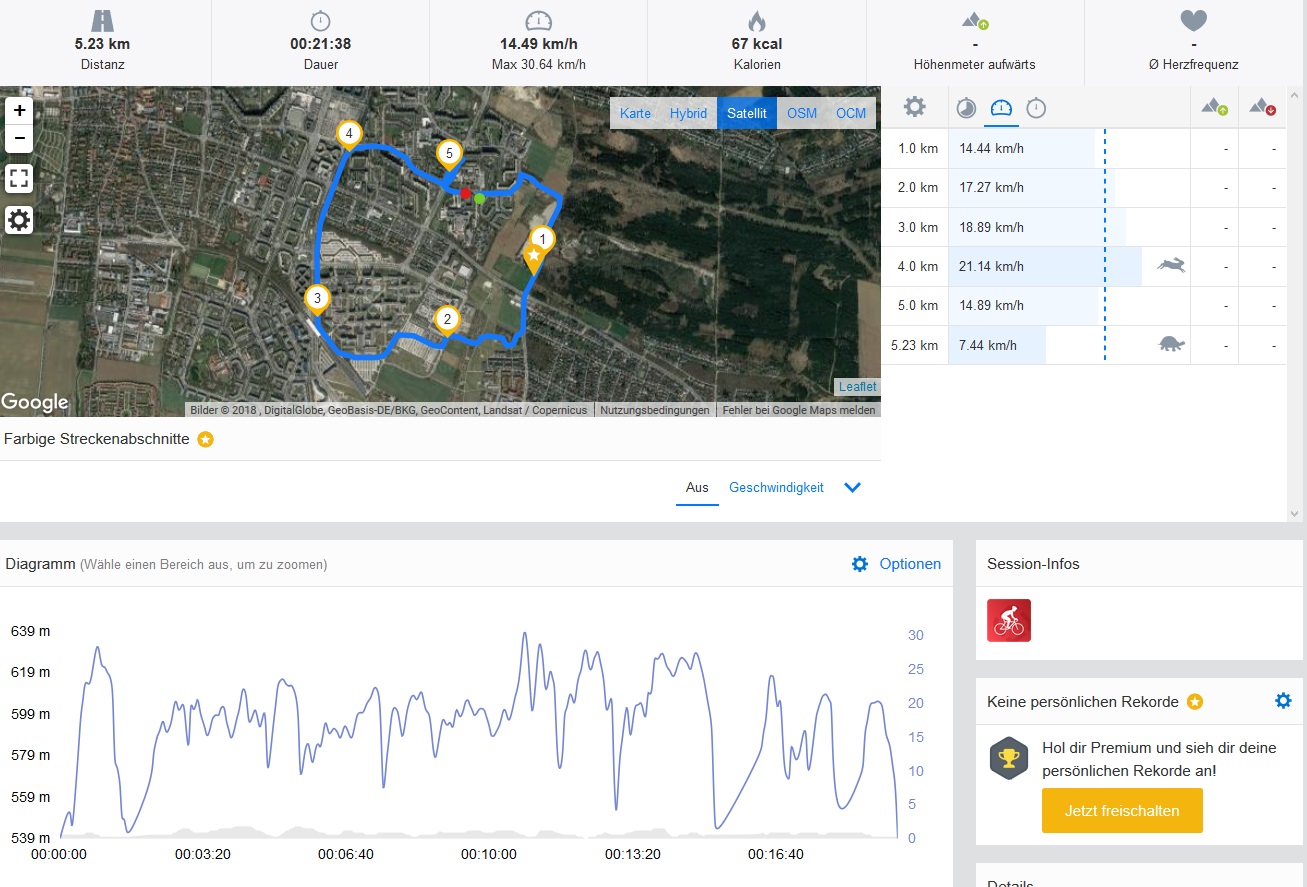
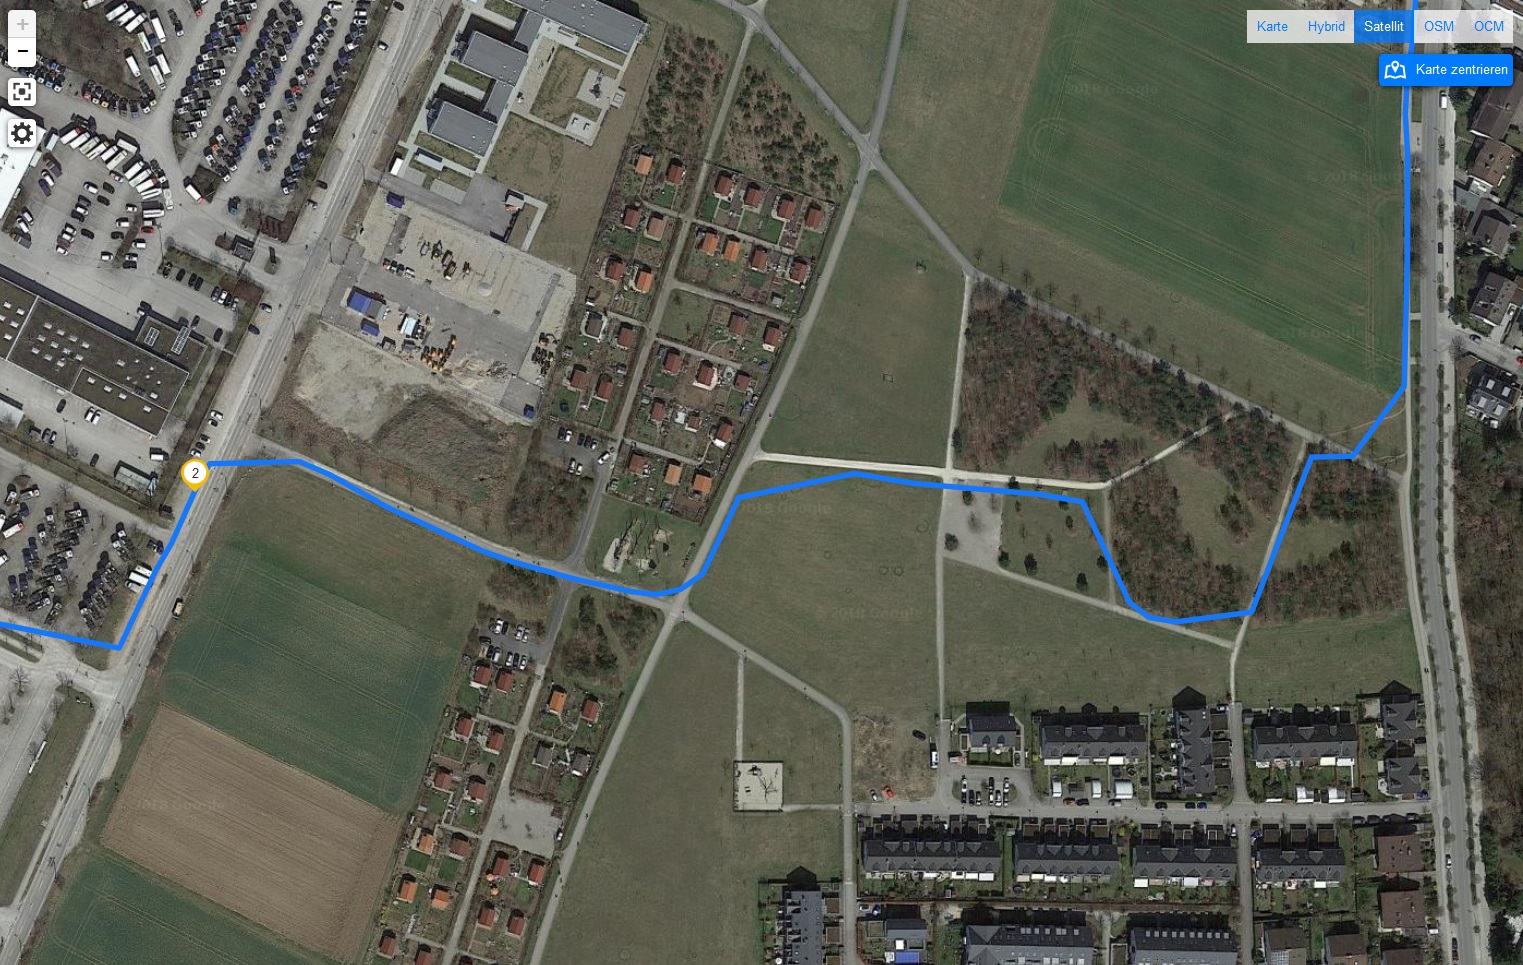
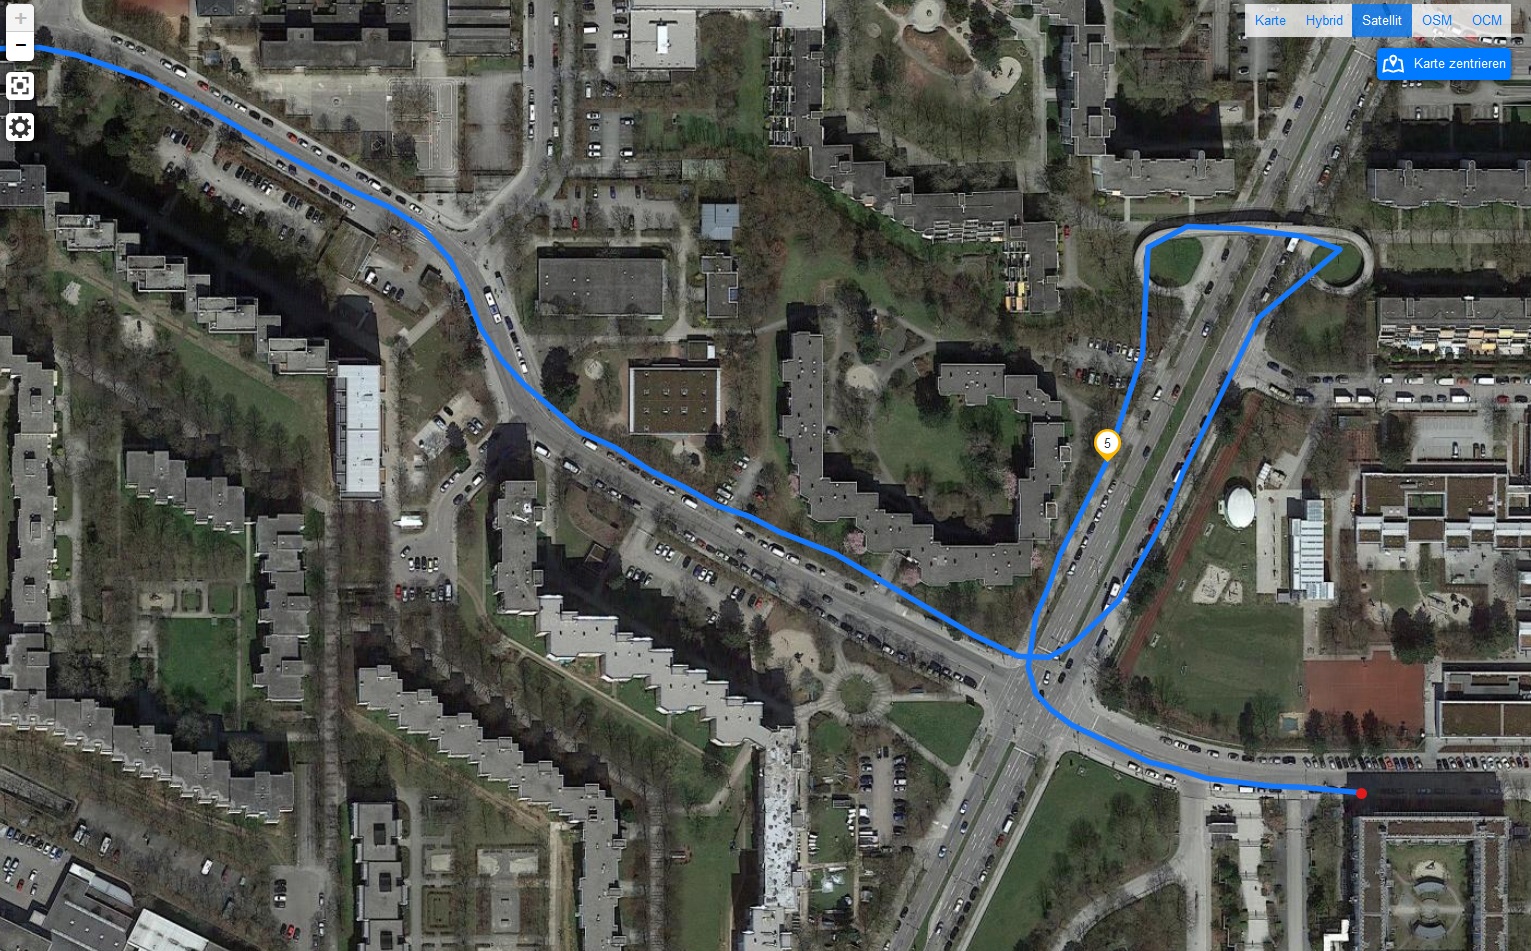
We also took the device on a bike ride to compare its location accuracy against our reference navigation system, the Garmin Edge 520. Our test device performed well but deviated by 210 metres over the 5.44 km that our Garmin recorded us having cycled. The View 2 Go is accurate enough for a device in its price range, but it regularly took shortcuts to keep up with us as demonstrated by the screenshots below. Overall, the View 2 Go is accurate enough for general navigation tasks, but we would recommend using a device with a better GPS module if you require precise location data.
Telephone Functions & Call Quality
The phone app looks and functions just like the Google app. There is also a dark mode, which is a welcome addition.
The View 2 Go has decent call quality, with our call partner sounding clear and intelligible throughout our tests. The microphone did a good job at suppressing background noise too, but it distorted our voice when we spoke loudly. Moreover, our call partner’s voice sounded rather thin over the loudspeaker, and the microphone struggled to capture our voice. The microphone handles quieter voices better, but our voice then sounded overly quiet to our call partner.
Cameras

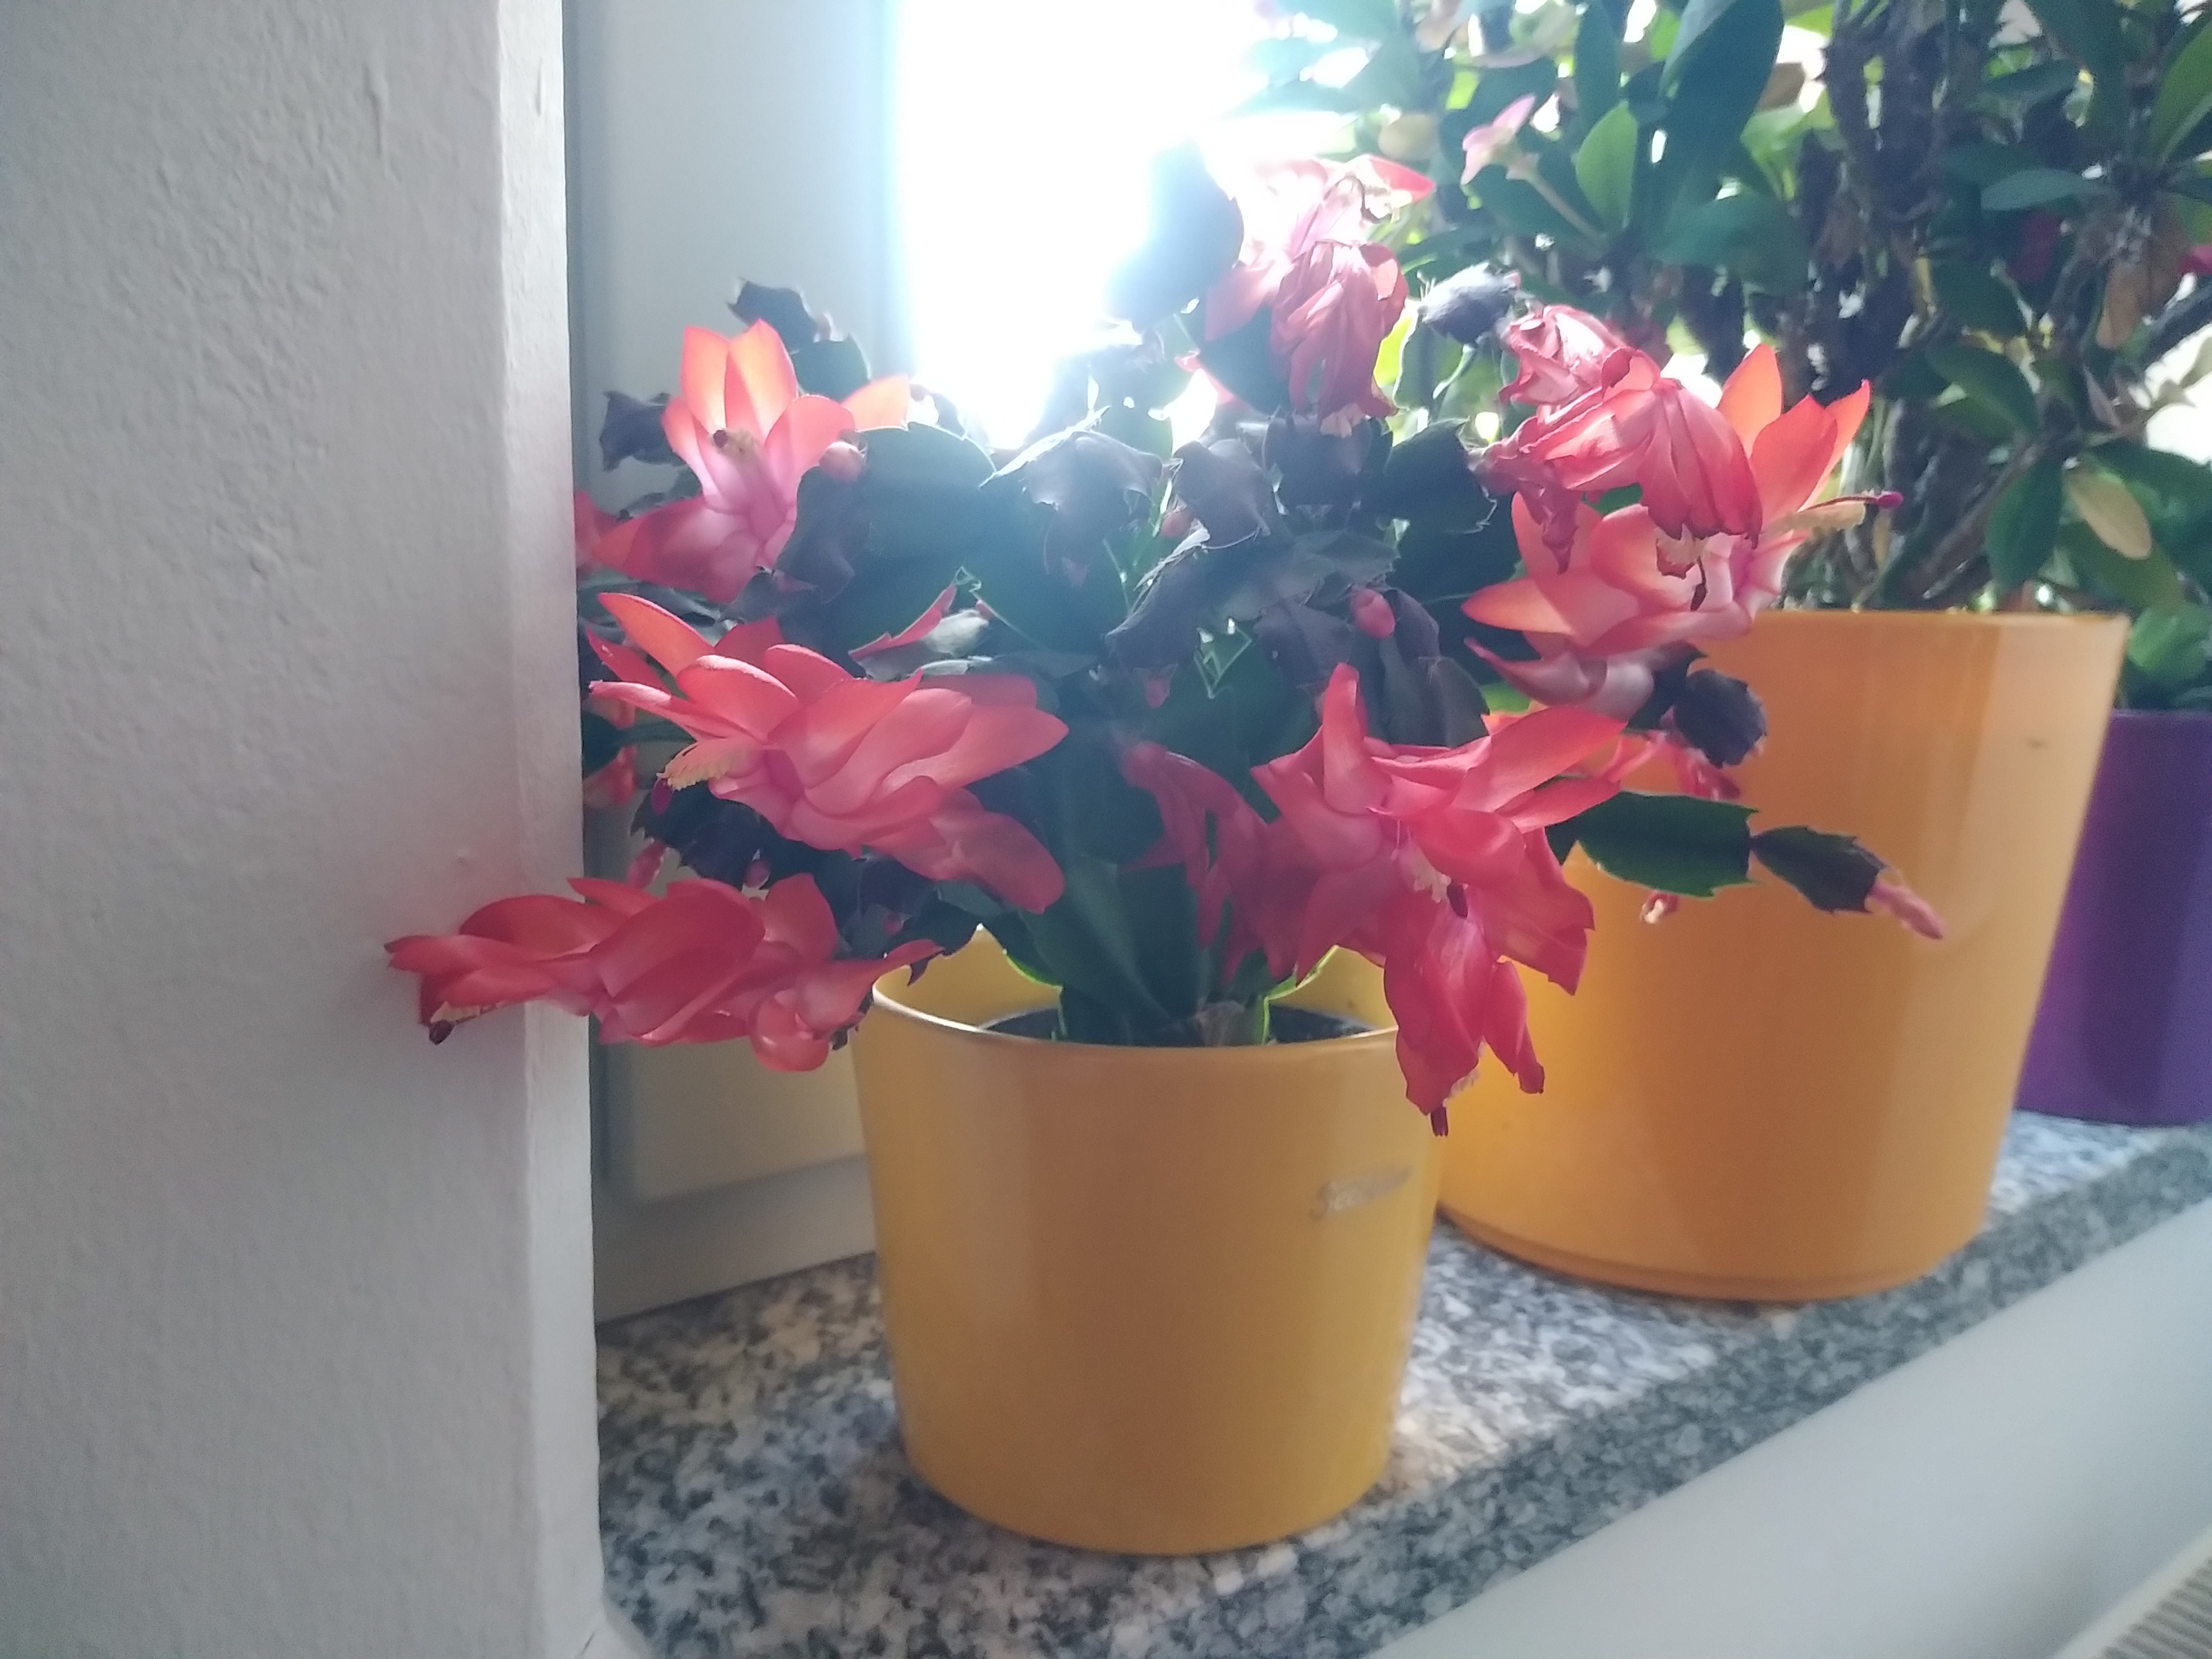
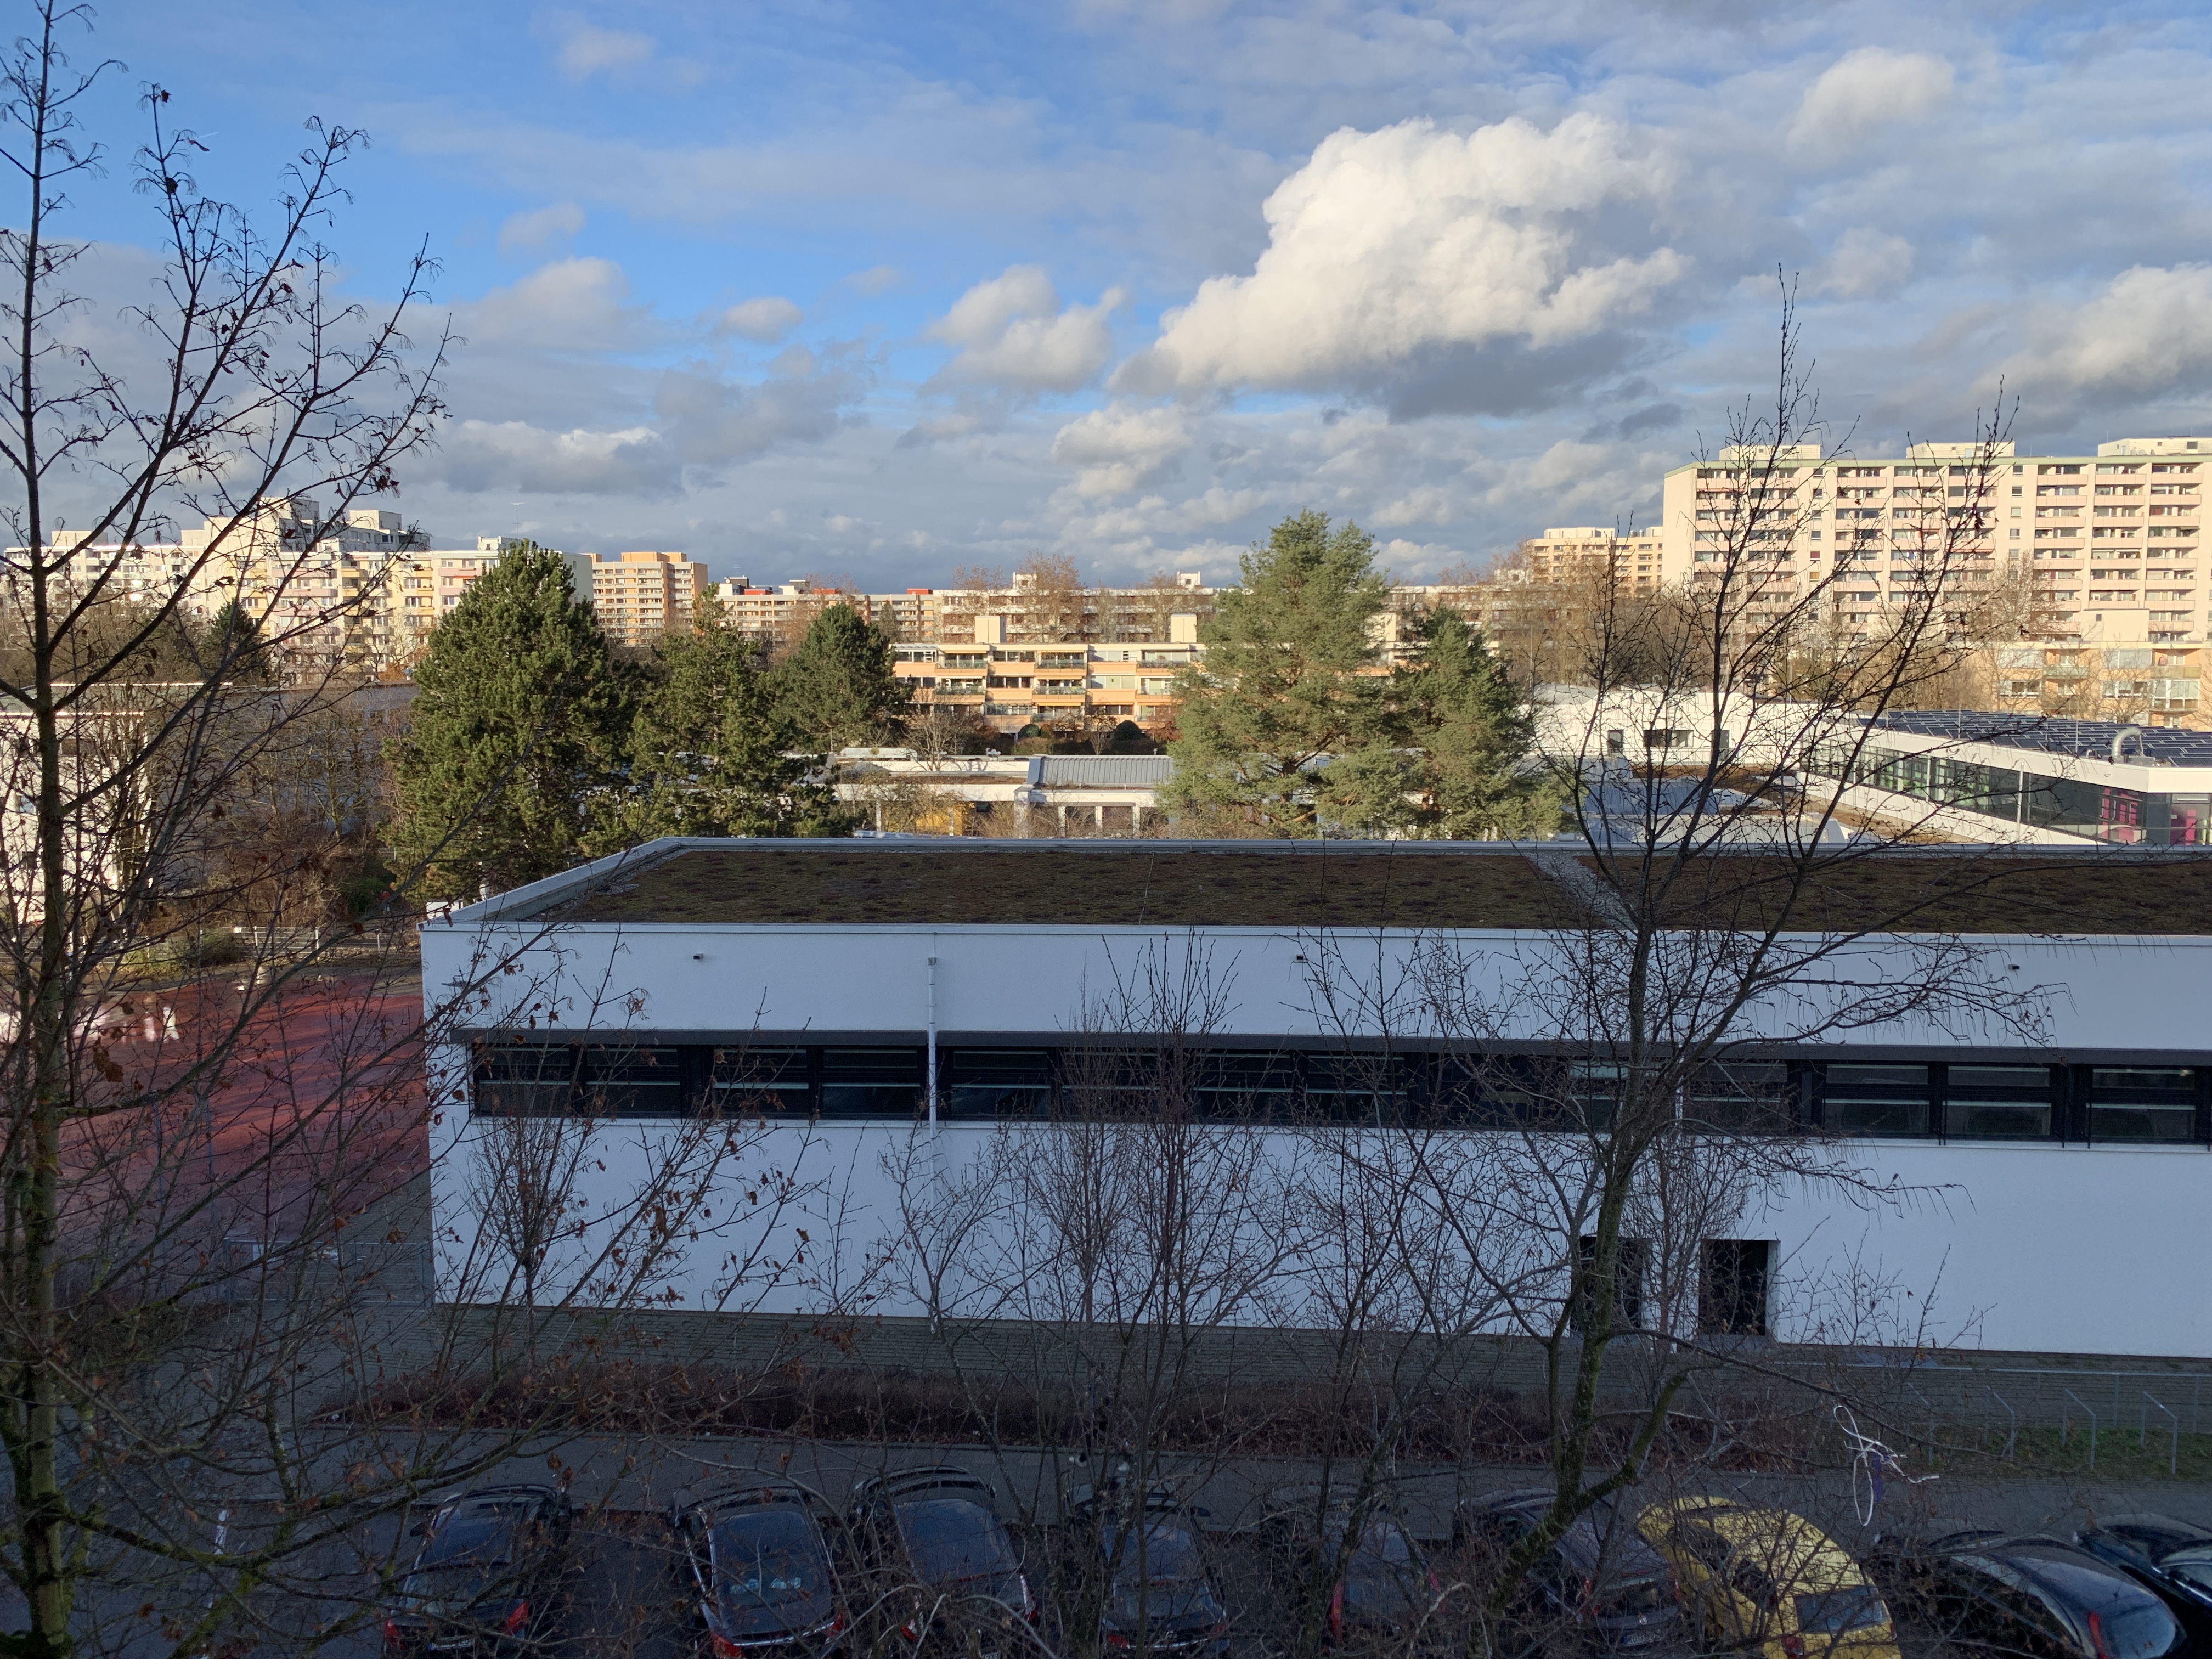
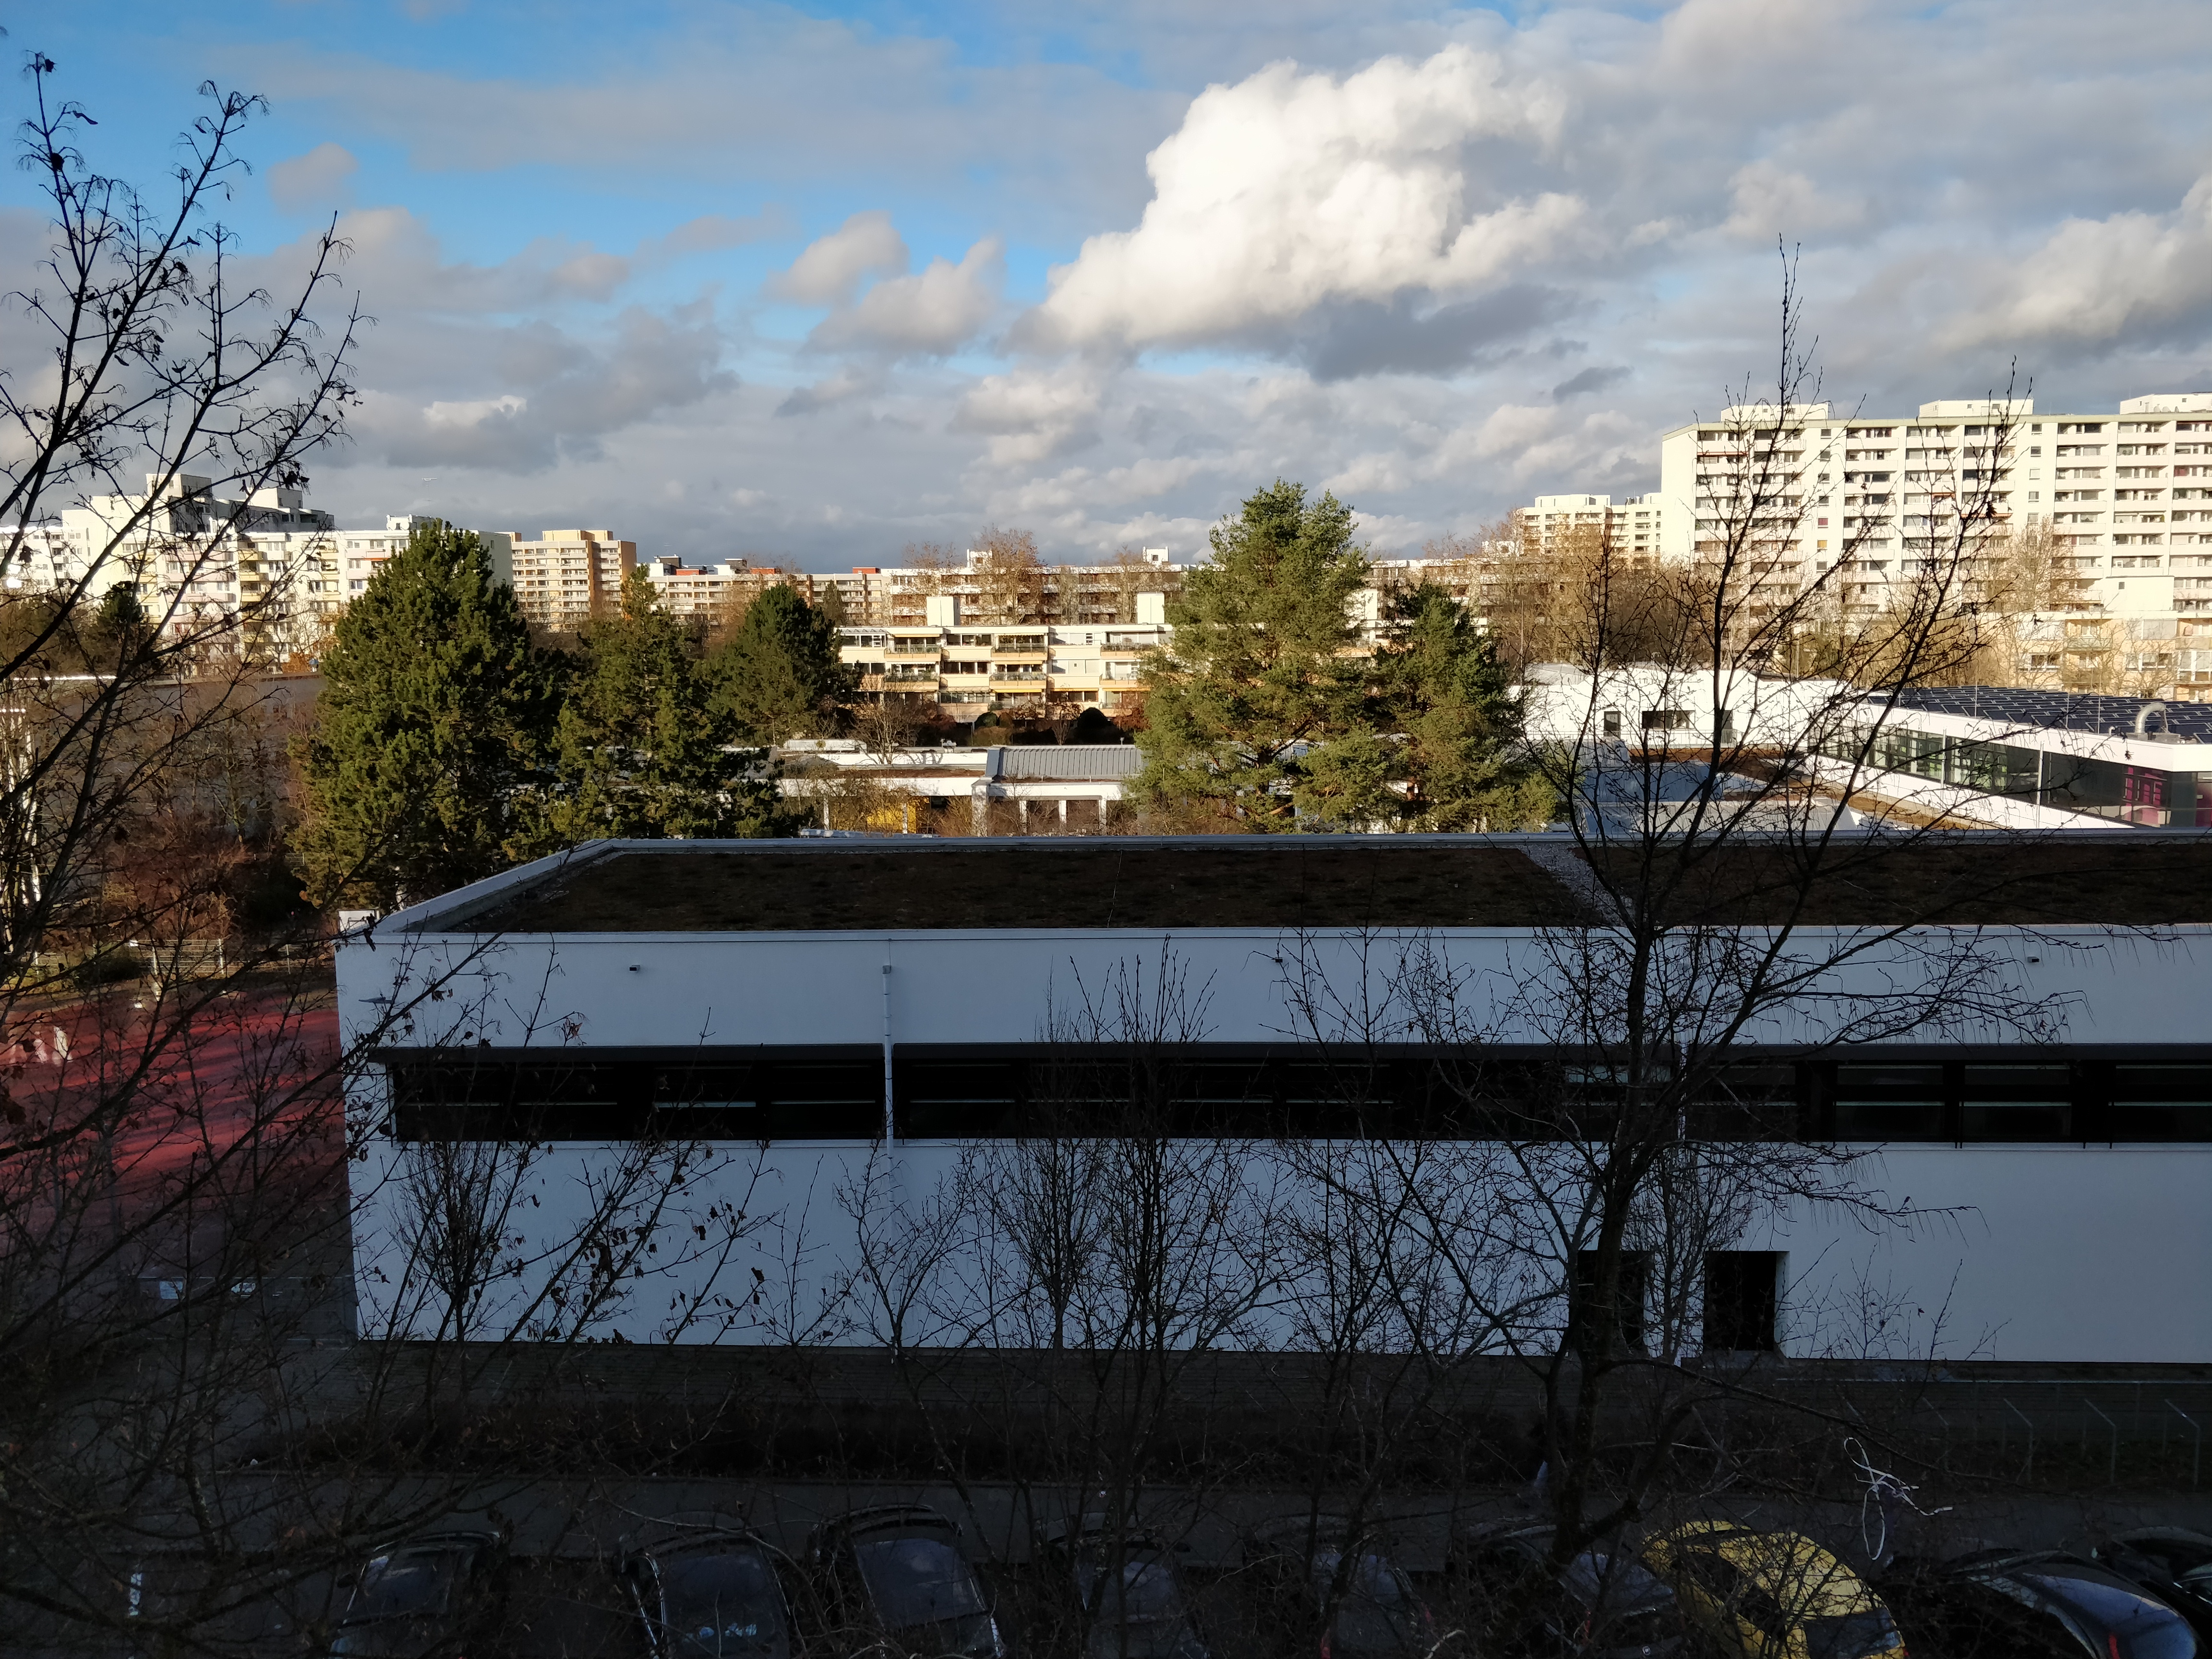
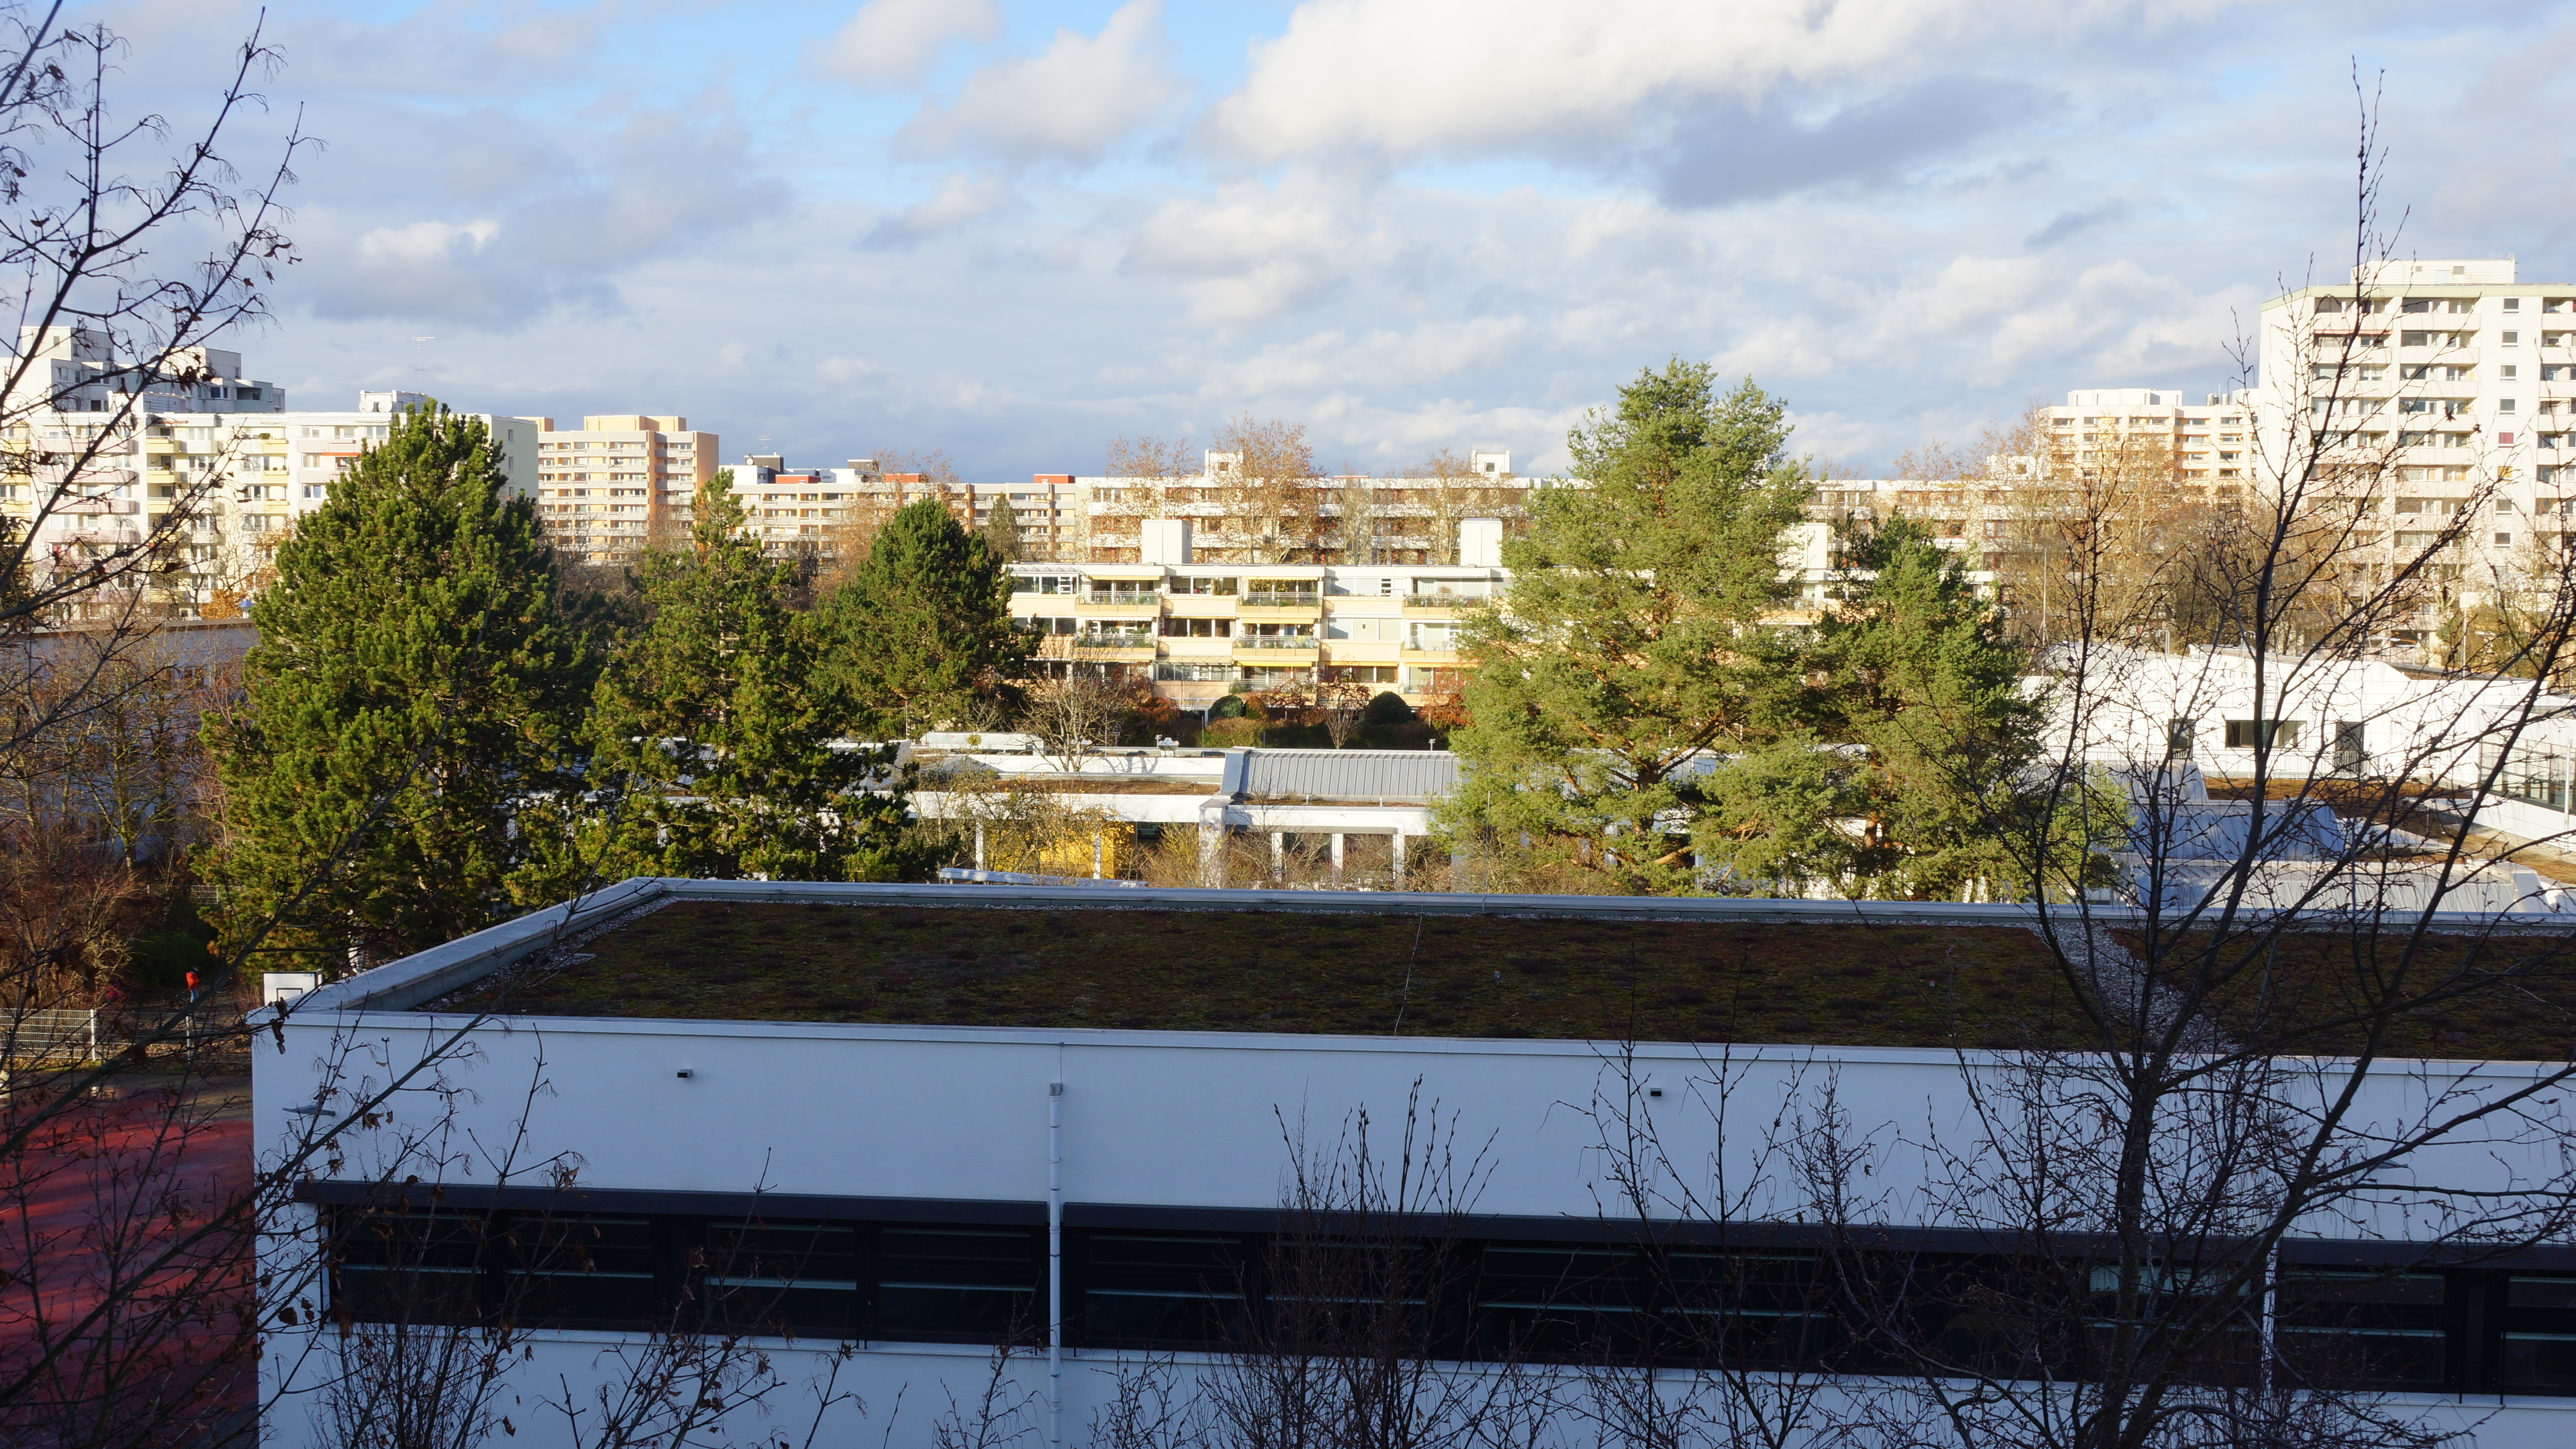
The View 2 Go has no second rear-facing camera like the View 2 Plus does, but the bokeh-effect pictures that it helped create were so poor that we do not miss its absence. The device has a 12 MP rear-facing camera like its sibling too, which produces decent-looking pictures, although these contain hardly any detail. Moreover, the camera struggles to capture areas of homogenous colour accurately, which makes the skies in photos look artificial. The camera performs reasonably well in low-light conditions too, but it cannot compete with expensive smartphones as demonstrated by our comparison photos below.
The View 2 Go can record videos in up to 1080p at 30 FPS. Videos generally look sharp, while the image quality is passable. The rear-facing sensor adjusts exposure levels quickly in changing lighting conditions too, and the microphone records audio cleanly.
Wiko has equipped the View 2 Go with a 5 MP front-facing camera, which generally takes washed-out looking photos with passable colour reproduction. In short, the front-facing camera is good enough for occasional selfies but do not set your expectations too high.


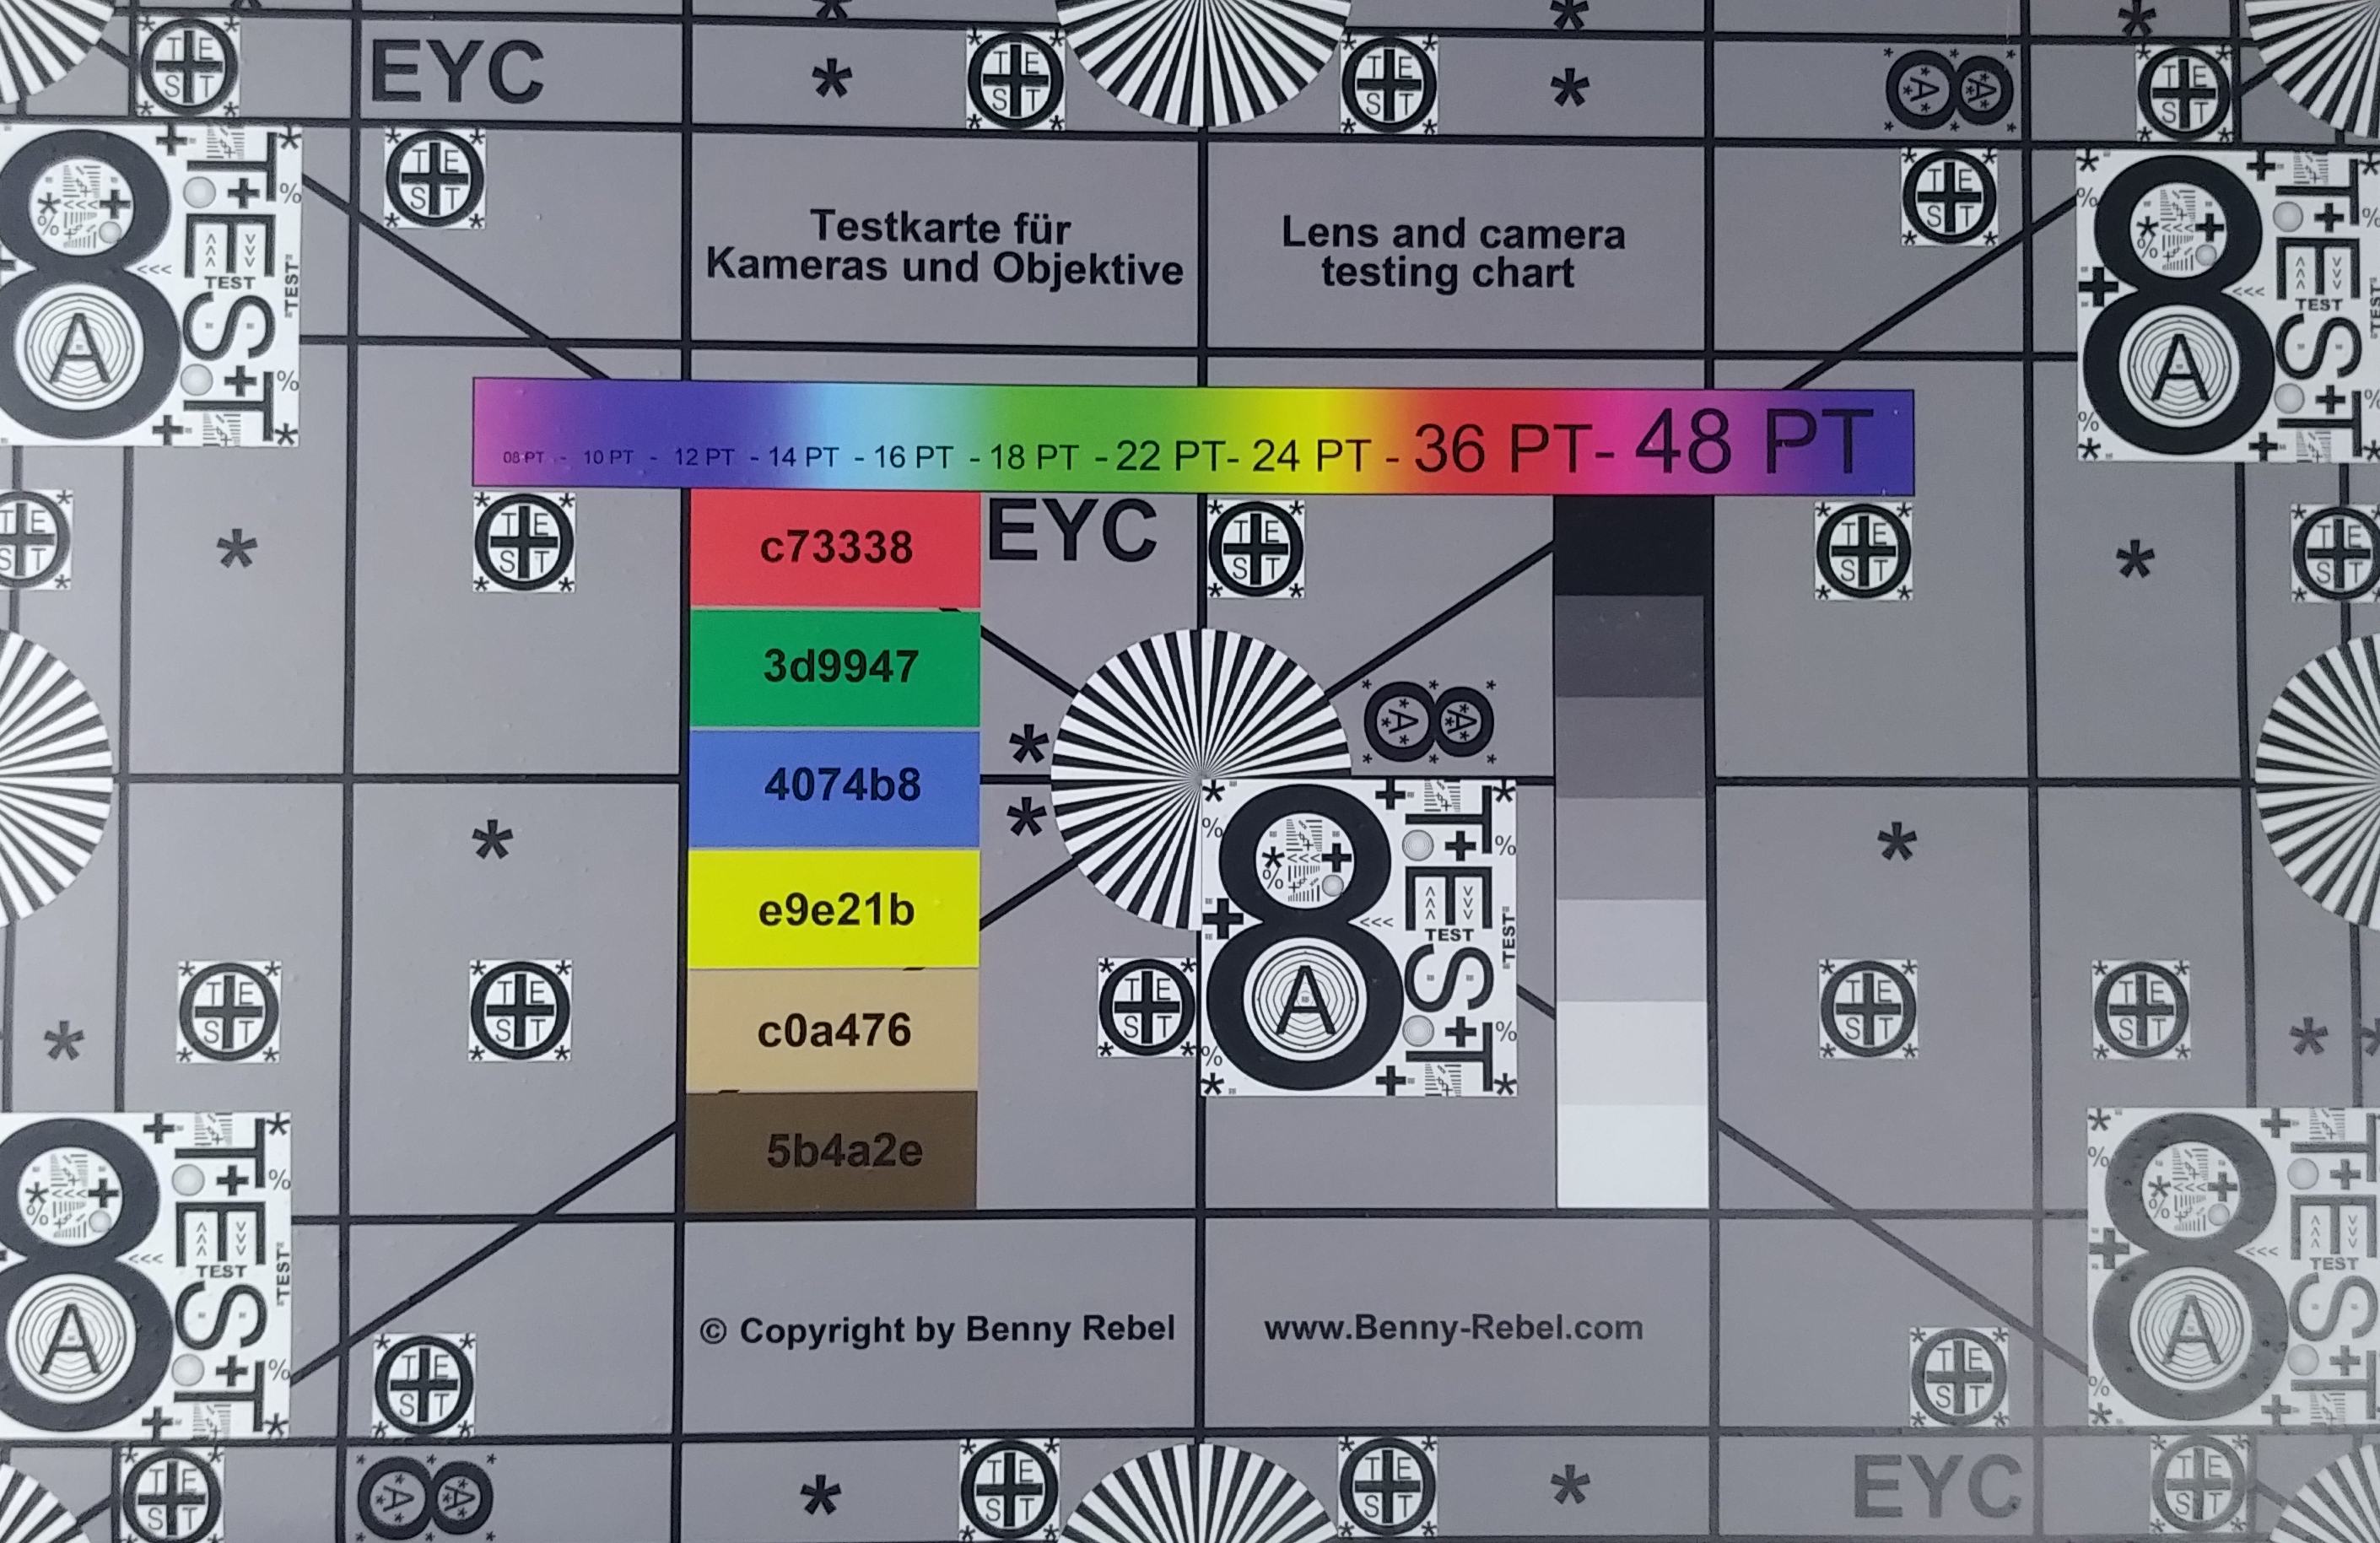
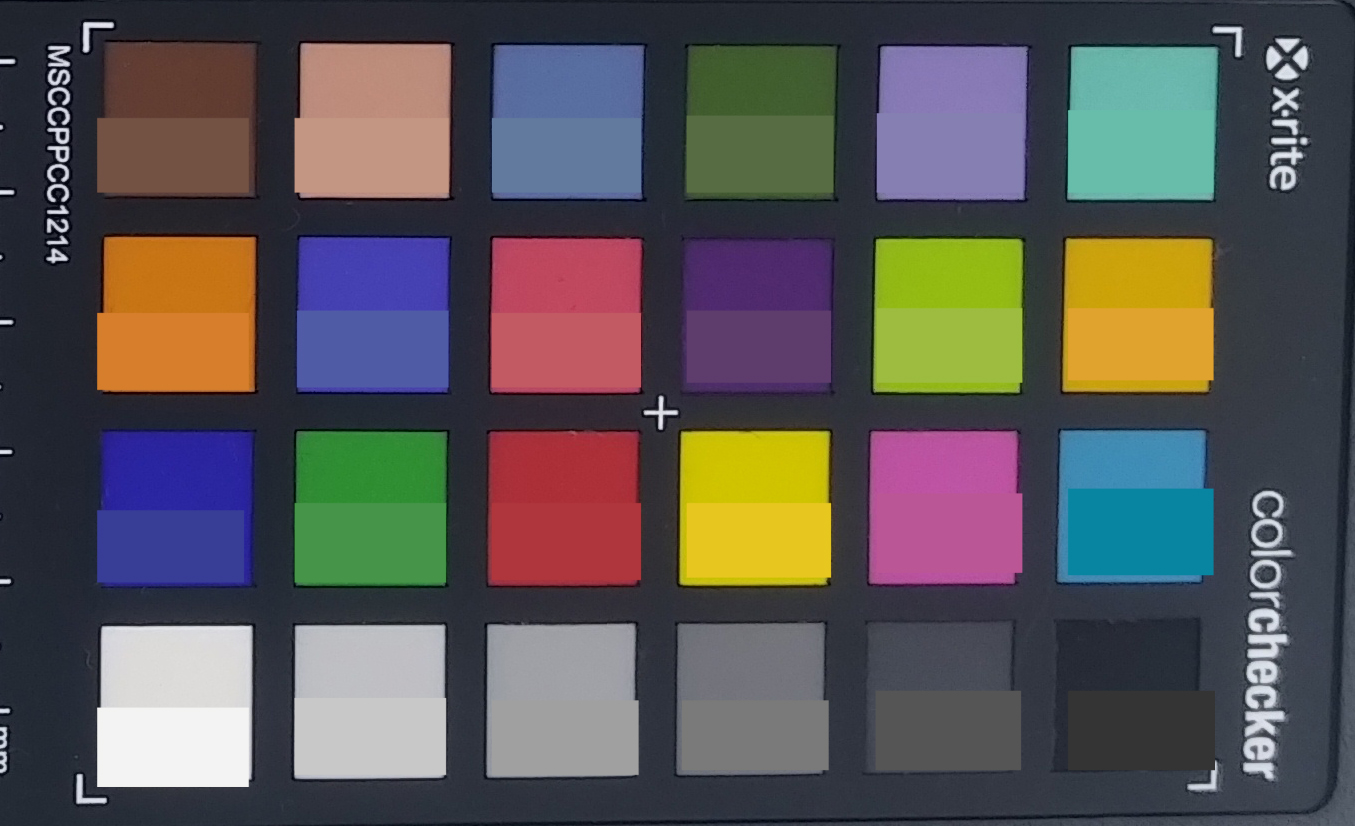
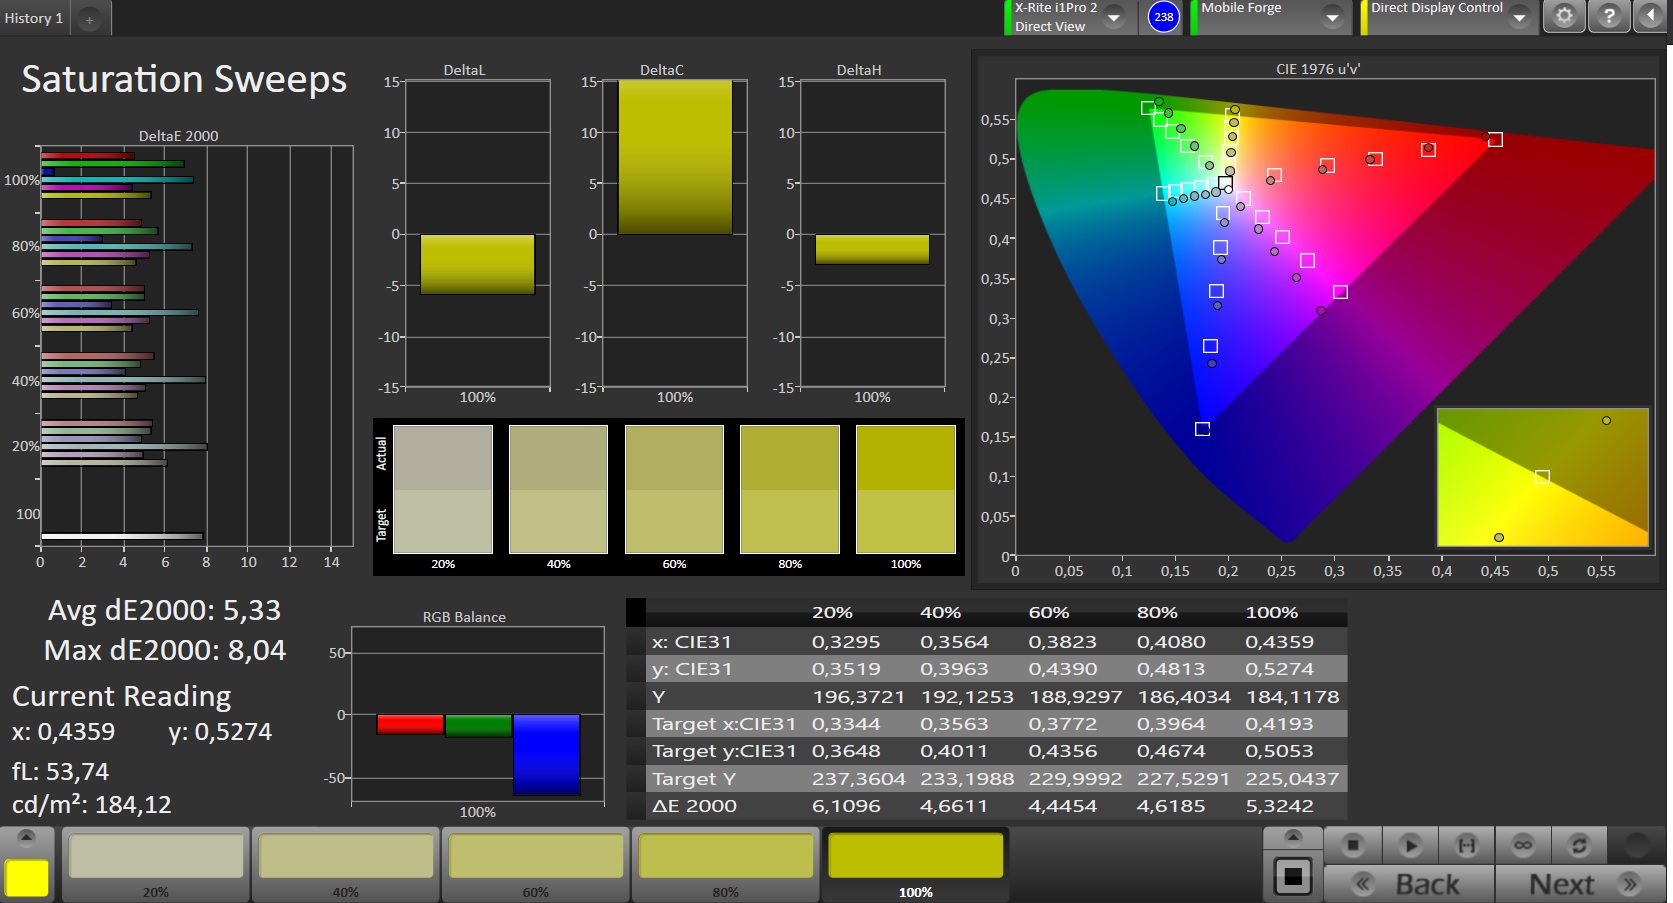
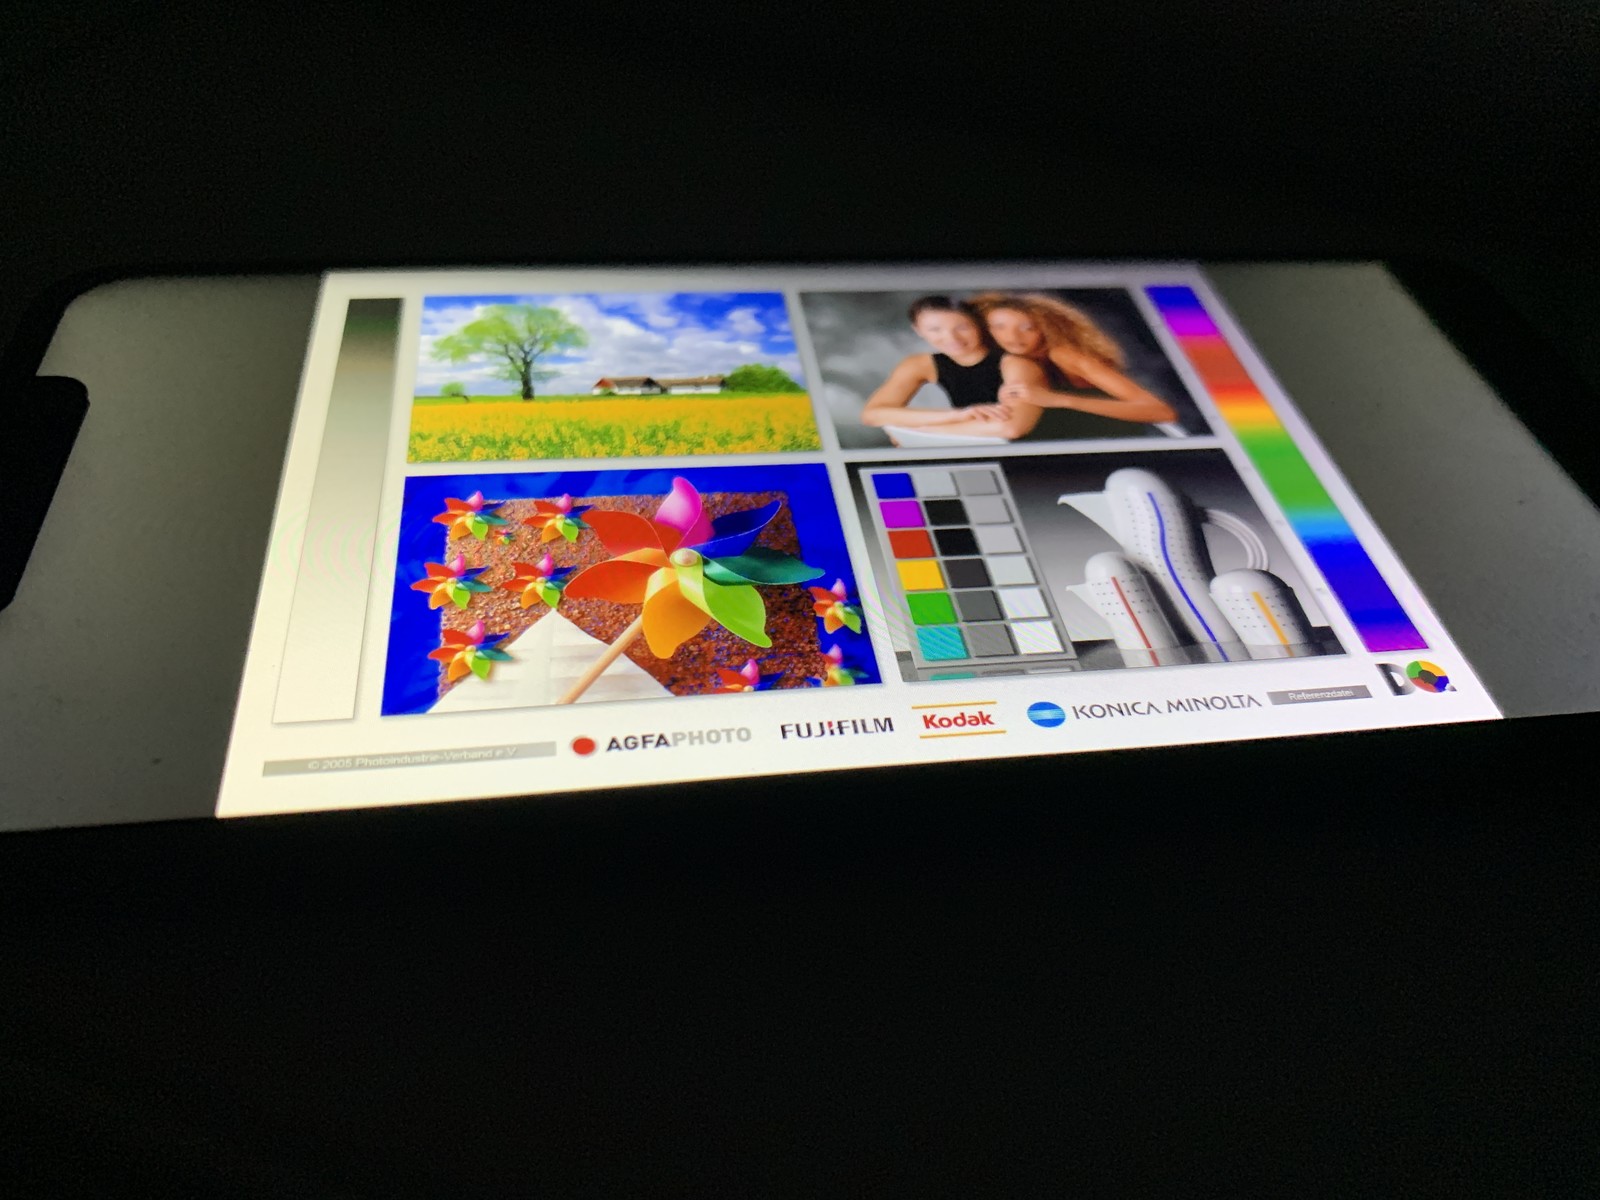
We also subjected the View 2 Go to further camera tests under controlled lighting conditions. Our test device generally reproduced colours too darkly compared to the ColorChecker Passport reference colour, especially white, grey and black tones. Our test chart is captured sharply at the centre of the image and colours look vivid. However, contrast levels noticeably drop off in three of the four corners of the chart.

Accessories & Warranty
The View 2 Go comes with a charger, a USB cable, a SIM tool, and a pair of headphones. The headphones that came with our test unit emit a rather high-pitched sound when connected to the device though, which is disappointing. Wiko states on its website that it sells a Smart Folio cover and a hardcover for the View 2 Go like it does with the View 2 Plus, but they were not available to purchase at the time of writing either from Wiko or from third-party sellers.
The View 2 Go comes with a 24-month manufacturer’s warranty. Please see our Guarantees, Return policies and Warranties article for country-specific information.
Input Devices & Operation
The touchscreen on our test device worked well throughout testing, although smaller UI scaling would have helped the display feel more precise.
Wiko has not included a fingerprint sensor on the View 2 Go and markets its “Face Unlock” as being an alternative to inputting pin codes or passwords. Our test unit uses its front-facing camera for facial authentication, which has been an option on most Android smartphones for a few years now. The technology lacks the security of Apple’s FaceID or Huawei’s 3D facial authentication system and can be easily spoofed with a picture. In practical terms, you will need to use PIN codes or passwords for banking apps and password managers as the View 2 Go’s “Face Unlock” is not a method of biometric authentication.
The View 2 Go uses the standard three onscreen menu buttons for navigating around the OS. The device has two hardware buttons too, which are both located on the right-hand side of its frame. The power button and volume rocker both have clear pressure points and feel comparatively premium given how cheap the device is.
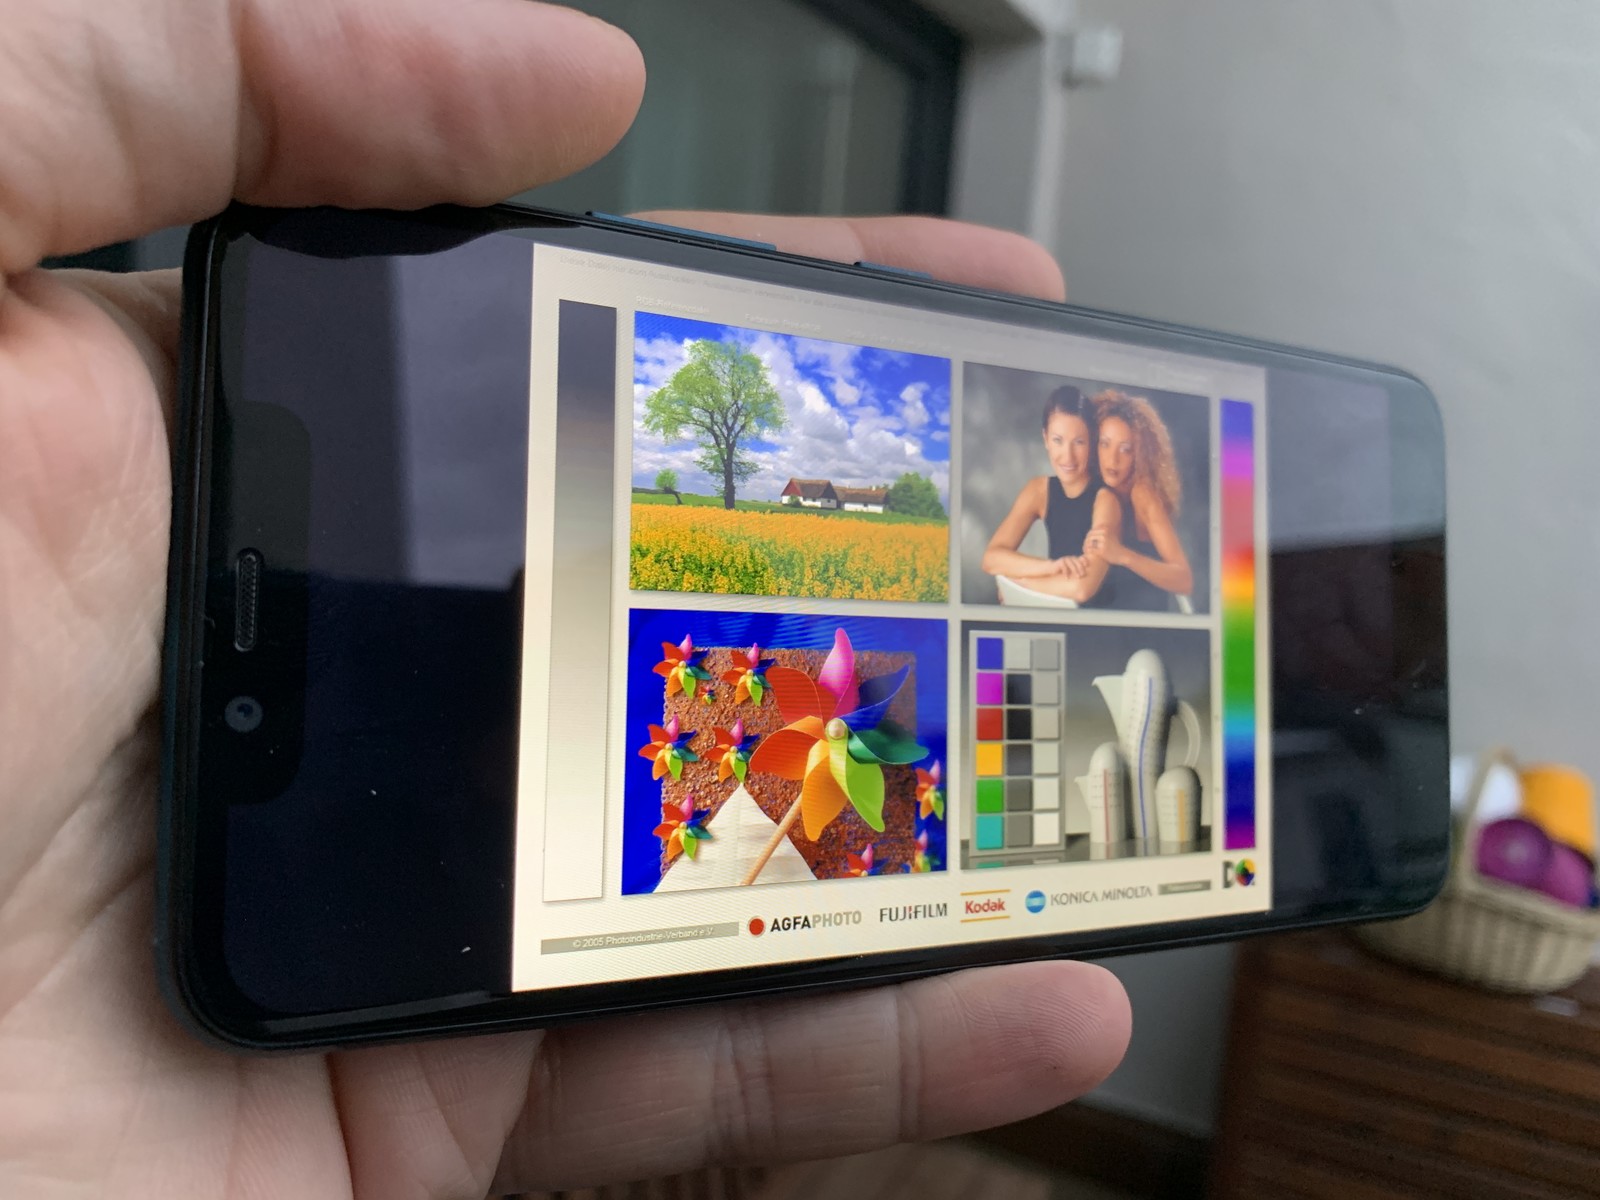
Display

The View 2 Go has a 5.93-inch IPS display that operates natively at 1512x720. The display is dominated by a significant notch and appears to be the same panel that Wiko used in the View 2 Plus. Our test device achieved a slightly lower average maximum brightness than its sibling, but this is within manufacturer tolerances. Other values are broadly the same too, with the View 2 Go also replicating the lacklustre brightness uniformity of the View 2 Plus.
| |||||||||||||||||||||||||
Brightness Distribution: 84 %
Center on Battery: 465 cd/m²
Contrast: 1453:1 (Black: 0.32 cd/m²)
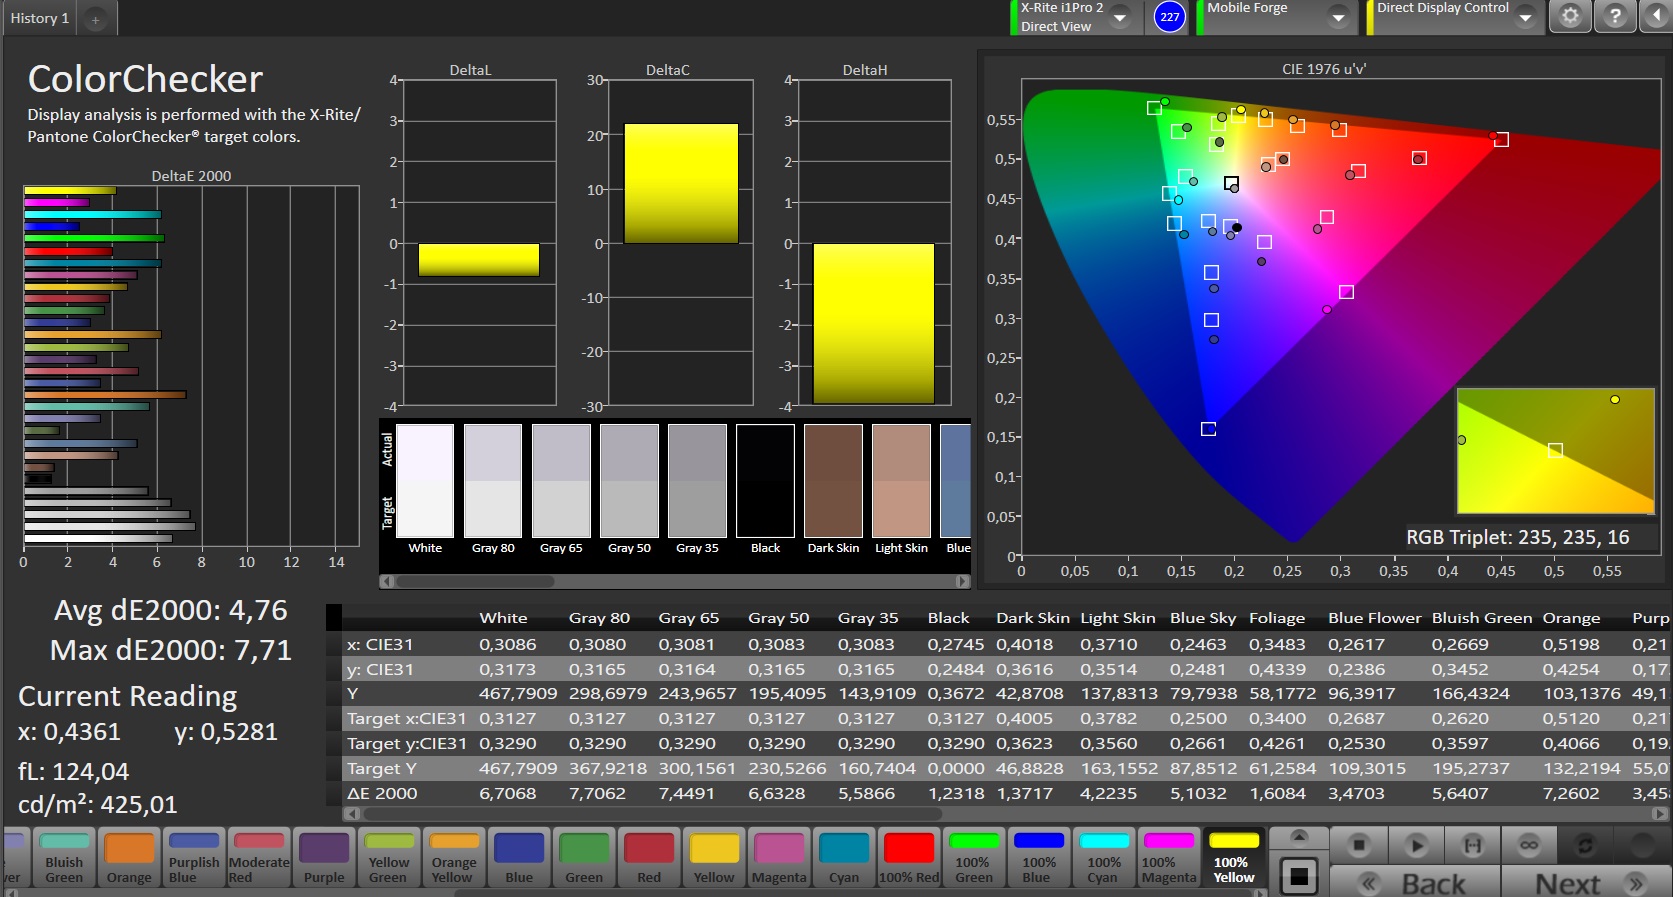
ΔE ColorChecker Calman: 4.76 | ∀{0.5-29.43 Ø4.72}
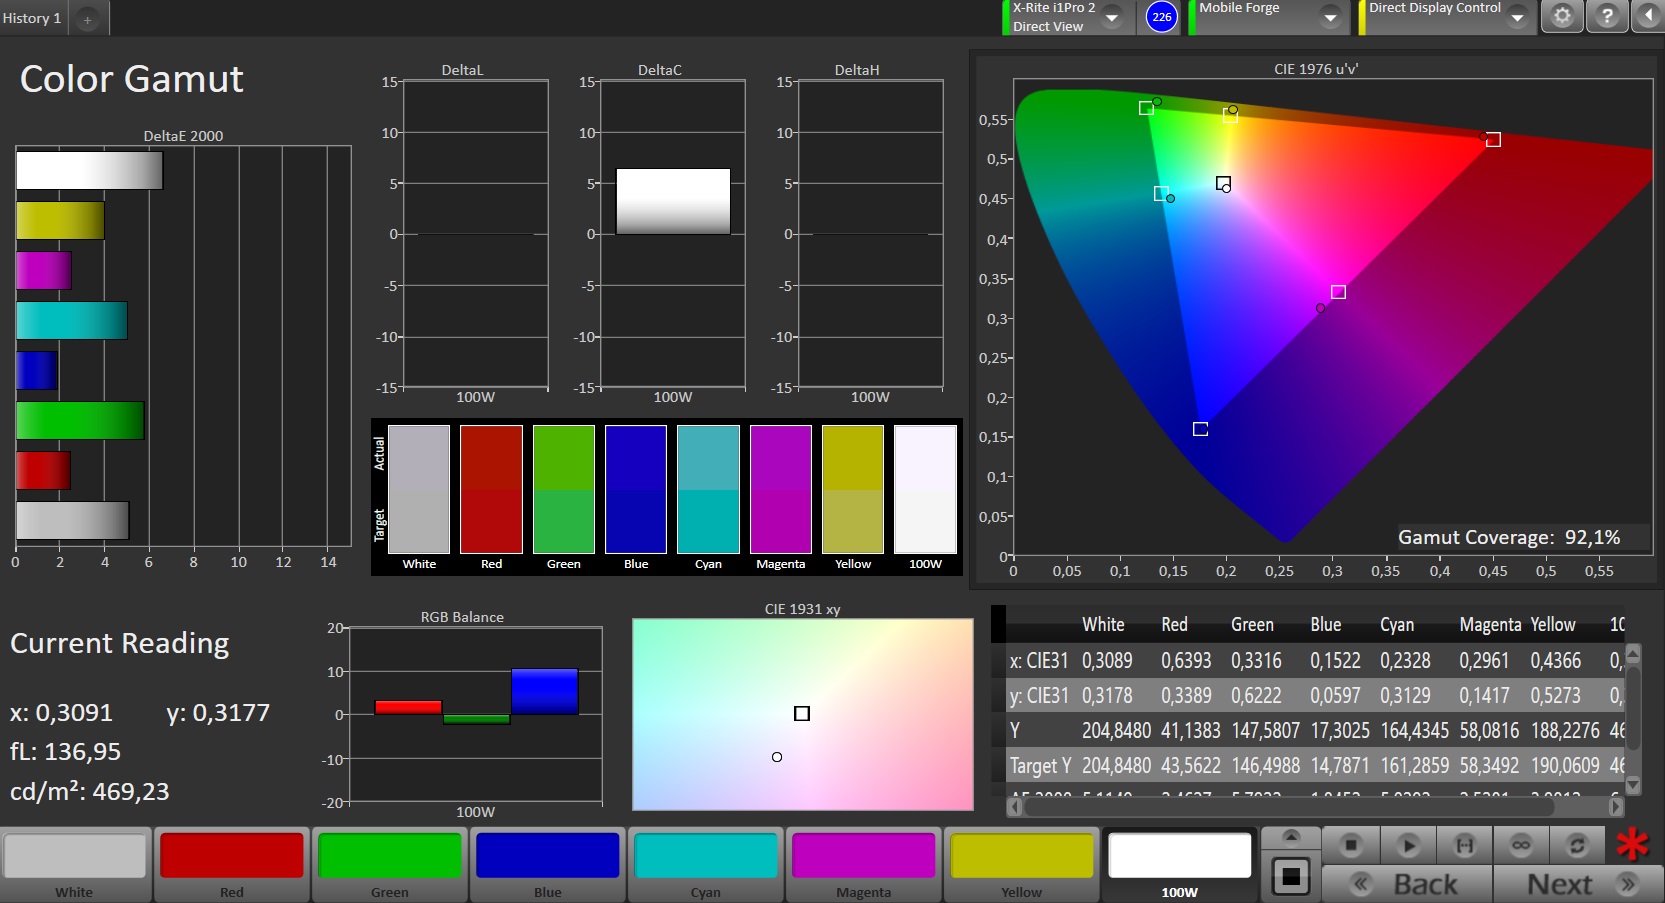
ΔE Greyscale Calman: 4.6 | ∀{0.09-98 Ø4.97}
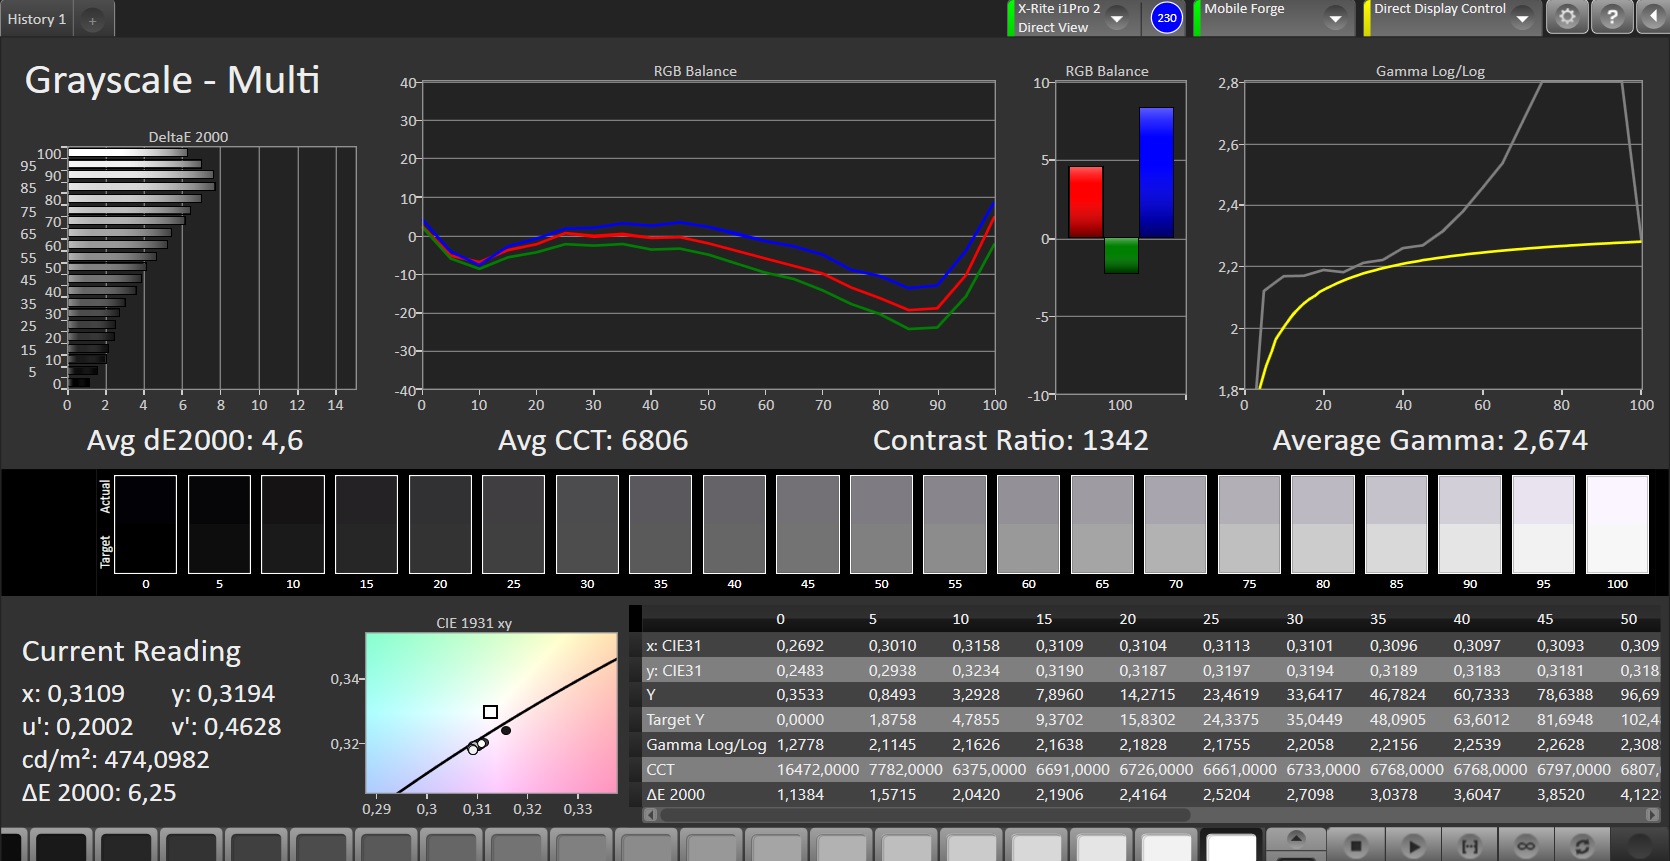
92.1% sRGB (Calman 2D)
Gamma: 2.674
CCT: 6806 K
| Wiko View 2 Go IPS, 1512x720, 5.9" | Wiko View 2 Plus IPS, 1512x720, 5.9" | Huawei Y7 2018 IPS, 1440x720, 6" | Honor 7A IPS, 1440x720, 5.7" | Motorola Moto G6 Play IPS, 1440x720, 5.7" | |
|---|---|---|---|---|---|
| Screen | -3% | -7% | -2% | 7% | |
| Brightness middle (cd/m²) | 465 | 503 8% | 393 -15% | 417 -10% | 614 32% |
| Brightness (cd/m²) | 462 | 493 7% | 365 -21% | 395 -15% | 593 28% |
| Brightness Distribution (%) | 84 | 84 0% | 85 1% | 88 5% | 90 7% |
| Black Level * (cd/m²) | 0.32 | 0.3 6% | 0.29 9% | 0.18 44% | 0.29 9% |
| Contrast (:1) | 1453 | 1677 15% | 1355 -7% | 2317 59% | 2117 46% |
| Colorchecker dE 2000 * | 4.76 | 5.71 -20% | 5.28 -11% | 6.46 -36% | 5.9 -24% |
| Colorchecker dE 2000 max. * | 7.71 | 9.04 -17% | 9 -17% | 10.72 -39% | 9.6 -25% |
| Greyscale dE 2000 * | 4.6 | 5.8 -26% | 4.2 9% | 5.8 -26% | 5.5 -20% |
| Gamma | 2.674 82% | 2.775 79% | 2.6 85% | 2.423 91% | 2.32 95% |
| CCT | 6806 96% | 7279 89% | 7086 92% | 7839 83% | 7822 83% |
* ... smaller is better
Screen Flickering / PWM (Pulse-Width Modulation)
| Screen flickering / PWM detected | 9259 Hz | ≤ 10 % brightness setting | 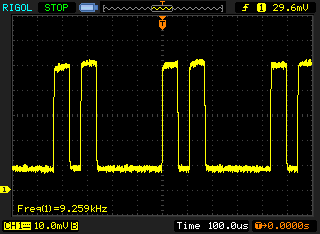 |
The display backlight flickers at 9259 Hz (worst case, e.g., utilizing PWM) Flickering detected at a brightness setting of 10 % and below. There should be no flickering or PWM above this brightness setting. The frequency of 9259 Hz is quite high, so most users sensitive to PWM should not notice any flickering. In comparison: 52 % of all tested devices do not use PWM to dim the display. If PWM was detected, an average of 7781 (minimum: 5 - maximum: 343500) Hz was measured. | |||
Our test unit has a 0.32 cd/m² black value, which is marginally higher than the black value that the View 2 Plus achieved in the same tests. The lower maximum brightness and high black value results in a 15% lower contrast ratio, which puts the View 2 Go second bottom of our comparison table in this regard.
We also subjected our test device to further tests with CalMAN analysis software, which revealed a slight tint in grey tones. However, this is much milder than in other comparable smartphones and is close to the ideal DeltaE value of 3. In short, the screen in our test unit has acceptable colour accuracy for its price.
Display Response Times
| ↔ Response Time Black to White | ||
|---|---|---|
| 36 ms ... rise ↗ and fall ↘ combined | ↗ 19 ms rise | 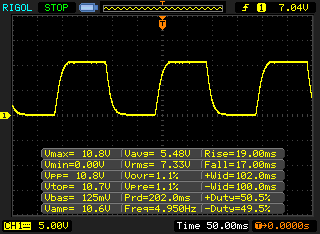 |
| ↘ 17 ms fall | ||
| The screen shows slow response rates in our tests and will be unsatisfactory for gamers. In comparison, all tested devices range from 0.1 (minimum) to 240 (maximum) ms. » 94 % of all devices are better. This means that the measured response time is worse than the average of all tested devices (19.8 ms). | ||
| ↔ Response Time 50% Grey to 80% Grey | ||
| 68 ms ... rise ↗ and fall ↘ combined | ↗ 33 ms rise | 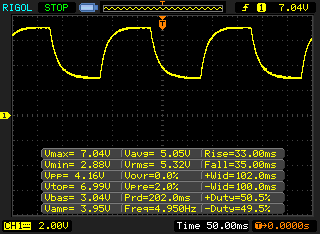 |
| ↘ 35 ms fall | ||
| The screen shows slow response rates in our tests and will be unsatisfactory for gamers. In comparison, all tested devices range from 0.165 (minimum) to 636 (maximum) ms. » 98 % of all devices are better. This means that the measured response time is worse than the average of all tested devices (31 ms). | ||
The View 2 Go is usable outdoors thanks to its bright display. The screen will catch reflections in direct sunlight, but this should not reduce readability.
Our test unit has good viewing angles too, although there are noticeable minor brightness shifts at acute viewing angles. We did not notice any colour or image distortions though, so the View 2 Go should be readable from almost any angle in daily use.
Performance
The View 2 Go is powered by a Qualcomm Snapdragon 430 SoC, which is now almost three years old. Our test unit performs on par with most of our comparison devices in benchmarks, but that is because they are equipped with the same SoC. However, the Snapdragon 450 SoC, which powers the View 2 Plus, is considerably faster as demonstrated in our benchmark results below.
Our test unit ran smoothly during testing with no noticeable lagging or stutters. The SoC will struggle with more sophisticated apps though.
| PCMark for Android | |
| Work performance score (sort by value) | |
| Wiko View 2 Go | |
| Wiko View 2 Plus | |
| Huawei Y7 2018 | |
| Honor 7A | |
| Motorola Moto G6 Play | |
| Average Qualcomm Snapdragon 430 (MSM8937) (3347 - 5290, n=18) | |
| Work 2.0 performance score (sort by value) | |
| Wiko View 2 Go | |
| Wiko View 2 Plus | |
| Huawei Y7 2018 | |
| Honor 7A | |
| Motorola Moto G6 Play | |
| Average Qualcomm Snapdragon 430 (MSM8937) (3408 - 3892, n=16) | |
| GFXBench 3.1 | |
| on screen Manhattan ES 3.1 Onscreen (sort by value) | |
| Wiko View 2 Go | |
| Wiko View 2 Plus | |
| Huawei Y7 2018 | |
| Honor 7A | |
| Motorola Moto G6 Play | |
| Average Qualcomm Snapdragon 430 (MSM8937) (4.3 - 11, n=17) | |
| Average of class Smartphone (11 - 166, n=128, last 2 years) | |
| 1920x1080 Manhattan ES 3.1 Offscreen (sort by value) | |
| Wiko View 2 Go | |
| Wiko View 2 Plus | |
| Huawei Y7 2018 | |
| Honor 7A | |
| Motorola Moto G6 Play | |
| Average Qualcomm Snapdragon 430 (MSM8937) (2.2 - 4.9, n=17) | |
| Average of class Smartphone (8.6 - 413, n=127, last 2 years) | |
| AnTuTu v7 - Total Score (sort by value) | |
| Wiko View 2 Go | |
| Wiko View 2 Plus | |
| Huawei Y7 2018 | |
| Honor 7A | |
| Motorola Moto G6 Play | |
| Average Qualcomm Snapdragon 430 (MSM8937) (44992 - 59990, n=11) | |
| AnTuTu v6 - Total Score (sort by value) | |
| Wiko View 2 Go | |
| Wiko View 2 Plus | |
| Huawei Y7 2018 | |
| Honor 7A | |
| Motorola Moto G6 Play | |
| Average Qualcomm Snapdragon 430 (MSM8937) (42798 - 47066, n=16) | |
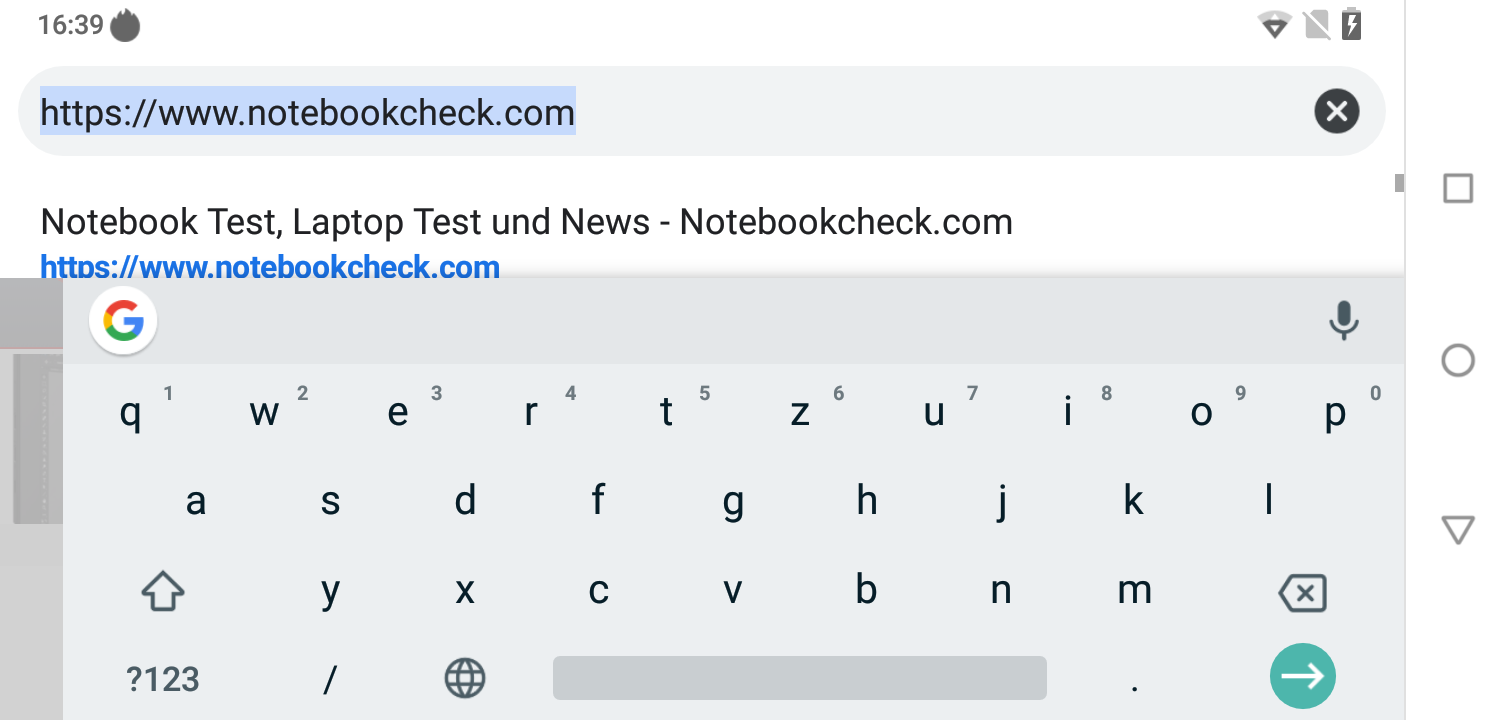
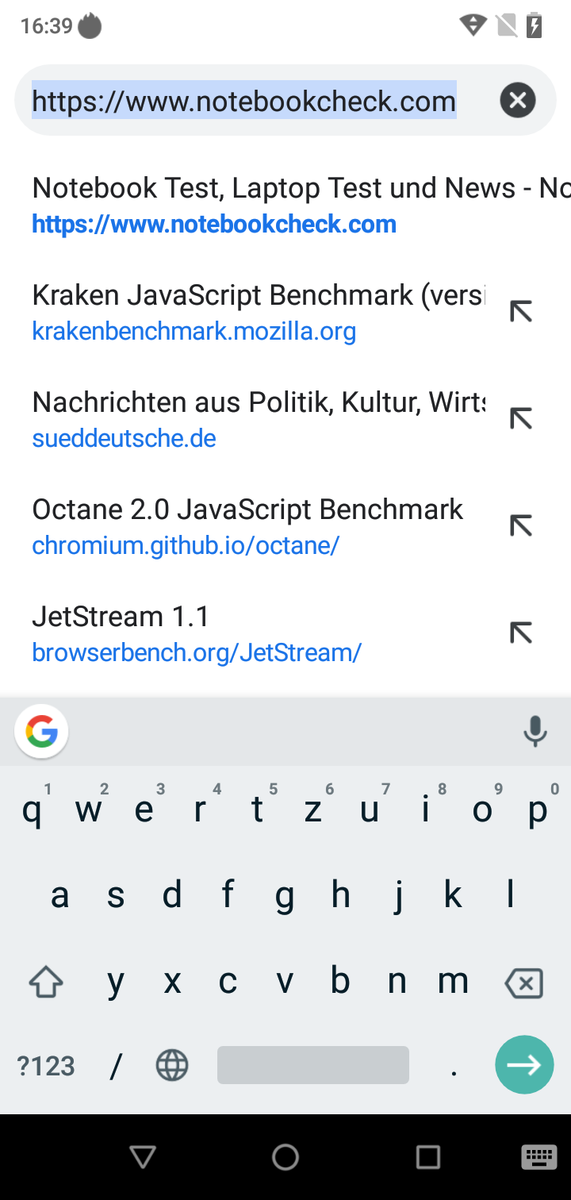
By contrast, the View 2 Go performed comparatively poorly in browser benchmarks. Our test unit finished bottom or second bottom of all the browser benchmarks that we conducted and finished up to 10% behind our Snapdragon 430 SoC-powered comparison devices.
In daily use, we found that websites would load quickly, but media content would take a while to appear even when connected to fast Wi-Fi.
| JetStream 1.1 - 1.1 Total | |
| Wiko View 2 Plus (Chrome 71) | |
| Average Qualcomm Snapdragon 430 (MSM8937) (17.6 - 21.5, n=16) | |
| Honor 7A (Chrome 67) | |
| Motorola Moto G6 Play (Chrome 66) | |
| Huawei Y7 2018 (Chrome 66) | |
| Wiko View 2 Go (Chrome 71) | |
| Octane V2 - Total Score | |
| Average of class Smartphone (2800 - 126661, n=156, last 2 years) | |
| Wiko View 2 Plus (Chrome 71) | |
| Honor 7A (Chrome 67) | |
| Huawei Y7 2018 (Chrome 66) | |
| Motorola Moto G6 Play (Chrome 66) | |
| Average Qualcomm Snapdragon 430 (MSM8937) (2604 - 3438, n=18) | |
| Wiko View 2 Go (Chrome 71) | |
| Mozilla Kraken 1.1 - Total | |
| Honor 7A (Chrome 67) | |
| Motorola Moto G6 Play (Chrome 66) | |
| Huawei Y7 2018 (Chrome 66) | |
| Wiko View 2 Go (Chrome 71) | |
| Average Qualcomm Snapdragon 430 (MSM8937) (10396 - 14709, n=18) | |
| Wiko View 2 Plus (Chrome 71) | |
| Average of class Smartphone (257 - 28190, n=134, last 2 years) | |
* ... smaller is better
For some reason, our test unit would not display the pop-up dialog box in AndroBench 5 that contains the button to start a benchmark. We tried changing the scaling of the display without success, so unfortunately we cannot provide you with data about the speed of the microSD card reader or the internal storage. Subjectively, both storage media seem on par with our comparison devices though.
Games
The Snapdragon 430 SoC integrates an Adreno 505 GPU, which supports most modern APIs. Our test device handled Arena of Valor and Asphalt 9: Legends well, although we did experience some stuttering in menus. The accelerometer and the touchscreen worked reliably throughout testing too.


Emissions
Temperature
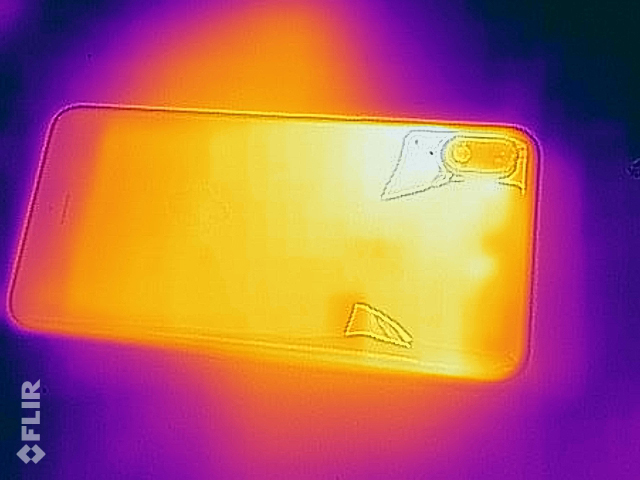
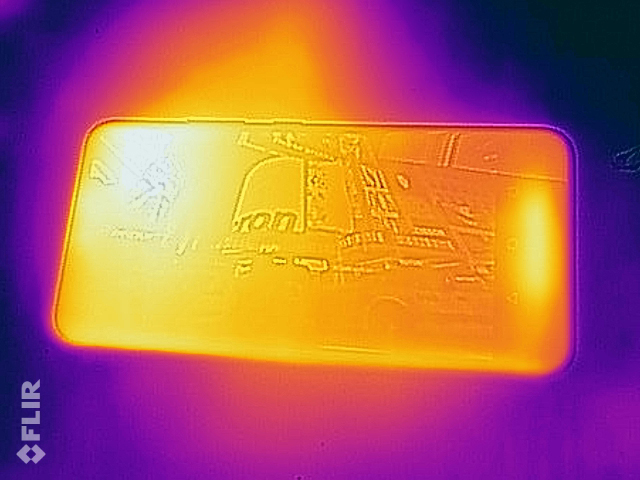
The View 2 Go manages its surface temperatures well. Our test device hardly heats up even when we push it hard. The device reaches a maximum of 30 °C at idle and 34.7 °C under sustained load, so you should not experience thermal throttling in daily use.
(+) The maximum temperature on the upper side is 34.7 °C / 94 F, compared to the average of 35.3 °C / 96 F, ranging from 21.9 to 247 °C for the class Smartphone.
(+) The bottom heats up to a maximum of 32.8 °C / 91 F, compared to the average of 34 °C / 93 F
(+) In idle usage, the average temperature for the upper side is 26.4 °C / 80 F, compared to the device average of 33 °C / 91 F.
Speakers
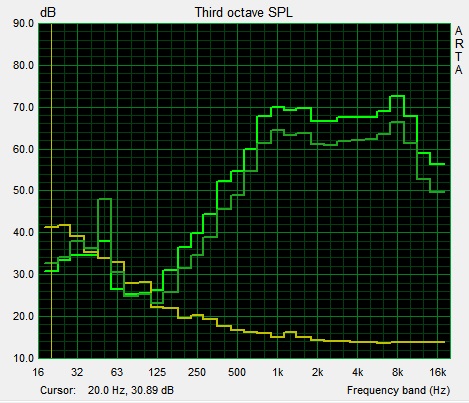
The View 2 Go has a single speaker on its back case just like the View 2 Plus. The speaker quality is almost identical too, as we determined with a special microphone and ARTA software. Our test unit gets slightly louder than its sibling, but the frequency spectrums are indistinguishable.
Overall, the View 2 Go has a decent speaker, but it frequently sounded too high-pitched during our tests for our liking. The speaker placement is also less than ideal as it could be obscured when the device is held in landscape mode. The 3.5 mm jack and Bluetooth reproduce audio cleanly too.
Wiko View 2 Go audio analysis
(±) | speaker loudness is average but good (80.1 dB)
Bass 100 - 315 Hz
(-) | nearly no bass - on average 32.5% lower than median
(+) | bass is linear (6.1% delta to prev. frequency)
Mids 400 - 2000 Hz
(±) | reduced mids - on average 5.4% lower than median
(±) | linearity of mids is average (7% delta to prev. frequency)
Highs 2 - 16 kHz
(+) | balanced highs - only 1.8% away from median
(+) | highs are linear (3% delta to prev. frequency)
Overall 100 - 16.000 Hz
(±) | linearity of overall sound is average (23.2% difference to median)
Compared to same class
» 53% of all tested devices in this class were better, 7% similar, 40% worse
» The best had a delta of 11%, average was 34%, worst was 134%
Compared to all devices tested
» 69% of all tested devices were better, 5% similar, 25% worse
» The best had a delta of 4%, average was 24%, worst was 134%
Wiko View 2 Plus audio analysis
(±) | speaker loudness is average but good (80.1 dB)
Bass 100 - 315 Hz
(-) | nearly no bass - on average 30.1% lower than median
(±) | linearity of bass is average (9.7% delta to prev. frequency)
Mids 400 - 2000 Hz
(±) | reduced mids - on average 5.3% lower than median
(±) | linearity of mids is average (8.2% delta to prev. frequency)
Highs 2 - 16 kHz
(+) | balanced highs - only 1.8% away from median
(+) | highs are linear (2.1% delta to prev. frequency)
Overall 100 - 16.000 Hz
(±) | linearity of overall sound is average (25.1% difference to median)
Compared to same class
» 62% of all tested devices in this class were better, 6% similar, 31% worse
» The best had a delta of 11%, average was 34%, worst was 134%
Compared to all devices tested
» 77% of all tested devices were better, 5% similar, 18% worse
» The best had a delta of 4%, average was 24%, worst was 134%
Battery Life
Power Consumption
The View 2 Go consumes slightly less than the average of Snapdragon 430-powered smartphones that we have currently tested. Oddly, the View 2 Plus is 12% more efficient overall, despite having a more powerful SoC.
| Off / Standby | |
| Idle | |
| Load |
|
Key:
min: | |
| Wiko View 2 Go 4000 mAh | Wiko View 2 Plus 4000 mAh | Huawei Y7 2018 3000 mAh | Honor 7A 3000 mAh | Motorola Moto G6 Play 4000 mAh | Average Qualcomm Snapdragon 430 (MSM8937) | Average of class Smartphone | |
|---|---|---|---|---|---|---|---|
| Power Consumption | 12% | -9% | -18% | 9% | -9% | -31% | |
| Idle Minimum * (Watt) | 0.8 | 0.8 -0% | 0.9 -13% | 1.3 -63% | 0.68 15% | 0.918 ? -15% | 0.873 ? -9% |
| Idle Average * (Watt) | 2 | 1.5 25% | 1.9 5% | 1.6 20% | 1.8 10% | 2.01 ? -0% | 1.473 ? 26% |
| Idle Maximum * (Watt) | 2.3 | 2 13% | 2.3 -0% | 2.9 -26% | 1.83 20% | 2.28 ? 1% | 1.661 ? 28% |
| Load Average * (Watt) | 3.6 | 3.2 11% | 4.7 -31% | 3.7 -3% | 3.38 6% | 3.97 ? -10% | 6.81 ? -89% |
| Load Maximum * (Watt) | 5.4 | 4.7 13% | 5.7 -6% | 6.4 -19% | 5.67 -5% | 6.46 ? -20% | 11.3 ? -109% |
* ... smaller is better
Battery Life
The View 2 Go has a 4,000 mAh battery just like its sibling. However, our test device achieved a 24% shorter runtime than the View 2 Plus in our Wi-Fi battery life test. The Moto G6 Play has better battery life than the View 2 Go too. Overall, our test unit’s runtime of 12:14 hours is respectable and means that it should last at least a full workday’s use.
The included 10 W charger takes around two hours to recharge our test device.
| Wiko View 2 Go 4000 mAh | Wiko View 2 Plus 4000 mAh | Huawei Y7 2018 3000 mAh | Honor 7A 3000 mAh | Motorola Moto G6 Play 4000 mAh | |
|---|---|---|---|---|---|
| Battery runtime | 25% | -15% | -10% | 21% | |
| WiFi v1.3 (h) | 12.2 | 15.2 25% | 10.4 -15% | 11 -10% | 14.8 21% |
| Reader / Idle (h) | 21.8 | ||||
| H.264 (h) | 11.5 | ||||
| Load (h) | 4.1 |
Pros
Cons
Verdict
The Wiko View 2 Go is a cheap smartphone with entry-level performance, a large battery and a big screen. The device compares well against other smartphones within its class and is better value for money than those that are made by larger OEMs.
The View 2 Go impressed us with its bright and contrast-rich display, while its fast Wi-Fi will come in handy in daily use. Its glossy back picks up fingerprint residue easily though, and its outdated security updates are a concern. Moreover, it does not get the most from its 4,000 mAh battery and its face unlock is a poor alternative to a fingerprint sensor.
The Wiko View 2 Go is a cheap, large smartphone with decent connectivity and features.
If you are undecided about the View 2 Plus or the View 2 Go, we would first recommend considering the difference in price. The former has a faster SoC, a fingerprint sensor and more storage for an additional 100 Euros (~$114). Furthermore, the View 2 Plus has lower power consumption that results in better battery life. In short, we would recommend choosing the View 2 Plus if your budget can stretch that far, but the View 2 Go is still a solid smartphone regardless.
Wiko View 2 Go
- 01/17/2019 v6 (old)
Florian Schmitt
Price comparison

