Huawei Y7 2018 Smartphone Review

There were reports that Huawei had written off its Y series, aimed at younger smartphone users, in favor of larger profit margins associated with premium devices. Y series devices have historically been good value for money, so we are pleased to see another generation of devices come to market with the promise of solid performance at an affordable price. The Y7 2018 is the largest and most expensive Y series device of those released this year. Other countries like Thailand have the Y9 2018, but this is not available in Germany. The 199-Euro price (~$234) puts the Y7 2018 squarely in the lower mid-range class of smartphones. The Y7 2018 has a modern 2:1 aspect ratio, decent features and reasonable cameras that should make the smartphone popular with potential buyers.
We will be comparing the Y7 2018 with its predecessor, the Huawei Y7 (2017) and other affordable, large smartphones like the Xiaomi Redmi 5 Plus, the Ulefone Power 3 and the Oukitel U18.
Case
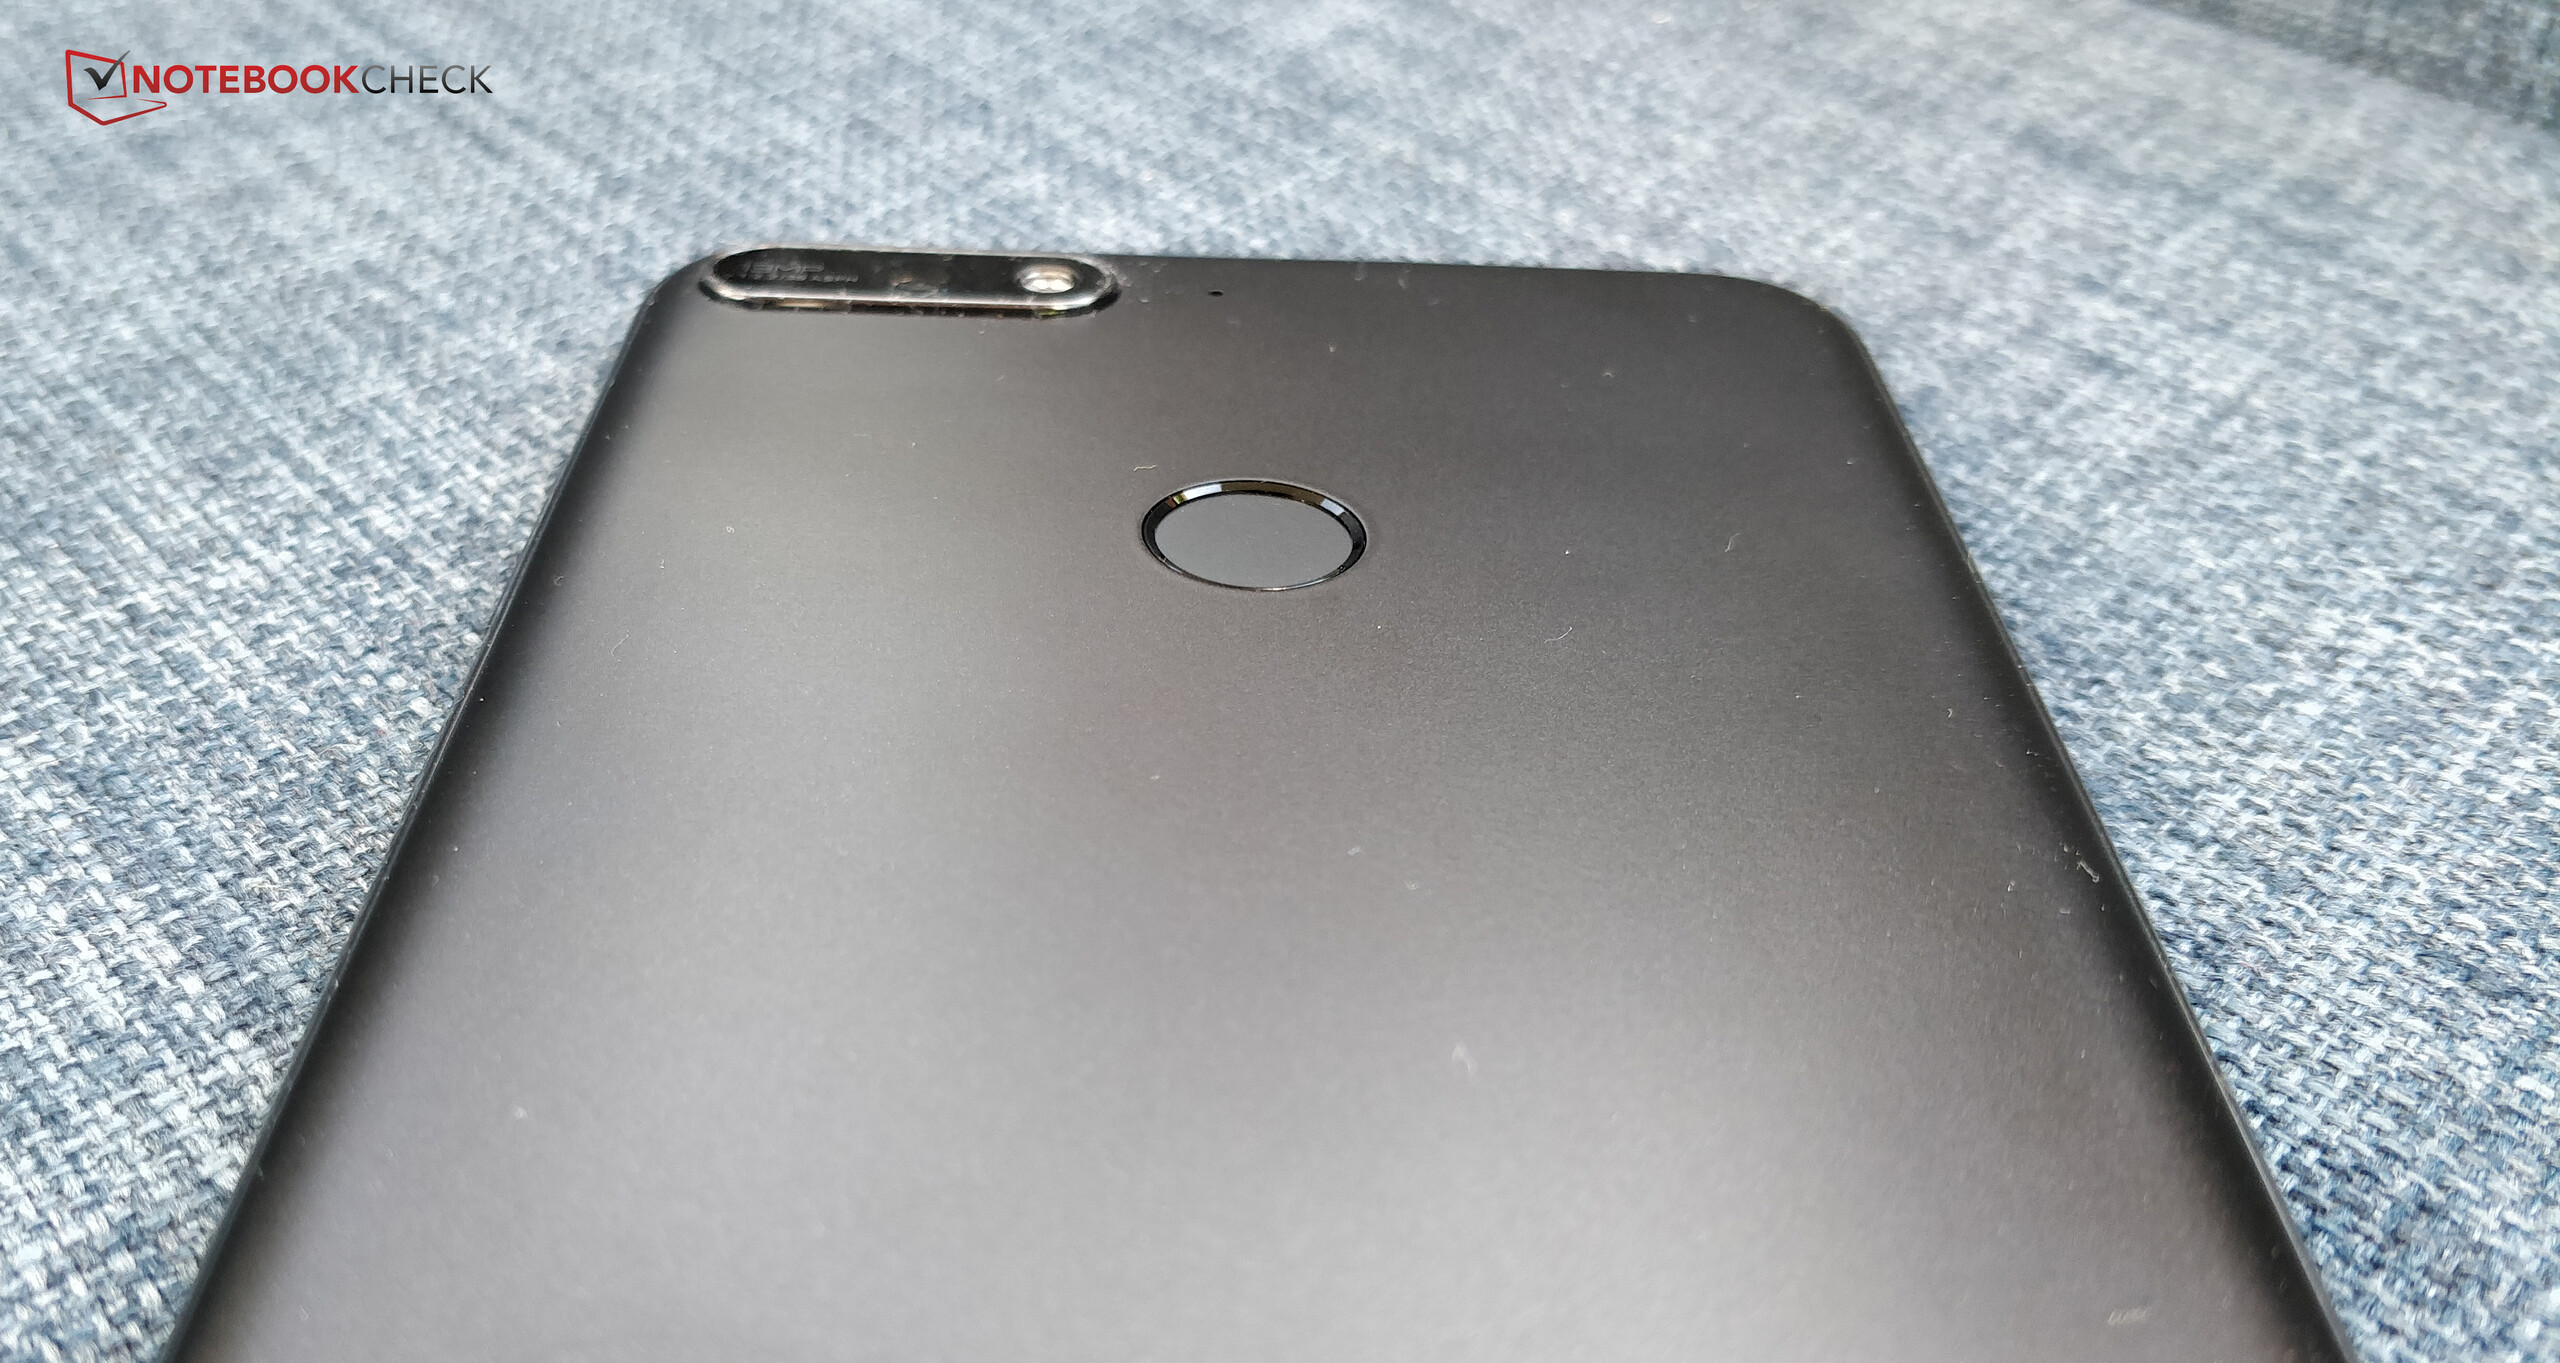
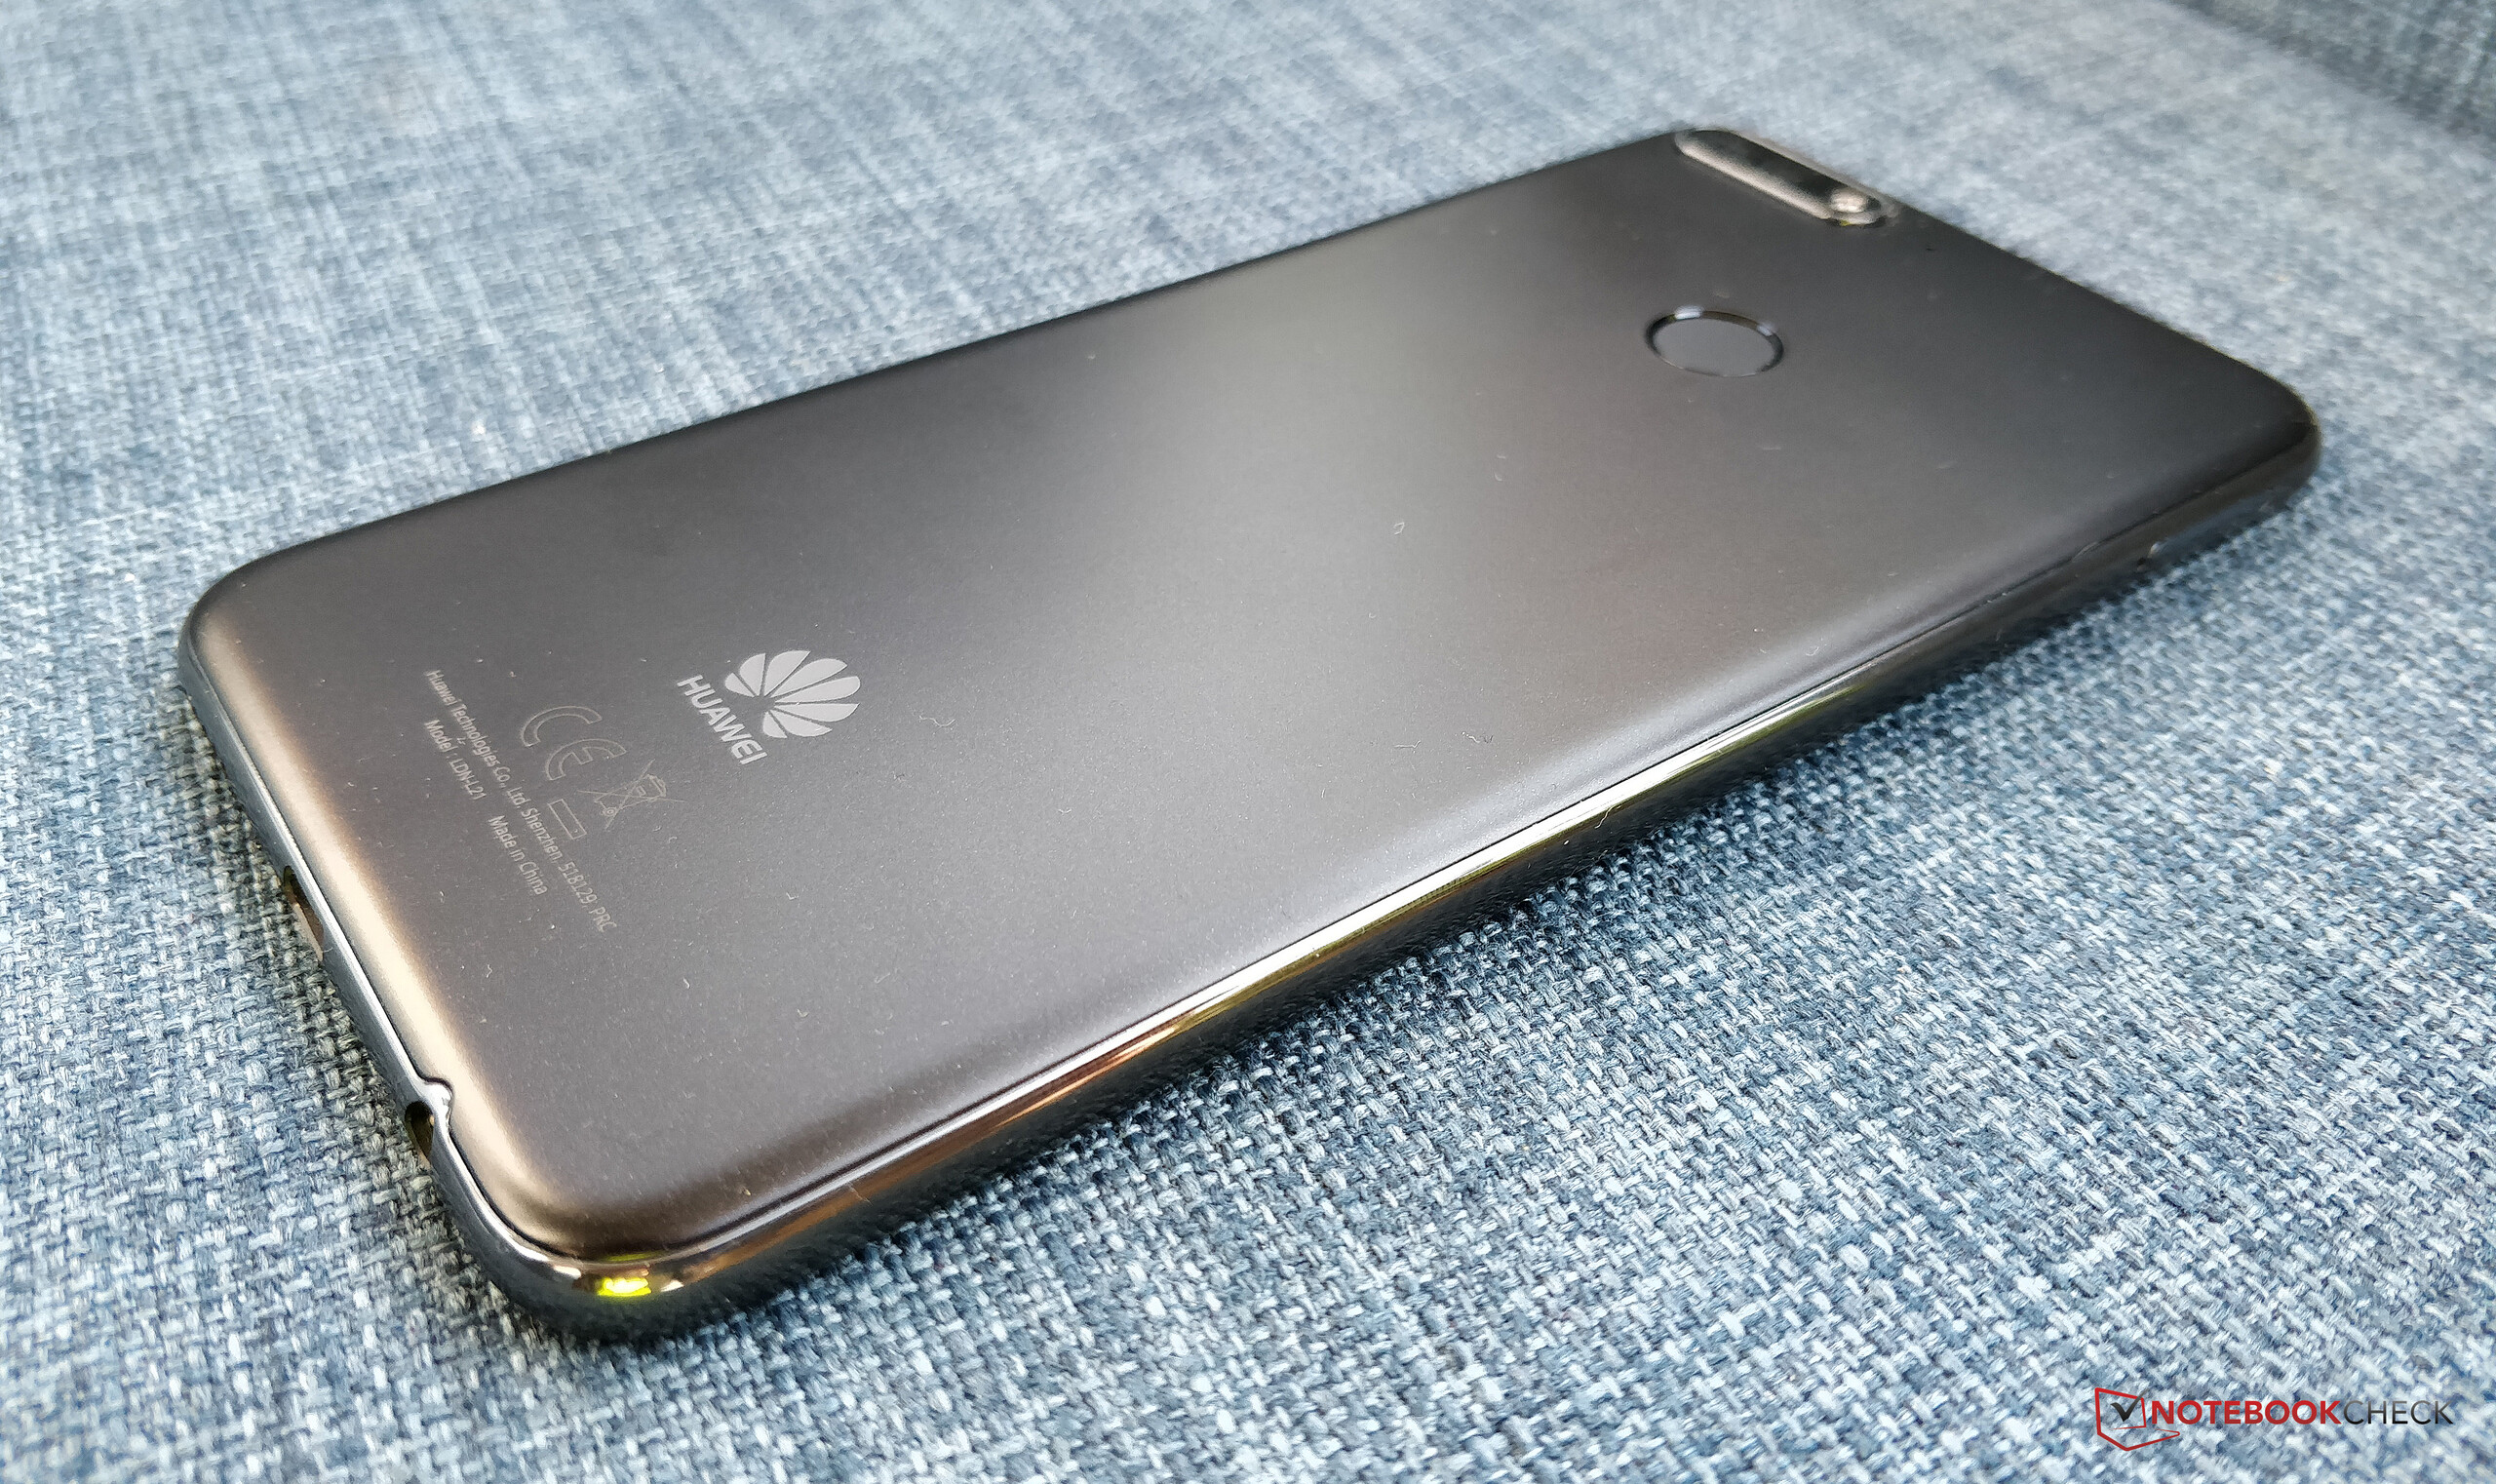
Metal cases are rare for lower mid-range smartphones, with plastic being the case material of choice. One exception to this is the Xiaomi Redmi 5 Plus, which has an entirely metal case. By contrast, the Y7 2018 has a plastic case with a matte back and is available in black, blue or gold. Huawei had not released the gold version in Europe at the time of writing.
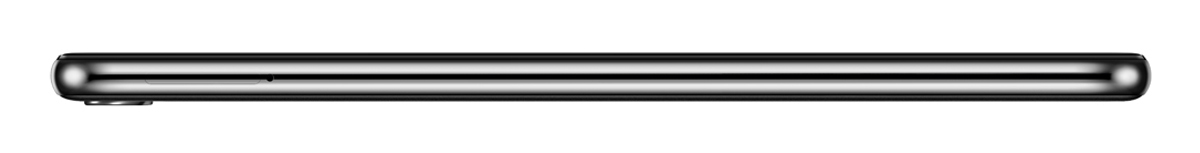
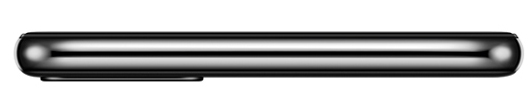
The Y7 2018 feels light in the hand, weighing 155 g. This makes the Y7 2018 a light device for its class, particularly compared to our comparison devices. For instance, the Y7 2018 is 10 g lighter than its predecessor and 59 g lighter than the Oukitel U18. Huawei has squeezed in a 5.99-inch display with a 2:1 aspect ratio into a 158.3 mm x 76.7 mm frame that gives the Y7 2018 narrow bezels and modern looks. The Y7 2018 is 7.8 mm thick, making it thinner than all our comparison devices. The Xiaomi Redmi 5 Plus is our thinnest comparison device at 8.1 mm.
The back protects the smartphone well, preventing pressure passing through to the display. The plastic can be visibly depressed though. The liquid crystals distort when pressure is applied to the display itself, but only slightly. We could slightly twist the device, during which we noticed waves in the LCD. The case does not creak though. Subjectively, the Y7 2018 is sturdy for a lower mid-range smartphone.
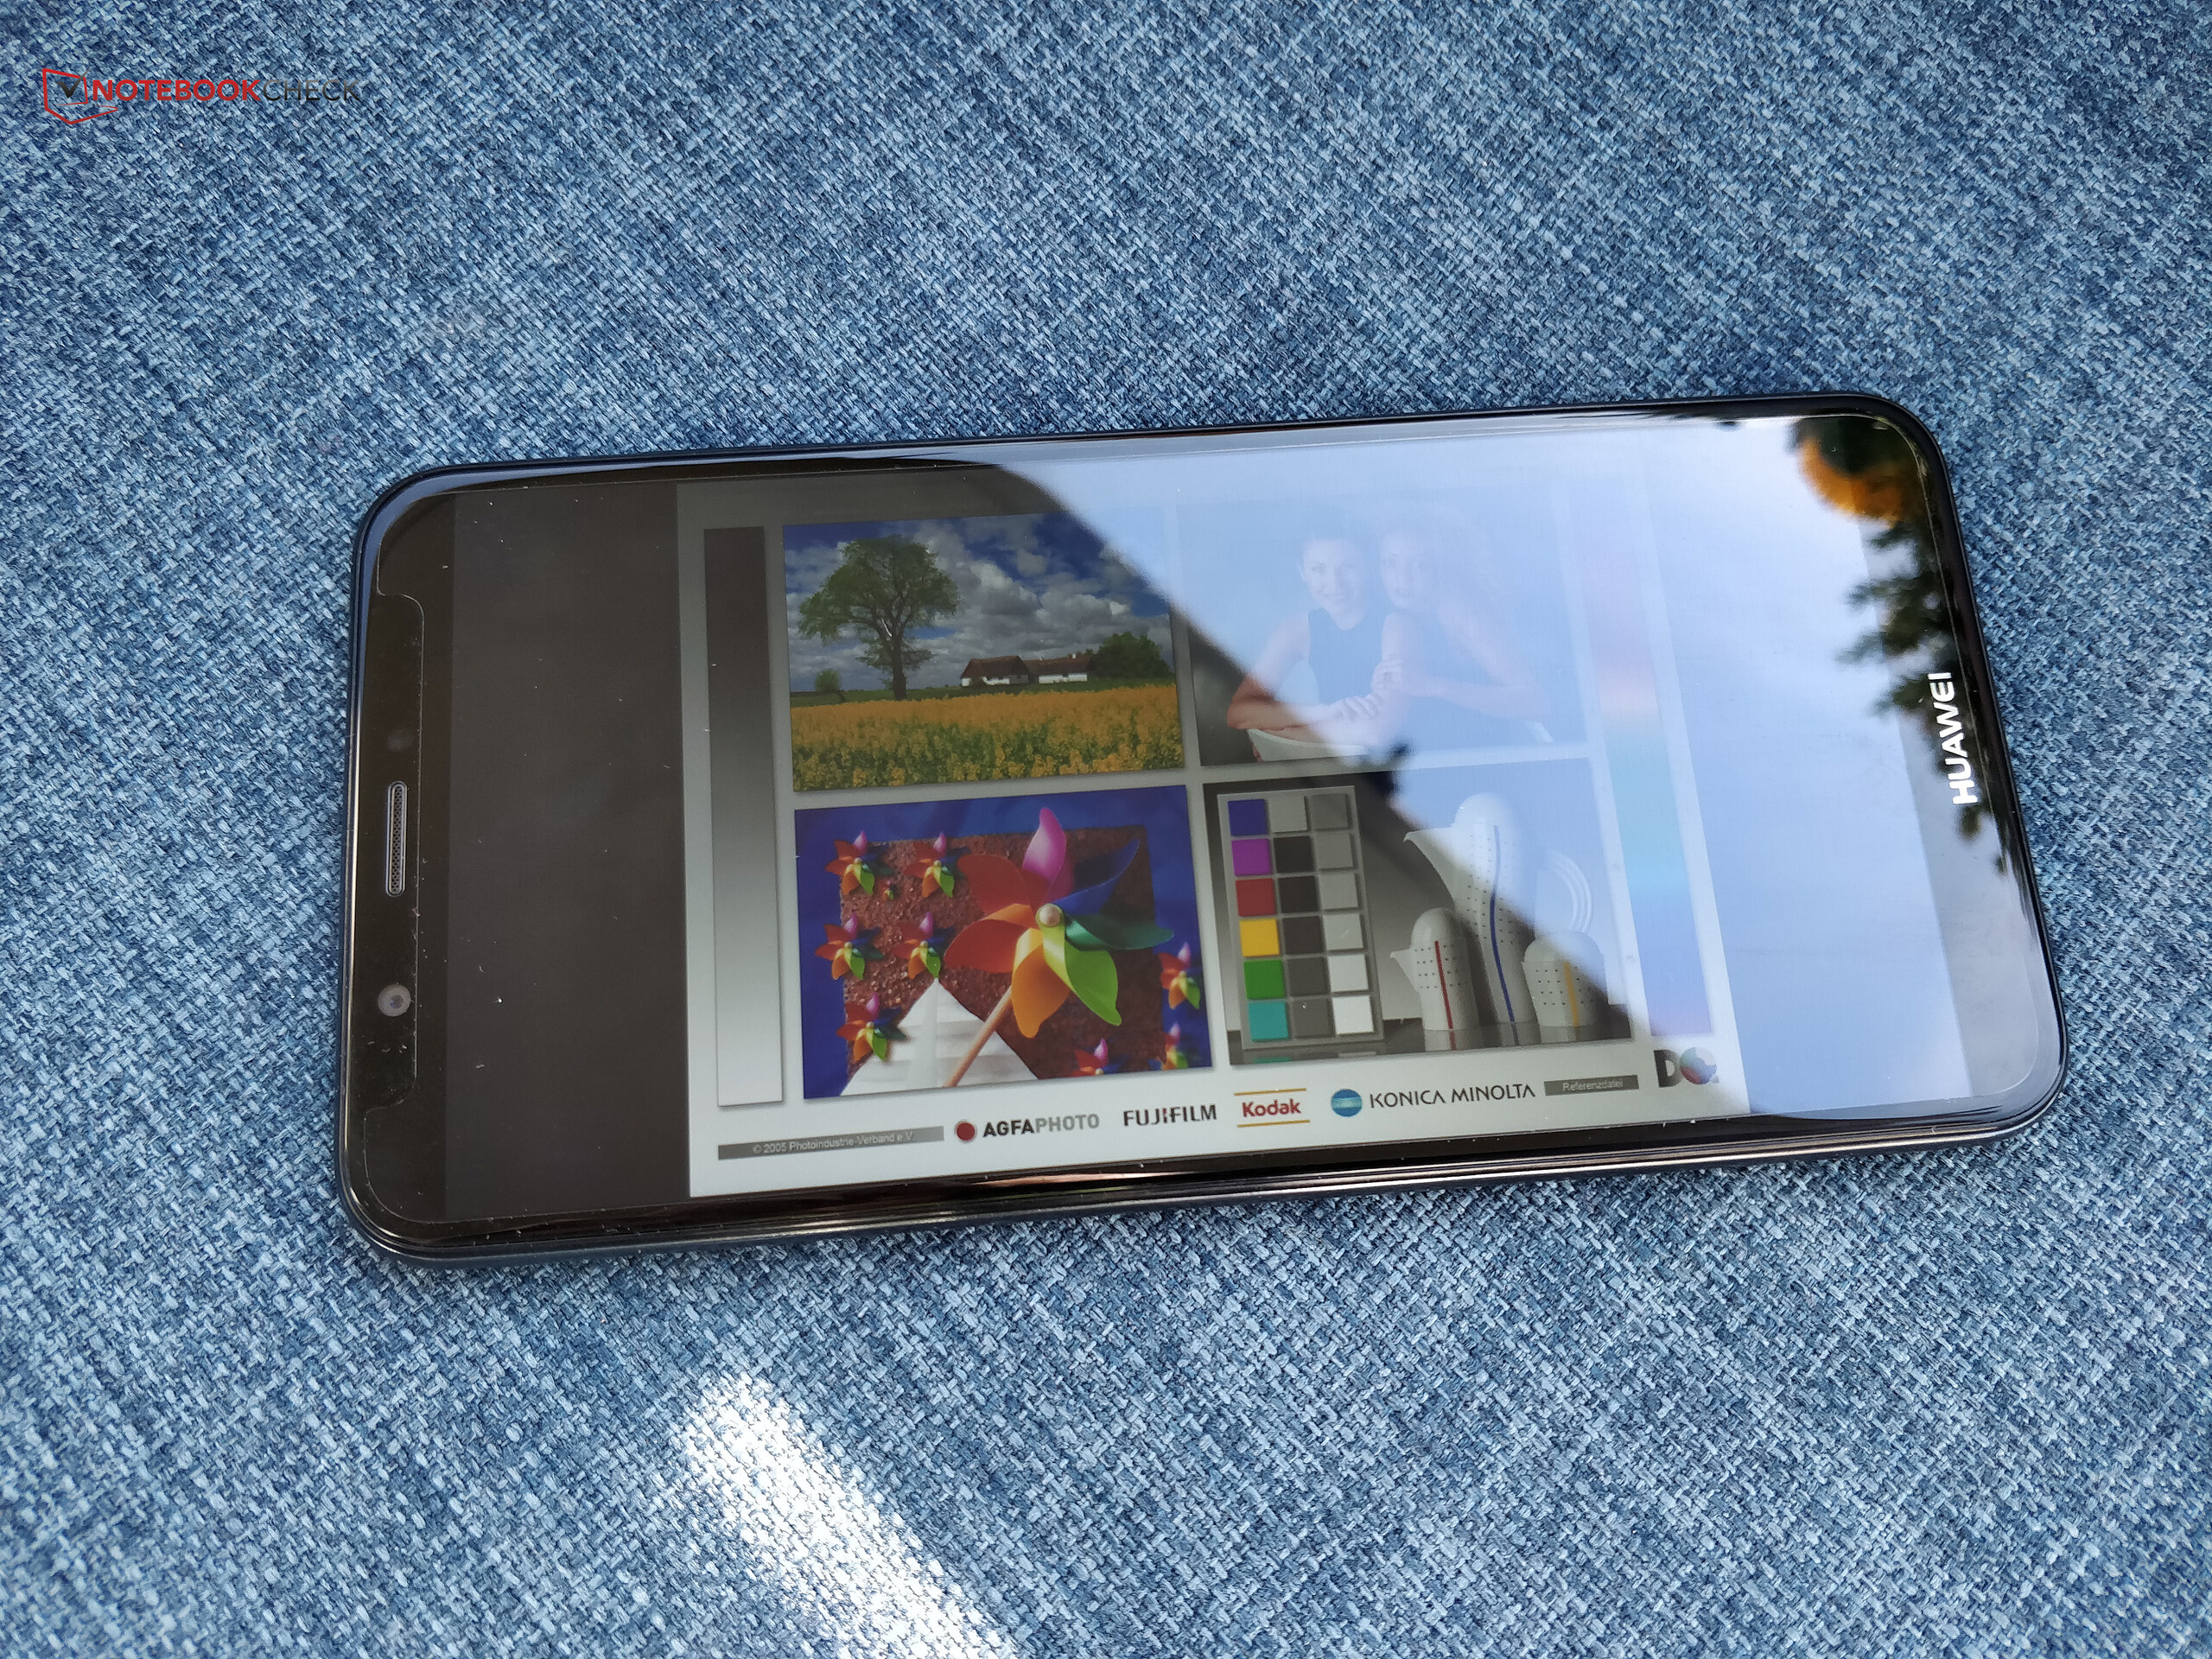
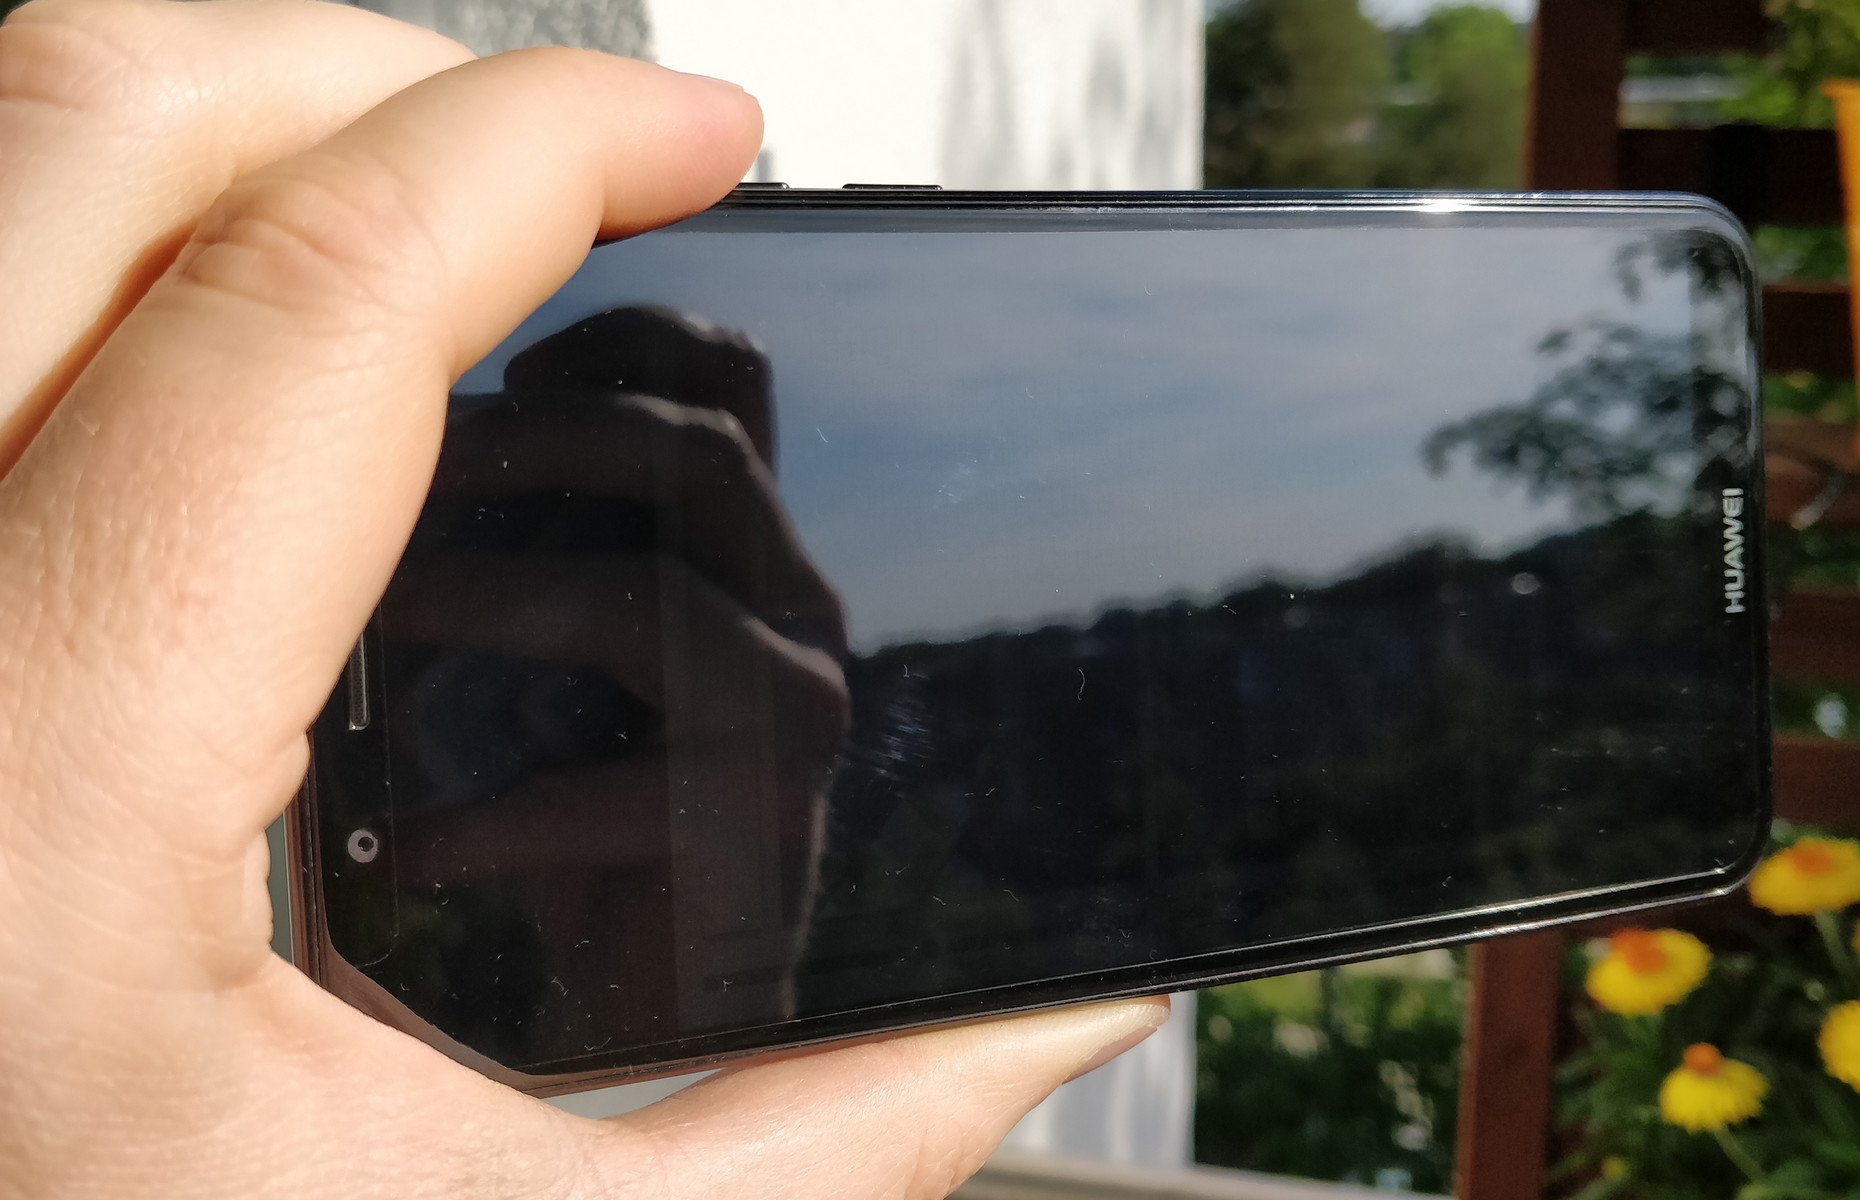
Huawei applied a screen protector to our test device that is difficult to remove, just as the company did with the Y6 2018.
Connectivity
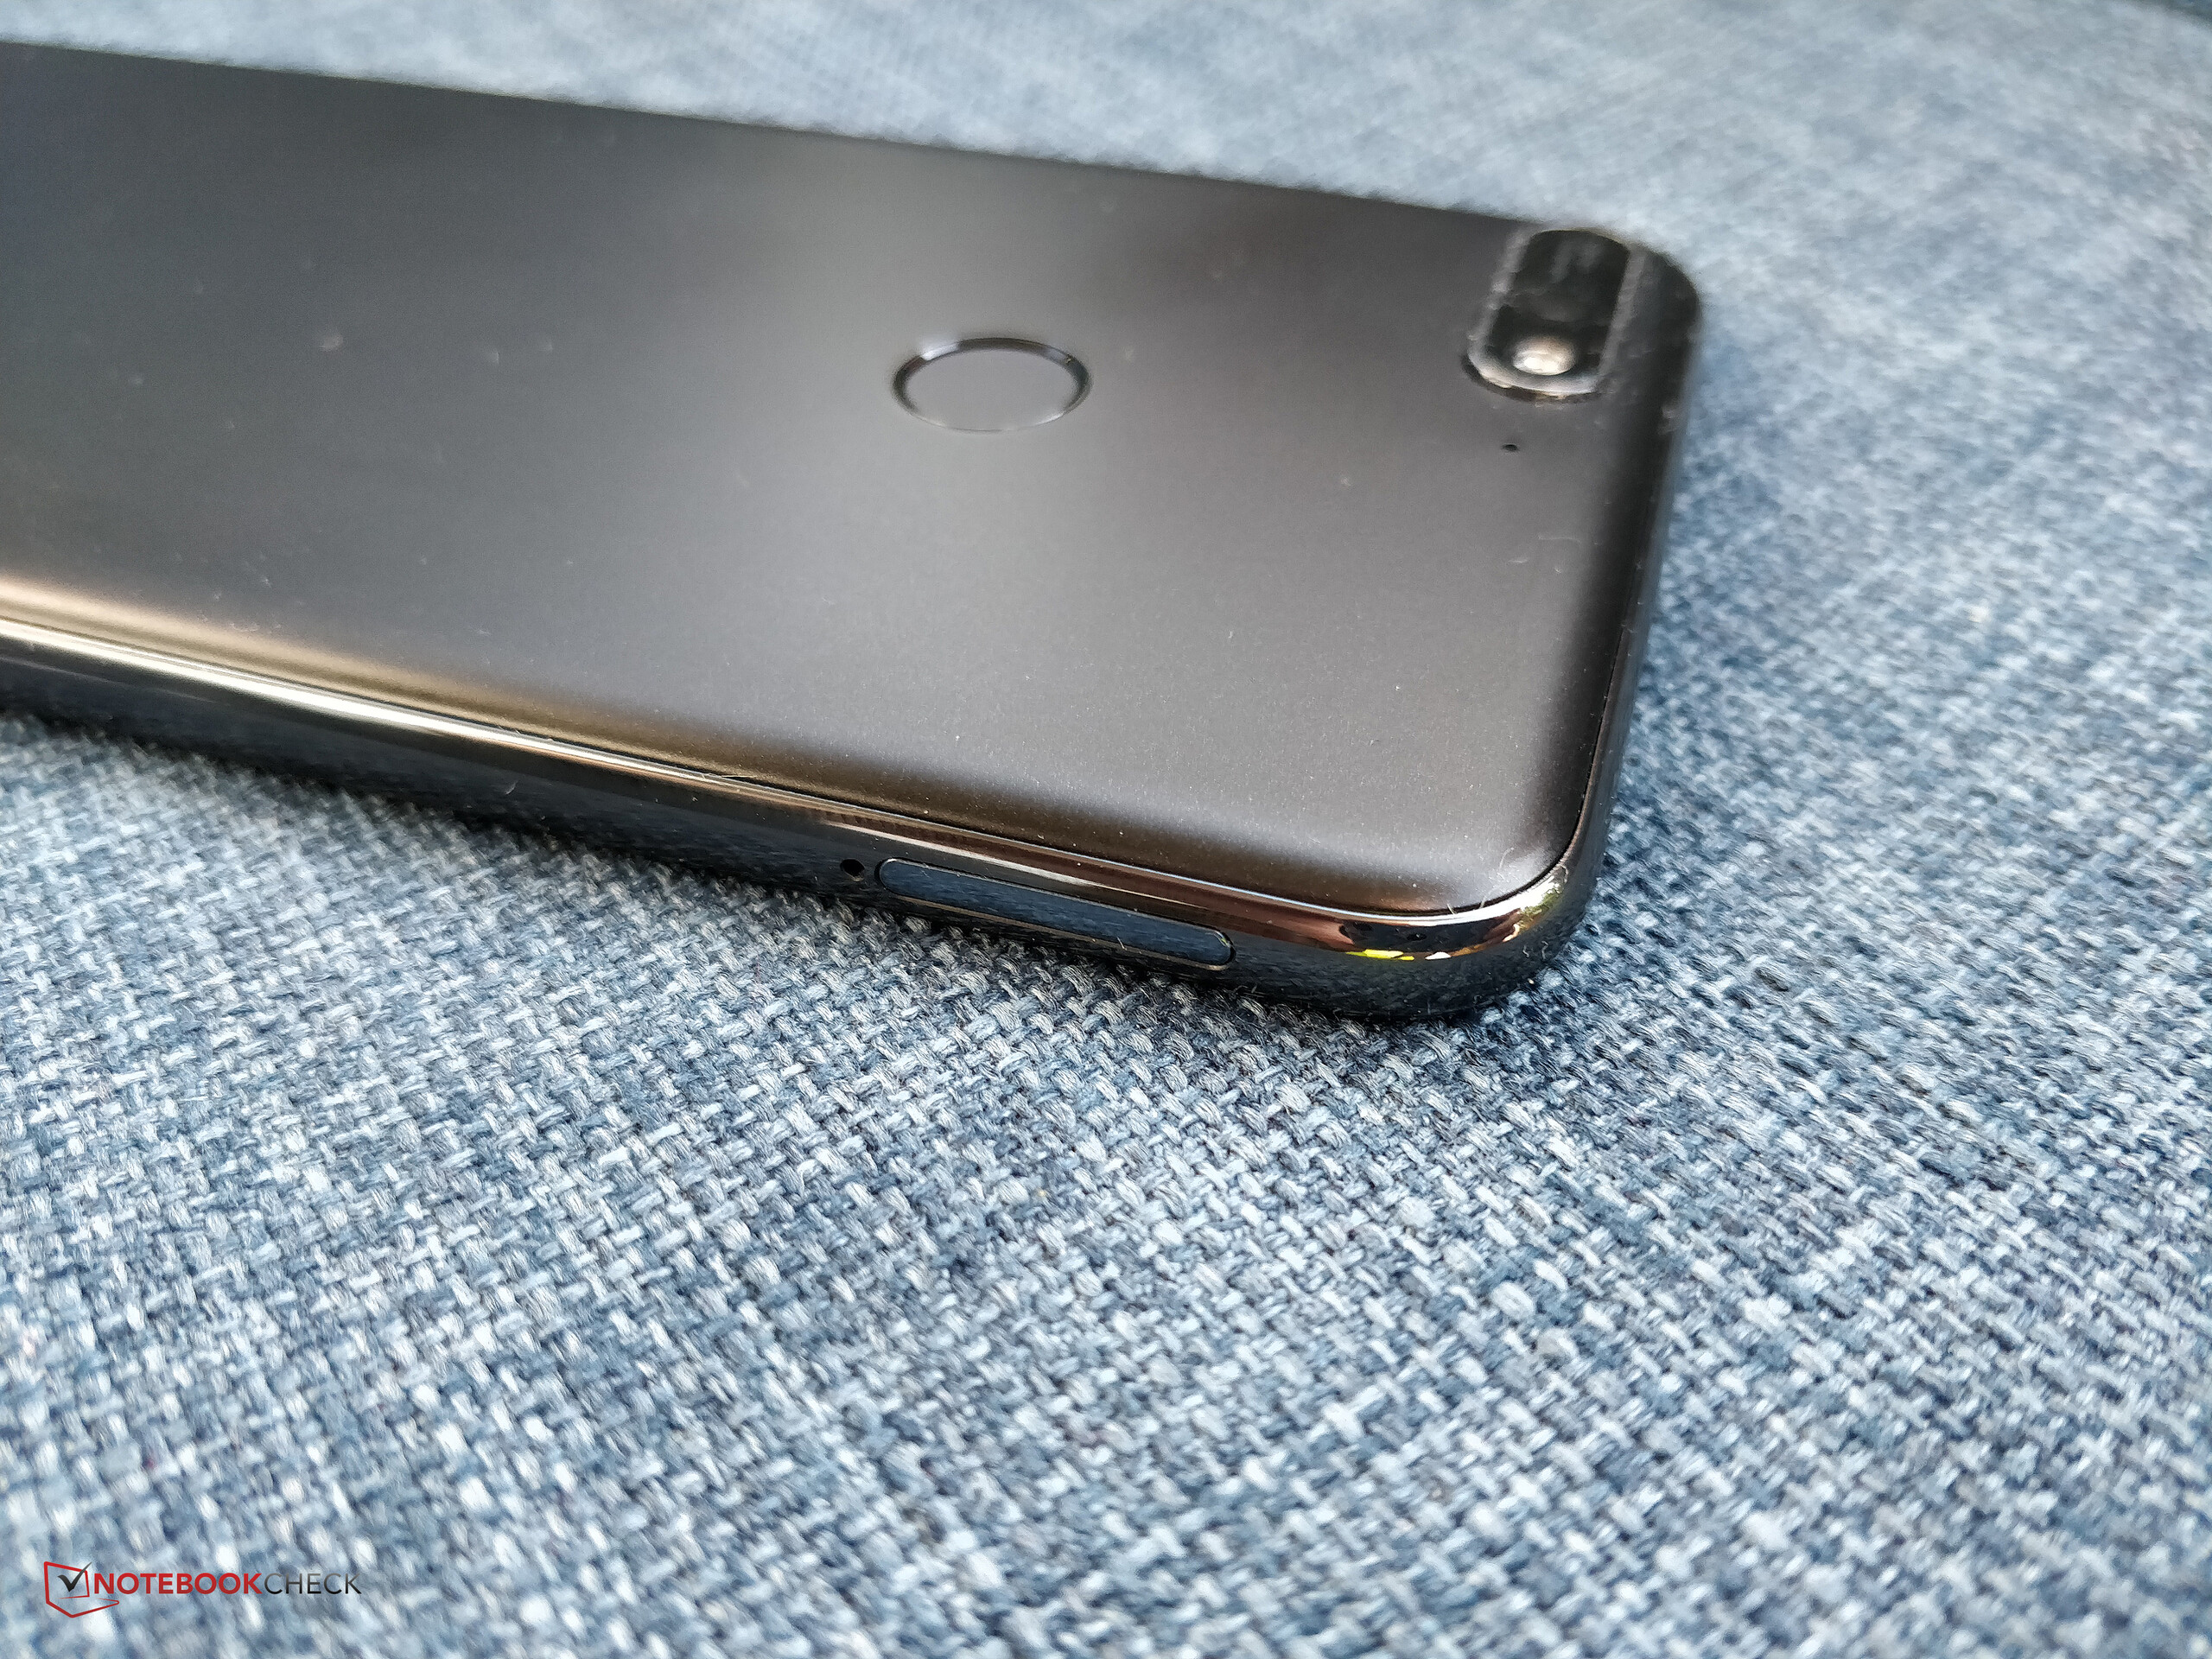
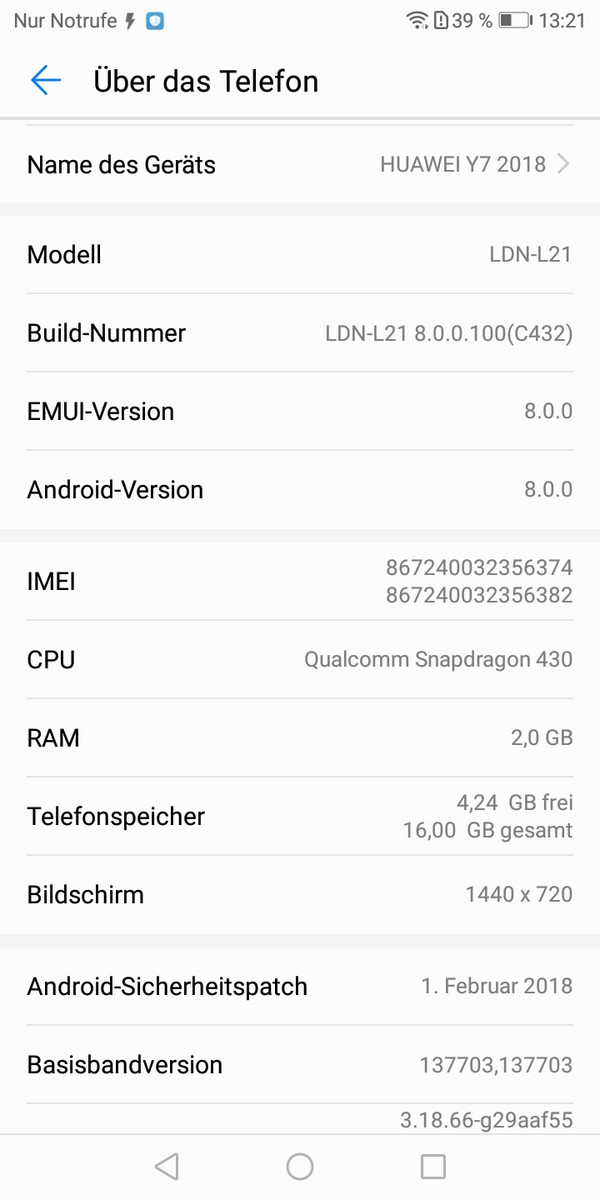
The Y7 2018 has 2 GB RAM and 16 GB of internal storage, the same volumes as last year’s model. The device supports microSD cards up to 256 GB, albeit only as external storage. This means that apps cannot be moved from internal to external memory. Positively, the Y7 2018 has dedicated slots for a microSD card and two nano-SIMs. Often devices have a hybrid second SIM slot, which accepts either a SIM card or a microSD card but not both simultaneously.
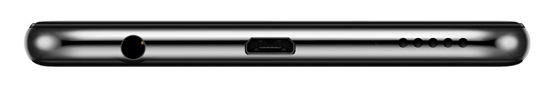
The Micro USB 2.0 port supports USB OTG.
Software
The Y7 2018 runs Android 8.0, on top of which Huawei has added its EMUI 8.0 skin. At the time of testing in mid-May, our test device came with Android security patch level February 1, 2018. Our test device received no update to a newer security patch during testing.
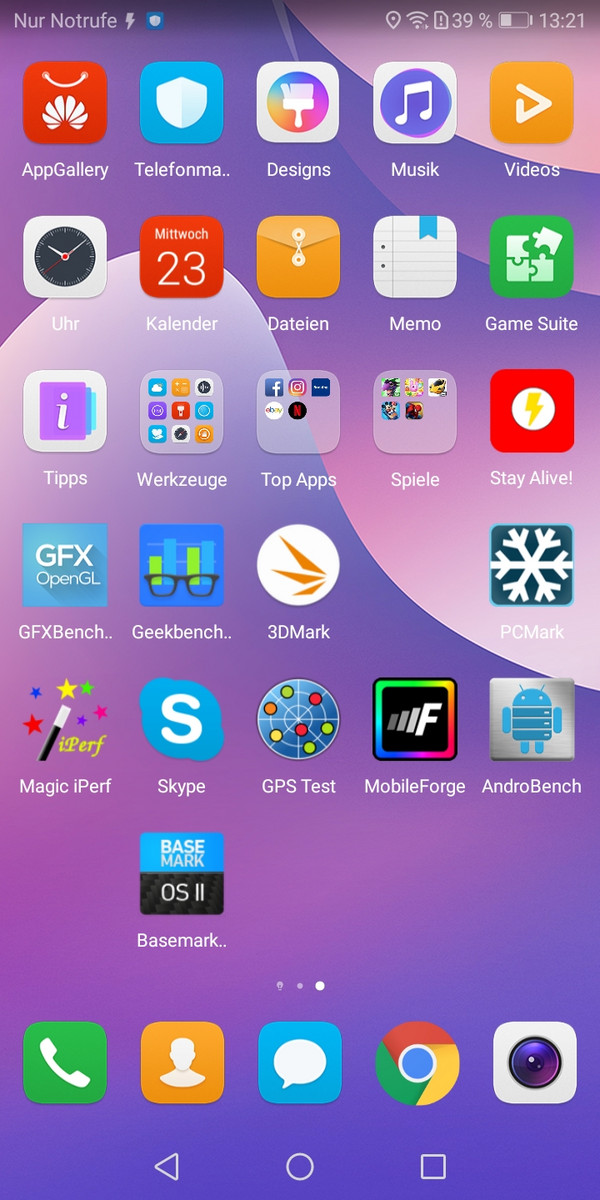
Huawei preinstalls the Y7 2018 with numerous apps. Some of these additional apps are useful, like the Tips or the Phone Clone app, the latter of which allows you to quickly transfer apps and data between your device and another. There is a Designs app too, which allows you to customize the UI. However, some are just advertising or free-to-play games. Fortunately, these can be uninstalled without issue.

Communication & GPS
We expect at least IEEE 802.11 b/g/n and 5 GHz Wi-Fi at this price range, but the Y7 2018 falls short and lacks 5 GHz support. This results in a poor showing with our standardized Wi-Fi speed tests using our reference Linksys EA8500 router. The Y7 2018 is noticeably slower than the Oukitel U18 and the Ulefone Power 3. While the U18 and Power 3 achieved practically 100 Mb/s, the Y7 2018 managed just over 50 Mb/s. Incidentally, the Y7 2018 is over 70% slower than the average for its class. The Y7 2018 scored between 5-11% better than its predecessor in these tests, which equates to only a maximum boost of 5 Mb/s.
Subjectively, websites load up hesitantly with our test device close to the router, particularly with pictures. Websites load just as fast when we tested the device around 10 meters away from the router. We conducted this test three walls away from the router, during which our test device varied between full and three-quarters signal strength.
The Y7 2018 supports six LTE frequencies, which is fewer than its predecessor. All Central European LTE bands are supported, but you could find yourself struggling with LTE coverage when travelling outside this area. Our test device has good network reception in a relatively built-up area. Our test device achieved around 10 Mb/s download and upload on E-Netz, a German carrier, and it worked with VoLTE.
| Networking | |
| iperf3 transmit AX12 | |
| Oukitel U18 | |
| Ulefone Power 3 | |
| Huawei Y7 2018 | |
| Xiaomi Redmi 5 Plus | |
| Huawei Y7 | |
| iperf3 receive AX12 | |
| Oukitel U18 | |
| Ulefone Power 3 | |
| Huawei Y7 2018 | |
| Xiaomi Redmi 5 Plus | |
| Huawei Y7 | |
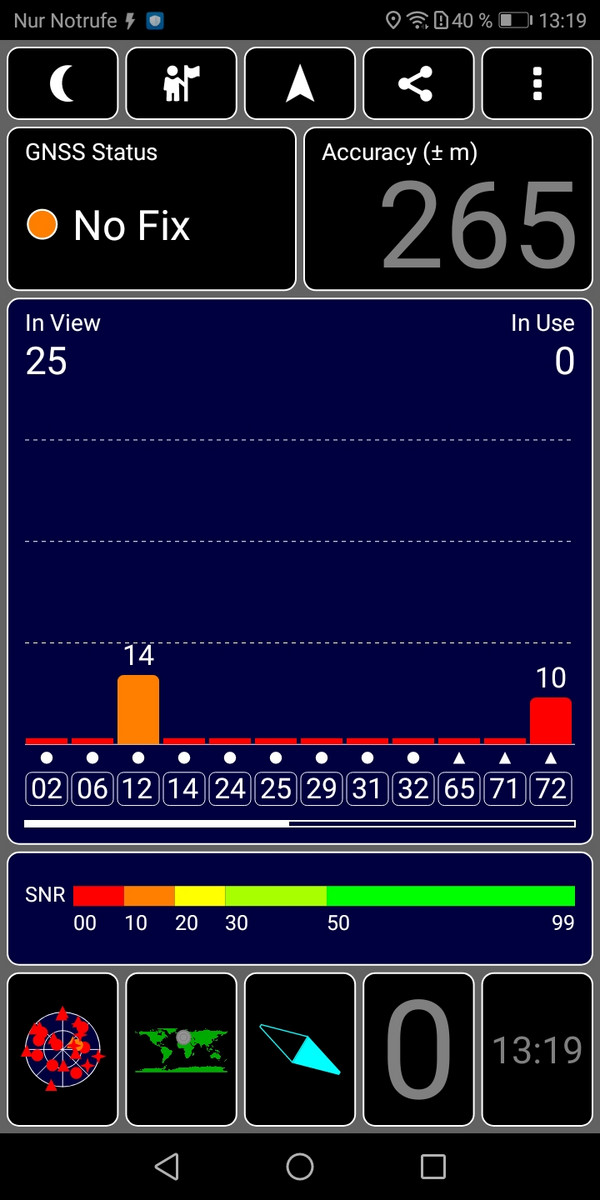
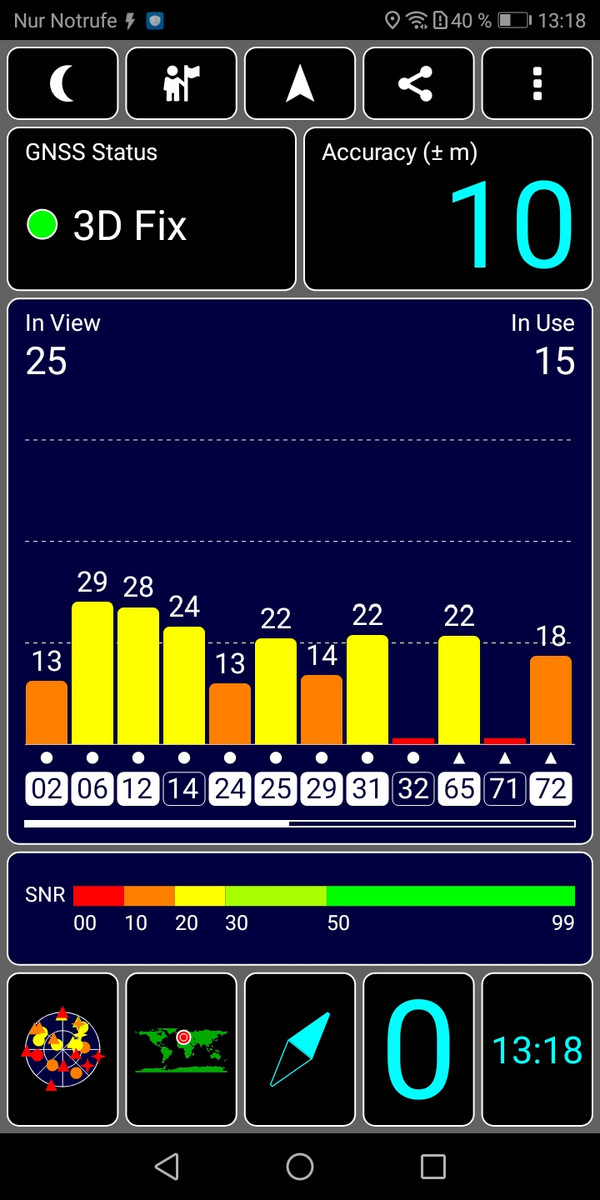
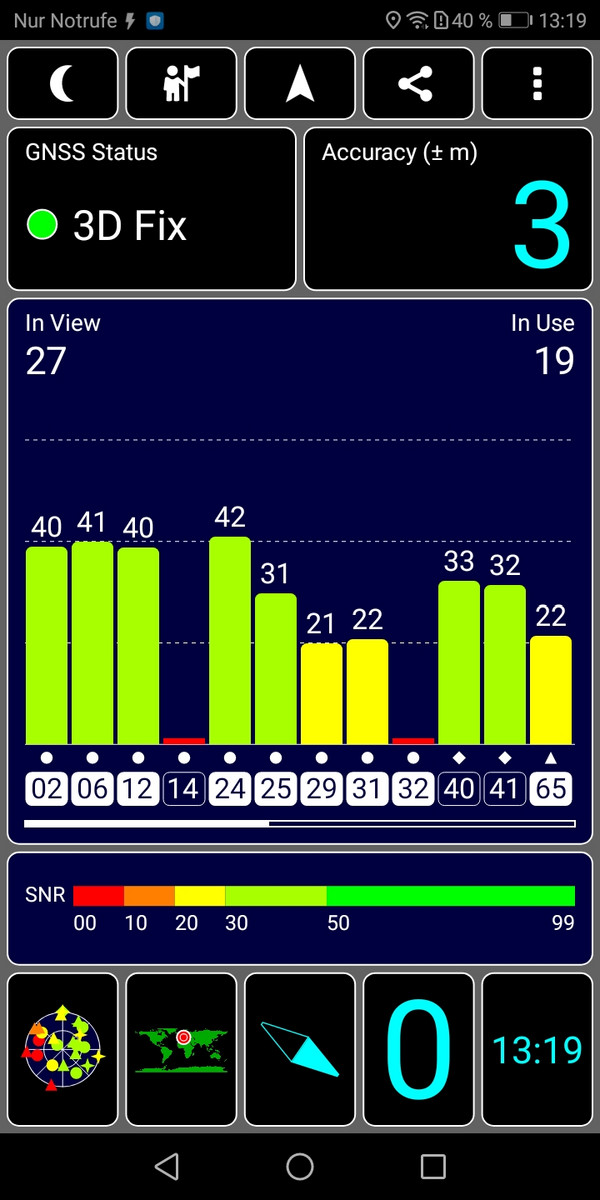
Our test device can only locate us indoors when we are next to a window. GPS accuracy is much better outdoors though, with the GPS quickly locking on to an accuracy of three meters.
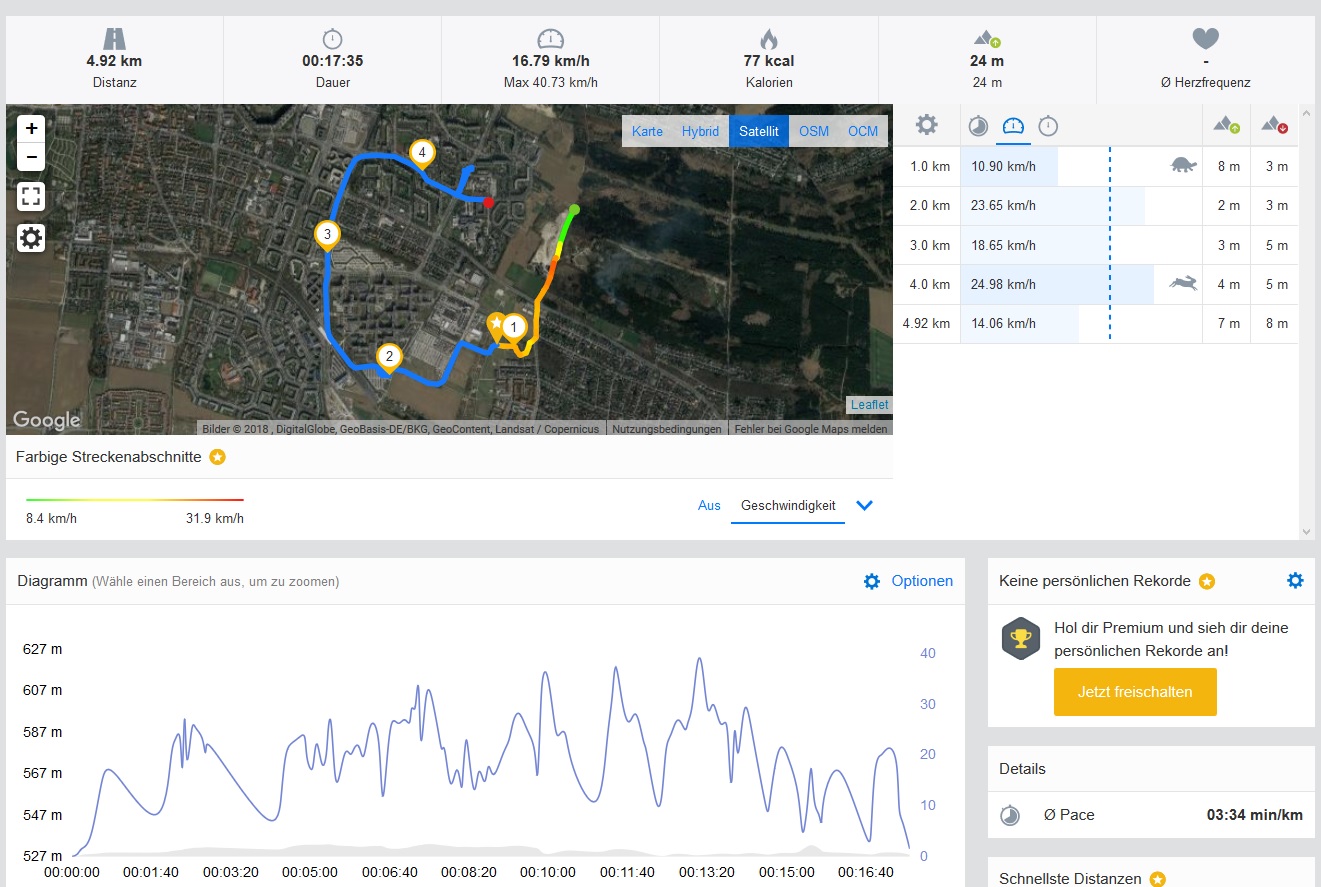
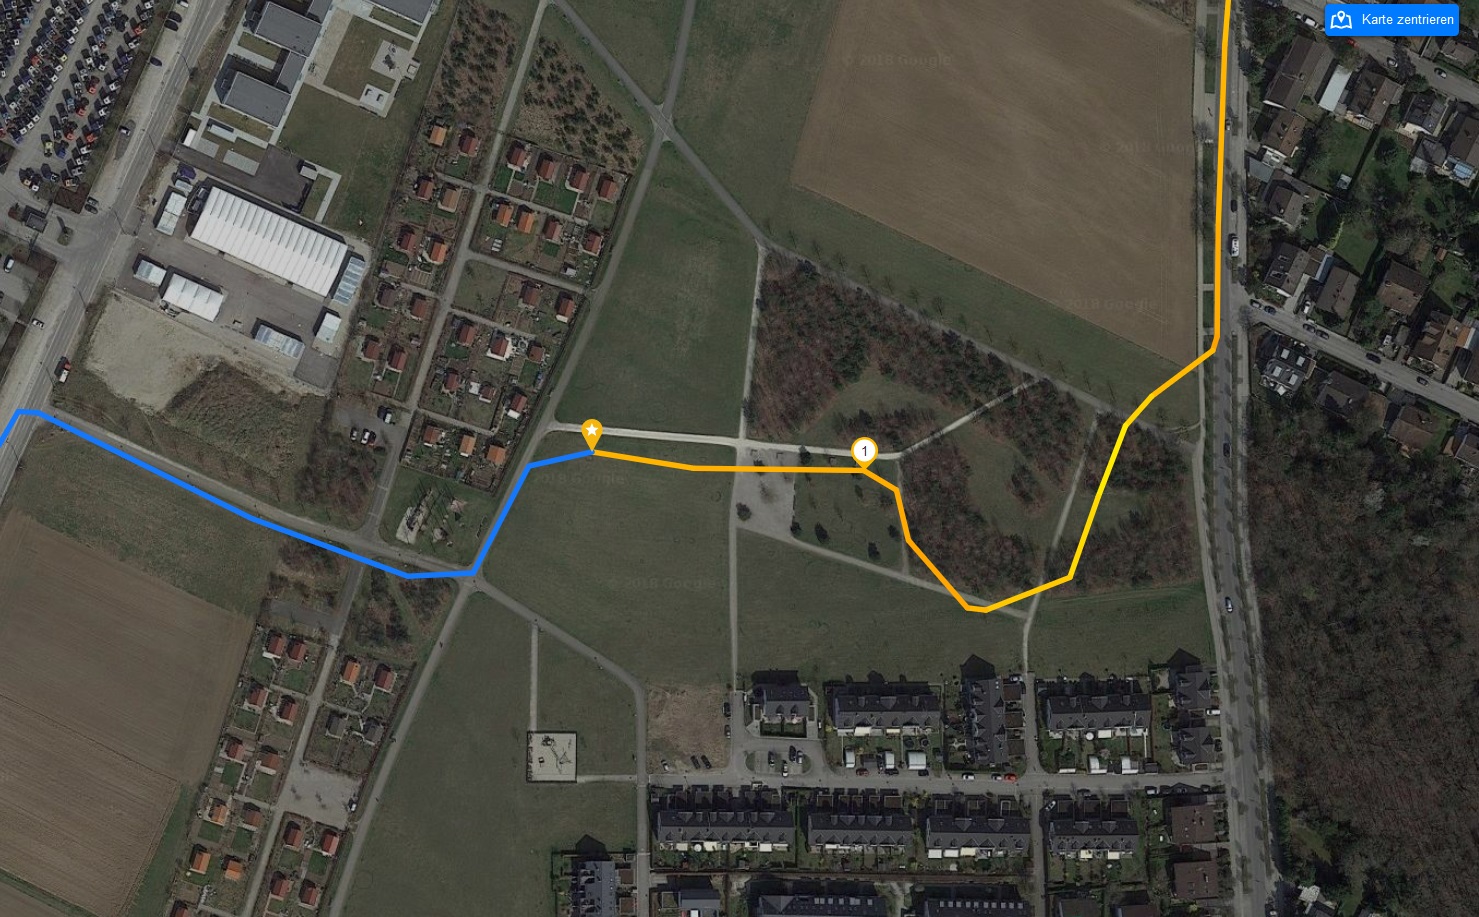
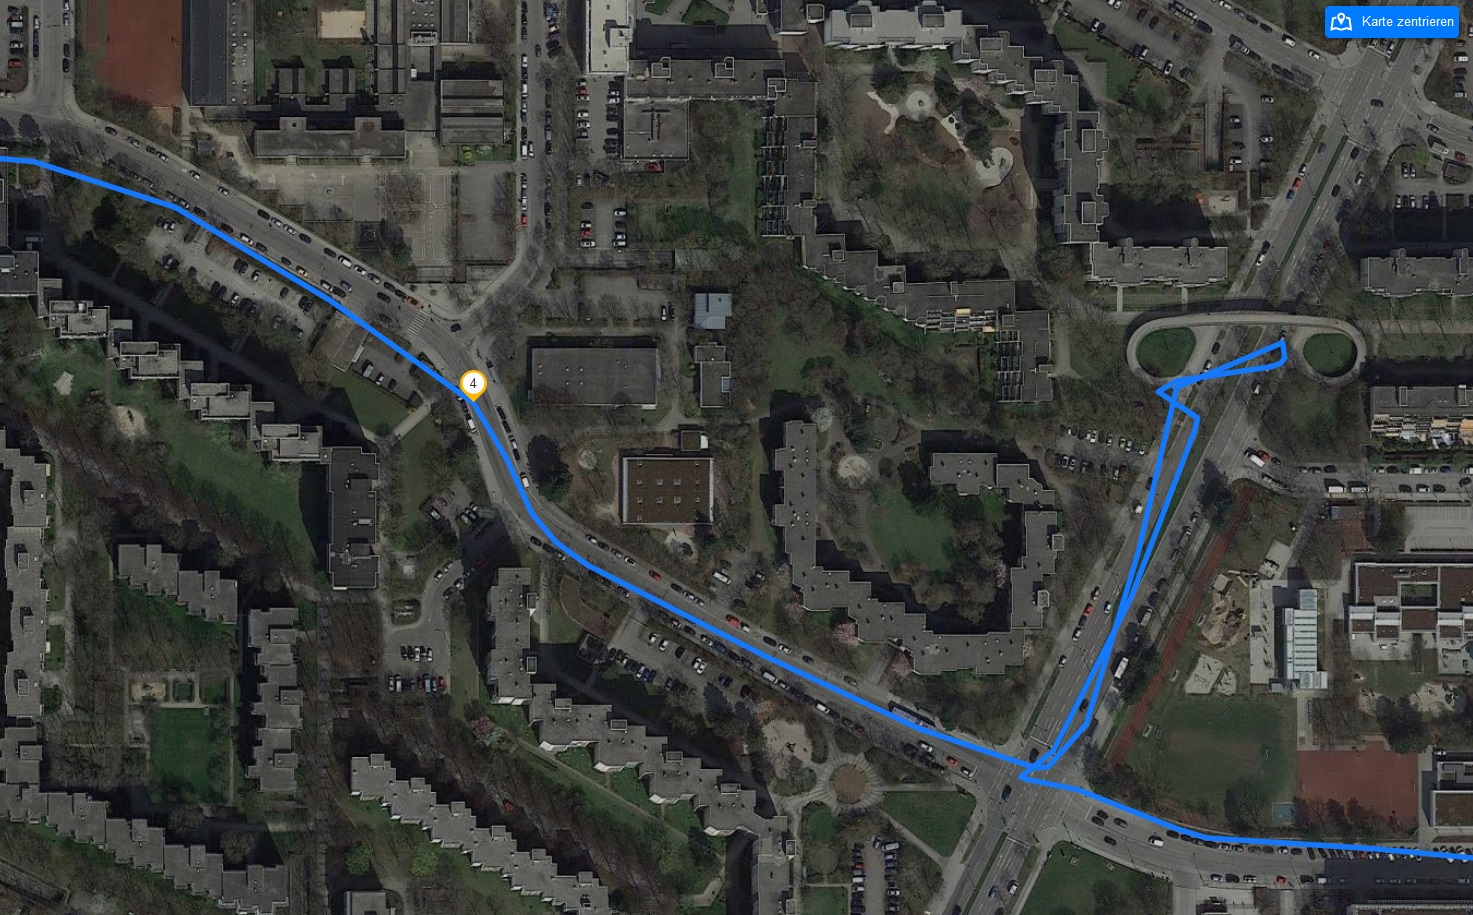
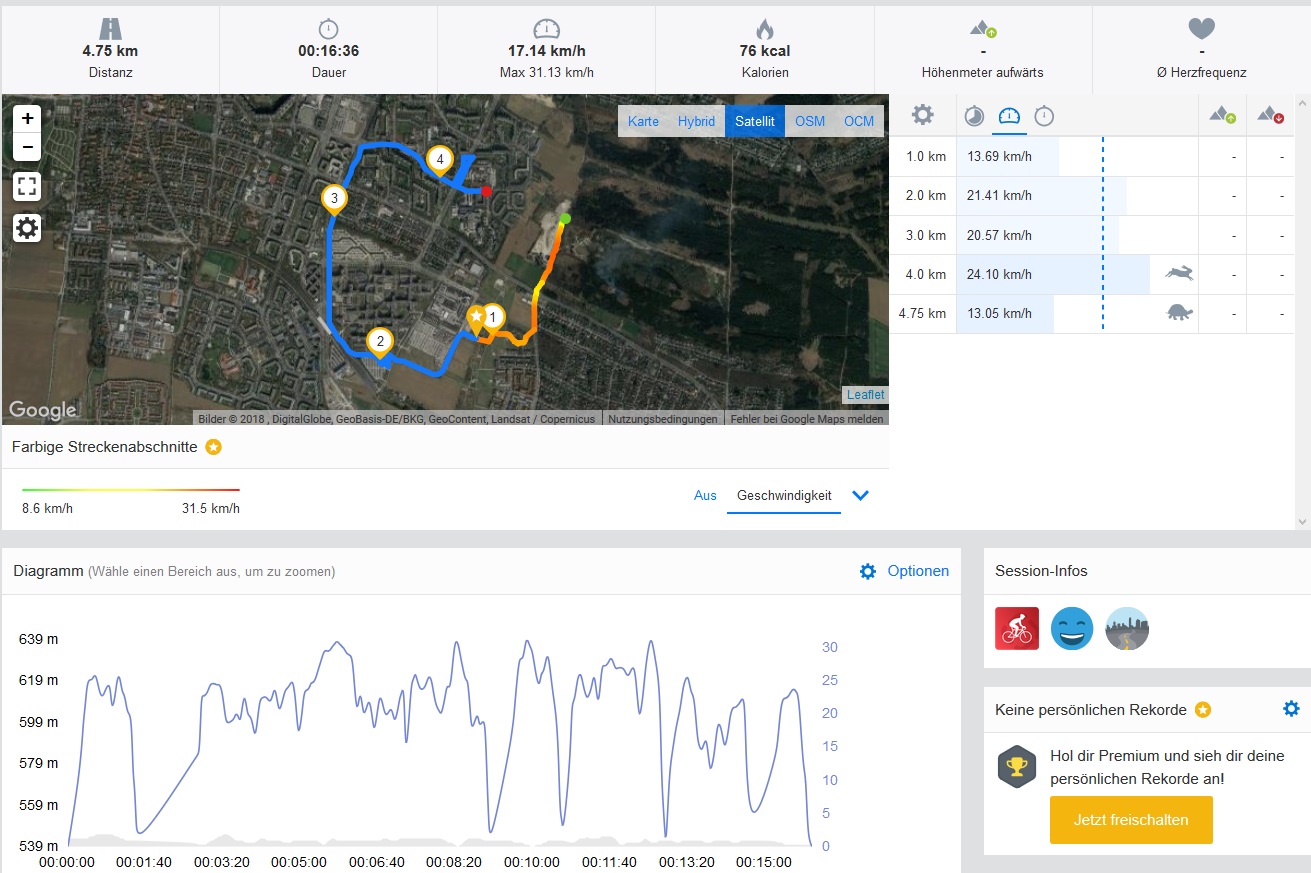
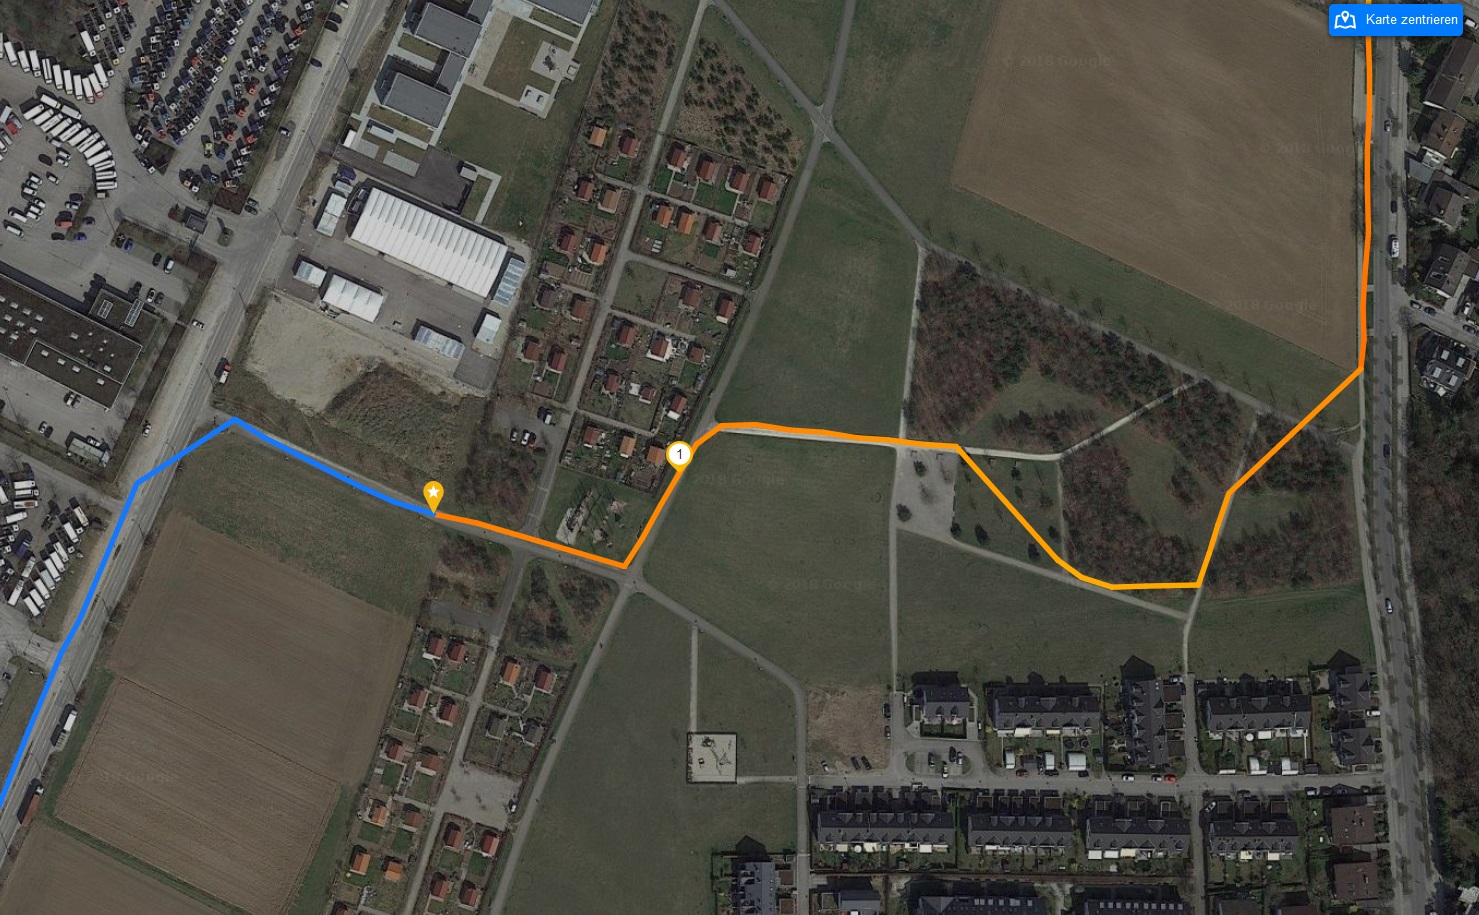
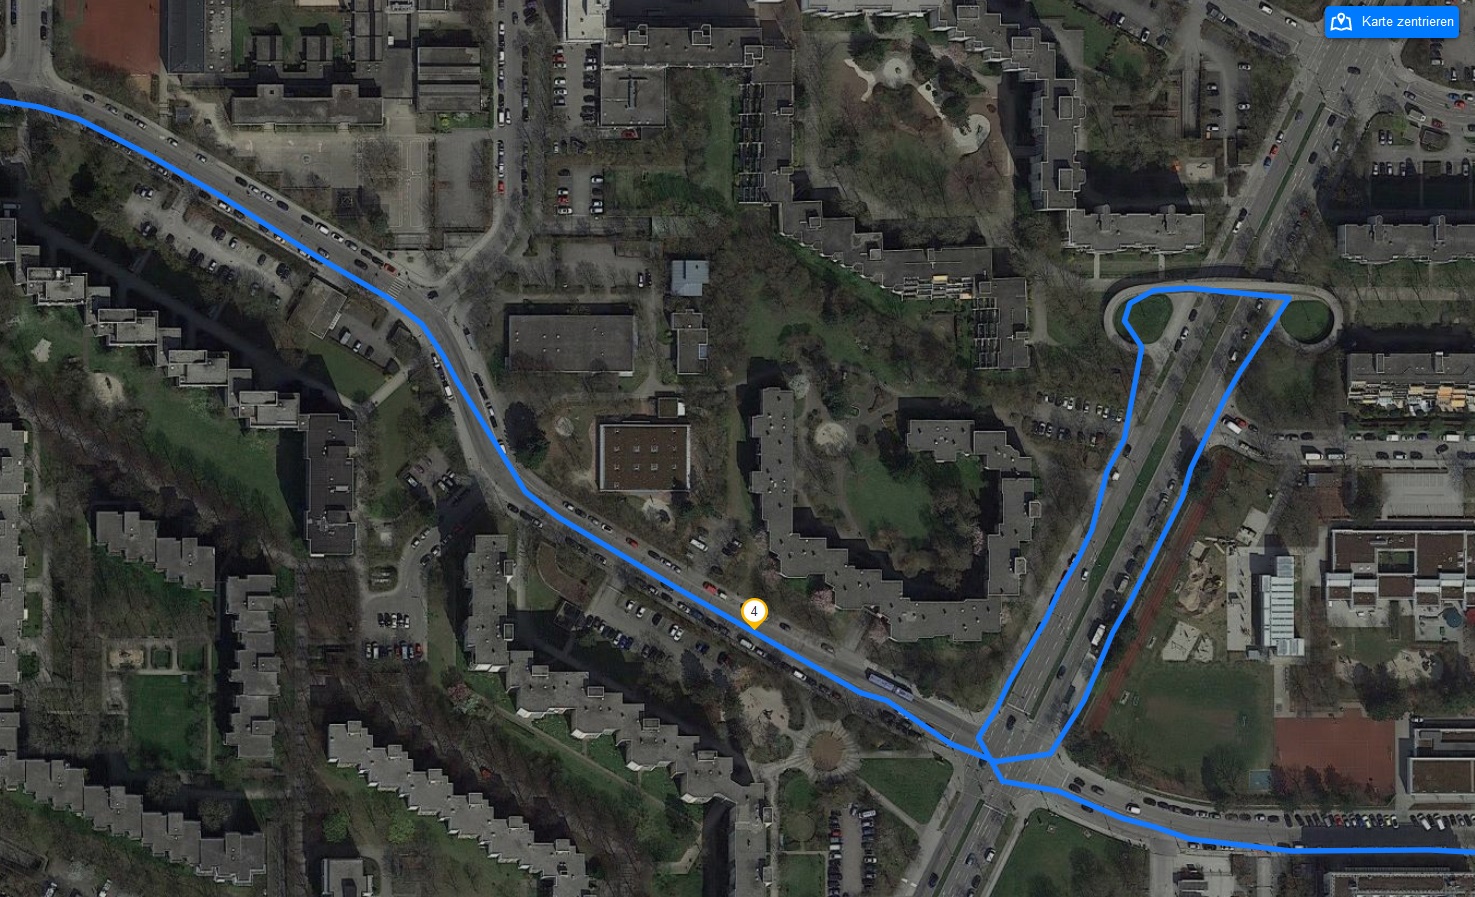
We took the Y7 2018 on a bicycle ride with a Garmin Edge 520 to compare our test device’s location accuracy against a professional navigation system. The Y7 2018 performed well against the Garmin, achieving 96.5% accuracy over the total distance covered. The Y7 2018 struggled with accurately tracking us across paths. It did much better when cycling across the bridge though and is able to even show on which side of the road we were cycling. Overall, we would recommend the Y7 2018 if you do not need the accuracy that a professional system would offer.
Telephone Function & Call Quality
The Y7 2018 uses Huawei’s Phone app, which is functionally like the Google app found on other devices. The Huawei version can be used while holding the device horizontally like the Google version. One notable difference is that the keypad is displayed from the outset rather than having to click on the keypad icon to open it. Favorites and Contacts are organized into tabs and there is also support for blocking individual contacts if necessary.
The Y7 2018 captures voices well with little to no background noise depending on the environment. Our call partner could easily hear us when talking with the phone to our ear. Unfortunately, voices on the other end of the call sound noisy and unpleasant at high call volumes.
The same cannot be said for calling over loudspeaker though. The microphone barely picked up our voice even we spoke loudly. Our call partner sounded clear but not overly loud either.
Cameras
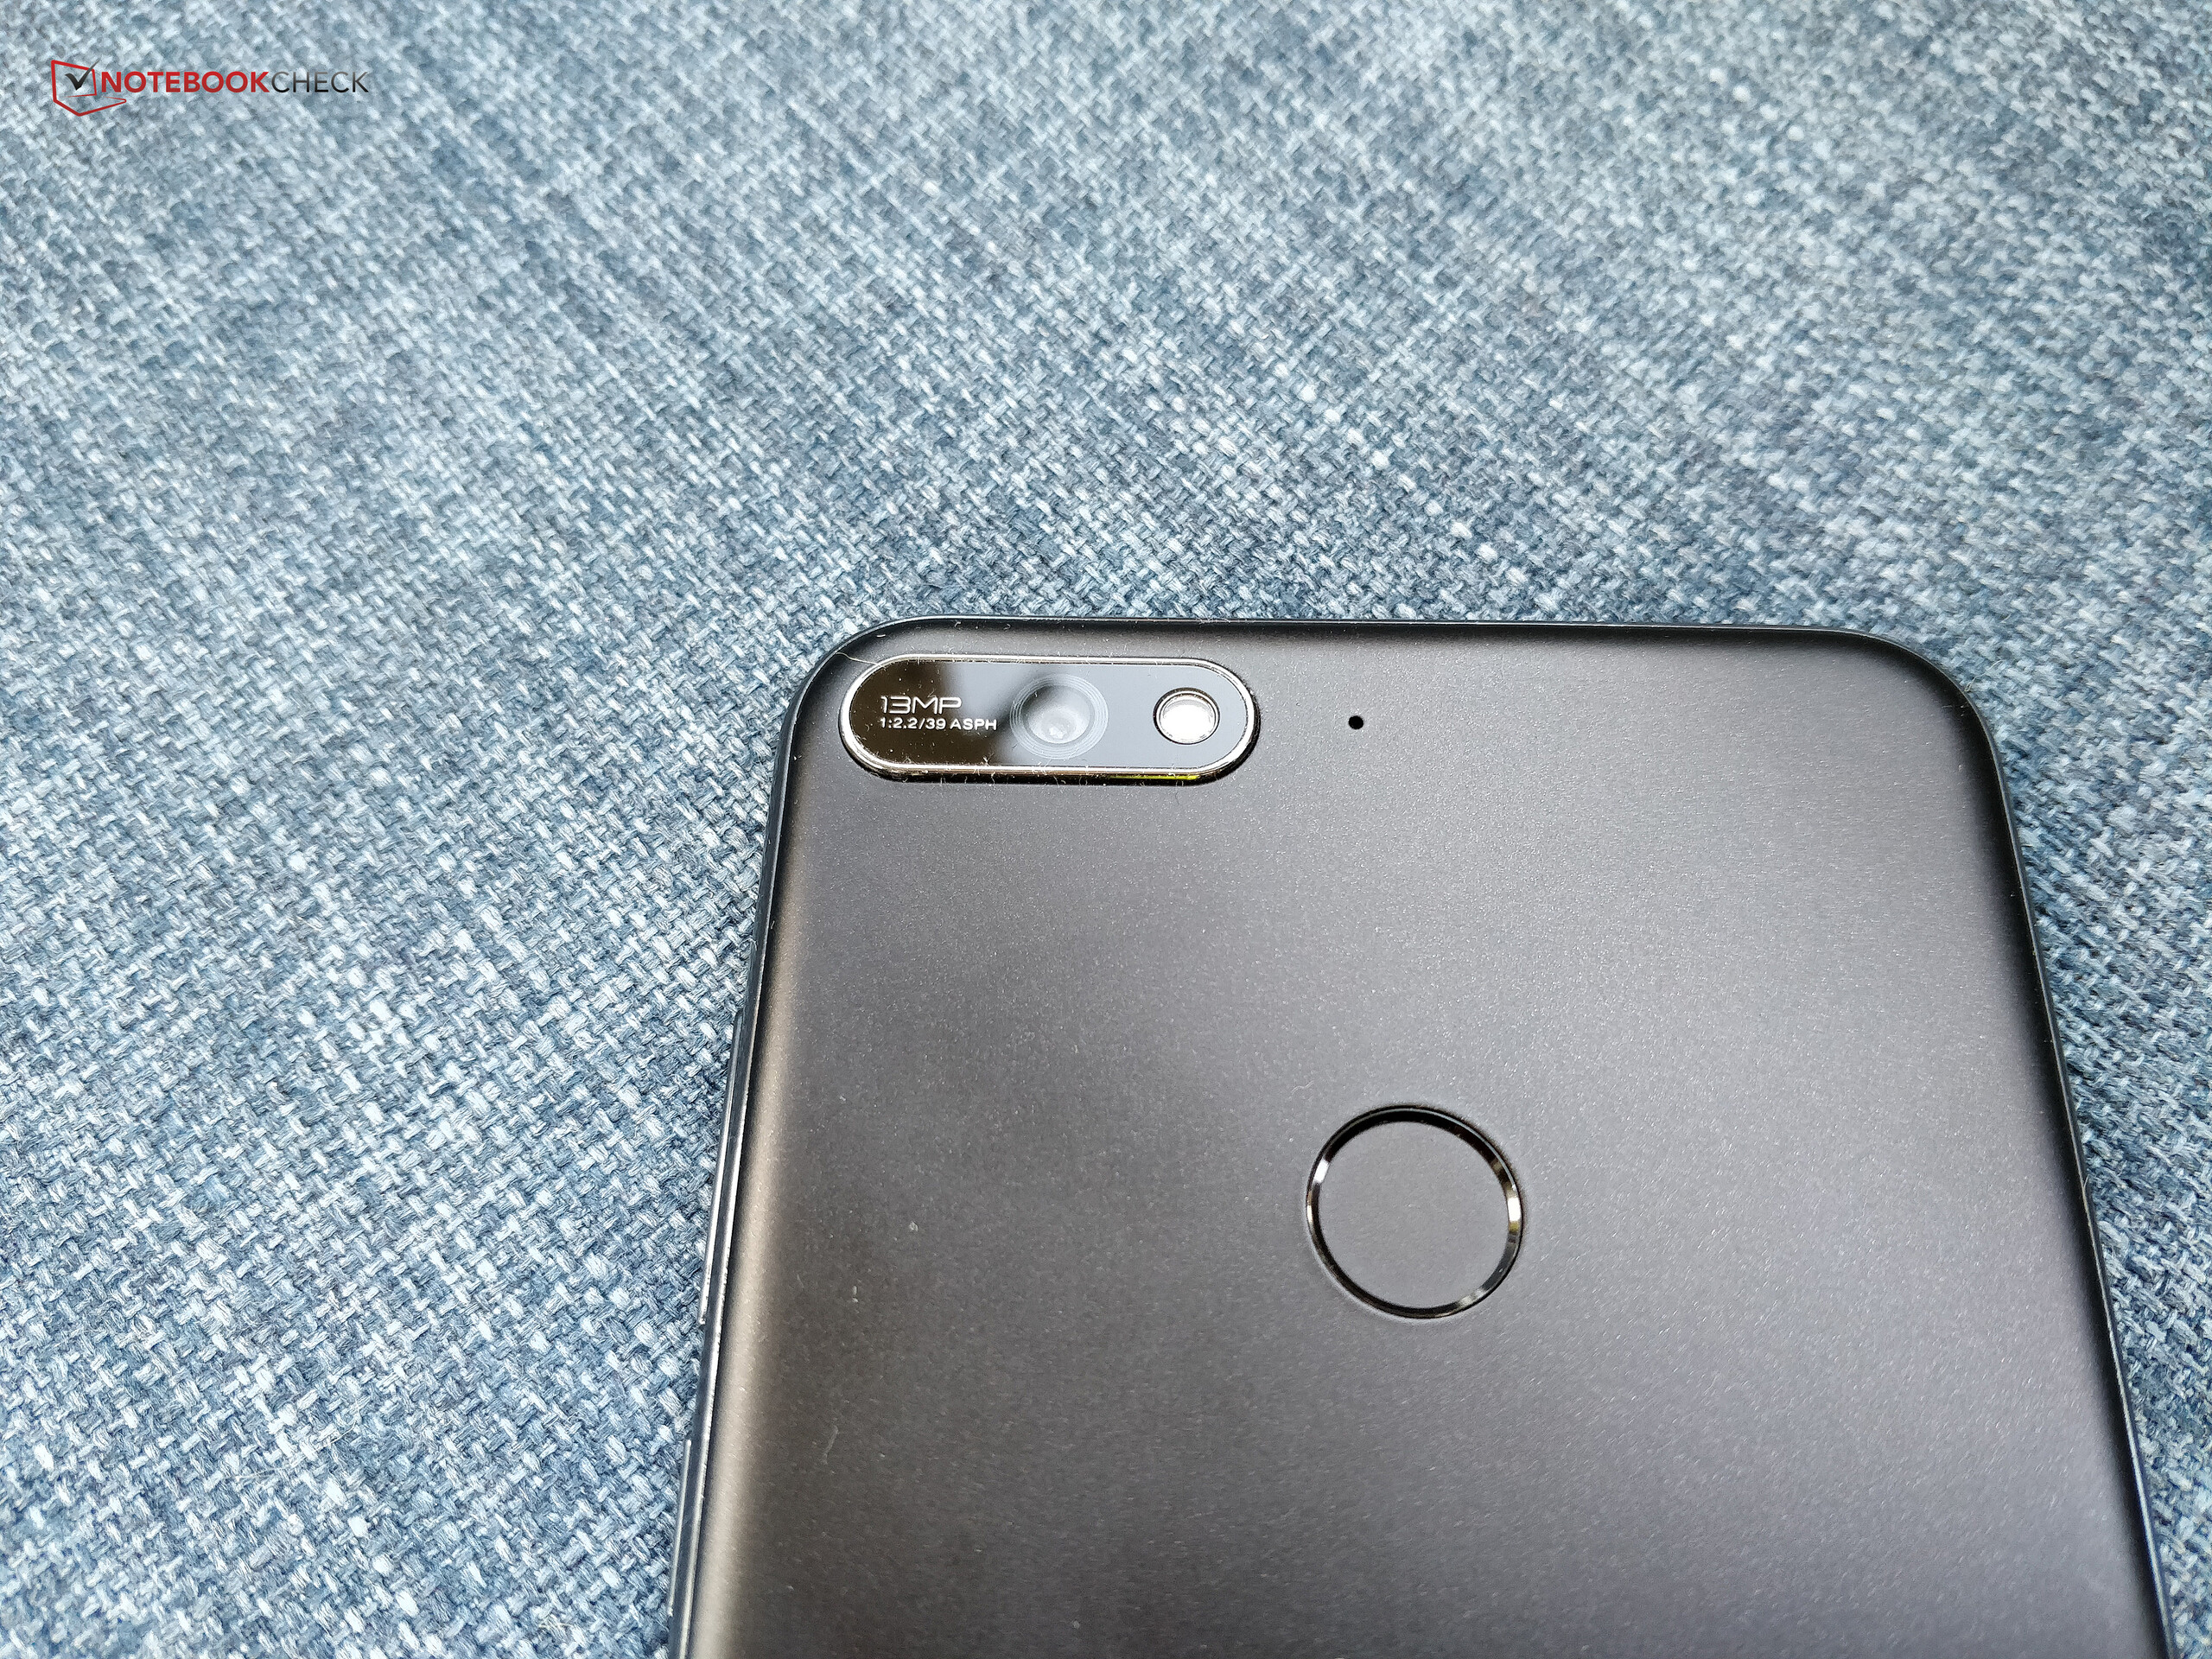
The Y7 2018 has the same rear-facing camera as its smaller sibling, the Y6 2018. The 13 MP camera has a single-color LED flash. By contrast, the Y7 (2017) has an f/2.2 12 MP camera. Comparable devices have dual-cameras or higher resolution single cameras. For example, the Ulefone Power 3 and the Oukitel U18 have dual-camera arrays, both of which have 16 MP & 5 MP sensors.
The rear-facing camera produces photos that are poorly lit and have a clear bluish tint. In comparison, photos taken by the OnePlus 5T are much warmer; the OnePlus 5T is considerably more expensive though. The Y7 2018 produces sharp shots though, which impressed us. Objects are usually captured with strong details and are appropriately sharpened. The camera struggles in low light though, particularly with details. Depending on the scenario, the camera sometimes even struggles to capture objects as the whole scene is just too dark.
The Y7 2018 has an 8 MP front-facing camera that often overexposes shots and captures objects in little detail.
Videos can be recorded at up to 1080p at 30 FPS. Colors look as cool in videos as they do in photos, while the autofocus is notably jumpy when it switches focus between objects.

We tested the Y7 2018’s main camera under controlled lighting conditions in our laboratory. Shots taken in these conditions contain objects that look relatively washed-out. Images tended to have some pixelated areas of color, with the focus being okay at best. Color reproduction is slightly too pale, with white areas having a clear blue tint to them.
Accessories & Warranty
Our test device came with a charger, a USB cable, headphones and a SIM tool. Other official accessories are not currently visible on Huawei’s website.
The Y7 2018 comes with 24 months warranty. Please see our Guarantees, Return policies and Warranties FAQ for country-specific information.
Input Devices & Operation
SwiftKey is the default keyboard app and has many customizable options. Alternative keyboards are downloadable from the Google Play Store. We would recommend choosing a trusted provider as a keyboard can log all your inputs, including passwords.
Huawei has fitted a screen protector to our test device that we found hard to remove. While it protects the screen from scratches, it makes it harder to slide fingers across the display than when doing so across glass. This is particularly noticeable when interacting with the device at the edge of the display. We could feel the edge of the screen protector beneath our fingers. Overall, the touchscreen works well with the screen protector and remains precise. We prefer using the device without the protector on though.
Huawei installs its NaviDot software too, which can be used as an alternative to the standard Android menu layout.
If the standard method of operation is too complicated, then the Y7 2018 has an option to switch to a simple mode with larger buttons and limited functionality.
Display
The Y7 2018 has a 5.99-inch display with a 2:1 aspect ratio that results in a 1440x720 resolution. The Ulefone Power 3 and the Xiaomi Redmi 5 Plus both have far higher resolution displays at 2160x1080 each. Content on the Y7 2018 lacks the clarity that it has on the other two devices, in part because the lower resolution is stretched over a larger display.
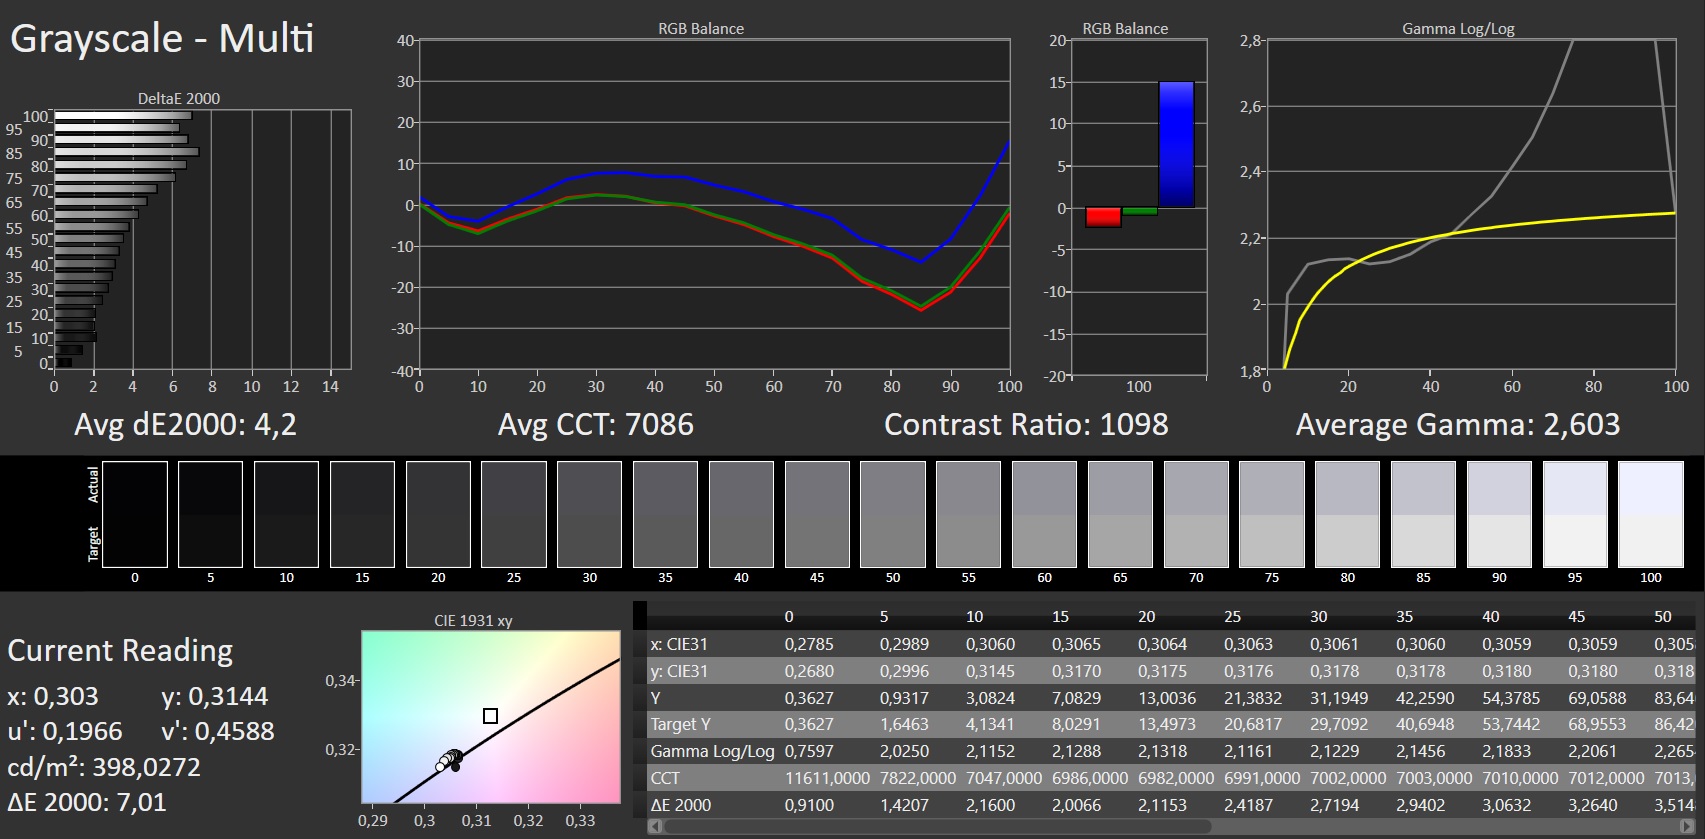
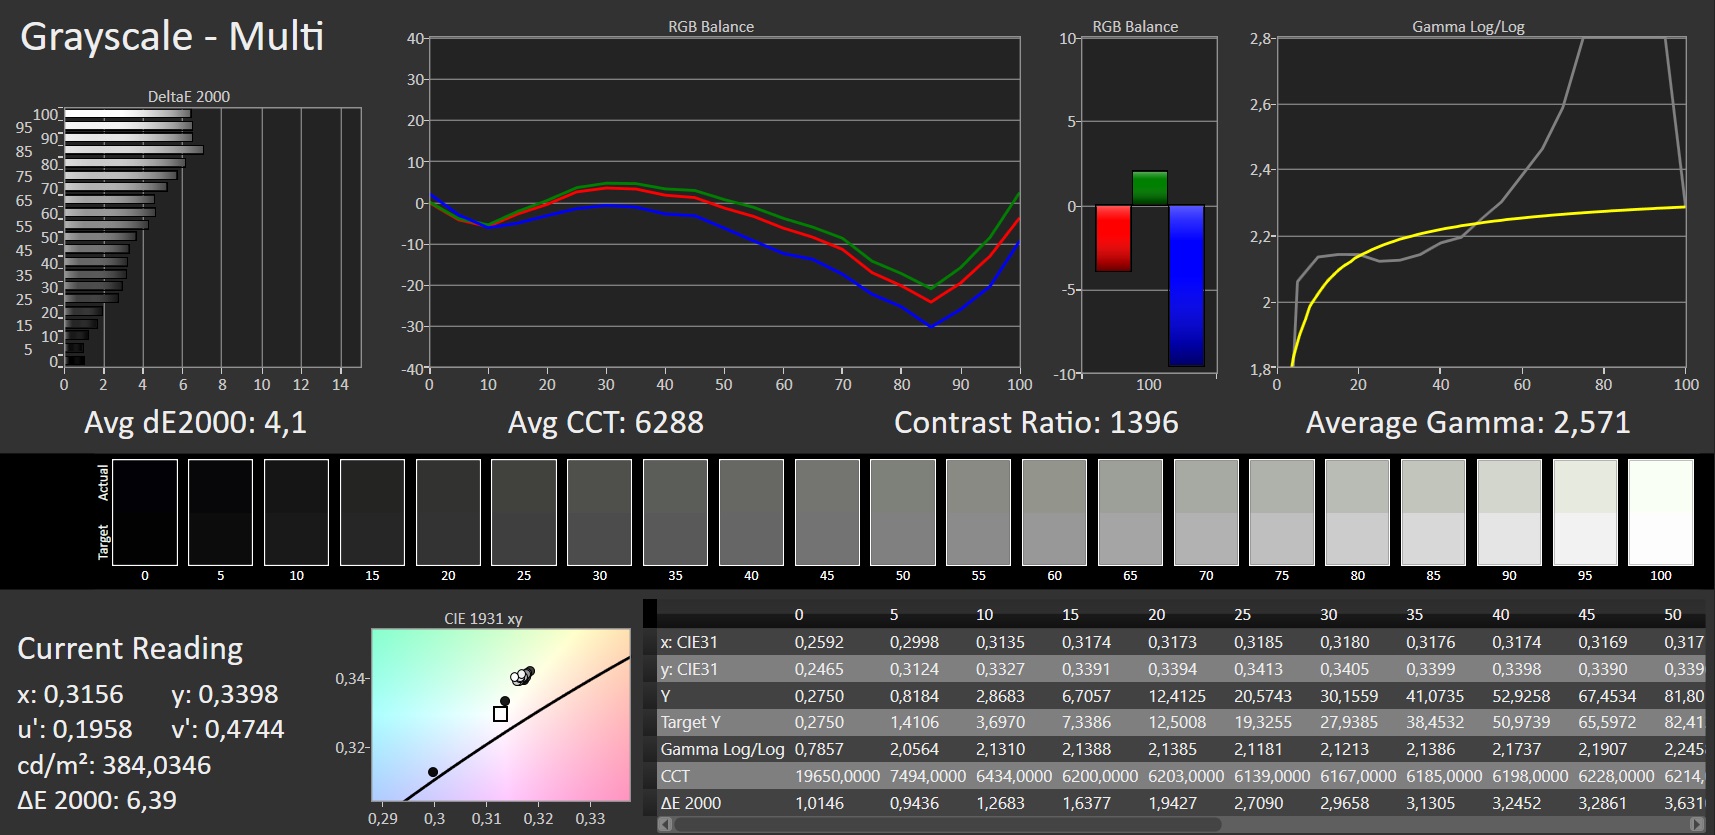
We measured average maximum brightness at 365 cd/m², which reduced to 334 cd/m² with the brightness sensor activated. Neither of these values is especially bright, with the maximum average brightness being significantly lower than our comparison devices. We measured our test device as having 85% even brightness distribution. Equally, this is below those of most our comparison devices, particularly the Y7 (2017).
| |||||||||||||||||||||||||
Brightness Distribution: 85 %
Center on Battery: 334 cd/m²
Contrast: 1355:1 (Black: 0.29 cd/m²)
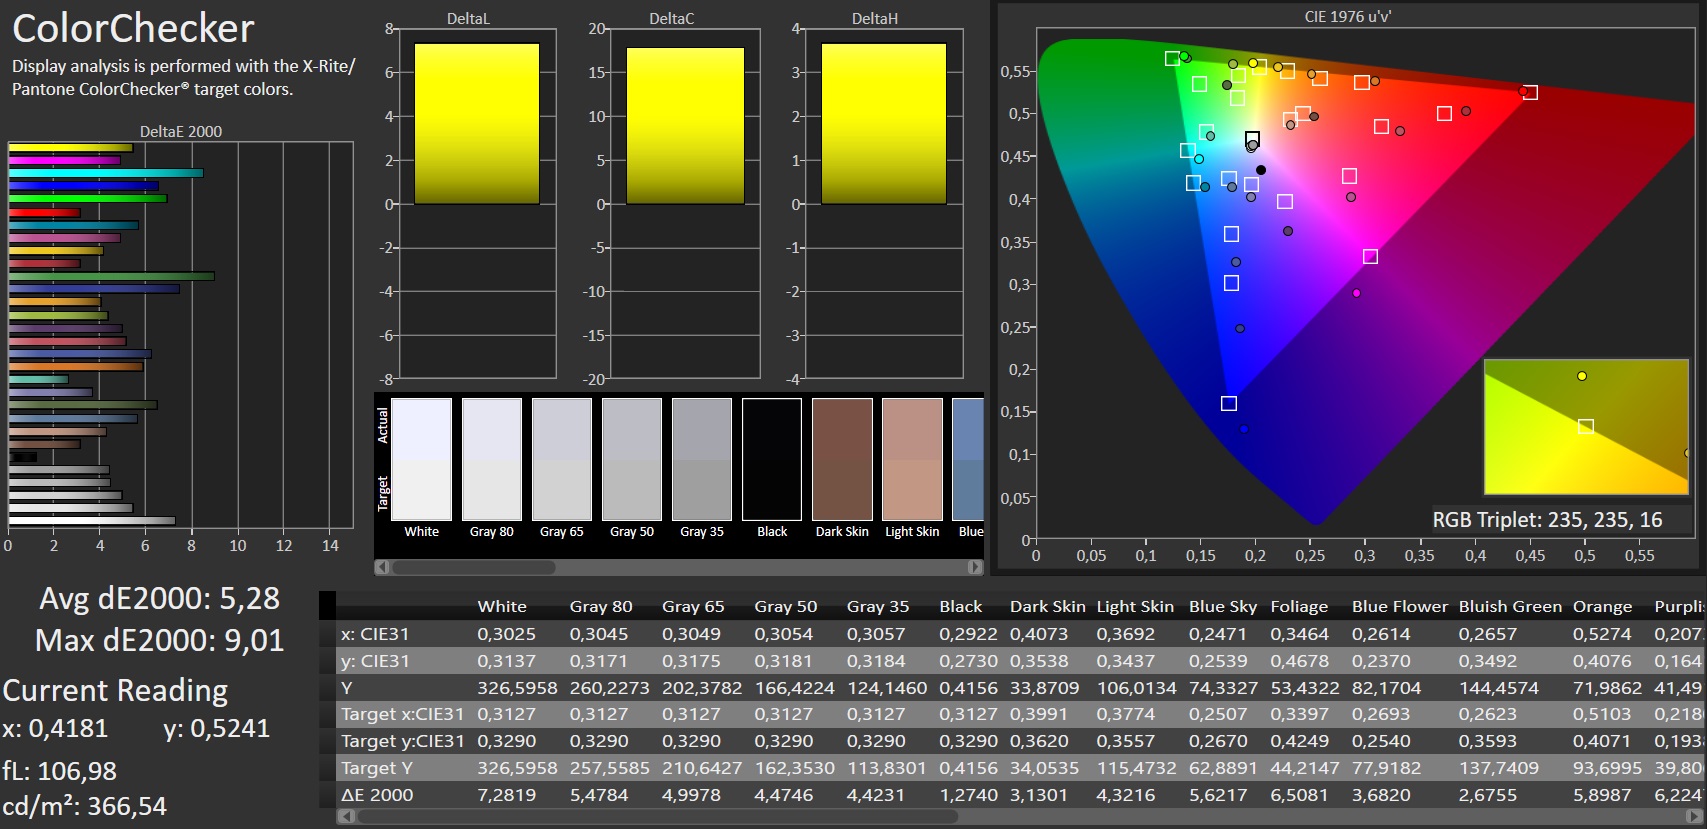
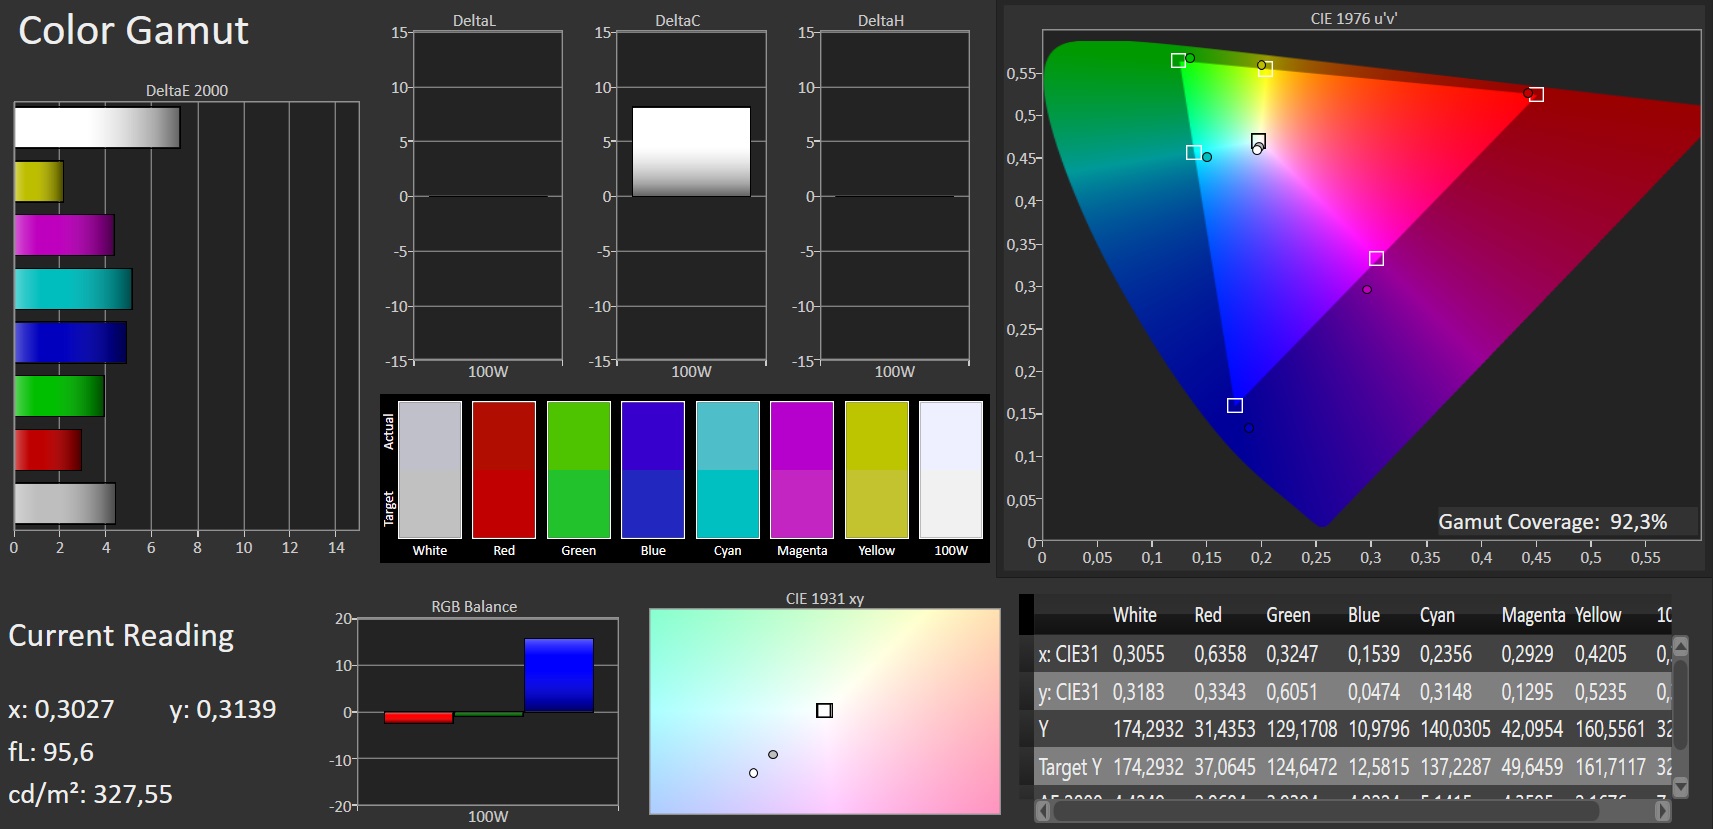
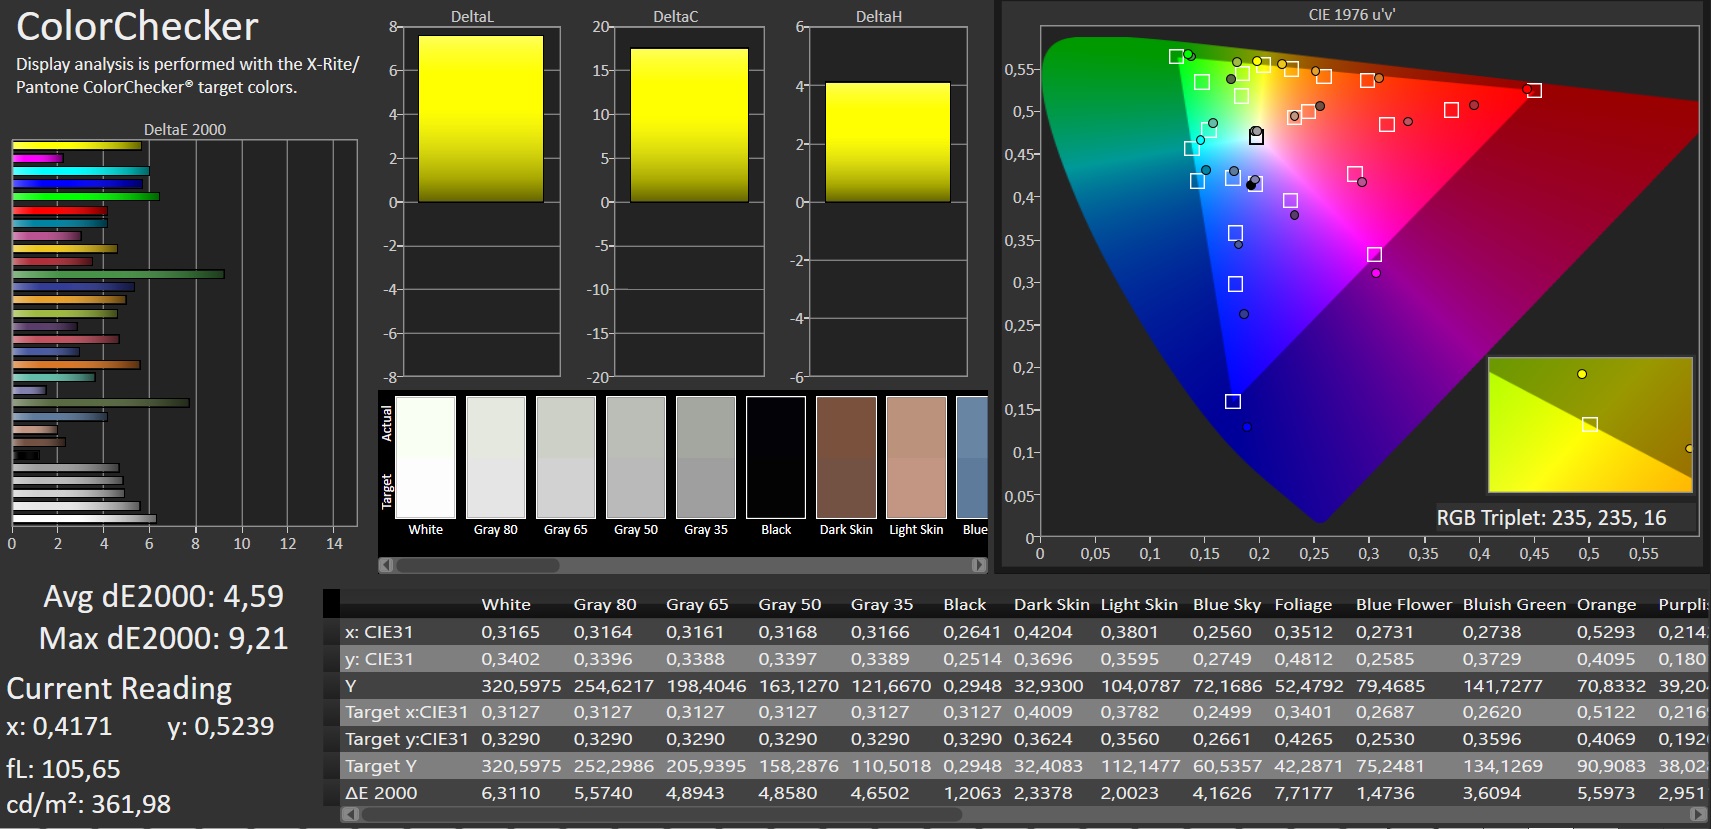
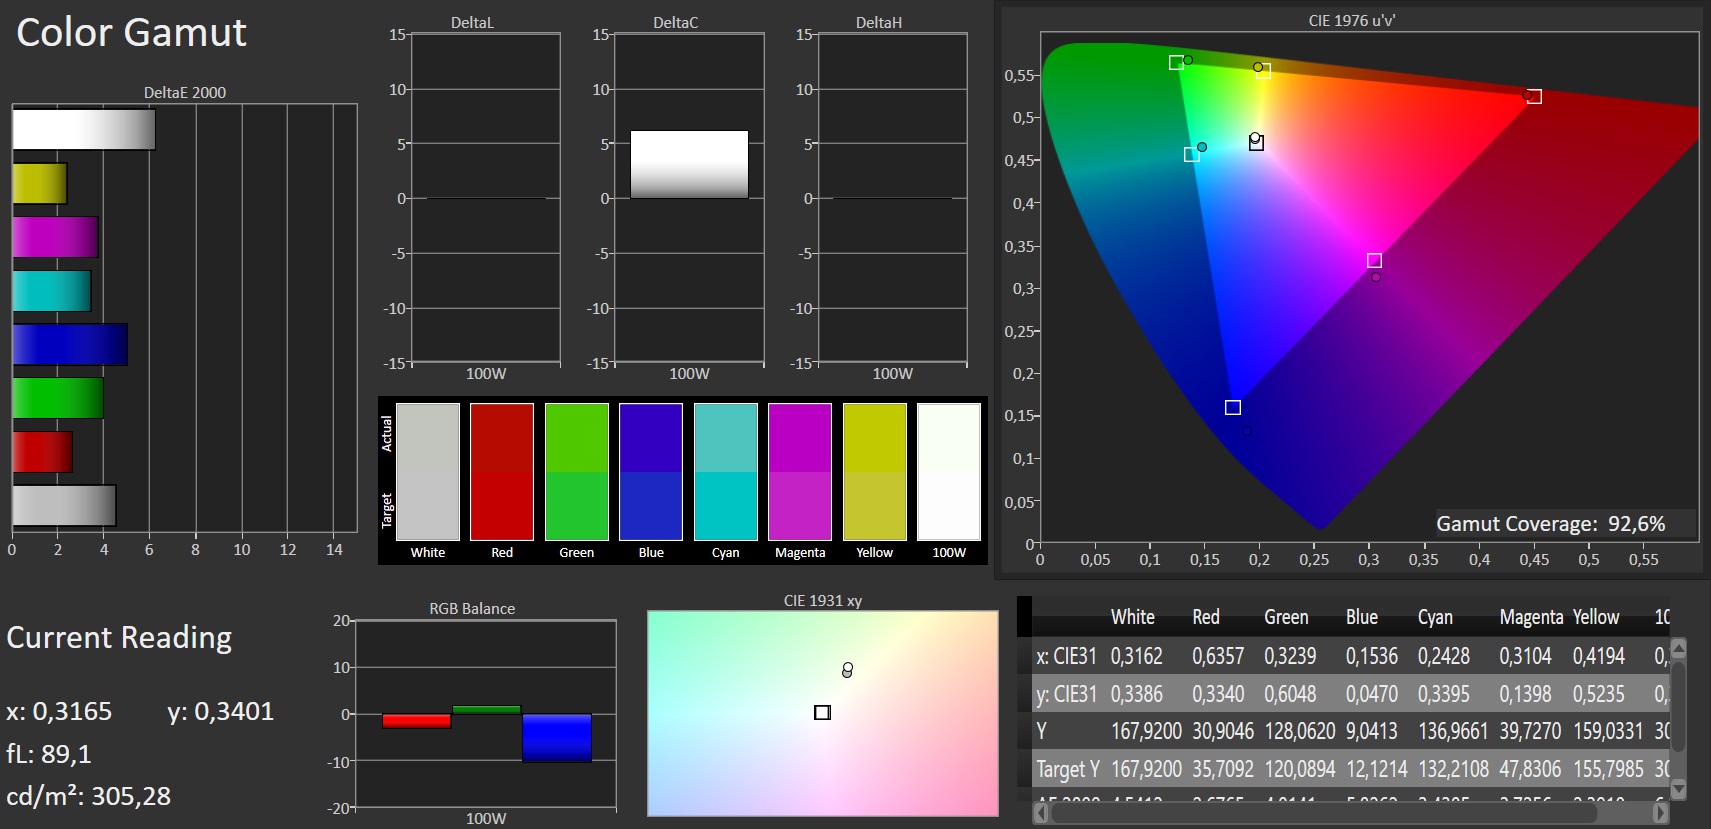
ΔE ColorChecker Calman: 5.28 | ∀{0.5-29.43 Ø4.71}
ΔE Greyscale Calman: 4.2 | ∀{0.09-98 Ø4.96}
92.3% sRGB (Calman 2D)
Gamma: 2.6
CCT: 7086 K
| Huawei Y7 2018 IPS, 1440x720, 6" | Huawei Y7 IPS, 1280x720, 5.5" | Xiaomi Redmi 5 Plus IPS, 2160x1080, 6" | Oukitel U18 LCD IPS, 1512x720, 5.9" | Ulefone Power 3 IPS, 2160x1080, 6" | |
|---|---|---|---|---|---|
| Screen | 8% | 9% | -20% | 8% | |
| Brightness middle (cd/m²) | 393 | 467 19% | 620 58% | 565 44% | 494 26% |
| Brightness (cd/m²) | 365 | 456 25% | 612 68% | 535 47% | 485 33% |
| Brightness Distribution (%) | 85 | 92 8% | 96 13% | 83 -2% | 87 2% |
| Black Level * (cd/m²) | 0.29 | 0.39 -34% | 0.57 -97% | 0.55 -90% | 0.33 -14% |
| Contrast (:1) | 1355 | 1197 -12% | 1088 -20% | 1027 -24% | 1497 10% |
| Colorchecker dE 2000 * | 5.28 | 4.3 19% | 3.46 34% | 7.1 -34% | 5.1 3% |
| Colorchecker dE 2000 max. * | 9 | 6.8 24% | 7.88 12% | 13.7 -52% | 9.9 -10% |
| Greyscale dE 2000 * | 4.2 | 3.5 17% | 3.9 7% | 6.2 -48% | 3.5 17% |
| Gamma | 2.6 85% | 2.35 94% | 2.073 106% | 2.85 77% | 2.16 102% |
| CCT | 7086 92% | 7273 89% | 7230 90% | 7153 91% | 7253 90% |
* ... smaller is better
Screen Flickering / PWM (Pulse-Width Modulation)
| Screen flickering / PWM detected | 9091 Hz | ≤ 15 % brightness setting | 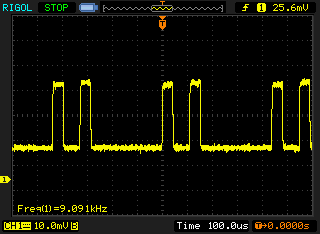 |
The display backlight flickers at 9091 Hz (worst case, e.g., utilizing PWM) Flickering detected at a brightness setting of 15 % and below. There should be no flickering or PWM above this brightness setting. The frequency of 9091 Hz is quite high, so most users sensitive to PWM should not notice any flickering. In comparison: 52 % of all tested devices do not use PWM to dim the display. If PWM was detected, an average of 7757 (minimum: 5 - maximum: 343500) Hz was measured. | |||
Our test device has a 0.29 cd/m² black value, which helps yield an impressive 1,355:1 contrast ratio. The Y7 2018 is stronger than practically all the competition in this regard. The display does use pulse-width modulation (PWM) to regulate brightness, but we only noticed this at 15% and below brightness. We measured PWM at 9,091 Hz, which should be high enough so that even those who are PWM-sensitive should have no problems with the display.
We took a closer examination of the display using a spectrophotometer and CalMAN software. We quickly noticed a blue tint during the grayscale test. The Y7 2018 supports manual white balance and offers various presets. We tried out the “Warm” preset but this gives gray tones a green hue. Color deviations are slightly lower when using the “Warm” preset than with the default white balance. The deviations in “Warm” put the Y7 2018 in the middle of our comparison devices. Overall, the display lacks sufficient color-space coverage for professional use. Adjusting the white balance manually can lead to a decent white balance that is good enough for private use.

Display Response Times
| ↔ Response Time Black to White | ||
|---|---|---|
| 22.4 ms ... rise ↗ and fall ↘ combined | ↗ 12.4 ms rise | 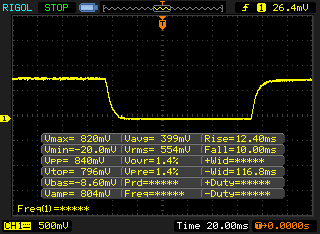 |
| ↘ 10 ms fall | ||
| The screen shows good response rates in our tests, but may be too slow for competitive gamers. In comparison, all tested devices range from 0.1 (minimum) to 240 (maximum) ms. » 51 % of all devices are better. This means that the measured response time is worse than the average of all tested devices (19.8 ms). | ||
| ↔ Response Time 50% Grey to 80% Grey | ||
| 27.6 ms ... rise ↗ and fall ↘ combined | ↗ 12.8 ms rise | 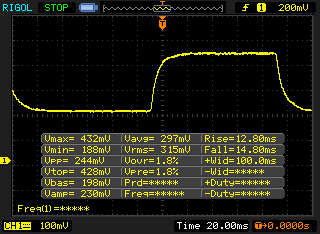 |
| ↘ 14.8 ms fall | ||
| The screen shows relatively slow response rates in our tests and may be too slow for gamers. In comparison, all tested devices range from 0.165 (minimum) to 636 (maximum) ms. » 37 % of all devices are better. This means that the measured response time is better than the average of all tested devices (31 ms). | ||
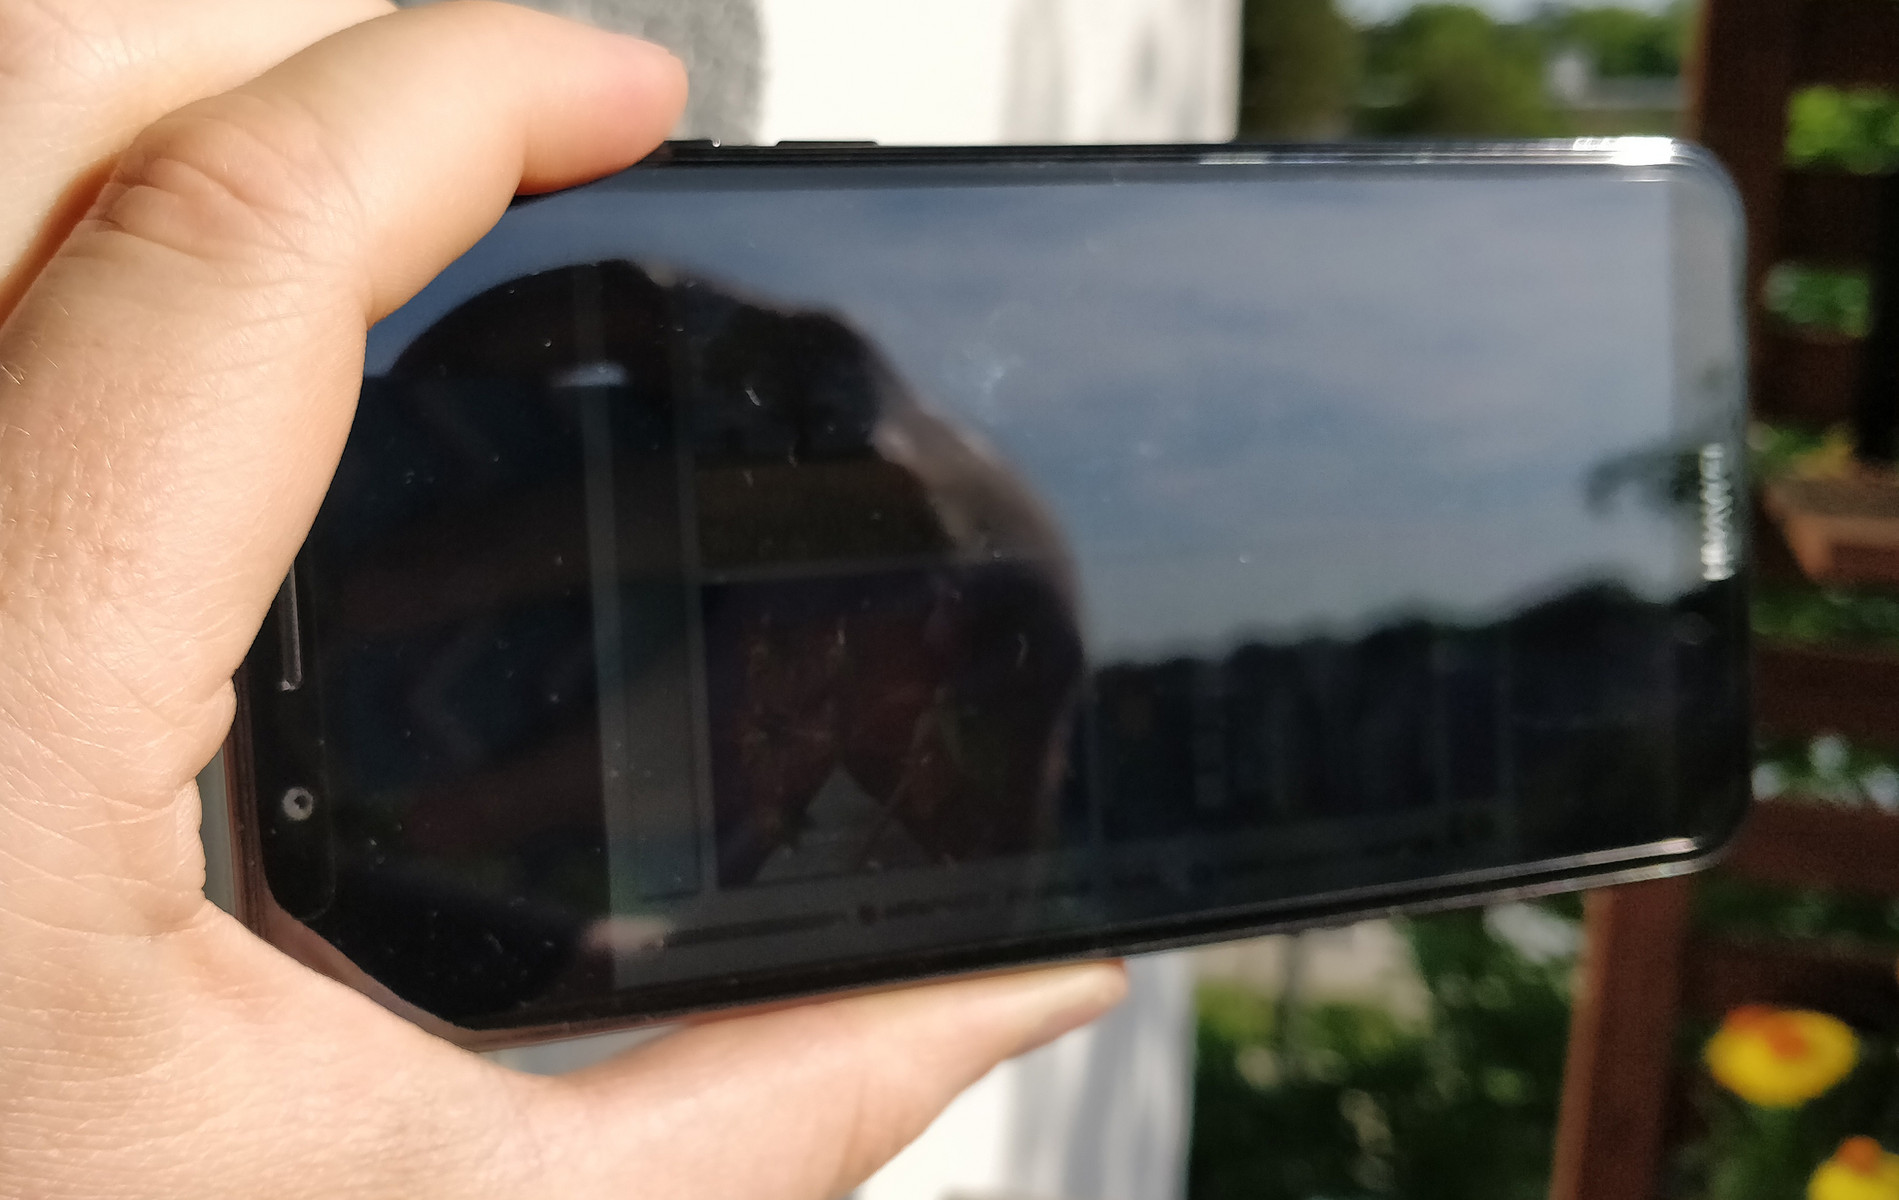
The Y7 2018 is difficult to use outdoors thanks to its reflective display finish and its relatively low maximum brightness. We could hardly see anything on the display in bright light. Things were better when using the device in the shade, but other devices have a clear advantage in this regard.
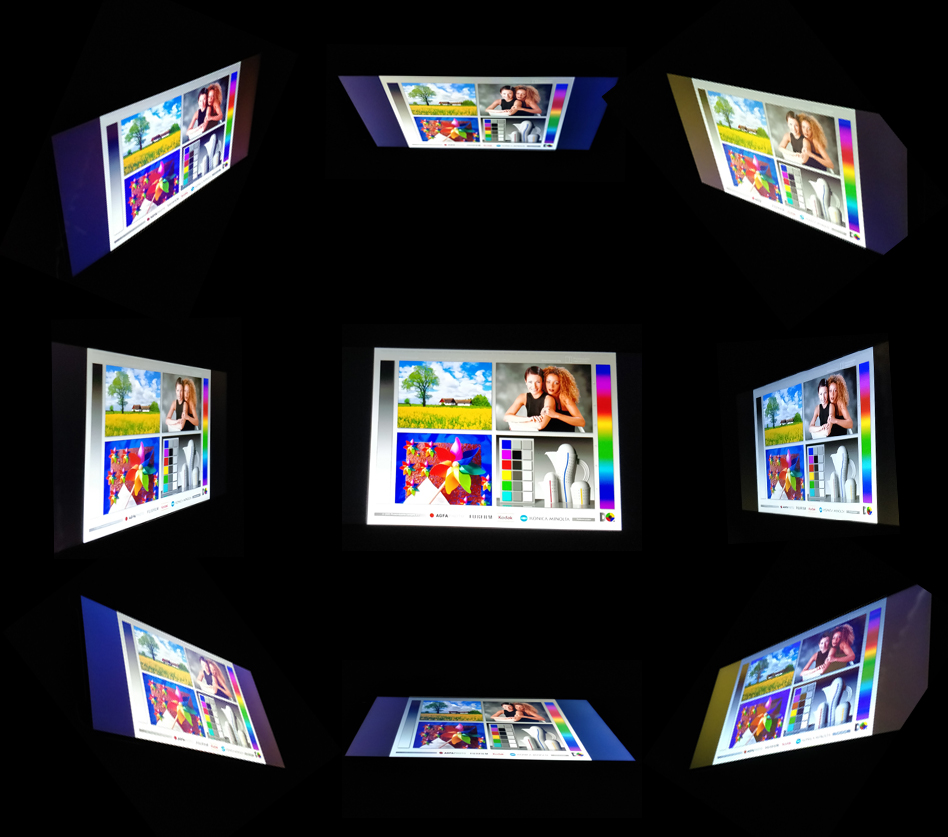
Our test device has good viewing angles, but we noticed color and brightness shifts at acute angles.

Performance
The Y7 2018 is powered by a Qualcomm Snapdragon 430 SoC, an octa-core CPU that Qualcomm announced in late 2016. Each core is clocked at 1.4 GHz. In comparison, the Huawei Y6 2018 is powered by a Qualcomm Snapdragon 425 SoC that has four cores, each of which is clocked at 1.4 GHz. Last year’s Y7 is powered by a Qualcomm Snapdragon 435 SoC. The difference between the Snapdragon 430 and 435 is the modem. The 430 is equipped with a Snapdragon X6 modem compared with the 435’s X9 modem. The X9 delivers up to twice the bandwidth of the X6.
The 430 and 435 have the same number of cores and the same clock speed though, and this is reflected in the benchmark results. The Y7 2018 marginally outperformed its predecessor, but not to the extent that could be noticed in real-world use. The Y7 2018 is on par with other Snapdragon 430 devices, but it cannot keep pace with the Xiaomi Redmi 5 Plus. The Redmi 5 Plus offers greater performance for the same money.
Subjectively, the Y7 2018 performed smoothly in daily use. The only times when our test device lagged was when we had several apps running in the background or waking the device up after prolonged standby.
Graphics are handled by the Qualcomm Adreno 505. Graphics performance is fine for its class, but the Y7 2018 is outperformed by its predecessor in almost all benchmarks. The difference should not be noticeable in daily use, but it is odd to see the predecessor with better GPU performance than its successor.
| AnTuTu v6 - Total Score (sort by value) | |
| Huawei Y7 2018 | |
| Huawei Y7 | |
| Xiaomi Redmi 5 Plus | |
| Ulefone Power 3 | |
| Average Qualcomm Snapdragon 430 (MSM8937) (42798 - 47066, n=16) | |
| AnTuTu v7 - Total Score (sort by value) | |
| Huawei Y7 2018 | |
| Xiaomi Redmi 5 Plus | |
| Oukitel U18 | |
| Ulefone Power 3 | |
| Average Qualcomm Snapdragon 430 (MSM8937) (44992 - 59990, n=11) | |
| PCMark for Android | |
| Work performance score (sort by value) | |
| Huawei Y7 2018 | |
| Huawei Y7 | |
| Xiaomi Redmi 5 Plus | |
| Oukitel U18 | |
| Ulefone Power 3 | |
| Average Qualcomm Snapdragon 430 (MSM8937) (3347 - 5290, n=18) | |
| Work 2.0 performance score (sort by value) | |
| Huawei Y7 2018 | |
| Huawei Y7 | |
| Xiaomi Redmi 5 Plus | |
| Oukitel U18 | |
| Ulefone Power 3 | |
| Average Qualcomm Snapdragon 430 (MSM8937) (3408 - 3892, n=16) | |
| GFXBench 3.1 | |
| on screen Manhattan ES 3.1 Onscreen (sort by value) | |
| Huawei Y7 2018 | |
| Huawei Y7 | |
| Xiaomi Redmi 5 Plus | |
| Oukitel U18 | |
| Ulefone Power 3 | |
| Average Qualcomm Snapdragon 430 (MSM8937) (4.3 - 11, n=17) | |
| Average of class Smartphone (11 - 166, n=116, last 2 years) | |
| 1920x1080 Manhattan ES 3.1 Offscreen (sort by value) | |
| Huawei Y7 2018 | |
| Huawei Y7 | |
| Xiaomi Redmi 5 Plus | |
| Oukitel U18 | |
| Ulefone Power 3 | |
| Average Qualcomm Snapdragon 430 (MSM8937) (2.2 - 4.9, n=17) | |
| Average of class Smartphone (8.6 - 413, n=115, last 2 years) | |
The Y7 2018 falls to the back third of our comparison devices in our browser benchmarks. While scrolling is usually smooth, we often had to wait for pictures to load irrespective of signal strength or Internet speeds.
Resource-hungry HTML5 sites like Google Interland are useable but sometimes a bit jerky.
| JetStream 1.1 - 1.1 Total | |
| Xiaomi Redmi 5 Plus (Chrome 66) | |
| Ulefone Power 3 (Standardbrowser 7.1.1) | |
| Huawei Y7 (Chrome 60) | |
| Average Qualcomm Snapdragon 430 (MSM8937) (17.6 - 21.5, n=16) | |
| Oukitel U18 (Chrome 65) | |
| Huawei Y7 2018 (Chrome 66) | |
| Octane V2 - Total Score | |
| Average of class Smartphone (2800 - 126661, n=146, last 2 years) | |
| Xiaomi Redmi 5 Plus (Chrome 66) | |
| Oukitel U18 (Chrome 65) | |
| Huawei Y7 2018 (Chrome 66) | |
| Huawei Y7 (Chrome 60) | |
| Average Qualcomm Snapdragon 430 (MSM8937) (2604 - 3438, n=18) | |
| Ulefone Power 3 (Standardbrowser 7.1.1) | |
| Mozilla Kraken 1.1 - Total | |
| Ulefone Power 3 (Standardbrowser 7.1.1) | |
| Oukitel U18 (Chrome 65) | |
| Huawei Y7 2018 (Chrome 66) | |
| Average Qualcomm Snapdragon 430 (MSM8937) (10396 - 14709, n=18) | |
| Huawei Y7 (Chrome 60) | |
| Xiaomi Redmi 5 Plus (Chrome 66) | |
| Average of class Smartphone (257 - 28190, n=124, last 2 years) | |
| WebXPRT 2015 - Overall | |
| Xiaomi Redmi 5 Plus (Chrome 66) | |
| Huawei Y7 2018 (Chrome 66) | |
| Average Qualcomm Snapdragon 430 (MSM8937) (42 - 82, n=9) | |
| Huawei Y7 (Chrome 60) | |
| Ulefone Power 3 (Standardbrowser 7.1.1) | |
* ... smaller is better
The Y7 2018 performed well in our microSD card performance tests, finishing near the top of our comparison table. As usual, we tested the Y7 2018 with our reference microSD card, the Toshiba Exceria Pro M501.
It is a different story for internal memory performance though. While Huawei has made great strides compared to the Y7 2017’s internal memory performance, the Y7 2018 is still far behind most comparable devices.
| Huawei Y7 2018 | Huawei Y7 | Xiaomi Redmi 5 Plus | Oukitel U18 | Ulefone Power 3 | Average 16 GB eMMC Flash | Average of class Smartphone | |
|---|---|---|---|---|---|---|---|
| AndroBench 3-5 | -16% | 42% | 5% | 69% | -33% | 1915% | |
| Sequential Read 256KB (MB/s) | 256 | 119.4 -53% | 270 5% | 273.1 7% | 294.6 15% | 164.5 ? -36% | 2214 ? 765% |
| Sequential Write 256KB (MB/s) | 71.5 | 33.2 -54% | 194.5 172% | 109.2 53% | 214.9 201% | 43 ? -40% | 1894 ? 2549% |
| Random Read 4KB (MB/s) | 38.8 | 53.2 37% | 79.5 105% | 28.7 -26% | 61.4 58% | 21.7 ? -44% | 310 ? 699% |
| Random Write 4KB (MB/s) | 9.5 | 6.9 -27% | 7.1 -25% | 12.96 36% | 21.25 124% | 8.08 ? -15% | 356 ? 3647% |
| Sequential Read 256KB SDCard (MB/s) | 85 | 82.5 ? -3% | 84.4 -1% | 71.5 ? -16% | 81.8 ? -4% | 59.1 ? -30% | |
| Sequential Write 256KB SDCard (MB/s) | 61.5 | 62.6 ? 2% | 59.5 -3% | 47.02 ? -24% | 71.9 ? 17% | 39.8 ? -35% |
Games
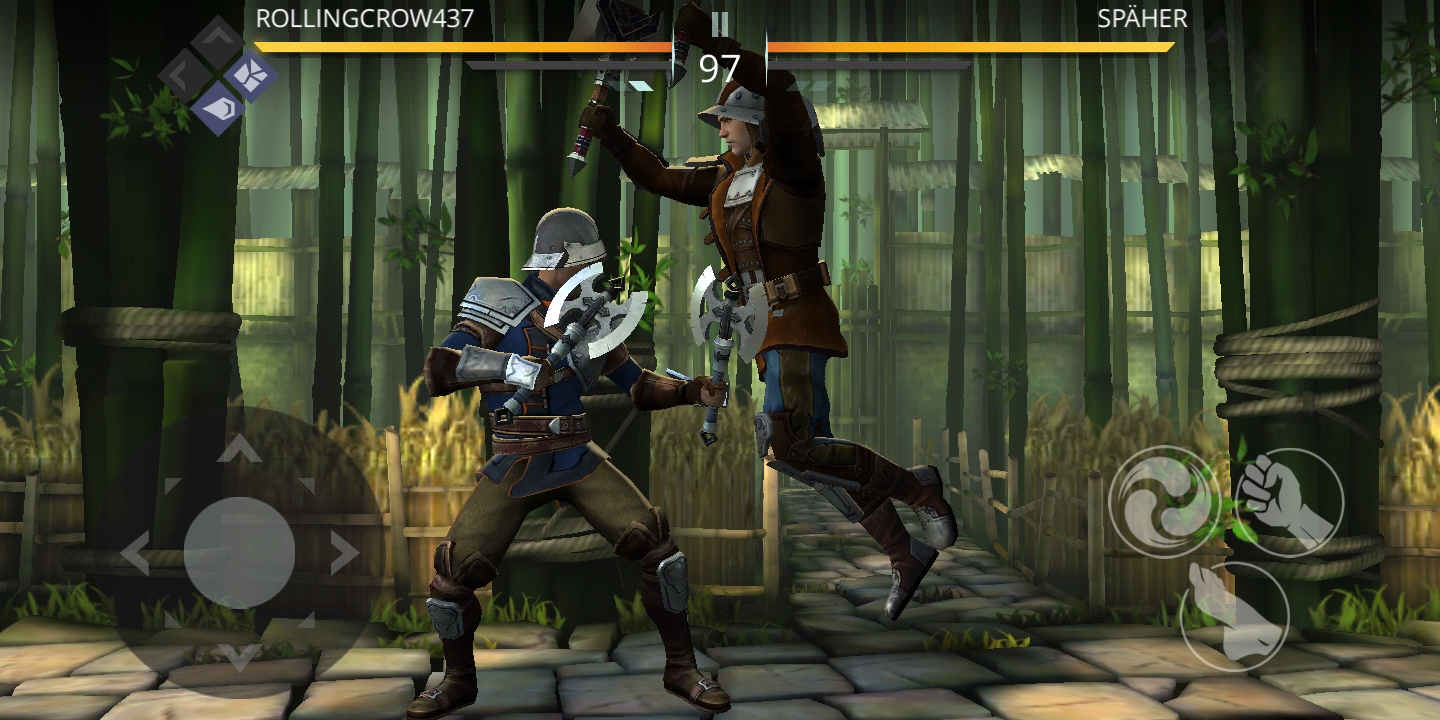
While the Y7 2018 can play complex 3D games, frame rates fluctuate wildly, and 60 FPS gaming is not possible. Our test device achieved a maximum of 47 FPS in Shadow Fight 3, but this regularly dropped below 30 FPS. Meanwhile, Arena of Valor averaged 30 FPS but regularly dropped below that.
Overall, the Y7 2018 is more suitable to play simpler games like Angry Birds.
The touchscreen and positional sensor worked well throughout our tests.
| Shadow Fight 3 | |||
| Settings | Value | ||
| high | 47 fps | ||
| minimal | 47 fps | ||
| Arena of Valor | |||
| Settings | Value | ||
| min | 31 fps | ||
| high HD | 30 fps | ||
Emissions
Temperature
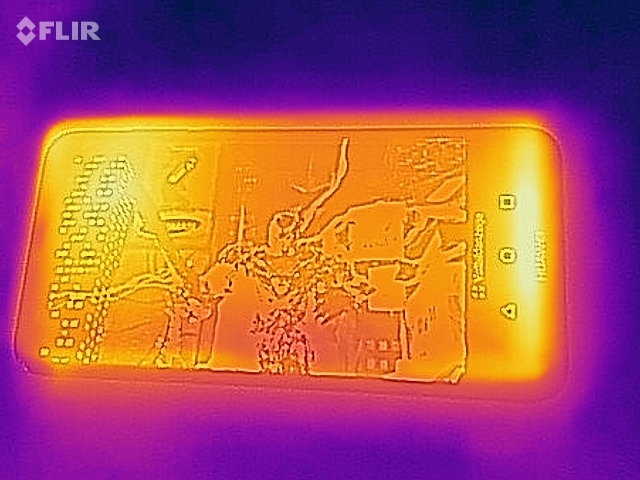
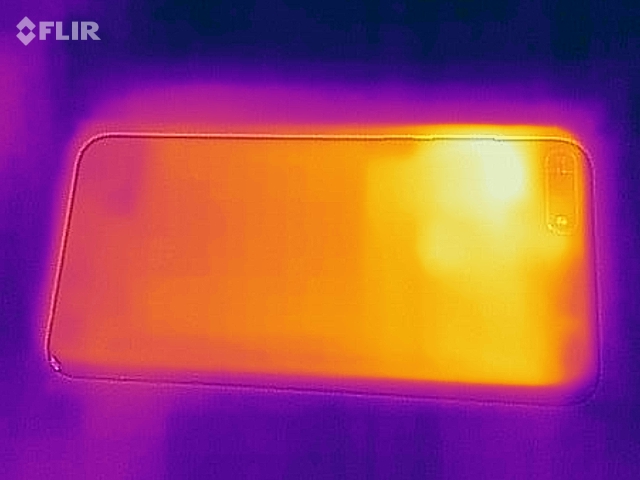
You should not expect any thermal throttling-related performance drops with the Y7 2018. Our test device performed consistently in GFXBench Manhattan 3.1, which we set to loop for 30 runs.
The Y7 2018 runs relatively warm at idle, with surface temperatures averaging 32.2 °C on the front and 31.5 °C on the rear. These marginally increase to 34.8 °C and 34.6 °C under load. The top third of the device gets the hottest, with the area around the camera reaching a maximum of 38.3 °C. None of these temperatures are worrisome though, so you should have no problems in daily use.
(+) The maximum temperature on the upper side is 37.9 °C / 100 F, compared to the average of 35.3 °C / 96 F, ranging from 21.9 to 247 °C for the class Smartphone.
(+) The bottom heats up to a maximum of 38.3 °C / 101 F, compared to the average of 34 °C / 93 F
(±) In idle usage, the average temperature for the upper side is 32.2 °C / 90 F, compared to the device average of 33 °C / 91 F.
Speakers
The Y7 2018 has a small mono speaker on the underside of the device. The speaker is quieter than the one in the Y7 (2017). While last year’s model reached 85.9 dB(A), the Y7 2018 can only manage 76.8 dB(A). The speaker produces an overall high-pitched sound as it lacks the same deep mid-frequencies that its predecessor could produce.
Fortunately, the speaker does not distort at maximum volume. Overall, the speaker is more suitable for casual listening like watching YouTube videos than for listening to music for extended periods of time.
Sound through the 3.5 mm jack is cleanly reproduced, as is the output via Bluetooth.
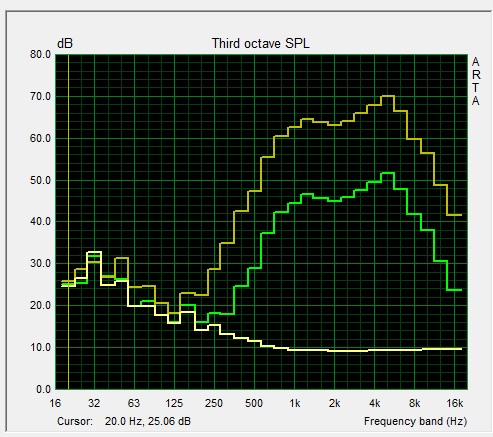
Huawei Y7 2018 audio analysis
(±) | speaker loudness is average but good (76.8 dB)
Bass 100 - 315 Hz
(-) | nearly no bass - on average 30.7% lower than median
(±) | linearity of bass is average (8.2% delta to prev. frequency)
Mids 400 - 2000 Hz
(±) | higher mids - on average 7.3% higher than median
(±) | linearity of mids is average (7.9% delta to prev. frequency)
Highs 2 - 16 kHz
(±) | higher highs - on average 9% higher than median
(+) | highs are linear (5.9% delta to prev. frequency)
Overall 100 - 16.000 Hz
(-) | overall sound is not linear (33.7% difference to median)
Compared to same class
» 84% of all tested devices in this class were better, 1% similar, 14% worse
» The best had a delta of 11%, average was 34%, worst was 134%
Compared to all devices tested
» 92% of all tested devices were better, 1% similar, 6% worse
» The best had a delta of 4%, average was 23%, worst was 134%
Huawei Y7 audio analysis
(+) | speakers can play relatively loud (85.9 dB)
Bass 100 - 315 Hz
(-) | nearly no bass - on average 32.9% lower than median
(+) | bass is linear (6.9% delta to prev. frequency)
Mids 400 - 2000 Hz
(±) | reduced mids - on average 5.9% lower than median
(+) | mids are linear (6.7% delta to prev. frequency)
Highs 2 - 16 kHz
(+) | balanced highs - only 4.1% away from median
(+) | highs are linear (4.9% delta to prev. frequency)
Overall 100 - 16.000 Hz
(±) | linearity of overall sound is average (23.2% difference to median)
Compared to same class
» 53% of all tested devices in this class were better, 7% similar, 40% worse
» The best had a delta of 11%, average was 34%, worst was 134%
Compared to all devices tested
» 70% of all tested devices were better, 5% similar, 25% worse
» The best had a delta of 4%, average was 23%, worst was 134%
Battery Life
Power Consumption
The Y7 2018 has slightly higher power consumption than its predecessor. Our test device draws a maximum of 5.7 W under load and a minimum of 0.9 W at idle, both of which are significantly higher than the Y7 (2017). The Y7 2018 is broadly on a par with our comparison devices and is slightly more efficient than equivalent Snapdragon 430-powered devices. Its idle minimum power draw is a bit on the high side though.
| Off / Standby | |
| Idle | |
| Load |
|
Key:
min: | |
| Huawei Y7 2018 3000 mAh | Huawei Y7 4000 mAh | Xiaomi Redmi 5 Plus 4000 mAh | Oukitel U18 4000 mAh | Ulefone Power 3 6080 mAh | Average Qualcomm Snapdragon 430 (MSM8937) | Average of class Smartphone | |
|---|---|---|---|---|---|---|---|
| Power Consumption | 28% | -18% | -59% | 23% | -1% | -18% | |
| Idle Minimum * (Watt) | 0.9 | 0.57 37% | 0.7 22% | 1.12 -24% | 0.79 12% | 0.918 ? -2% | 0.888 ? 1% |
| Idle Average * (Watt) | 1.9 | 1.61 15% | 2.8 -47% | 2.27 -19% | 1.82 4% | 2.01 ? -6% | 1.481 ? 22% |
| Idle Maximum * (Watt) | 2.3 | 1.62 30% | 3.4 -48% | 2.49 -8% | 1.87 19% | 2.28 ? 1% | 1.669 ? 27% |
| Load Average * (Watt) | 4.7 | 3.09 34% | 4.2 11% | 10.75 -129% | 2.7 43% | 3.97 ? 16% | 6.73 ? -43% |
| Load Maximum * (Watt) | 5.7 | 4.26 25% | 7.2 -26% | 12.39 -117% | 3.62 36% | 6.46 ? -13% | 11.2 ? -96% |
* ... smaller is better
Battery Life
The Y7 2018 has a 3,000 mAh battery. This is far smaller than last year’s model, which has a 4,000 mAh battery. Equally, the Y7 2018 has a smaller battery than all our comparison devices. This smaller battery capacity affects battery life, so the Y7 2018 cannot compete with the runtimes that its predecessor achieves. While the Y7 2018 lasted 10 h 24 m in our Wi-Fi battery life test, the Y7 (2017) lasted an extra 90 minutes. The Y7 2018 is competitive with our comparison devices despite having a smaller battery though. Our test device lasted two hours longer than the Xiaomi Redmi 5 Plus and only 15 minutes shorter than the Oukitel U18, both of which have 4,000 mAh batteries. The Y7 2018 is no match for the Ulefone Power 3 with its 6,080 mAh battery though, which lasted almost 23 hours in our Wi-Fi battery test.
The Y7 2018 should last for around two days on a single charge even with frequent use. The device will need charging more often if you use sophisticated apps, but with economical use, you can potentially even eke out three days between charges.
The Y7 2018 does not support quick charging despite support at SoC level. A full recharge takes well over two hours.
| Huawei Y7 2018 3000 mAh | Huawei Y7 4000 mAh | Xiaomi Redmi 5 Plus 4000 mAh | Oukitel U18 4000 mAh | Ulefone Power 3 6080 mAh | |
|---|---|---|---|---|---|
| Battery runtime | 35% | -20% | 3% | 120% | |
| Reader / Idle (h) | 21.8 | 31.9 46% | |||
| H.264 (h) | 11.5 | 13.5 17% | |||
| WiFi v1.3 (h) | 10.4 | 11.9 14% | 8.3 -20% | 10.7 3% | 22.9 120% |
| Load (h) | 4.1 | 6.7 63% |
Pros
Cons
Verdict
The Huawei Y7 2018 sounds like a good deal initially thanks to its modern design, relatively high-resolution front-facing camera and its low price. However, these positives are brought down by some drawbacks. Namely, the outdated Android security patches and a dark display.
However, the battery life is decent, workmanship is to a good standard and the GPS is accurate for a device at this price. Images are unexpectedly sharp too.
Equally, system performance is adequate for its class and the mono speaker is passable. The device stays relatively cool under load as well.
Frustratingly, the Y7 2018 does not better its predecessor in some areas. For example, the battery life is worse, the speaker is quieter, performance is the same and the modem is slower with support for fewer LTE bands.
The Huawei Y7 2018 is a solid choice for those who are looking for a smartphone with a large display without having to spend a lot of money.
The Y7 2018 is a cheap phablet that remains the best bang for its buck in its class, despite improvements made by the competition.
Huawei Y7 2018
- 05/30/2018 v6 (old)
Florian Wimmer
Price comparison

