Notebookcheck Logo

Qualcomm Snapdragon 730 vs Mediatek Helio G85

Qualcomm Snapdragon 730

► remove from comparison Qualcomm SD 730

The Qualcomm Snapdragon 730 (SD730 Mobile Platform) is a fast mid-range ARM-based SoC largely found on Android tablets and smartphones. It integrates eight cores (octa-core) divided into two clusters. A fast performance cluster contains two ARM Cortex-A76 cores clocked at up to 2.2 GHz and a power efficiency cluster with six small ARM Cortex-A55 cores at up to 1.8 GHz. Depending on the workload only single clusters or all cores can run at different clock speeds.

The chip includes a range of other features like a fast X15 LTE radio (800 Mbits Cat 15 download, 150 Mbps Cat 13 upload), one of the first Wi-Fi 6 wireless radios (802.11ax), satellite positioning (GPS, QZSS, GLONASS, SBAS, Beidou, Galileo), USB-C 3.1, Spectra 350 ISP, Hexagon 688 DSP, H.265 4K30 video en- and decode, an LPDDR4X-3733 dual-channel memory controller and a Adreno 618 Grafikkarte.

The Snapdragon 730 is manufactured in the modern 8 nm process at Samsung.

Mediatek Helio G85

► remove from comparison Mediatek Helio G85

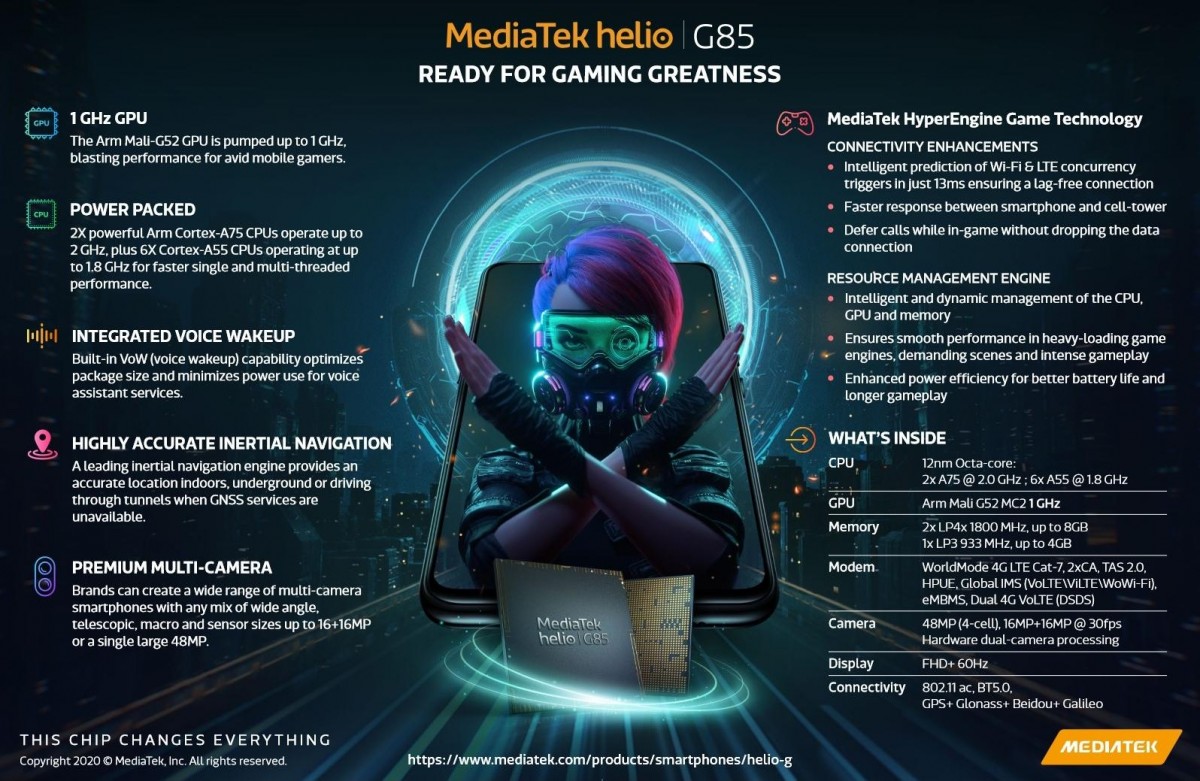
The Mediatek Helio G85 is a mainstream ARM SoC for smartphones (mainly Android based) that was introduced in 2020. It is manufactured in a 12 nm FinFET process and integrates 8 CPU cores. Two fast ARM Cortex-A75 cores with up to 2 GHz for performance tasks and six small ARM Cortex-A55 with up to 1.8 GHz for efficiency. All eight cores can be used together thanks to Heterogeneous Multi-Processing support. The integrated GPU is a ARM Mali-G52 MC2 (MP2) with two clusters at up to 1000 MHz (up from 950 MHz from the otherwise similar Helio G80). The SoC also integrates the HyperEngine that handles a dynamic management of CPU, GPU and memory.

The SoC integrates furthermore a LTE radio with Cat-7 (download) / Cat-13 (upload) support, Wifi 5 (ac), Bluetooth 5.0, LPDDR4x 1800 MHz and eMMC 5.1 storage.

ModelQualcomm Snapdragon 730Mediatek Helio G85
CodenameKryo 470 Gold / SilverCortex-A75 / A55
SeriesQualcomm SnapdragonMediatek Mediatek Helio G
Series: Mediatek Helio G Cortex-A75 / A55
Qualcomm Snapdragon 732G compare2.3 GHz8 / 8 cores Kryo 470 Gold / Silver
Qualcomm Snapdragon 730G compare2.2 GHz8 / 8 cores Kryo 470 Gold / Silver
Qualcomm Snapdragon 730 « 2.2 GHz8 / 8 cores Kryo 470 Gold / Silver
Mediatek Helio G88 compare1.8 - 2 GHz8 / 8 cores Cortex-A75 / A55
Mediatek Helio G85 « 1.8 - 2 GHz8 / 8 cores Cortex-A75 / A55
Mediatek Helio G81 Ultra compare2 - 2 GHz8 / 8 cores Cortex-A75 / A55
Mediatek Helio G81 compare1.7 - 2 GHz8 / 8 cores Cortex-A75 / A55
Mediatek Helio G80 compare2 GHz8 / 8 cores Cortex-A75 / A55
Mediatek Helio G70 compare2 GHz8 / 8 cores Cortex-A75 / A55
Clock2200 MHz1800 - 2000 MHz
Cores / Threads8 / 88 / 8
Technology7 nm12 nm
FeaturesAdreno 618 GPU, X15 LTE Modem, Hexagon 688 DSP, Specra ISP2x Cortex-A75, 6x Cortex-A55
iGPUQualcomm Adreno 618ARM Mali-G52 MP2 ( - 1000 MHz)
ArchitectureARMARM
Announced
Manufacturerwww.qualcomm.comwww.mediatek.com

Benchmarks

Performance Rating - Geekbench 5.5, PCM Work, Sling Shot Physics, Antutu v8 CPU - SD 730
0.6 pt (47%)
Restrict / Search: Model: Max. age: years
Performance Rating - Geekbench 5.5, PCM Work, Sling Shot Physics, Antutu v8 CPU - Helio G85
0.5 pt (37%)
Restrict / Search: Model: Max. age: years
3DMark - 3DMark Ice Storm Unlimited Physics
min: 19389     avg: 20581     median: 20518 (17%)     max: 21898 Points
min: 16484     avg: 17640     median: 17640 (15%)     max: 18796 Points
3DMark - 3DMark Sling Shot Extreme (ES 3.1) Unlimited Physics
min: 2827     avg: 3144     median: 3200.5 (30%)     max: 3349 Points
3DMark - 3DMark Sling Shot (ES 3.0) Unlimited Physics
min: 2702     avg: 3091     median: 3160.5 (36%)     max: 3339 Points
min: 2644     avg: 2697     median: 2684 (31%)     max: 2778 Points
Geekbench 6.4 - Geekbench 6.4 Single-Core
min: 366     avg: 399.6     median: 403 (10%)     max: 416 Points
Geekbench 6.4 - Geekbench 6.4 Multi-Core
min: 1251     avg: 1367     median: 1396 (5%)     max: 1449 Points
Geekbench 6.0 - Geekbench 6.0 Single-Core
min: 408     avg: 420     median: 423 (13%)     max: 429 Points
Geekbench 6.0 - Geekbench 6.0 Multi-Core
min: 1315     avg: 1375     median: 1368 (6%)     max: 1442 Points
Geekbench 5.5 - Geekbench 5.1 - 5.5 64 Bit Single-Core
min: 542     avg: 545     median: 545 (21%)     max: 548 Points
Geekbench 5.5 - Geekbench 5.1 - 5.5 64 Bit Multi-Core
min: 1647     avg: 1714     median: 1713.5 (3%)     max: 1780 Points
Geekbench 4.4 - Geekbench 4.1 - 4.4 64 Bit Single-Core
min: 2436     avg: 2482     median: 2481.5 (25%)     max: 2527 Points
1662 Points (17%)
Geekbench 4.4 - Geekbench 4.1 - 4.4 64 Bit Multi-Core
min: 6826     avg: 6849     median: 6848.5 (7%)     max: 6871 Points
5301 Points (5%)
Geekbench 4.0 - Geekbench 4.0 64 Bit Single-Core
100%
1 SD 730 +
2547 Points (28%)
Geekbench 4.0 - Geekbench 4.0 64 Bit Multi-Core
100%
1 SD 730 +
6900 Points (9%)
Geekbench 3 - Geekbench 3 64 Bit Multi-Core
100%
1 SD 730 +
6394 Points (10%)
Geekbench 3 - Geekbench 3 64 Bit Single-Core
100%
1 SD 730 +
2255 Points (34%)
Geekbench 2 - 32 Bit - Geekbench Stream
2024 Points (11%)
1369 Points (7%)
Geekbench 2 - 32 Bit - Geekbench Memory
2910 Points (20%)
2836 Points (20%)
Geekbench 2 - 32 Bit - Geekbench Floating Point
12535 Points (25%)
9944 Points (19%)
Geekbench 2 - 32 Bit - Geekbench Integer
5690 Points (11%)
4915 Points (10%)
Geekbench 2 - 32 Bit - Geekbench Total Score
7184 Points (19%)
5907 Points (15%)
Mozilla Kraken 1.1 - Kraken 1.1 Total Score *
min: 2564     avg: 2950     median: 2900.5 (3%)     max: 3436 ms
min: 2711.6     avg: 3334     median: 3466.5 (4%)     max: 3939 ms
Octane V2 - Octane V2 Total Score
min: 12771     avg: 15757     median: 16378.5 (12%)     max: 17501 Points
min: 10299     avg: 12959     median: 12745.5 (9%)     max: 15443 Points
WebXPRT 4 - WebXPRT 4 Score
min: 51     avg: 56     median: 58 (16%)     max: 59 Points
WebXPRT 3 - WebXPRT 3 Score
min: 60     avg: 73     median: 73 (13%)     max: 86 Points
min: 43     avg: 45.2     median: 45 (8%)     max: 47 Points
AnTuTu v6 - AnTuTu v6 Total Score
100%
1 SD 730 +
min: 159151     avg: 165335     median: 165334 (56%)     max: 171518 Points
AnTuTu v7 - AnTuTu v7 MEM
100%
1 SD 730 +
min: 8888     avg: 10565     median: 10565 (32%)     max: 12242 Points
AnTuTu v7 - AnTuTu v7 UX
100%
1 SD 730 +
min: 46382     avg: 48917     median: 48917 (60%)     max: 51452 Points
AnTuTu v7 - AnTuTu v7 GPU
100%
1 SD 730 +
min: 58434     avg: 60895     median: 60895 (19%)     max: 63356 Points
AnTuTu v7 - AnTuTu v7 CPU
100%
1 SD 730 +
min: 83960     avg: 86334     median: 86334 (53%)     max: 88708 Points
AnTuTu v7 - AnTuTu v7 Total Score
100%
1 SD 730 +
min: 202586     avg: 206711     median: 206711 (36%)     max: 210836 Points
AnTuTu v8 - AnTuTu v8 UX
min: 45188     avg: 47188     median: 47188 (39%)     max: 49188 Points
min: 33983     avg: 35191     median: 35191 (29%)     max: 36399 Points
AnTuTu v8 - AnTuTu v8 MEM
min: 45338     avg: 47601     median: 47601 (38%)     max: 49864 Points
min: 36589     avg: 37154     median: 37153.5 (30%)     max: 37718 Points
AnTuTu v8 - AnTuTu v8 GPU
min: 71379     avg: 72365     median: 72364.5 (13%)     max: 73350 Points
min: 34679     avg: 39134     median: 39134 (7%)     max: 43589 Points
AnTuTu v8 - AnTuTu v8 CPU
min: 80001     avg: 80569     median: 80568.5 (29%)     max: 81136 Points
min: 62320     avg: 62867     median: 62866.5 (23%)     max: 63413 Points
AnTuTu v8 - AnTuTu v8 Total Score
min: 247507     avg: 247692     median: 247692 (24%)     max: 247877 Points
min: 171116     avg: 174345     median: 174345 (17%)     max: 177574 Points
Antutu v9 - AnTuTu v9 Total Score
min: 191865     avg: 213512     median: 217448 (11%)     max: 231224 Points
Antutu v9 - AnTuTu v9 CPU
min: 62911     avg: 64321     median: 63851 (16%)     max: 66202 Points
Antutu v10 - AnTuTu v10 Total Score
min: 278813     avg: 280106     median: 280106 (9%)     max: 281399 Points
Antutu v10 - AnTuTu v10 CPU
min: 86841     avg: 88909     median: 88908.5 (3%)     max: 90976 Points
PassMark PerformanceTest Mobile V1 - PerformanceTest Mobile V1 CPU Tests
100%
1 SD 730 +
199625 Points (26%)
PCMark for Android - PCM f. Android Computer Vision
3837 Points (20%)
5692 Points (30%)
PCMark for Android - PCM f. Android Storage
0 Points (0%)
5697 Points (12%)
PCMark for Android - PCM f. Android Work Score 2.0
min: 7177     avg: 7599     median: 7653 (50%)     max: 7913 Points
min: 8655     avg: 8674     median: 8670 (57%)     max: 8698 Points
PCMark for Android - PCM f. Android Work Score
min: 8626     avg: 8909     median: 8967 (45%)     max: 9075 Points
min: 11421     avg: 11655     median: 11655 (58%)     max: 11889 Points
PCMark for Android - PCM f. Android Storage 2.0 random write internal
min: 18.9     avg: 29.8     median: 32.7 (22%)     max: 35 MB/s
PCMark for Android - PCM f. Android Storage 2.0 seq write internal
min: 199.8     avg: 222.2     median: 221 (6%)     max: 247 MB/s
PCMark for Android - PCM f. Android Storage 2.0 random read internal
min: 12.1     avg: 22.4     median: 24.3 (12%)     max: 28.9 MB/s
PCMark for Android - PCM f. Android Storage 2.0 seq read internal
min: 274     avg: 278.5     median: 277.5 (8%)     max: 285 MB/s
PCMark for Android - PCM f. Android Storage 2.0 score
min: 7835     avg: 12510     median: 12098.5 (5%)     max: 16308 Points
CrossMark - CrossMark Overall
min: 280     avg: 350.8     median: 369 (14%)     max: 394 Points
Power Consumption - Geekbench 5.5 Power Consumption 150cd *
min: 0     avg: 3.5     median: 3.7 (2%)     max: 6.28 Watt
Power Consumption - Idle Power Consumption 150cd 1min *
min: 0.839     avg: 1.4     median: 1.4 (2%)     max: 1.89 Watt

Average Benchmarks Qualcomm Snapdragon 730 → 100% n=23

Average Benchmarks Mediatek Helio G85 → 84% n=23

- Range of benchmark values for this graphics card
red legend - Average benchmark values for this graphics card
* Smaller numbers mean a higher performance
1 This benchmark is not used for the average calculation

Add one or more devices and compare

In the following list you can select (and also search for) devices that should be added to the comparison. You can select more than one device.

restrict list:
v1.33
log 07. 01:29:30

#0 ran 0s before starting gpusingle class +0s ... 0s

#1 checking url part for id 11431 +0s ... 0s

#2 checking url part for id 12751 +0s ... 0s

#3 redirected to Ajax server, took 1754522970s time from redirect:0 +0s ... 0s

#4 did not recreate cache, as it is less than 5 days old! Created at Wed, 06 Aug 2025 11:23:17 +0200 +0s ... 0s

#5 composed specs +0.005s ... 0.005s

#6 did output specs +0s ... 0.005s

#7 getting avg benchmarks for device 11431 +0.003s ... 0.008s

#8 got single benchmarks 11431 +0.007s ... 0.016s

#9 getting avg benchmarks for device 12751 +0.003s ... 0.019s

#10 got single benchmarks 12751 +0.019s ... 0.038s

#11 got avg benchmarks for devices +0s ... 0.038s

#12 No cached benchmark found, getting uncached values +0.028s ... 0.065s

#13 min, max, avg, median took s +0.005s ... 0.071s

#14 return log +0.001s ... 0.071s

Please share our article, every link counts!
Mail Logo
> Expert Reviews and News on Laptops, Smartphones and Tech Innovations > Benchmarks / Tech > Processor Comparison - Head 2 Head
Redaktion, 2017-09- 8 (Update: 2023-07- 1)