Notebookcheck Logo

Qualcomm Snapdragon 439 vs Allwinner A523

Qualcomm Snapdragon 439

► remove from comparison Qualcomm SD 439

The Qualcomm Snapdragon 439 (SD439) is a lower mainstream SoC for (Android based) smartphones and tablets. Compared to the older Snapdragon 435, the 439 is now manufactured in the current 12nm FinFET process and offers higher clock speeds of 2 GHz of the eight ARM Cortex-A53 cores (compared to 1.4 GHz). Wifi (now ac Wave 2 / Wifi 5) and Bluetooth (v5) were also updated, however the GPU still is the rather slow Adreno 505 and the LTE modem was even downgraded to a X6 with only Cat. 4/5 (max. 150 Mbps download, 75 Mbps upload).

Thanks to the higher maximum clock speed, the performance of the Snapdragon 439 mobile platform can reach the old Snapdragon 625 (also 2 GHz with 8x Cortex-A53). However, there is still a big gap to the SoCs with bigger performance cores.

Allwinner A523

► remove from comparison  A523

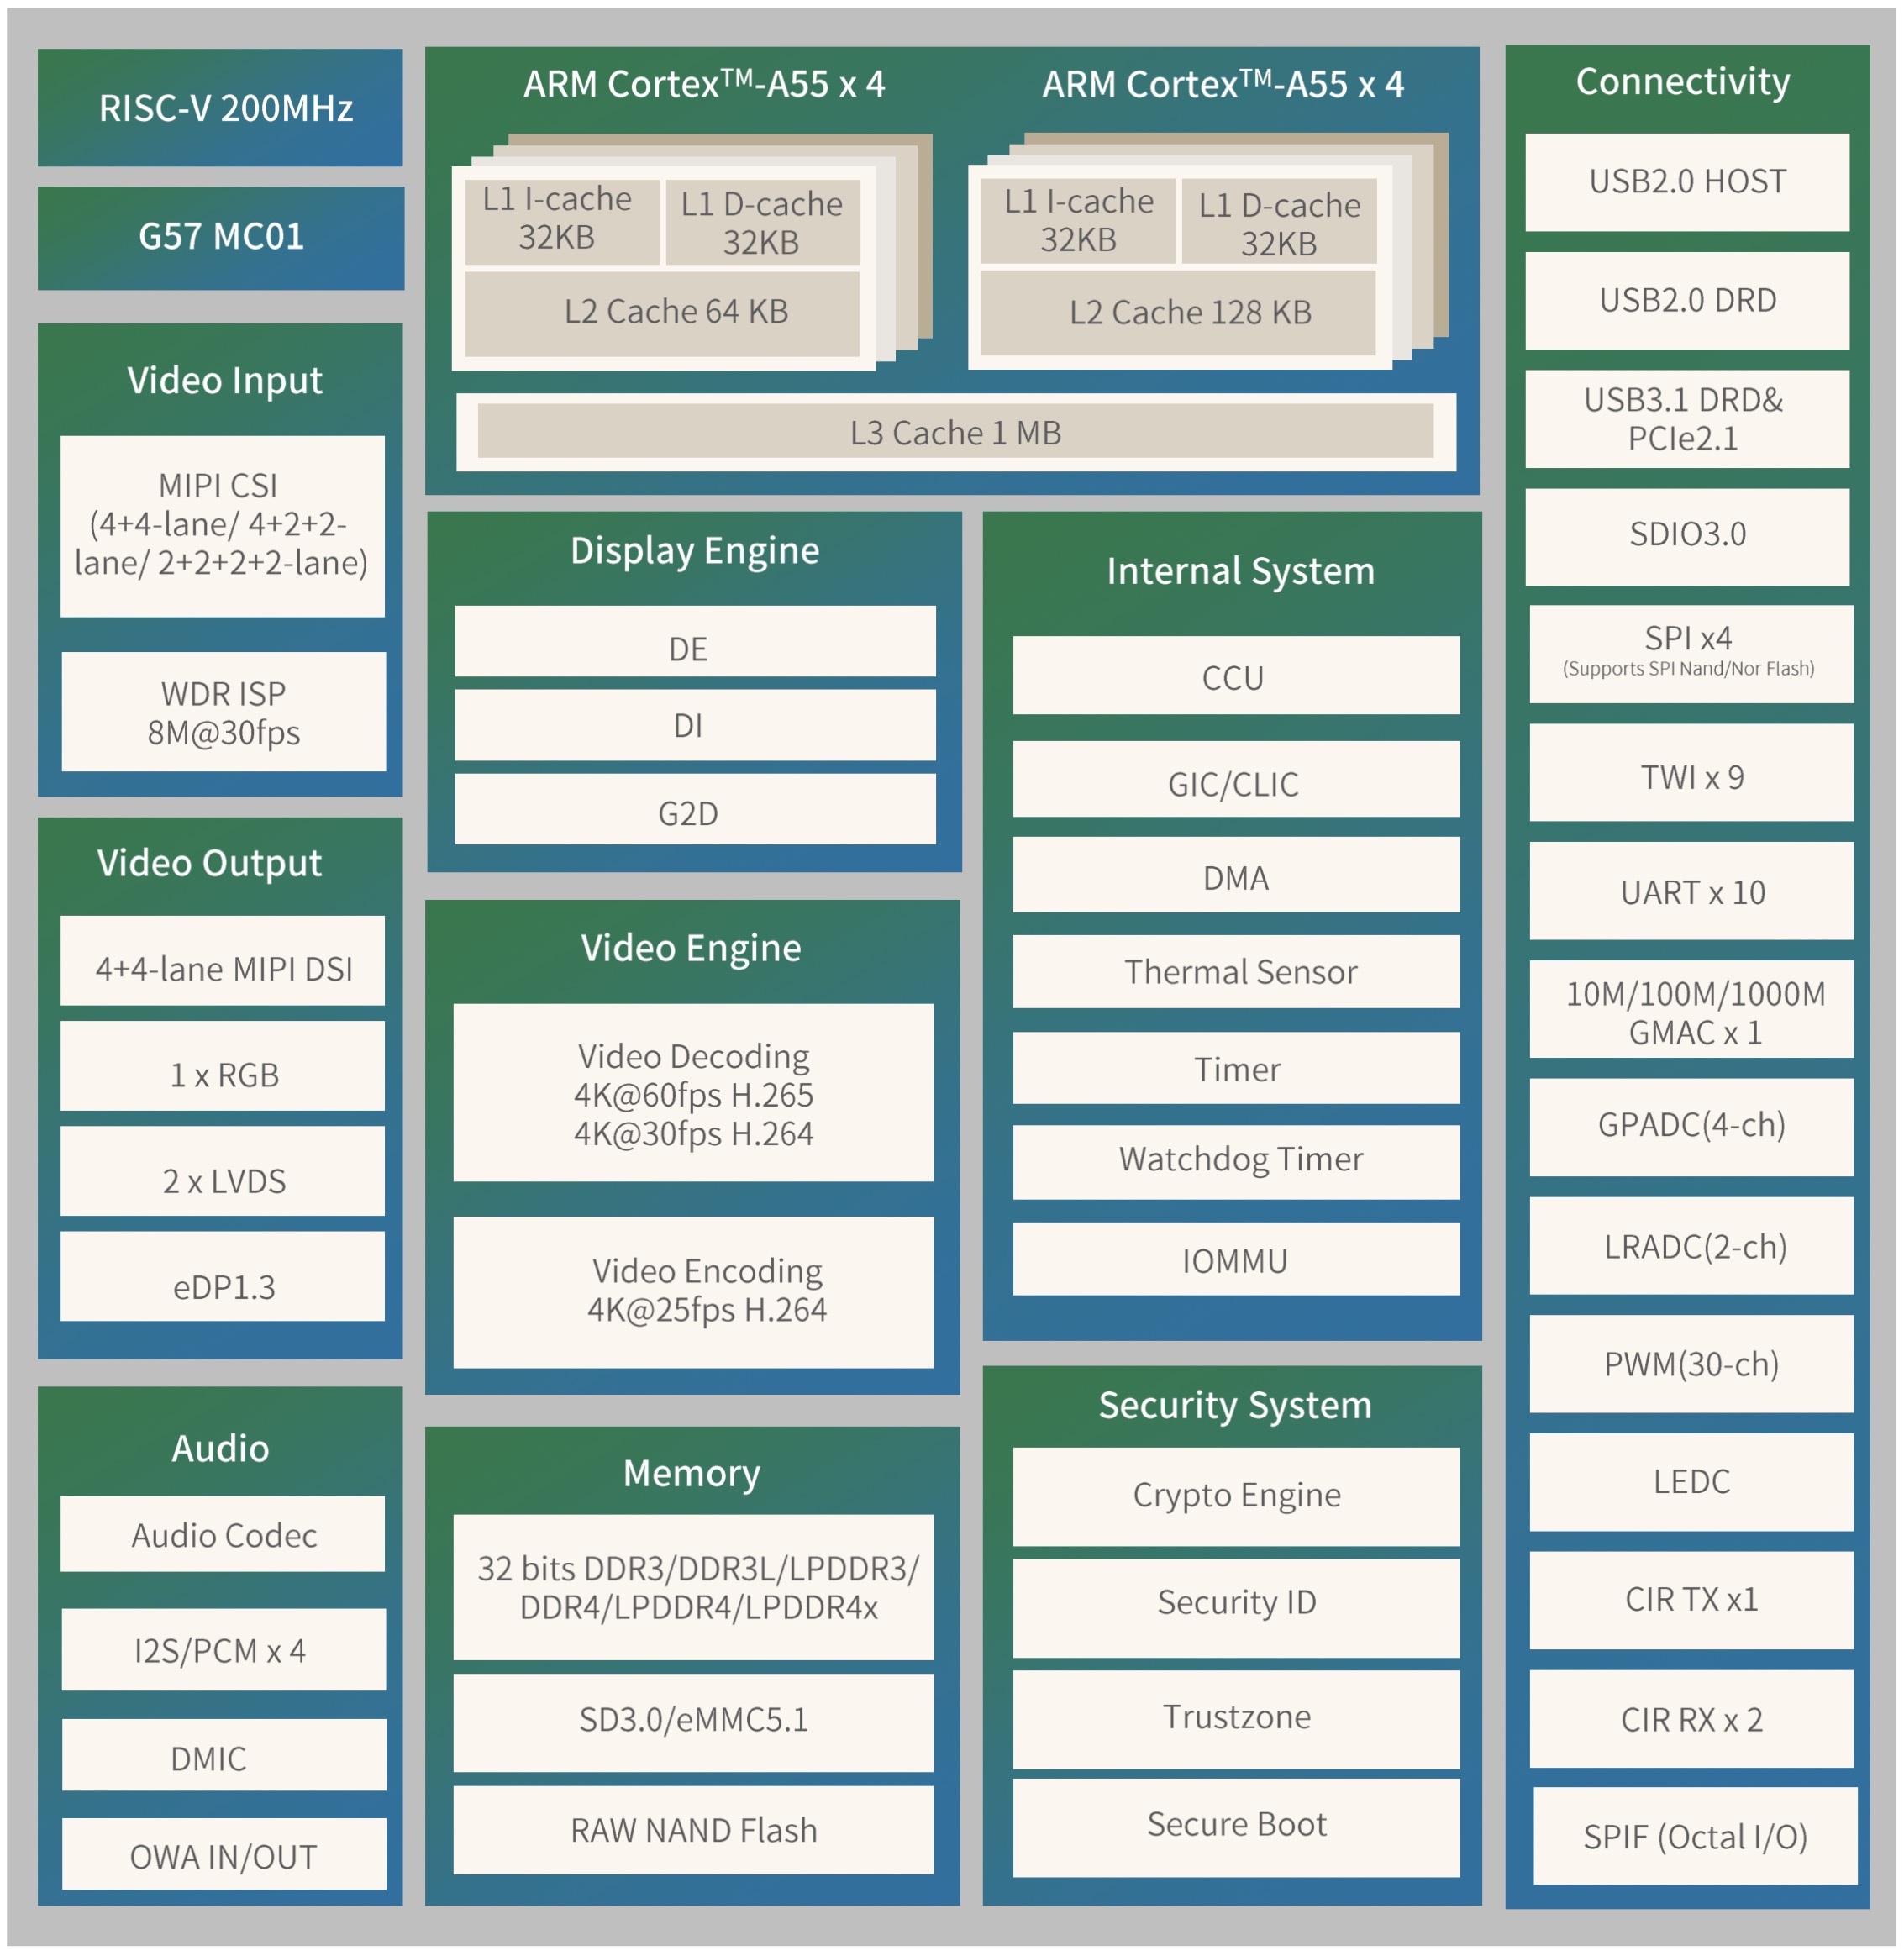
The Allwinner A523 is a very affordable ARM-based SoC for smartphones and tablets. The eight-core processor presented in 2023 consists of two quad-core clusters, each made up of 4 Cortex-A55 cores.

The faster quad cluster operates at a clock frequency of up to 1.8 GHz and offers 128 KB L2 cache per A55 core, while the second cluster clocks at up to 1.4 GHz and only offers 64 KB L2 cache per core.

In another version of the Allwinner A523, the first quad cluster clocks at up to 2.0 GHz. The ARM Mali-G57 MC1 is used as the graphics unit, which supports OpenGL 3.2, Vulkan 1.0 and OpenCL 2.0. A XuanTie E906 RISC-V PMU is also integrated.

The Allwinner SoC can control up to 4 GB DDR3/DDR4/LPDDR2/LPDDR3/LPDDR4/LPDDR4X RAM and eMMC 5.1 flash memory. In addition to PCIe 2.1, USB 3.1 Gen. 1 and Gigabit Ethernet are also supported as interfaces. There is also an H264/H265 video decoder (up to 4K at 60 frames per second) and an H264 encoder (up to 4K at 25 frames per second).

The Allwinner A523 is manufactured with a 22 nm structure width.

ModelQualcomm Snapdragon 439Allwinner A523
SeriesQualcomm Snapdragon
CodenameCortex-A53Cortex-A55
Series: Cortex-A55
Qualcomm Snapdragon 630 compare2.2 GHz8 / 8 cores Cortex-A53
Qualcomm Snapdragon 626 compare2.2 GHz8 / 8 cores Cortex-A53
Qualcomm Snapdragon 625 compare2 GHz8 / 8 cores Cortex-A53
Qualcomm Snapdragon 439 « 2 GHz8 / 8 cores Cortex-A53
Qualcomm Snapdragon 450 compare1.8 GHz8 / 8 cores Cortex-A53
Qualcomm Snapdragon 429 compare2 GHz4 / 4 cores Cortex-A53
Qualcomm Snapdragon 617 MSM8952 compare1.5 GHz8 / 8 cores Cortex-A53
Qualcomm Snapdragon 616 MSM8939v2 compare1.7 GHz8 / 8 cores Cortex-A53
Qualcomm Snapdragon 615 MSM8939 compare1.7 GHz8 / 8 cores Cortex-A53
Qualcomm Snapdragon 610 MSM8936 compare1.7 GHz4 / 4 cores Cortex-A53
Qualcomm Snapdragon 435 compare1.4 GHz8 / 8 cores Cortex-A53
Qualcomm Snapdragon 430 (MSM8937) compare1.4 GHz8 / 8 cores Cortex-A53
Qualcomm Snapdragon 415 MSM8929 compare1.4 GHz8 / 8 cores Cortex-A53
Qualcomm Snapdragon 425 (MSM8917) compare1.4 GHz4 / 4 cores Cortex-A53
Qualcomm Snapdragon 410 MSM8916 compare1.4 GHz4 / 4 cores Cortex-A53
Qualcomm Snapdragon 410 APQ8016 compare1.2 GHz4 / 4 cores Cortex-A53
Samsung Exynos 850 compare - 2 GHz8 / 8 cores Cortex-A55
Allwinner A523 « 0.48 - 2 GHz8 / 8 cores1 MB L3 Cortex-A55
UNISOC SC9863A compare1.2 - 1.6 GHz8 / 8 cores512 KB L3 Cortex-A55
Clock2000 MHz480 - 2000 MHz
Cores / Threads8 / 88 / 8
4 x 1.8 GHz ARM Cortex-A55
4 x 1.4 GHz ARM Cortex-A55
Technology12 nm22 nm
FeaturesAdreno 505 GPU, 802.11ac Wave 2WLAN, Bluetooth 5.0, X6 LTE Cat 4/5 (150 / 75 Mbps),H.264 4K25 Encoding, 4K30 decoding, H.265 4K60 decoding, 32 Bit LPDDR4x memory controller, SD 3.0 / eMMC 5.1, Trustzone, Secure Boot, Security ID, USB 3.1, PCIe 2.1, RISC-V 200 MHz
iGPUQualcomm Adreno 505ARM Mali-G57 MP1
ArchitectureARMARM
Announced
Manufacturerwww.qualcomm.comwww.allwinnertech.com
L1 Cache512 KB
L2 Cache768 KB
L3 Cache1 MB

Benchmarks

Performance Rating - Geekbench 5.5, PCM Work, Sling Shot Physics, Antutu v8 CPU - SD 439
0.3 pt (23%)
3DMark - 3DMark Ice Storm Unlimited Physics
100%
1 SD 439 +
min: 12096     avg: 12492     median: 12492.5 (11%)     max: 12809 Points
3DMark - 3DMark Sling Shot Extreme (ES 3.1) Unlimited Physics
min: 1500     avg: 1597     median: 1608 (19%)     max: 1657 Points
102%
A523 +
min: 1517     avg: 1645     median: 1645 (19%)     max: 1773 Points
3DMark - 3DMark Sling Shot (ES 3.0) Unlimited Physics
min: 1516     avg: 1588     median: 1598 (18%)     max: 1618 Points
118%
A523 +
1883 Points (22%)
Geekbench 6.2 - Geekbench 6.2 Single-Core
100%
1 A523 +
min: 227     avg: 229     median: 229 (7%)     max: 231 Points
Geekbench 6.2 - Geekbench 6.2 Multi-Core
100%
1 A523 +
min: 852     avg: 853     median: 853 (3%)     max: 854 Points
Geekbench 5.5 - Geekbench 5.1 - 5.4 64 Bit Single-Core
176 Points (7%)
min: 167     avg: 169     median: 169 (7%)     max: 171 Points
Geekbench 5.5 - Geekbench 5.1 - 5.4 64 Bit Multi-Core
823 Points (1%)
min: 778     avg: 797     median: 796.5 (1%)     max: 815 Points
Geekbench 5.0 - Geekbench 5.0 64 Bit Single-Core
min: 176     avg: 176.7     median: 177 (1%)     max: 177 Points
171 Points (1%)
Geekbench 5.0 - Geekbench 5.0 64 Bit Multi-Core
min: 809     avg: 819     median: 812 (3%)     max: 836 Points
600 Points (2%)
Geekbench 4.4 - Geekbench 4.1 - 4.4 64 Bit Single-Core
min: 863     avg: 880     median: 877.5 (9%)     max: 903 Points
min: 853     avg: 865     median: 865 (9%)     max: 877 Points
Geekbench 4.4 - Geekbench 4.1 - 4.4 64 Bit Multi-Core
min: 2987     avg: 3141     median: 3154 (3%)     max: 3267 Points
min: 2498     avg: 2942     median: 2941.5 (3%)     max: 3385 Points
Geekbench 4.0 - Geekbench 4.0 64 Bit Single-Core
863 Points (12%)
827 Points (11%)
Geekbench 4.0 - Geekbench 4.0 64 Bit Multi-Core
3218 Points (8%)
2451 Points (6%)
Geekbench 3 - Geekbench 3 64 Bit Multi-Core
3636 Points (6%)
3276 Points (5%)
Geekbench 3 - Geekbench 3 64 Bit Single-Core
792 Points (12%)
122%
A523 +
965 Points (14%)
Geekbench 2 - 32 Bit - Geekbench Stream
100%
1 SD 439 +
712 Points (6%)
Geekbench 2 - 32 Bit - Geekbench Memory
100%
1 SD 439 +
1563 Points (14%)
Geekbench 2 - 32 Bit - Geekbench Floating Point
100%
1 SD 439 +
5986 Points (12%)
Geekbench 2 - 32 Bit - Geekbench Integer
100%
1 SD 439 +
3444 Points (7%)
Geekbench 2 - 32 Bit - Geekbench Total Score
100%
1 SD 439 +
3684 Points (10%)
Mozilla Kraken 1.1 - Kraken 1.1 Total Score *
min: 9768     avg: 9963     median: 9952.5 (12%)     max: 10143 ms
102%
A523 +
min: 8641.2     avg: 8707     median: 8706.8 (10%)     max: 8772.4 ms
Octane V2 - Octane V2 Total Score
min: 4512     avg: 4731     median: 4755.5 (4%)     max: 4958 Points
129%
A523 +
min: 5911     avg: 6113     median: 6112.5 (5%)     max: 6314 Points
WebXPRT 4 - WebXPRT 4 Score
100%
1 A523 +
min: 26     avg: 28     median: 28 (8%)     max: 30 Points
WebXPRT 3 - WebXPRT 3 Score
min: 32     avg: 35.2     median: 35.5 (7%)     max: 38 Points
115%
A523 +
41 Points (9%)
AnTuTu v6 - AnTuTu v6 Total Score
100%
1 SD 439 +
min: 59539     avg: 60585     median: 60585 (21%)     max: 61631 Points
AnTuTu v7 - AnTuTu v7 MEM
100%
1 SD 439 +
min: 4849     avg: 5390     median: 5051 (16%)     max: 6271 Points
AnTuTu v7 - AnTuTu v7 UX
100%
1 SD 439 +
min: 19841     avg: 21900     median: 22846 (28%)     max: 23014 Points
AnTuTu v7 - AnTuTu v7 GPU
100%
1 SD 439 +
min: 12224     avg: 12439     median: 12514 (4%)     max: 12579 Points
AnTuTu v7 - AnTuTu v7 CPU
100%
1 SD 439 +
min: 37733     avg: 37810     median: 37769 (23%)     max: 37928 Points
AnTuTu v7 - AnTuTu v7 Total Score
100%
1 SD 439 +
min: 75175     avg: 77540     median: 77652 (14%)     max: 79792 Points
AnTuTu v8 - AnTuTu v8 UX
100%
1 SD 439 +
min: 6969     avg: 12860     median: 13894 (12%)     max: 16684 Points
AnTuTu v8 - AnTuTu v8 MEM
100%
1 SD 439 +
min: 27672     avg: 29440     median: 29676.5 (24%)     max: 30734 Points
AnTuTu v8 - AnTuTu v8 GPU
100%
1 SD 439 +
min: 9258     avg: 10049     median: 10067 (2%)     max: 10803 Points
AnTuTu v8 - AnTuTu v8 CPU
100%
1 SD 439 +
min: 40746     avg: 41220     median: 41221.5 (15%)     max: 41690 Points
AnTuTu v8 - AnTuTu v8 Total Score
100%
1 SD 439 +
min: 84645     avg: 93569     median: 95218 (9%)     max: 99193 Points
Antutu v9 - AnTuTu v9 Total Score
100%
1 A523 +
min: 126757     avg: 131411     median: 131411 (8%)     max: 136065 Points
Antutu v9 - AnTuTu v9 CPU
100%
1 A523 +
min: 34895     avg: 37521     median: 37521 (10%)     max: 40147 Points
PassMark PerformanceTest Mobile V1 - PerformanceTest Mobile V1 CPU Tests
105520 Points (14%)
2085 Points (0%)
PCMark for Android - PCM f. Android Computer Vision
100%
1 SD 439 +
min: 2490     avg: 2557     median: 2556.5 (14%)     max: 2623 Points
PCMark for Android - PCM f. Android Storage
100%
1 SD 439 +
min: 4775     avg: 5213     median: 5212.5 (11%)     max: 5650 Points
PCMark for Android - PCM f. Android Work Score 2.0
100%
1 SD 439 +
min: 4412     avg: 4632     median: 4643.5 (30%)     max: 4791 Points
PCMark for Android - PCM f. Android Work Score
100%
1 SD 439 +
min: 5880     avg: 6095     median: 6115 (31%)     max: 6228 Points
PCMark for Android - PCM f. Android Storage 2.0 random write internal
100%
1 A523 +
8.6 MB/s (6%)
PCMark for Android - PCM f. Android Storage 2.0 seq write internal
100%
1 A523 +
87.8 MB/s (3%)
PCMark for Android - PCM f. Android Storage 2.0 random read internal
100%
1 A523 +
13 MB/s (16%)
PCMark for Android - PCM f. Android Storage 2.0 seq read internal
100%
1 A523 +
127.1 MB/s (4%)
PCMark for Android - PCM f. Android Storage 2.0 score
100%
1 A523 +
7006 Points (11%)
PCMark for Android - PCM f. Android Work Score 3.0
100%
1 A523 +
min: 5224     avg: 5487     median: 5486.5 (25%)     max: 5749 Points
CrossMark - CrossMark Overall
100%
1 A523 +
227 Points (9%)
Power Consumption - Geekbench 5.5 Power Consumption 150cd *
100%
1 A523 +
5.8 Watt (3%)
Power Consumption - Idle Power Consumption 150cd 1min *
100%
1 A523 +
1.2 Watt (1%)

Average Benchmarks Qualcomm Snapdragon 439 → 100% n=16

Average Benchmarks Allwinner A523 → 94% n=16

- Range of benchmark values for this graphics card
- Average benchmark values for this graphics card
* Smaller numbers mean a higher performance
1 This benchmark is not used for the average calculation

Add one or more devices and compare

In the following list you can select (and also search for) devices that should be added to the comparison. You can select more than one device.

restrict list:

show all (including archived), 2024, 2023
v1.26
log 11. 06:50:48

#0 checking url part for id 11405 +0s ... 0s

#1 checking url part for id 17339 +0s ... 0s

#2 not redirecting to Ajax server +0s ... 0s

#3 did not recreate cache, as it is less than 5 days old! Created at Fri, 10 May 2024 05:37:21 +0200 +0.001s ... 0.001s

#4 composed specs +0.051s ... 0.052s

#5 did output specs +0s ... 0.053s

#6 getting avg benchmarks for device 11405 +0.015s ... 0.067s

#7 got single benchmarks 11405 +0.02s ... 0.088s

#8 getting avg benchmarks for device 17339 +0.003s ... 0.09s

#9 got single benchmarks 17339 +0.009s ... 0.1s

#10 got avg benchmarks for devices +0s ... 0.1s

#11 min, max, avg, median took s +0.149s ... 0.248s

#12 return log +0.024s ... 0.272s

Please share our article, every link counts!
> Expert Reviews and News on Laptops, Smartphones and Tech Innovations > Benchmarks / Tech > Processor Comparison - Head 2 Head
Redaktion, 2017-09- 8 (Update: 2023-07- 1)