Review Intel HD Graphics 4600

For the original German review, see here.
Intel IGPs have never been considered suitable for 3D applications and games until recently. The users have been plagued by very low performance with poor driver support making it virtually impossible to play any of the newer games with acceptable graphics quality and framerates.
Things have changed in the last two generations of processors. The introduction of HD Graphics 3000 in the Sandy Bridge architecture was a giant leap from the anemic GPUs in the pre-Arrandale period. This solution was still plagued by poor support for newer graphics technologies. HD Graphics 4000 was another giant leap forward that brought the possibility of gaming. Performance was found to near the lower mid-level discrete solutions from AMD and Nvidia but couldn’t match the IGPs of the best AMD APUs.
With Haswell, Intel tries to take the performance gains another step forward. The best configuration called "GT3e" does not only feature 2.5 times the shader units of the HD 4000, but also an additional eDRAM cache which should decrease the heavy dependence from the RAM interface. However, only the high-end Core i7-4850HQ and i7-4950HQ do use it so far.
We reviewed the "GT2" middle configuration called HD Graphics 4600 which will be used in all quad core CPUs of the MQ series and will focus on its graphics performance in this article. All technical details of the Haswell generation of CPUs and the benchmarks are summarized in a dedicated article for you:
The test system
We used the same test system for benchmarking the HD 4600 as for our CPU measurements in the article about the Haswell architecture. We configured the Schenker W503 (Clevo P150SM barebone) with a Core i7-4930MX, whose graphics unit clocks at 1.35 GHz. Other quad core CPUs with lower GPU clocks or smaller L3 cache will perform slightly worse. In order to also assess the performance of these models, we repeated the synthetic tests with the Core i7-4900MQ (1.3 GHz, 8 MB) and the Core i7-4700MQ (1.15 GHz, 6 MB).
In addition, the test system featured 2x 4 GB DDR3-1600 RAM, a 128 GB mSATA SSD from Samsung, and a 180 W power adapter with sufficient capacity. We deactivated the built-in GeForce GTX 765M in favor of the integrated HD Graphics 4600.
If you are interested in more information about the notebook, the benchmarks with dedicated graphics card, etc., you should take a look at our in-depth review:
Test configuration:
- Intel Core i7 quad core CPUs "Haswell"
- Intel HM87 chip set
- HD Graphics 4600 (driver 9.18.10.3071)
- 2x 4 GB Micron DDR3-1600 RAM (CL11)
- Samsung SSD PM841 (mSATA, 128 GB)
- 180 W power adapter
- Windows 8 Enterprise 64 Bit
Unfortunately, we could not run all benchmarks on other competing devices due to time constraints. So, we used the results of the following notebooks from our database:
- AMD Pumori Reference Design, A10-4600M, Radeon HD 7660G, 2x 4 GB DDR3-1600, Samsung SSD 830, Windows 7 64 Bit, Driver Catalyst 12.7 - 13.5
- One M73-2N, Core i7-3820QM, HD Graphics 4000, 4x 4 GB DDR3-1600, Crucial M4 SSD, Windows 7 64 Bit, Driver 8.15.10.2639
- Schenker XMG P502, Core i7-3610QM, HD Graphics 4000, 2x 4 GB DDR3-1600, Intel SSD 320, Windows 7 64 Bit, Driver 9.18.10.3071
- Asus N56VM, Core i7-3720QM, HD Graphics 4000, 2x 4 GB DDR3-1600, Seagate Momentus 7200.5, Windows 7 64 Bit, Driver 8.15.10.2696 - 9.17.10.2932
- Asus N56VM, Core i7-3720QM, GeForce GT 630M, 2x 4 GB DDR3-1600, Seagate Momentus 7200.5, Windows 7 64 Bit, Driver 296.35 - 320.14
- HP Envy dv7-7202eg, Core i7-3630QM, GeForce GT 630M, 4 + 8 GB DDR3-1600, Hitachi Travelstar 5K750, Windows 7 64 Bit, Driver 306.97
We apologize for the rather old driver versions on some of the devices. Please, consider the results of the devices up for comparison only as reference points.
Synthetic benchmarks
| 3DMark - 1920x1080 Fire Strike Graphics (sort by value) | |
| HD Graphics 4600 (1.35 GHz) | |
| HD Graphics 4600 (1.30 GHz) | |
| HD Graphics 4600 (1.15 GHz) | |
| HD Graphics 4000 | |
| GeForce GT 630M | |
| 3DMark 11 - 1280x720 Performance GPU (sort by value) | |
| HD Graphics 4600 (1.35 GHz) | |
| HD Graphics 4600 (1.30 GHz) | |
| HD Graphics 4600 (1.15 GHz) | |
| Radeon HD 7660G | |
| HD Graphics 4000 | |
| GeForce GT 630M | |
| 3DMark Vantage - 1280x1024 P GPU no PhysX (sort by value) | |
| HD Graphics 4600 (1.35 GHz) | |
| HD Graphics 4600 (1.30 GHz) | |
| HD Graphics 4600 (1.15 GHz) | |
| Radeon HD 7660G | |
| HD Graphics 4000 | |
| GeForce GT 630M | |
| 3DMark 06 - 1280x1024 Standard Score AA:0x AF:0x (sort by value) | |
| HD Graphics 4600 (1.35 GHz) | |
| HD Graphics 4600 (1.30 GHz) | |
| HD Graphics 4600 (1.15 GHz) | |
| Radeon HD 7660G | |
| HD Graphics 4000 | |
| GeForce GT 630M | |
Apart from the older 3DMark 06, the fastest version of the HD Graphics 4600 wins all synthetic benchmarks. The slightly lower clocked models whose performance difference conforms to the difference in the clock rate, the GeForce GT 630M and the Radeon HD 7660G are close behind. The maximum performance difference of all GPUs is about 20 percent which is a relatively small difference.
The HD Graphics 4000 of the Ivy-Bridge generation lags slightly behind and is the slowest in all four tests. In the 3DMark11, the new HD 4600 is a whopping 80 percent faster than its predecessor, while its performance gain is significantly lower in the other 3DMark benchmarks. Apparently, the 2011 benchmarks run particularly on the Haswell GPU.
Gaming benchmarks
However, synthetic benchmarks like the 3DMark series are hardly appropriate for a realistic evaluation of the performance. Unfortunately special "driver" optimizations are usually used here. Therefore, we tested a selection of the latest games available.
For better overview, we only tested two detail settings. The frame rates of other configurations are listed in a table at the end of this section and are available in our articles dedicated to each graphics card in our database.
| Battlefield 3 | |
| 1024x768 low AA:- AF:2x (sort by value) | |
| HD Graphics 4600 | |
| Radeon HD 7660G | |
| HD Graphics 4000 | |
| GeForce GT 630M | |
| 1366x768 medium AA:- AF:4x (sort by value) | |
| HD Graphics 4600 | |
| Radeon HD 7660G | |
| HD Graphics 4000 | |
| GeForce GT 630M | |
| The Elder Scrolls V: Skyrim | |
| 1280x720 Low Preset (sort by value) | |
| HD Graphics 4600 | |
| Radeon HD 7660G | |
| HD Graphics 4000 | |
| GeForce GT 630M | |
| 1366x768 Medium Preset AA:4x (sort by value) | |
| HD Graphics 4600 | |
| Radeon HD 7660G | |
| HD Graphics 4000 | |
| GeForce GT 630M | |
| Anno 2070 | |
| 1366x768 Medium Preset AA:on (sort by value) | |
| HD Graphics 4600 | |
| Radeon HD 7660G | |
| HD Graphics 4000 | |
| GeForce GT 630M | |
| 1366x768 High Preset AA:on AF:2x (sort by value) | |
| HD Graphics 4600 | |
| Radeon HD 7660G | |
| HD Graphics 4000 | |
| GeForce GT 630M | |
| Sleeping Dogs | |
| 1024x768 Low Preset AA:Normal (sort by value) | |
| HD Graphics 4600 | |
| Radeon HD 7660G | |
| HD Graphics 4000 | |
| GeForce GT 630M | |
| 1366x768 Medium Preset AA:Normal (sort by value) | |
| HD Graphics 4600 | |
| Radeon HD 7660G | |
| HD Graphics 4000 | |
| GeForce GT 630M | |
| Counter-Strike: GO | |
| 1366x768 Medium (sort by value) | |
| HD Graphics 4600 | |
| HD Graphics 4000 | |
| GeForce GT 630M | |
| 1366x768 High AA:2x MS AF:4x (sort by value) | |
| HD Graphics 4600 | |
| Radeon HD 7660G | |
| HD Graphics 4000 | |
| GeForce GT 630M | |
| Dishonored | |
| 1366x768 Medium / Off, FOV: 75 (sort by value) | |
| HD Graphics 4600 | |
| Radeon HD 7660G | |
| HD Graphics 4000 | |
| GeForce GT 630M | |
| 1366x768 High / On, FOV: 75 AA:FX (sort by value) | |
| HD Graphics 4600 | |
| Radeon HD 7660G | |
| HD Graphics 4000 | |
| GeForce GT 630M | |
| Call of Duty: Black Ops 2 | |
| 1366x768 Medium / Off (sort by value) | |
| HD Graphics 4600 | |
| Radeon HD 7660G | |
| HD Graphics 4000 | |
| GeForce GT 630M | |
| 1366x768 High / On, FXAA AA:2xMS (sort by value) | |
| HD Graphics 4600 | |
| Radeon HD 7660G | |
| HD Graphics 4000 | |
| GeForce GT 630M | |
| Dead Space 3 | |
| 1366x768 Medium Preset (sort by value) | |
| HD Graphics 4600 | |
| Radeon HD 7660G | |
| HD Graphics 4000 | |
| GeForce GT 630M | |
| 1366x768 High Preset (sort by value) | |
| HD Graphics 4600 | |
| Radeon HD 7660G | |
| HD Graphics 4000 | |
| GeForce GT 630M | |
| Crysis 3 | |
| 1024x768 Low Preset (sort by value) | |
| HD Graphics 4600 | |
| Radeon HD 7660G | |
| HD Graphics 4000 | |
| GeForce GT 630M | |
| 1366x768 Medium Preset AF:16x (sort by value) | |
| HD Graphics 4600 | |
| Radeon HD 7660G | |
| GeForce GT 630M | |
| BioShock Infinite | |
| 1280x720 Very Low Preset (sort by value) | |
| HD Graphics 4600 | |
| Radeon HD 7660G | |
| HD Graphics 4000 | |
| GeForce GT 630M | |
| 1366x768 Medium Preset (sort by value) | |
| HD Graphics 4600 | |
| Radeon HD 7660G | |
| HD Graphics 4000 | |
| GeForce GT 630M | |
| Metro: Last Light | |
| 1024x768 Low (DX10) AF:4x (sort by value) | |
| HD Graphics 4600 | |
| Radeon HD 7660G | |
| HD Graphics 4000 | |
| GeForce GT 630M | |
| 1366x768 Medium (DX10) AF:4x (sort by value) | |
| HD Graphics 4600 | |
| Radeon HD 7660G | |
| HD Graphics 4000 | |
| GeForce GT 630M | |
| low | med. | high | ultra | |
|---|---|---|---|---|
| Battlefield 3 (2011) | 32.4 | 22.7 | 18.6 | 6.7 |
| The Elder Scrolls V: Skyrim (2011) | 51.1 | 24.2 | 13.8 | 7.3 |
| Anno 2070 (2011) | 92.3 | 42.1 | 25.4 | 11.4 |
| Diablo III (2012) | 82.2 | 50.3 | 42.6 | 26.5 |
| Sleeping Dogs (2012) | 45.5 | 32.8 | 12.6 | 6.5 |
| Counter-Strike: GO (2012) | 186.9 | 99.2 | 55.5 | 28.3 |
| Dishonored (2012) | 57.9 | 43.8 | 38.5 | 19.7 |
| Call of Duty: Black Ops 2 (2012) | 62 | 40.9 | 17.5 | 10.6 |
| Dead Space 3 (2013) | 101.2 | 41.9 | 31.4 | 17.4 |
| Crysis 3 (2013) | 30.4 | 19.3 | 13.5 | 4.7 |
| BioShock Infinite (2013) | 57 | 25.7 | 21.8 | 7 |
| Metro: Last Light (2013) | 34 | 23.7 | 13.2 | 6.6 |
First of all, Intel's driver developers deserve praise. All tested benchmarks ran without graphics errors, stability problems, or other abnormalities. This could not always be taken for granted in the past.
We really liked the performance of the HD Graphics 4600. All benchmarks considered, the GPU is, on average, nearly 40% faster than the HD Graphics 4000. To be fair, we have to admit that the slightly lower clock rates of the HD 4000 models in our comparison, and different driver versions have some impact on the result.
Haswell was supposed to make a statement displaying its new prowess in the highly anticipated battle with the AMD APUs. But it was not able to come out of the tussle as the clear victor. The differences are very small. At high graphics settings (which are not always playable) the Radeon HD 7660G is slightly faster than the HD 4600, while the Intel solution performs better with low details and resolutions. This is caused by the significantly slower CPU part of the A10-4600M which sometimes slows down the graphics performance.
The HD 4600 cannot keep up with most dedicated graphics cards. Even the older GeForce GT 630M card’s performance is significantly better in most games. Only GT3 solutions with double the shader units and additional eDRAM-Cache (GT3e) can reach a higher performance level.
GPGPU Performance
| LuxMark v2.0 64Bit | |
| Room GPUs-only (sort by value) | |
| HD Graphics 4600 | |
| Radeon HD 7660G | |
| HD Graphics 4000 (Desktop) | |
| GeForce GT 630M | |
| Sala GPUs-only (sort by value) | |
| HD Graphics 4600 | |
| Radeon HD 7660G | |
| HD Graphics 4000 (Desktop) | |
| GeForce GT 630M | |
| ComputeMark v2.1 | |
| 1024x600 Normal, QJuliaRayTrace (sort by value) | |
| HD Graphics 4600 | |
| Radeon HD 7660G | |
| HD Graphics 4000 (Desktop) | |
| GeForce GT 630M | |
| 1024x600 Normal, Mandel Scalar (sort by value) | |
| HD Graphics 4600 | |
| Radeon HD 7660G | |
| HD Graphics 4000 (Desktop) | |
| GeForce GT 630M | |
| 1024x600 Normal, Mandel Vector (sort by value) | |
| HD Graphics 4600 | |
| Radeon HD 7660G | |
| HD Graphics 4000 (Desktop) | |
| GeForce GT 630M | |
| 1024x600 Normal, Fluid 2DTexArr (sort by value) | |
| HD Graphics 4600 | |
| Radeon HD 7660G | |
| HD Graphics 4000 (Desktop) | |
| GeForce GT 630M | |
| 1024x600 Normal, Fluid 3DTex (sort by value) | |
| HD Graphics 4600 | |
| Radeon HD 7660G | |
| HD Graphics 4000 (Desktop) | |
| GeForce GT 630M | |
| 1024x600 Normal, Score (sort by value) | |
| HD Graphics 4600 | |
| Radeon HD 7660G | |
| HD Graphics 4000 (Desktop) | |
| GeForce GT 630M | |
Haswell improved the excellent calculation performance of the Ivy Bridge GPU. In the OpenCL based Luxmark it does not only outperform the Radeon HD 7660G, but also the dedicated GeForce GT 630M. But the differences are smaller in ComputeMark. The HD 4600 can only take the lead by a narrow margin here.
Video Transcoding
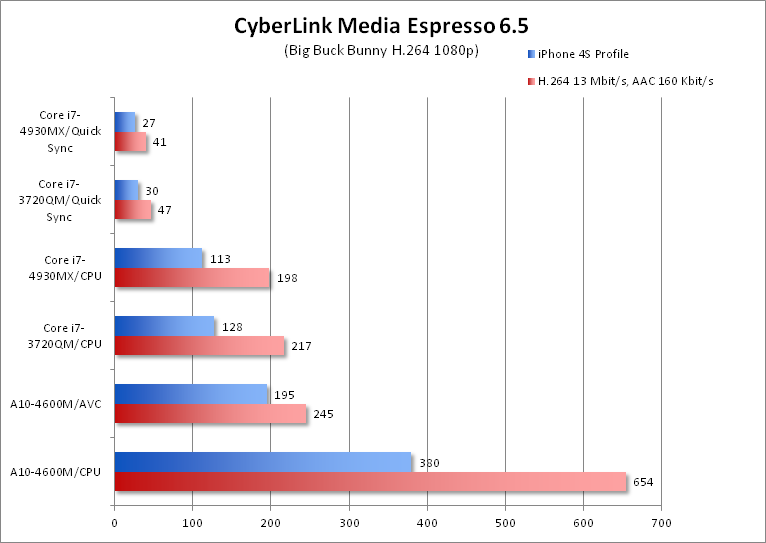
We tested the performance in video transcoding by means of the CyberLinks MediaEspresso 6.5 and the short video Big Buck Bunny (H.264, MOV, 1080p). The performance gain is only small in comparison to the last generation when using the Quick Sync Transcoder and is likely due to the faster CPU in part (see Haswell CPU test) and the slightly higher GPU clock.
Nevertheless, Quick Sync still remains the best method by far for fast video conversion with good image quality and low energy demand. While our test system only needed about 67 W during the Quick Sync conversion, the power consumption increased to about 88 W if the CPU is used instead, although the first method is dramatically faster. AMD’s AVC transcoder also delivers good performance, but is slower than Intel's solution.
Verdict
If you consider that the HD Graphics 4600 is only the mid-range solution of all the integrated Haswell graphics solutions, the performance is absolutely brilliant. If driver and clock differences are taken into account, it is about 30 percent faster than the HD Graphics 4000. This is fast enough to draw level with the fastest Trinity APU from AMD, the A10-4600M (Radeon HD 7660G). The recently introduced, but not yet available A10-5750M (Radeon HD 8650) Richland part might perform slightly better than the HD Graphics 4600.
Intel will hardly loose the performance crown of integrated mobile GPUs this year. Iris Pro Graphics 5200 will likely double the raw performance and might even challenge dedicated graphics cards like the GeForce GT 640M. Furthermore, Iris Graphics 5100 and HD Graphics 5000 are two powerful graphics solutions for slim notebooks. However, these models might not be especially inexpensive.
Back to the HD 4600: While its GPU performance might satisfy occasional gamers, this is not enough for more demanding users: For smooth frame rates in all games, you'll need to decrease resolution and details to a minimum in some. Even the older GeForce GT 630M is still faster in most games and ensures that some mid-level dedicated solutions are here to stay for a while longer.
Appendix
More benchmarks without commentary:
| SPECviewperf 11 | |
| 1920x1080 Siemens NX (sort by value) | |
| HD Graphics 4600 | |
| Radeon HD 7660G | |
| 1920x1080 Tcvis (sort by value) | |
| HD Graphics 4600 | |
| Radeon HD 7660G | |
| 1920x1080 SolidWorks (sort by value) | |
| HD Graphics 4600 | |
| Radeon HD 7660G | |
| 1920x1080 Pro/ENGINEER (sort by value) | |
| HD Graphics 4600 | |
| Radeon HD 7660G | |
| 1920x1080 Maya (sort by value) | |
| HD Graphics 4600 | |
| Radeon HD 7660G | |
| 1920x1080 Lightwave (sort by value) | |
| HD Graphics 4600 | |
| Radeon HD 7660G | |
| 1920x1080 Ensight (sort by value) | |
| HD Graphics 4600 | |
| Radeon HD 7660G | |
| 1920x1080 Catia (sort by value) | |
| HD Graphics 4600 | |
| Radeon HD 7660G | |
| Cinebench R11.5 - OpenGL 64Bit (sort by value) | |
| HD Graphics 4600 | |
| Radeon HD 7660G | |
| 3DMark 03 - 1024x768 Standard AA:0x AF:0x (sort by value) | |
| HD Graphics 4600 | |
| Radeon HD 7660G | |
| 3DMark 05 - 1024x768 Standard AA:0x AF:0x (sort by value) | |
| HD Graphics 4600 | |
| Radeon HD 7660G | |
