Notebookcheck Logo

AMD Ryzen 5 2600X vs AMD Ryzen Embedded R1505G vs AMD Athlon 300U

AMD Ryzen 5 2600X

► remove from comparison AMD R5 2600X

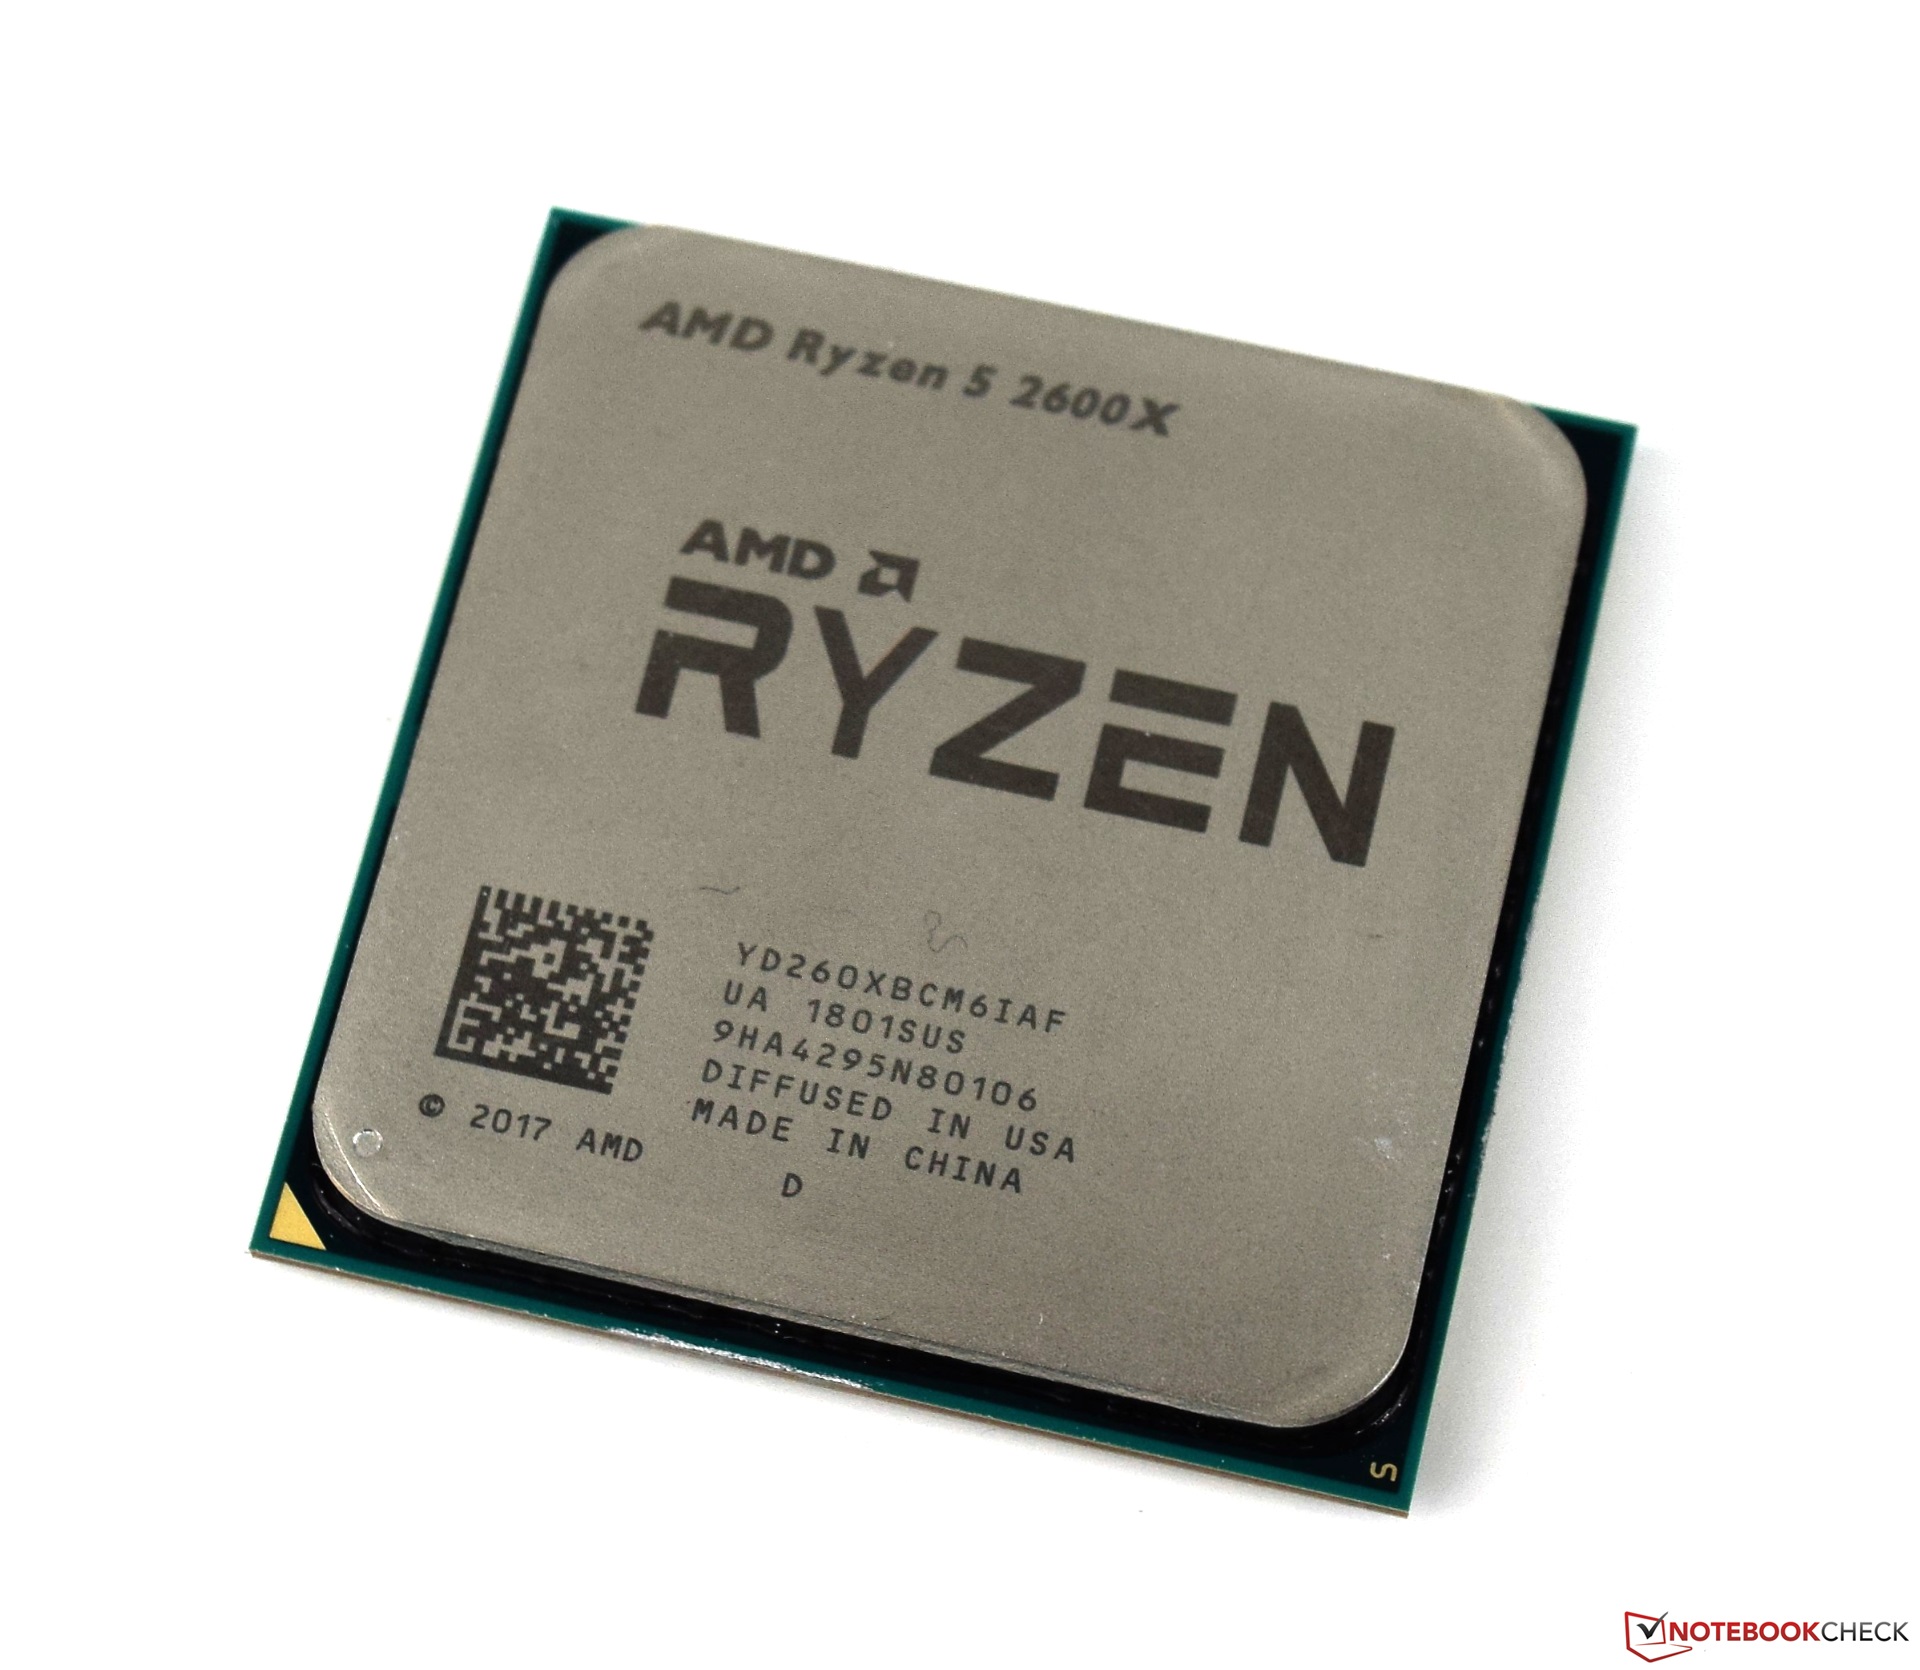
The AMD Ryzen 5 2600X is a high-end desktop processor with 6 cores (12 threads) that was announced early 2018. It is based on the revised Zen+ cores and at launch the second fastest Ryzen CPU behind the Ryzen 7 2700X. The CPU cores clock at 3.6 GHz base and using Precision Boost 2 up to 4.2 GHz. All 6 cores and 12 threads can clock up to 3.9 GHz. The 6 cores are divided in two cluster (3 cores each with own L3 cache) connected via Infinity Fabric.

Compared to the older first Ryzen generation (e.g., Ryzen 5 1600X), the second generation is manufactured in an improved process (12nm called), offers and improved Precision Boost 2 (especially in partial load of the cores) and faster cache and memory speeds.

See our second generation Ryzen review for detailed benchmarks and information.

AMD Ryzen Embedded R1505G

► remove from comparison AMD R1505G

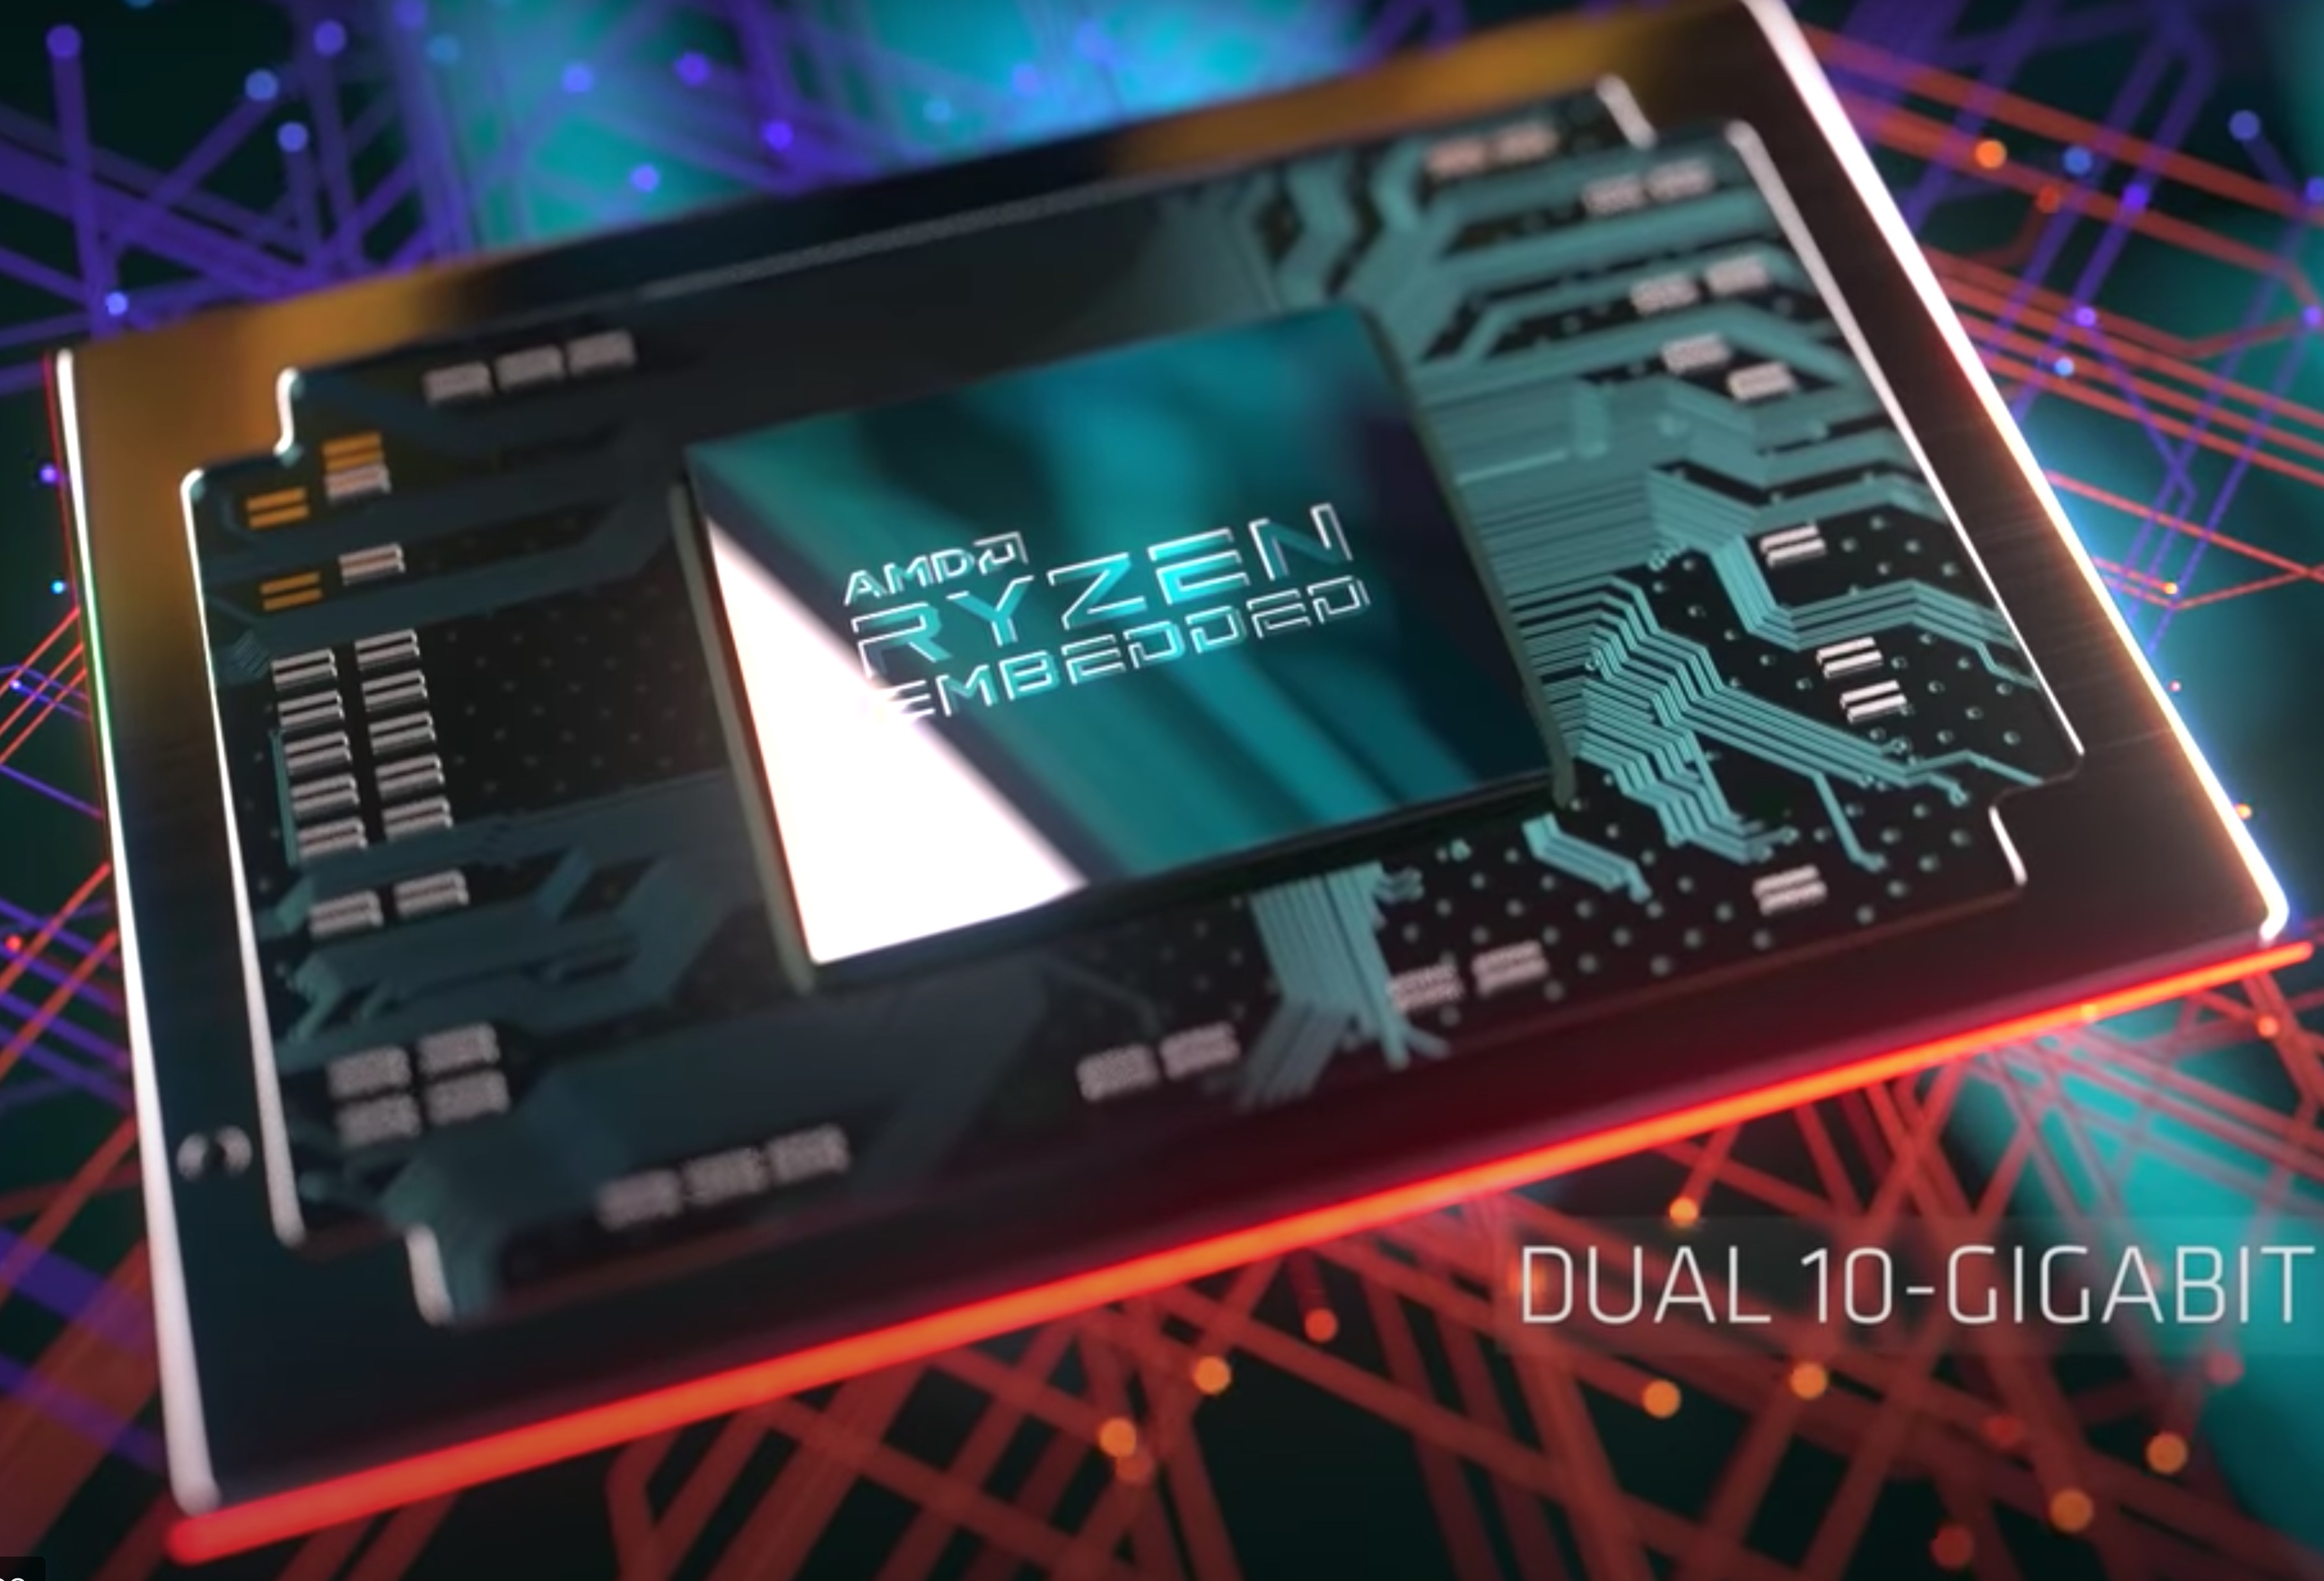
The AMD Ryzen Embedded R1505G is a mobile APU for thin and light embedded systems that was announced in early 2019. It includes two Zen cores clocked at 2.4 to 3.3 GHz and offers SMT (four threads) and 4 MB L3-Cache. The integrated graphics card is called Radeon RX Vega 3 and offers 3 CUs (192 Shaders). The TDP is configurable between 12 and 25 Watt (15 Watt nominal).

More information on Raven Ridge can be found in our launch article.

AMD Athlon 300U

► remove from comparison

The AMD Athlon 300U is a mobile entry level dual core SoC that was announced in January 2019. It combines two Zen cores (with SMT / Hyperthreading so running 4 threads) clocked at 2.4 - 3.3 GHz with a Radeon RX Vega 3 graphics card with 3 CUs (192 Shaders) clocked at up to 1000 MHz. Specified at 15 Watt TDP, the SoC is intended for thin mid-range laptops. It is quite similar to the AMD Ryzen 3 3200U (2.6 - 3.5 GHz).

Compared to the Picasso APUs of the Ryzen 3000 series, the Athlon 300U is still based on the first generation of the 2000 series. Only the PRO variant is based on the new Zen+ microarchitecture that should lead to a 3% IPS (performance per clock) improvement.

The integrated dual-channel memory controller supports up to DDR4-2400 memory. As the features of the Picasso APUs are the same compared to the Raven Ridge predecessors, we point to our Raven Ridge launch article.

In contrast to the faster quad-core Picasso APUs, the Athlon 300U only supports 3 instead of 4 displays in total.

Performance wise, the Athlon 300 should be slightly slower than the Ryzen 3 2200U (2.5 - 3.4 GHz Dual Core with SMT).

ModelAMD Ryzen 5 2600XAMD Ryzen Embedded R1505GAMD Athlon 300U
CodenameZen+ZenZen
SeriesAMD Ryzen 5AMD Raven Ridge (Ryzen 2000 APU)AMD Raven Ridge (Ryzen 2000 APU)
Clock3600 - 4200 MHz2400 - 3300 MHz2400 - 3300 MHz
L2 Cache4 MB2 MB1 MB
L3 Cache16 MB4 MB4 MB
Cores / Threads6 / 122 / 4
2 x 3.3 GHz AMD Zen 1
2 / 4
TDP95 Watt15 Watt15 Watt
Transistors4940 Million4500 Million4500 Million
Technology12 nm14 nm12 nm
Die Size209.78 mm2
SocketAM4 (1331)AM4AM4
FeaturesSSE4.2, SSE4A, AMD-V, AES, AVX2, FMA3, SHAXFR, FMA3, SSE 4.2, AVX2, SMTXFR, FMA3, SSE 4.2, AVX2, SMT
Architecturex86x86x86
$229 U.S.
Announced
Series: Raven Ridge (Ryzen 2000 APU) Zen
AMD Ryzen 5 2400G3.6 - 3.9 GHz4 / 8 cores4 MB L3
AMD Ryzen 7 2700U2.2 - 3.8 GHz4 / 8 cores4 MB L3
AMD Ryzen 7 PRO 2700U2.2 - 3.8 GHz4 / 8 cores4 MB L3
AMD Ryzen 3 2200G3.5 - 3.7 GHz4 / 4 cores4 MB L3
AMD Ryzen 5 2600H3.2 - 3.6 GHz4 / 8 cores4 MB L3
AMD Ryzen 5 2500U2 - 3.6 GHz4 / 8 cores4 MB L3
AMD Ryzen 5 PRO 2500U2 - 3.6 GHz4 / 8 cores4 MB L3
AMD Ryzen Embedded V1605B2 - 3.6 GHz4 / 8 cores4 MB L3
AMD Ryzen 3 2300U2 - 3.4 GHz4 / 4 cores4 MB L3
AMD Ryzen 3 PRO 2300U2 - 3.4 GHz4 / 4 cores4 MB L3
AMD Ryzen Embedded R1606G2.6 - 3.5 GHz2 / 4 cores4 MB L3
AMD Ryzen 3 2200U2.5 - 3.4 GHz2 / 4 cores4 MB L3
AMD Ryzen 3 PRO 2200U2.5 - 3.4 GHz2 / 4 cores4 MB L3
AMD Ryzen Embedded R1505G « 2.4 - 3.3 GHz2 / 4 cores4 MB L3
AMD Athlon 300U2.4 - 3.3 GHz2 / 4 cores4 MB L3
AMD Ryzen 5 2400G3.6 - 3.9 GHz4 / 8 cores4 MB L3
AMD Ryzen 7 2700U2.2 - 3.8 GHz4 / 8 cores4 MB L3
AMD Ryzen 7 PRO 2700U2.2 - 3.8 GHz4 / 8 cores4 MB L3
AMD Ryzen 3 2200G3.5 - 3.7 GHz4 / 4 cores4 MB L3
AMD Ryzen 5 2600H3.2 - 3.6 GHz4 / 8 cores4 MB L3
AMD Ryzen 5 2500U2 - 3.6 GHz4 / 8 cores4 MB L3
AMD Ryzen 5 PRO 2500U2 - 3.6 GHz4 / 8 cores4 MB L3
AMD Ryzen Embedded V1605B2 - 3.6 GHz4 / 8 cores4 MB L3
AMD Ryzen 3 2300U2 - 3.4 GHz4 / 4 cores4 MB L3
AMD Ryzen 3 PRO 2300U2 - 3.4 GHz4 / 4 cores4 MB L3
AMD Ryzen Embedded R1606G2.6 - 3.5 GHz2 / 4 cores4 MB L3
AMD Ryzen 3 2200U2.5 - 3.4 GHz2 / 4 cores4 MB L3
AMD Ryzen 3 PRO 2200U2.5 - 3.4 GHz2 / 4 cores4 MB L3
AMD Ryzen Embedded R1505G2.4 - 3.3 GHz2 / 4 cores4 MB L3
AMD Athlon 300U « 2.4 - 3.3 GHz2 / 4 cores4 MB L3
L1 Cache384 KB192 KB
iGPUAMD Radeon RX Vega 3AMD Radeon RX Vega 3 ( - 1000 MHz)
Manufacturerwww.amd.com

Benchmarks

Performance Rating - CB R15 + R20 + 7-Zip + X265 + Blender + 3DM11 CPU - R5 2600X
28.4 pt (47%)
Restrict / Search: Model: Max. age: years
Cinebench R20 - Cinebench R20 CPU (Single Core)
421 Points (46%)
243 Points (26%)
308 Points (34%)
Cinebench R20 - Cinebench R20 CPU (Multi Core)
2688 Points (7%)
596 Points (1%)
637 Points (2%)
Cinebench R15 - Cinebench R15 CPU Multi 64 Bit
1341 Points (8%)
264 Points (2%)
308 Points (2%)
Cinebench R15 - Cinebench R15 CPU Single 64 Bit
163 Points (45%)
97.3 Points (27%)
119 Points (33%)
Cinebench R11.5 - Cinebench R11.5 CPU Multi 64 Bit
14.6 Points (19%)
Cinebench R11.5 - Cinebench R11.5 CPU Single 64 Bit
1.8 Points (43%)
Cinebench R10 - Cinebench R10 Rend. Single (32bit)
4958 Points (30%)
3968 Points (24%)
Cinebench R10 - Cinebench R10 Rend. Multi (32bit)
29954 Points (22%)
8724 Points (6%)
Cinebench R10 - Cinebench R10 Rend. Multi (64bit)
48146 Points (31%)
Cinebench R10 - Cinebench R10 Rend. Single (64bit)
8272 Points (10%)
wPrime 2.10 - wPrime 2.0 1024m *
133.8 s (2%)
510 s (6%)
wPrime 2.10 - wPrime 2.0 32m *
4.6 s (1%)
15.4 s (3%)
WinRAR - WinRAR 4.0
4599 Points (7%)
1623 Points (3%)
7-Zip 18.03 - 7-Zip 18.03 Multi Thread 4 runs
33222 MIPS (19%)
21%
1 R1505G +
6931 MIPS (4%)
7-Zip 18.03 - 7-Zip 18.03 Single Thread 4 runs
4293 MIPS (51%)
58%
1 R1505G +
2505 MIPS (30%)
X264 HD Benchmark 4.0 - x264 Pass 2
80.5 fps (27%)
18.5 fps (6%)
X264 HD Benchmark 4.0 - x264 Pass 1
207.4 fps (48%)
88.6 fps (20%)
HWBOT x265 Benchmark v2.2 - HWBOT x265 4k Preset
8.3 fps (15%)
0.7 fps (1%)
1.8 fps (3%)
TrueCrypt - TrueCrypt Serpent
0.8 GB/s (23%)
0.2 GB/s (6%)
TrueCrypt - TrueCrypt Twofish
1.2 GB/s (21%)
0.3 GB/s (5%)
TrueCrypt - TrueCrypt AES
8 GB/s (21%)
1.9 GB/s (5%)
Blender - Blender 2.79 BMW27 CPU *
min: 350     avg: 352     median: 352 (2%)     max: 353.9 Seconds
20%
1 R1505G +
1725 Seconds (12%)
R Benchmark 2.5 - R Benchmark 2.5 *
0.6 sec (14%)
58%
1 R1505G +
1.1 sec (24%)
Super Pi mod 1.5 XS 1M - Super Pi mod 1.5 XS 1M *
11.4 s (2%)
14.1 s (3%)
Super Pi mod 1.5 XS 2M - Super Pi mod 1.5 XS 2M *
24.8 s (1%)
31.8 s (1%)
Super Pi Mod 1.5 XS 32M - Super Pi mod 1.5 XS 32M *
616 s (3%)
807 s (4%)
3DMark Vantage - 3DM Vant. Perf. CPU no Physx
45760 Points (35%)
3DMark 11 - 3DM11 Performance Physics
12074 Points (30%)
3427 Points (8%)
3DMark - 3DMark Ice Storm Physics
73430 Points (60%)
41974 Points (34%)
3DMark - 3DMark Ice Storm Extreme Physics
73424 Points (60%)
30288 Points (25%)
41029 Points (33%)
3DMark - 3DMark Ice Storm Unlimited Physics
74442 Points (60%)
38267 Points (31%)
45359 Points (36%)
3DMark - 3DMark Cloud Gate Physics
11855 Points (30%)
2855 Points (7%)
3217 Points (8%)
3DMark - 3DMark Fire Strike Standard Physics
18091 Points (32%)
4106 Points (7%)
4729 Points (8%)
3DMark - 3DMark Time Spy CPU
6530 Points (28%)
1361 Points (6%)
Geekbench 5.5 - Geekbench 5.1 - 5.5 64 Bit Single-Core
min: 1066     avg: 1145     median: 1144.5 (45%)     max: 1223 Points
612 Points (24%)
867 Points (34%)
Geekbench 5.5 - Geekbench 5.1 - 5.5 64 Bit Multi-Core
min: 5816     avg: 6094     median: 6094 (11%)     max: 6372 Points
1353 Points (2%)
1840 Points (3%)
Geekbench 5.0 - Geekbench 5.0 64 Bit Single-Core
1067 Points (5%)
616 Points (3%)
765 Points (3%)
Geekbench 5.0 - Geekbench 5.0 64 Bit Multi-Core
5939 Points (19%)
1370 Points (4%)
1552 Points (5%)
Geekbench 4.4 - Geekbench 4.1 - 4.4 64 Bit Single-Core
min: 4577     avg: 4642     median: 4641.5 (46%)     max: 4706 Points
2667 Points (27%)
3287 Points (33%)
Geekbench 4.4 - Geekbench 4.1 - 4.4 64 Bit Multi-Core
min: 21616     avg: 22301     median: 22301 (22%)     max: 22986 Points
5478 Points (5%)
6053 Points (6%)
Geekbench 4.0 - Geekbench 4.0 64 Bit Single-Core
3213 Points (35%)
Geekbench 4.0 - Geekbench 4.0 64 Bit Multi-Core
5763 Points (8%)
Geekbench 3 - Geekbench 3 32 Bit Multi-Core
6134 Points (11%)
Geekbench 3 - Geekbench 3 32 Bit Single-Core
2919 Points (38%)
Geekbench 3 - Geekbench 3 64 Bit Multi-Core
6471 Points (10%)
Geekbench 3 - Geekbench 3 64 Bit Single-Core
3196 Points (48%)
Geekbench 2 - 32 Bit - Geekbench Stream
4852 Points (26%)
Geekbench 2 - 32 Bit - Geekbench Memory
4449 Points (31%)
Geekbench 2 - 32 Bit - Geekbench Floating Point
9250 Points (18%)
Geekbench 2 - 32 Bit - Geekbench Integer
6447 Points (13%)
Geekbench 2 - 32 Bit - Geekbench Total Score
6868 Points (18%)
Mozilla Kraken 1.1 - Kraken 1.1 Total Score *
884 ms (1%)
1553 ms (2%)
1452 ms (2%)
Sunspider - Sunspider 1.0 Total Score *
133.6 ms (1%)
Octane V2 - Octane V2 Total Score
22253 Points (16%)
WebXPRT 3 - WebXPRT 3 Score
186 Points (33%)
106 Points (19%)
143 Points (26%)
Power Consumption - Prime95 Power Consumption - external Monitor *
171.7 Watt (30%)
Power Consumption - Cinebench R15 Multi Power Consumption - external Monitor *
164.4 Watt (30%)
Power Consumption - Power Efficiency - Cinebench R15 Multi external Monitor
8.2 Points per Watt (6%)

Average Benchmarks AMD Ryzen 5 2600X → 100% n=17

Average Benchmarks AMD Ryzen Embedded R1505G → 39% n=17

Average Benchmarks AMD Athlon 300U → 48% n=17

- Range of benchmark values for this graphics card
red legend - Average benchmark values for this graphics card
* Smaller numbers mean a higher performance
1 This benchmark is not used for the average calculation

v1.33
log 31. 11:41:40

#0 ran 0s before starting gpusingle class +0s ... 0s

#1 checking url part for id 9980 +0s ... 0s

#2 checking url part for id 12641 +0s ... 0s

#3 checking url part for id 11201 +0s ... 0s

#4 redirected to Ajax server, took 1756633300s time from redirect:0 +0s ... 0s

#5 did not recreate cache, as it is less than 5 days old! Created at Sun, 31 Aug 2025 05:17:53 +0200 +0s ... 0s

#6 composed specs +0.005s ... 0.005s

#7 did output specs +0s ... 0.005s

#8 getting avg benchmarks for device 9980 +0.003s ... 0.008s

#9 got single benchmarks 9980 +0.005s ... 0.013s

#10 getting avg benchmarks for device 12641 +0.001s ... 0.014s

#11 got single benchmarks 12641 +0.003s ... 0.017s

#12 getting avg benchmarks for device 11201 +0.001s ... 0.017s

#13 got single benchmarks 11201 +0.004s ... 0.021s

#14 got avg benchmarks for devices +0s ... 0.021s

#15 min, max, avg, median took s +0.042s ... 0.063s

#16 return log +0s ... 0.063s

Please share our article, every link counts!
Mail Logo
> Expert Reviews and News on Laptops, Smartphones and Tech Innovations > Benchmarks / Tech > Processor Comparison - Head 2 Head
Redaktion, 2017-09- 8 (Update: 2023-07- 1)