Notebookcheck Logo

AMD Ryzen 5 2600 vs AMD Ryzen 5 1500X

AMD Ryzen 5 2600

► remove from comparison AMD R5 2600

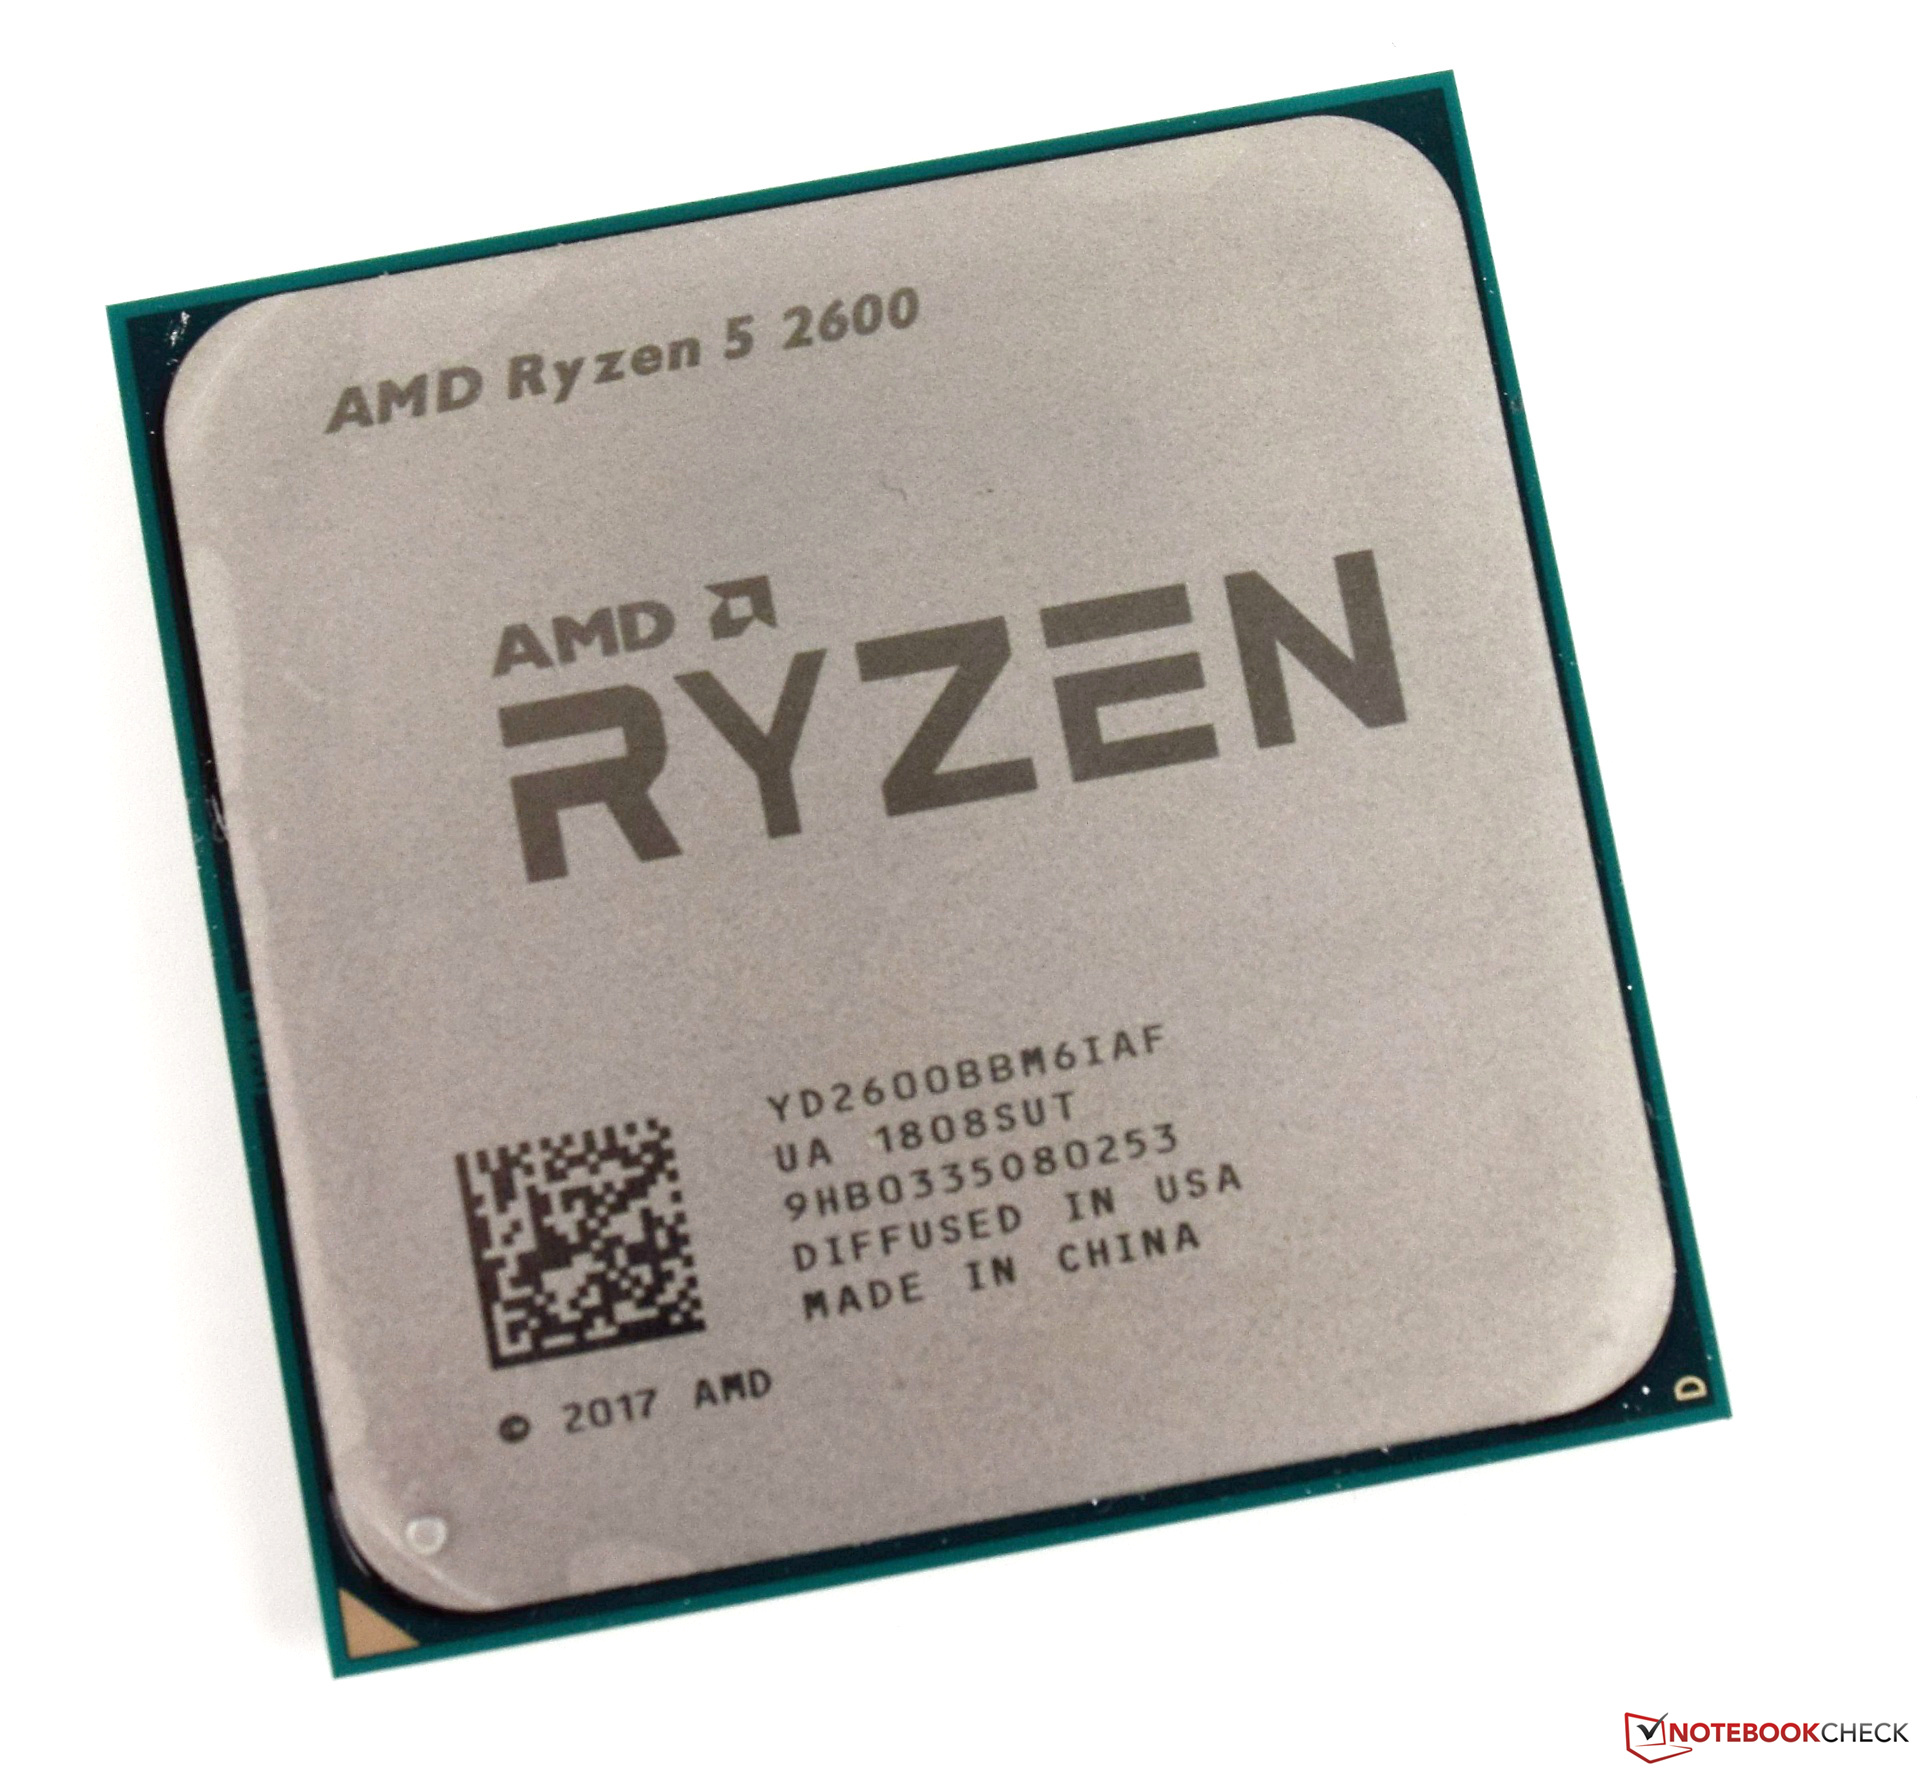
The AMD Ryzen 5 2600 is a six-core desktop processor that can handle twelve threads simultaneously thanks to Simultaneous Multithreading (SMT). This technology is equivalent to Intel's Hyper-Threading. Launched in April 2018, the Ryzen 5 2600 is the second fastest Ryzen 5 processor and is much more economical than its flagship sibling. The Ryzen 5 2600 has a 65 W TDP, which is nearly 40% more efficient than the 95 W TDP Ryzen 5 2600 X. This energy efficiency comes at a cost to performance though.

The Ryzen 5 2600 has a base clock speed of 3.4 GHz, which can be boosted by Extended Frequency Range (XFR) up to 3.9 GHz. The power gain is still high in multi-threaded applications, although this is some way off the Ryzen 5 2600X. The Ryzen 5 2600 benefits from AMD's new Zen+ architecture, with a greater number of instructions per cycle (IPC) and higher clock speeds than last year's Zen chips. The Ryzen 5 2600's six cores are divided into two clusters that are connected by Infinity Fabric, a subset of HyperTransport. Each cluster has its own L3 cache.

The Ryzen 5 2600 has good performance in games. Moreover, the Ryzen 5 2600 has a higher base clock than the Ryzen 7 2700. Seeing as many games currently lack multi-core support, this means that the Ryzen 5 2600 performs better than its technically superior sibling.

Detailed information, benchmarks and values can be found in our review of the Ryzen 5 2600.

AMD Ryzen 5 1500X

► remove from comparison AMD R5 1500X

The AMD Ryzen 5 1500X is a desktop processor with 4 cores and Hyper Threading (SMT). It is the fastest Ryzen 5 quad-core processor in the beginning of 2017, but the 65-watt TDP is similar to the hexa-core Ryzen 5 1600.

The Ryzen 5 1500X has a base frequency of 3.5 GHz and can reach up to 3.7 GHz via Turbo (up to 2 cores) or 3.9 GHz via XFR (also up to 2 cores).

The processor based on the Zen architecture is not fully convincing in games. AMD blames missing optimizations from the gaming producers.

ModelAMD Ryzen 5 2600AMD Ryzen 5 1500X
CodenamePinnacle Riege (Zen+)Zen
SeriesAMD Ryzen 5AMD Ryzen 5
Clock3400 - 3900 MHz3500 - 3700 MHz
L2 Cache3 MB2 MB
L3 Cache16 MB16 MB
Cores / Threads6 / 124 / 8
TDP65 Watt65 Watt
Transistors4940 Million4800 Million
Technology12 nm14 nm
Die Size213 mm2
max. Temp.95 °C
SocketAM4 (LGA1331)AM4
FeaturesDDR4-2933 RAM, PCIe 3, MMX, SSE, SSE2, SSE3, SSSE3, SSE4A, SSE4.1, SSE4.2, AVX, AVX2, BMI2, ABM, FMA, ADX, SMEP, SMAP, SMT, CPB, AES-NI, RDRAND, RDSEED, SHA, SMEXFR, FMA3, SSE 4.2, AVX2, SMT
Announced
Manufacturerwww.amd.com
Series: Ryzen 5 Zen
AMD Ryzen 5 1600 compare3.2 - 3.6 GHz6 / 12 cores16 MB L3
AMD Ryzen 5 1500X « 3.5 - 3.7 GHz4 / 8 cores16 MB L3
AMD Ryzen 5 1400 compare3.2 - 3.4 GHz4 / 8 cores8 MB L3
L1 Cache384 KB
Architecturex86

Benchmarks

Performance Rating - CB R15 + R20 + 7-Zip + X265 + Blender + 3DM11 CPU - R5 2600
27.3 pt (45%)
Restrict / Search: Model: Max. age: years
Performance Rating - CB R15 + R20 + 7-Zip + X265 + Blender + 3DM11 CPU - R5 1500X
26 pt (43%)
Restrict / Search: Model: Max. age: years
Cinebench R23 - Cinebench R23 Multi Core
min: 4586     avg: 4597     median: 4597 (4%)     max: 4608 Points
Cinebench R23 - Cinebench R23 Single Core
min: 938     avg: 947     median: 947 (39%)     max: 956 Points
Cinebench R20 - Cinebench R20 CPU (Single Core)
380 Points (41%)
min: 346     avg: 360     median: 360 (39%)     max: 374 Points
Cinebench R20 - Cinebench R20 CPU (Multi Core)
2793 Points (7%)
min: 1777     avg: 1783     median: 1783 (4%)     max: 1789 Points
Cinebench R15 - Cinebench R15 CPU Multi 64 Bit
min: 1245     avg: 1254     median: 1248 (8%)     max: 1270 Points
min: 796     avg: 806     median: 805 (5%)     max: 818 Points
Cinebench R15 - Cinebench R15 CPU Single 64 Bit
min: 155.9     avg: 157.4     median: 157.3 (44%)     max: 159 Points
min: 142     avg: 151     median: 154 (43%)     max: 157 Points
Cinebench R11.5 - Cinebench R11.5 CPU Multi 64 Bit
13.7 Points (18%)
9 Points (12%)
Cinebench R11.5 - Cinebench R11.5 CPU Single 64 Bit
1.8 Points (42%)
1.7 Points (41%)
Cinebench R10 - Cinebench R10 Rend. Single (32bit)
4726 Points (29%)
4573 Points (28%)
Cinebench R10 - Cinebench R10 Rend. Multi (32bit)
28173 Points (20%)
20186 Points (15%)
Cinebench R10 - Cinebench R10 Rend. Multi (64bit)
100%
1 R5 2600 +
45033 Points (29%)
Cinebench R10 - Cinebench R10 Rend. Single (64bit)
100%
1 R5 2600 +
8024 Points (10%)
wPrime 2.10 - wPrime 2.0 1024m *
140.9 s (2%)
210.6 s (2%)
wPrime 2.10 - wPrime 2.0 32m *
5.5 s (1%)
6.9 s (1%)
WinRAR - WinRAR 4.0
4517 Points (7%)
3910 Points (6%)
7-Zip 18.03 - 7-Zip 18.03 Multi Thread 4 runs
30898 MIPS (18%)
min: 21495     avg: 21743     median: 21842 (13%)     max: 21891 MIPS
7-Zip 18.03 - 7-Zip 18.03 Single Thread 4 runs
4020 MIPS (47%)
min: 3768     avg: 3858     median: 3865 (46%)     max: 3942 MIPS
X264 HD Benchmark 4.0 - x264 Pass 2
75 fps (2%)
49.5 fps (1%)
X264 HD Benchmark 4.0 - x264 Pass 1
205.3 fps (5%)
177 fps (5%)
HWBOT x265 Benchmark v2.2 - HWBOT x265 4k Preset
min: 7.79     avg: 7.8     median: 7.8 (14%)     max: 7.82 fps
min: 5.09     avg: 5.1     median: 5.1 (9%)     max: 5.12 fps
TrueCrypt - TrueCrypt Serpent
0.7 GB/s (22%)
0.5 GB/s (14%)
TrueCrypt - TrueCrypt Twofish
1 GB/s (17%)
0.7 GB/s (13%)
TrueCrypt - TrueCrypt AES
7.5 GB/s (20%)
4.9 GB/s (13%)
Blender - Blender 2.79 BMW27 CPU *
min: 374.2     avg: 375     median: 375 (3%)     max: 375.7 Seconds
min: 585     avg: 586     median: 586 (4%)     max: 587 Seconds
R Benchmark 2.5 - R Benchmark 2.5 *
0.7 sec (14%)
min: 0.699     avg: 0.7     median: 0.7 (15%)     max: 0.738 sec
3DMark 06 - CPU - 3DMark 06 - CPU
9290 Points (20%)
7403 Points (16%)
Super Pi mod 1.5 XS 1M - Super Pi mod 1.5 XS 1M *
11.2 s (2%)
11 s (2%)
Super Pi mod 1.5 XS 2M - Super Pi mod 1.5 XS 2M *
24.3 s (1%)
24 s (1%)
Super Pi Mod 1.5 XS 32M - Super Pi mod 1.5 XS 32M *
615 s (3%)
640 s (3%)
3DMark Vantage - 3DM Vant. Perf. CPU no Physx
100%
1 R5 2600 +
43794 Points (34%)
3DMark 11 - 3DM11 Performance Physics
12405 Points (31%)
9566 Points (24%)
3DMark - 3DMark Ice Storm Physics
100%
1 R5 2600 +
69692 Points (57%)
3DMark - 3DMark Ice Storm Extreme Physics
100%
1 R5 2600 +
69478 Points (56%)
3DMark - 3DMark Ice Storm Unlimited Physics
70522 Points (57%)
61854 Points (50%)
3DMark - 3DMark Cloud Gate Physics
11219 Points (28%)
7712 Points (20%)
3DMark - 3DMark Fire Strike Standard Physics
100%
1 R5 2600 +
17063 Points (30%)
3DMark - 3DMark Time Spy CPU
6265 Points (26%)
4067 Points (17%)
Geekbench 5.5 - Geekbench 5.1 - 5.5 64 Bit Single-Core
min: 1014     avg: 1119     median: 1118.5 (38%)     max: 1223 Points
min: 917     avg: 919     median: 918.5 (31%)     max: 920 Points
Geekbench 5.5 - Geekbench 5.1 - 5.5 64 Bit Multi-Core
min: 5767     avg: 6070     median: 6069.5 (11%)     max: 6372 Points
min: 3997     avg: 4604     median: 4603.5 (8%)     max: 5210 Points
Geekbench 5.0 - Geekbench 5.0 64 Bit Single-Core
1020 Points (4%)
915 Points (4%)
Geekbench 5.0 - Geekbench 5.0 64 Bit Multi-Core
5885 Points (19%)
4035 Points (13%)
Geekbench 4.4 - Geekbench 4.1 - 4.4 64 Bit Single-Core
min: 4631     avg: 5109     median: 5109 (51%)     max: 5587 Points
min: 4105     avg: 4282     median: 4282 (43%)     max: 4459 Points
Geekbench 4.4 - Geekbench 4.1 - 4.4 64 Bit Multi-Core
min: 20633     avg: 23018     median: 23018 (23%)     max: 25403 Points
min: 15016     avg: 15134     median: 15134 (15%)     max: 15252 Points
Geekbench 4.0 - Geekbench 4.0 64 Bit Single-Core
4149 Points (46%)
Geekbench 4.0 - Geekbench 4.0 64 Bit Multi-Core
14463 Points (19%)
Geekbench 3 - Geekbench 3 64 Bit Multi-Core
16558 Points (26%)
Geekbench 3 - Geekbench 3 64 Bit Single-Core
4248 Points (64%)
Geekbench 2 - 32 Bit - Geekbench Stream
11011 Points (58%)
Geekbench 2 - 32 Bit - Geekbench Memory
8616 Points (60%)
Geekbench 2 - 32 Bit - Geekbench Floating Point
15951 Points (31%)
Geekbench 2 - 32 Bit - Geekbench Integer
13689 Points (28%)
Geekbench 2 - 32 Bit - Geekbench Total Score
13198 Points (35%)
Mozilla Kraken 1.1 - Kraken 1.1 Total Score *
951 ms (1%)
min: 966     avg: 975     median: 974.5 (1%)     max: 983 ms
Sunspider - Sunspider 1.0 Total Score *
74.8 ms (1%)
Octane V2 - Octane V2 Total Score
36017 Points (24%)
WebXPRT 3 - WebXPRT 3 Score
179 Points (32%)
min: 176     avg: 177.5     median: 177.5 (32%)     max: 179 Points
Power Consumption - Prime95 Power Consumption - external Monitor *
100%
1 R5 2600 +
157.5 Watt (27%)
146 Watt (25%)
Power Consumption - Cinebench R15 Multi Power Consumption - external Monitor *
100%
1 R5 2600 +
149.5 Watt (27%)
132 Watt (24%)
Power Consumption - Power Efficiency - Cinebench R15 Multi external Monitor
100%
1 R5 2600 +
8.5 Points per Watt (6%)
6.2 Points per Watt (5%)

Average Benchmarks AMD Ryzen 5 2600 → 100% n=37

Average Benchmarks AMD Ryzen 5 1500X → 80% n=37

- Range of benchmark values for this graphics card
red legend - Average benchmark values for this graphics card
* Smaller numbers mean a higher performance
1 This benchmark is not used for the average calculation

Add one or more devices and compare

In the following list you can select (and also search for) devices that should be added to the comparison. You can select more than one device.

restrict list:
v1.35
log 15. 00:33:04

#0 ran 0s before starting gpusingle class +0s ... 0s

#1 checking url part for id 10032 +0s ... 0s

#2 checking url part for id 9166 +0s ... 0s

#3 redirected to Ajax server, took 1765755184s time from redirect:0 +0s ... 0s

#4 did not recreate cache, as it is less than 5 days old! Created at Sun, 14 Dec 2025 14:22:43 +0100 +0s ... 0s

#5 composed specs +0.003s ... 0.004s

#6 did output specs +0s ... 0.004s

#7 getting avg benchmarks for device 10032 +0.004s ... 0.007s

#8 got single benchmarks 10032 +0.006s ... 0.013s

#9 getting avg benchmarks for device 9166 +0.003s ... 0.017s

#10 got single benchmarks 9166 +0.004s ... 0.021s

#11 got avg benchmarks for devices +0s ... 0.021s

#12 min, max, avg, median took s +0.043s ... 0.064s

#13 return log +0.002s ... 0.066s

Please share our article, every link counts!
Mail Logo
> Expert Reviews and News on Laptops, Smartphones and Tech Innovations > Benchmarks / Tech > Processor Comparison - Head 2 Head
Redaktion, 2017-09- 8 (Update: 2023-07- 1)