

NVIDIA Quadro 4000M vs NVIDIA RTX A4500 Laptop GPU
NVIDIA Quadro 4000M
► remove from comparison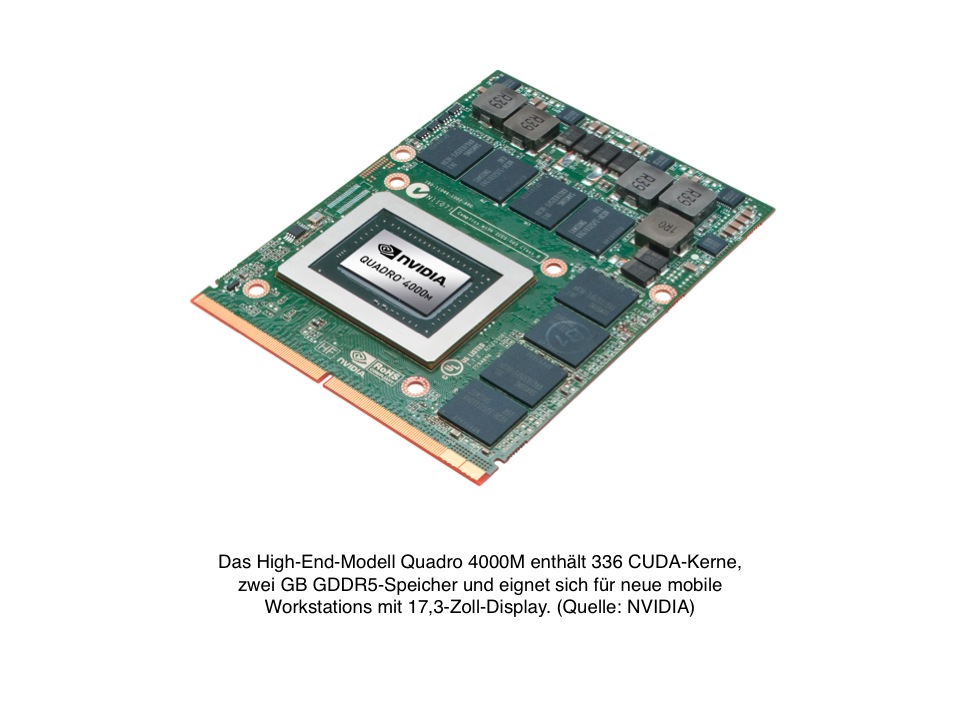
The NVIDIA Quadro 4000M is a professional workstation graphics card based on the Fermi architecture (or more specifically, probably the GF104). Unlike the 5010M, the 4000M does not support ECC memory and dual-precision (DP) floating point calculations.
The Quadro series offers certified drivers that are optimized for stability and performance in professional applications such as CAD or DCC. As a result, multiple scientific or business disciplines can make use of the workstation GPU. The OpenGL performance, for example, should be significantly better than consumer-oriented GeForce graphics cards of similar specifications.
The shader / CUDA cores can be accessed using DirectX 11 or OpenGL 4.1 for graphics rendering or DirectCompute, OpenCL, AXE, and CUDA for general purpose calculations. Due to the new Fermi core, the 4000M should offer higher performance in general purpose calculations compared to its predecessors.
Furthermore, the Nvidia Quadro 4000M is compatible with 3D Vision Pro, a new software solution by Nvidia for stereoscopic output.
The 4000M supports Nvidia Optimus in order to automatically switch between the integrated graphics card and the Quadro for power-saving purposes. Whether or not this feature is supported on a laptop, however, is dependent on the laptop manufacturer.
Similar to the GeForce GTX 480M, the Quadro 4000M is specified at 100 Watt TDP and is therefore only found in large laptops such as the Clevo D901F.
NVIDIA RTX A4500 Laptop GPU
► remove from comparison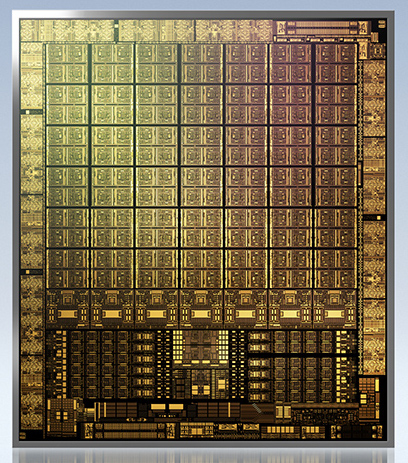
The NVIDIA RTX A4500 Laptop GPU or A4500 Mobile is a professional graphics card for mobile workstations. It is based on the GA104 Ampere chip and similar to the consumer GeForce RTX 3070 Ti Laptop GPU. It offers 5,888 graphics cores, 46 RT cores, 184 Tensor cores and up to 16 GB GDDR6 graphics memory with a 256 Bit memory bus. It supports PCIe 4.0 and will be available in different variants from 80 to 140 Watt (TGP) with different clock speeds (and performance). The GPU supports eDP 1.4b to connect the internal monitor and DisplayPort 1.4 and HDMI 2.1 for external connections.
There is no more Max-Q variant (formerly used for the low power variants) but every OEM can choose to implement Max-Q technologies (Dynamic Boost, WhisperMode).
The raw performance should be similar to the GeForce RTX 3070 Ti laptop at the same TGP level. Both GPUs depend heavily on good cooling and a high TGP for good performance. At a similar power consumption level the RTX A4500 should be clearly faster than the old RTX A4000 and Quadro RTX 4000. The desktop variant of the A4500 however, is a lot faster.
The GA104 chip offers 6,144 FP32 ALUs of which half can also execute INT32 instructions (i.e. 3,072 INT32 ALUs). With Ampere all shaders could still execute FP32 or INT32 instructions. The raytracing and tensor cores on the chip were also improved according to Nvidia. The A4500 only uses 5,888 of the 6,144 CUDA cores. The Ampere chips also include an improved 5th generation video encoder (NVENC for H.264 and H.265) and a 7th generation decoder (for various formats now including AV1).
The GA104 chip is manufactured by Samsung in 8nm (8N), which is not quite able to keep up with the 7nm node at TSMC (e.g. used by AMD and also for the professional GA100 Ampere chip).
| NVIDIA Quadro 4000M | NVIDIA RTX A4500 Laptop GPU | ||||||||||||||||||||||||||||||||||||||||||||||||||||||||||||||||||||||||||||||||||
| RTX A Series |
|
| |||||||||||||||||||||||||||||||||||||||||||||||||||||||||||||||||||||||||||||||||
| Codename | Fermi | GA104 | |||||||||||||||||||||||||||||||||||||||||||||||||||||||||||||||||||||||||||||||||
| Architecture | Fermi | Ampere | |||||||||||||||||||||||||||||||||||||||||||||||||||||||||||||||||||||||||||||||||
| Pipelines | 336 - unified | 5888 - unified | |||||||||||||||||||||||||||||||||||||||||||||||||||||||||||||||||||||||||||||||||
| Core Speed | 475 MHz | 930 - 1500 (Boost) MHz | |||||||||||||||||||||||||||||||||||||||||||||||||||||||||||||||||||||||||||||||||
| Shader Speed | 950 MHz | ||||||||||||||||||||||||||||||||||||||||||||||||||||||||||||||||||||||||||||||||||
| Memory Speed | 1200 MHz | 16000 effective = 2000 MHz | |||||||||||||||||||||||||||||||||||||||||||||||||||||||||||||||||||||||||||||||||
| Memory Bus Width | 256 Bit | 256 Bit | |||||||||||||||||||||||||||||||||||||||||||||||||||||||||||||||||||||||||||||||||
| Memory Type | GDDR5 | GDDR6 | |||||||||||||||||||||||||||||||||||||||||||||||||||||||||||||||||||||||||||||||||
| Max. Amount of Memory | 2048 MB | 16 GB | |||||||||||||||||||||||||||||||||||||||||||||||||||||||||||||||||||||||||||||||||
| Shared Memory | no | no | |||||||||||||||||||||||||||||||||||||||||||||||||||||||||||||||||||||||||||||||||
| API | DirectX 11, Shader 5.0 | DirectX 12_2, Shader 6.7, OpenGL 4.6, OpenCL 3.0, Vulkan 1.3 | |||||||||||||||||||||||||||||||||||||||||||||||||||||||||||||||||||||||||||||||||
| Power Consumption | 100 Watt | 140 Watt (80 - 140 Watt TGP) | |||||||||||||||||||||||||||||||||||||||||||||||||||||||||||||||||||||||||||||||||
| technology | 40 nm | 8 nm | |||||||||||||||||||||||||||||||||||||||||||||||||||||||||||||||||||||||||||||||||
| Features | OpenGl 4.1, FP32 | DisplayPort 1.4, HDMI 2.1, PCIe 4.0 x16, 17.8 SP-FP TFLOPS Peak, 143 Tensor Performance Peak, up to 384 GB/s Memory Bandwidth, Resizable BAR, Support for Modern Standby | |||||||||||||||||||||||||||||||||||||||||||||||||||||||||||||||||||||||||||||||||
| Notebook Size | large | large | |||||||||||||||||||||||||||||||||||||||||||||||||||||||||||||||||||||||||||||||||
| Date of Announcement | 22.02.2011 | 30.03.2022 | |||||||||||||||||||||||||||||||||||||||||||||||||||||||||||||||||||||||||||||||||
| Link to Manufacturer Page | www.nvidia.com | nvdam.widen.net | |||||||||||||||||||||||||||||||||||||||||||||||||||||||||||||||||||||||||||||||||
| TMUs | 184 | ||||||||||||||||||||||||||||||||||||||||||||||||||||||||||||||||||||||||||||||||||
| ROPs | 96 | ||||||||||||||||||||||||||||||||||||||||||||||||||||||||||||||||||||||||||||||||||
| Raytracing Cores | 46 | ||||||||||||||||||||||||||||||||||||||||||||||||||||||||||||||||||||||||||||||||||
| Tensor / AI Cores | 127 | ||||||||||||||||||||||||||||||||||||||||||||||||||||||||||||||||||||||||||||||||||
| Theoretical Performance | 18.5 TFLOPS FP32 | ||||||||||||||||||||||||||||||||||||||||||||||||||||||||||||||||||||||||||||||||||
| Cache | L2: 4 MB | ||||||||||||||||||||||||||||||||||||||||||||||||||||||||||||||||||||||||||||||||||
| Memory Bandwidth | 512 GB/s | ||||||||||||||||||||||||||||||||||||||||||||||||||||||||||||||||||||||||||||||||||
| PCIe | 4.0 x16 | ||||||||||||||||||||||||||||||||||||||||||||||||||||||||||||||||||||||||||||||||||
| Predecessor | RTX A4000 Laptop GPU |
Benchmarks

3DM Vant. Perf. total + NVIDIA Quadro 4000M
specvp11 snx-01 + NVIDIA Quadro 4000M
Average Benchmarks NVIDIA Quadro 4000M → 0% n=0
* Smaller numbers mean a higher performance
1 This benchmark is not used for the average calculation
Game Benchmarks
The following benchmarks stem from our benchmarks of review laptops. The performance depends on the used graphics memory, clock rate, processor, system settings, drivers, and operating systems. So the results don't have to be representative for all laptops with this GPU. For detailed information on the benchmark results, click on the fps number.

StarCraft 2
2010

Sims 3
2009
Racedriver: GRID
2008Average Gaming NVIDIA Quadro 4000M → 100%
Average Gaming 30-70 fps → 100%
| NVIDIA Quadro 4000M | NVIDIA RTX A4500 Laptop GPU | |||||||||||||
|---|---|---|---|---|---|---|---|---|---|---|---|---|---|---|
| low | med. | high | ultra | QHD | 4K | low | med. | high | ultra | QHD | 4K | |||
| StarCraft 2 | 180 | 112 | 79 | 71 | ||||||||||
| Anno 1404 | 173 | 62 | ||||||||||||
| Sims 3 | 279 | 165 | 79 | |||||||||||
| Racedriver: GRID | 188 | 148 | 117 | |||||||||||
| NVIDIA Quadro 4000M | NVIDIA RTX A4500 Laptop GPU | |||||||||||||
| low | med. | high | ultra | QHD | 4K | low | med. | high | ultra | QHD | 4K | < 30 fps < 60 fps < 120 fps ≥ 120 fps | 4 | 1 2 | 3 | 2 | | | < 30 fps < 60 fps < 120 fps ≥ 120 fps | | | | | | |
For more games that might be playable and a list of all games and graphics cards visit our Gaming List