Notebookcheck Logo

Apple M2 vs Qualcomm Snapdragon 8 Gen 1 vs Qualcomm Snapdragon 8+ Gen 1

Apple M2

► remove from comparison Apple M2

The Apple M2 is a System on a Chip (SoC) from Apple that is found in the late 2022 MacBook Air and, MacBook Pro 13. It offers 8 cores divided in four performance cores and four power-efficiency cores. The big cores offer 192 KB instruction cache, 128 KB data cache, and 16 MB shared L2 cache (up from 12 MB). The four efficiency cores are a lot smaller and offer only 128 KB instruction cache, 64 KB data cache, and 4 MB shared cache. The efficiency cores (E cluster) clock with  up to 2,4 GHz, the performance cores (P cluster) with up to 3,5 GHz and therefore higher than the M1 cores. The architecture should be similar to the A15 (iPhone 13) with Avalanche and Blizzard cores.

The chip features a unified memory architecture for the CPU and GPU cores and supports up to 24 GB LPDDR5-6400 for a bandwidth of up to 100GB/s.

According to Apple, the M2 offers a 18% higher CPU performance at the same power consumption level compared to the Apple M1. In our tests, the MacBook Pro 13 with active cooling was able to reach the 18% in Geekbench Multi. In other benchmarks we measured 12 to 15% gains compared to the M1. Therefore, the performance is now near the M1 Pro with 8 cores. The passively cooled MacBook Air may however suffer from throttling in longer load scenarios.

The integrated graphics card in the M2 offers 8 or 10 cores and a peak performance of 3.6 TFLOPs.

Furthermore, the SoC integrates a fast 16 core neural engine with a peak performance of 16 TOPS (for AI hardware acceleration), a secure enclave (e.g., for encryption), Thunderbolt / USB 4 controller, an ISP, and media de- and encoders.

The Apple M2 includes 20 billion transistors (up from the 16 billion of the M1) and is manufactured in the second generation 5nm process at TSMC (most likely N5P). The power consumption is rated at 20W what we also measured under CPU load.

Qualcomm Snapdragon 8 Gen 1

► remove from comparison Qualcomm SD 8 Gen 1

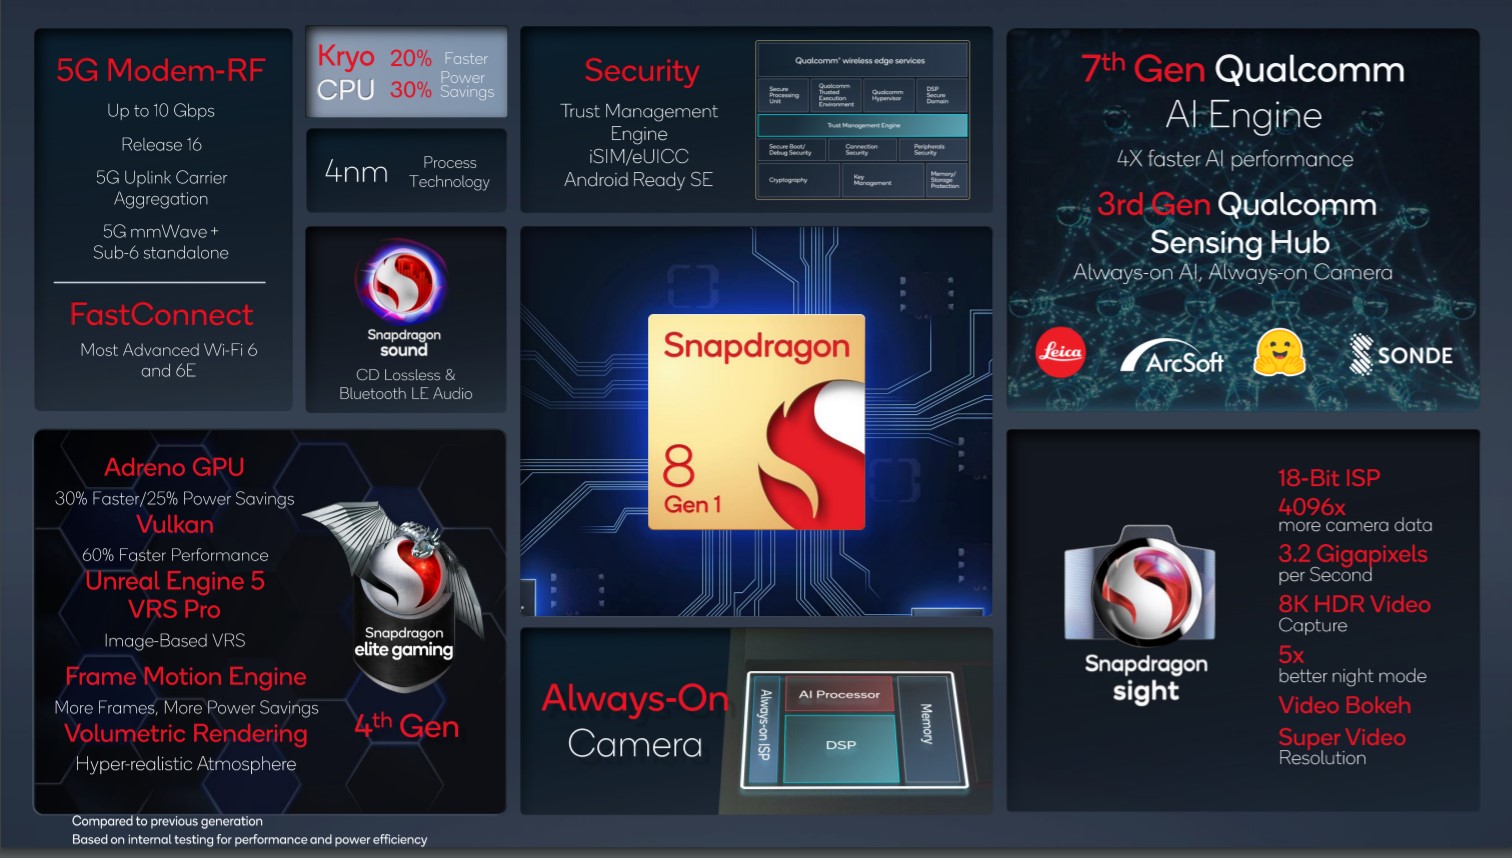
The Qualcomm Snapdragon 8 Gen 1 Mobile Platform is a high-end SoC for smartphones that was introduced in late 2021 and manufactured in 4 nm at Samsung. Integrates one “Prime Core” based on a ARM Cortex-X2 architecture clocked at up to 3 GHz. Three more performance cores are based on the Cortex-A710 but clocked up to 2.5 GHz. Furthermore, four energy saving cores are integrated that are based on the ARM Cortex-A510 architecture and clocked at up to 1.8 GHz. All cores can use the shared 6 MB level 3 cache.

Compared to the Snapdragon 888 (Plus), the CPU part gains 20% performance and 30% power savings according to Qualcomm. This means that the Snapdragon 8 Gen 1 is the fastest CPU for Android based smartphones and should be positioned between the Apple A13 and A14 CPU.

The integrated AI Engine can offer up to 4x faster AI performance thanks to the bigger Tensor engine. The 18-Bit-Spectra-ISP also saw some big improvements and is now called Snapdragon Sight.

The integrated Adreno 730 offers a 30% graphics boost compared to the previous Adreno 660.

The integrated Snapdragon X65 5G modem is also new and offers faster transfer rates (up to 10 Gbps download and 3 Gbps upload). The FastConnect 6900 offers support for the current Wifi 6E and Bluetooth 5.2.

Qualcomm Snapdragon 8+ Gen 1

► remove from comparison Qualcomm SD 8+ Gen 1

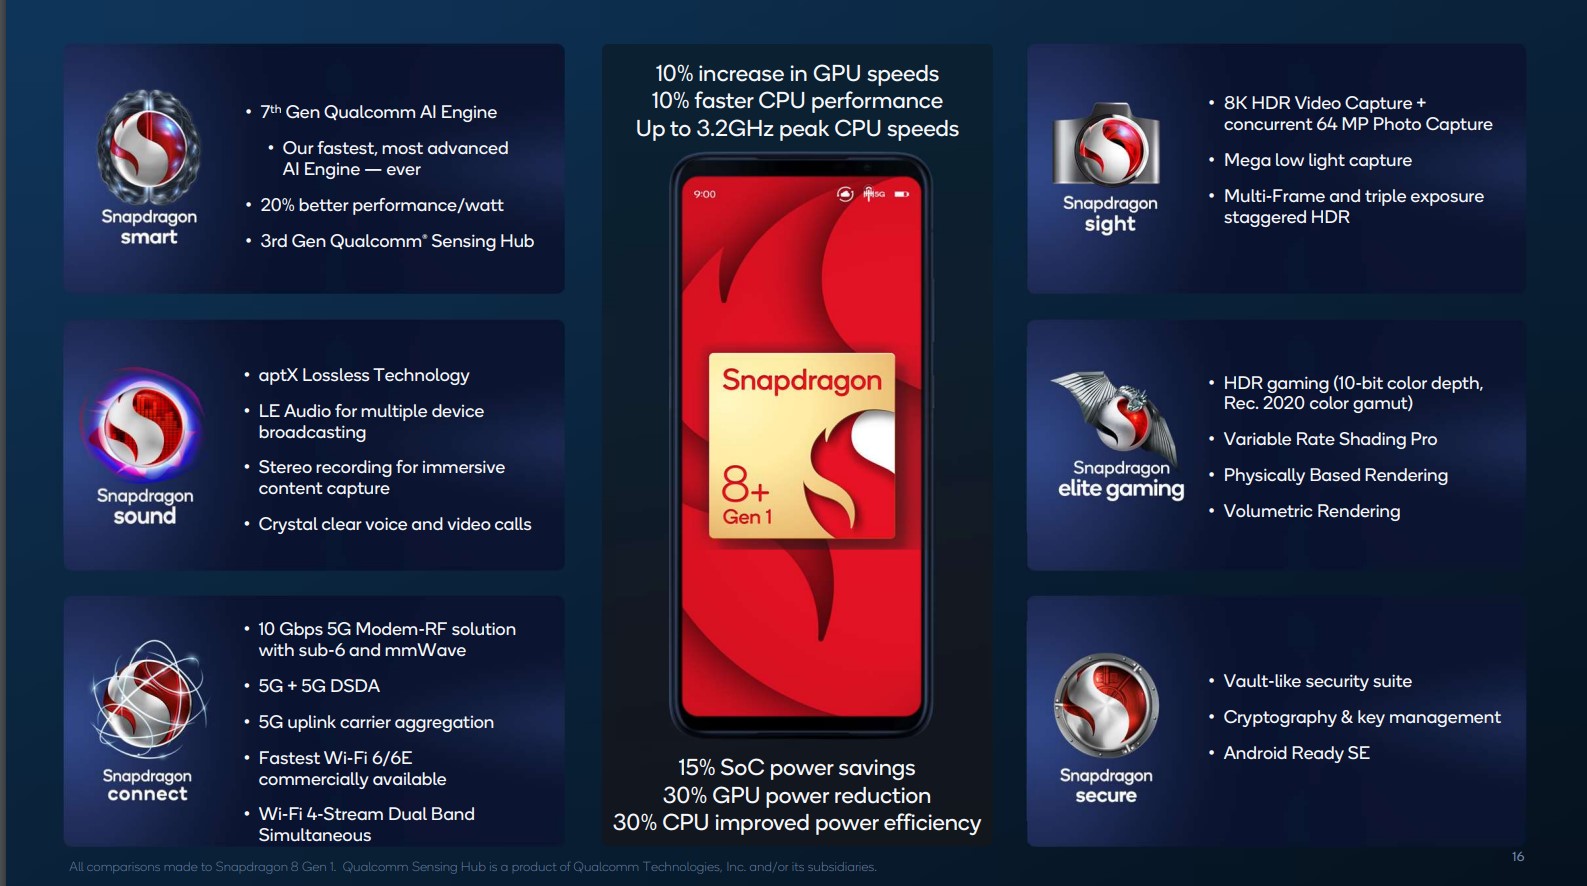
The Qualcomm Snapdragon 8+ Gen 1 Mobile Platform is a high-end SoC for smartphones that was introduced in mid 2022 and manufactured in 4 nm at TSMC. It integrates one “Prime Core” based on a ARM Cortex-X2 architecture clocked at up to 3.2 GHz. Three more performance cores are based on the Cortex-A710 but clocked up to 2.5 GHz. Furthermore, four energy saving cores are integrated that are based on the ARM Cortex-A510 architecture and clocked at up to 1.8 GHz. All cores can use the shared 6 MB level 3 cache.

Compared to the Snapdragon 8 Gen 1, the SoC is now produced in the more power efficient 4nm process at TSMC and offers higher clocked CPU and GPU cores (at a lower power consumption according to Qualcomm).

The integrated AI Engine can offer up to 4x faster AI performance thanks to the bigger Tensor engine. The 18-Bit-Spectra-ISP also saw some big improvements and is now called Snapdragon Sight.

The integrated Adreno 730 offers a 30% graphics boost compared to the previous Adreno 660.

The integrated Snapdragon X65 5G modem is also new and offers faster transfer rates (up to 10 Gbps download and 3 Gbps upload). The FastConnect 6900 offers support for the current Wifi 6E and Bluetooth 5.2.

ModelApple M2Qualcomm Snapdragon 8 Gen 1Qualcomm Snapdragon 8+ Gen 1
SeriesApple Apple M2Qualcomm SnapdragonQualcomm Snapdragon
Series: Snapdragon Cortex-X2 / A710 / A510 (Kryo) Waipio
Apple M2 Max2.42 - 3.7 GHz12 / 12 cores48 MB L3
Apple M2 Pro2.42 - 3.5 GHz12 / 12 cores24 MB L3
Apple M2 Pro 10-Core2.42 - 3.7 GHz10 / 10 cores24 MB L3
Apple M2 « 2.42 - 3.48 GHz8 / 8 cores8 MB L3
Qualcomm Snapdragon 8+ Gen 11.8 - 3.2 GHz8 / 8 cores6 MB L3
Qualcomm Snapdragon 8 Gen 1 « 1.8 - 3 GHz8 / 8 cores6 MB L3
Qualcomm Snapdragon 8+ Gen 1 « 1.8 - 3.2 GHz8 / 8 cores6 MB L3
Qualcomm Snapdragon 8 Gen 11.8 - 3 GHz8 / 8 cores6 MB L3
Clock2424 - 3480 MHz1800 - 2995 MHz1800 - 3200 MHz
L1 Cache2 MB
L2 Cache20 MB
L3 Cache8 MB6 MB6 MB
Cores / Threads8 / 88 / 8
1 x 3.0 GHz ARM Cortex-X2
3 x 2.5 GHz ARM Cortex-A710
4 x 1.8 GHz ARM Cortex-A510
8 / 8
TDP20 Watt
Transistors20000 Million
Technology5 nm4 nm4 nm
FeaturesARMv8 Instruction SetAdreno 730 GPU, Spectra ISP, Hexagon, X65 5G Modem, FastConnect 6900 WiFi, LPDDR5-6400 Memory ControllerAdreno 730 GPU, Spectra ISP, Hexagon, X65 5G Modem, FastConnect 6900 WiFi, LPDDR5-6400 Memory Controller
iGPUApple M2 10-Core GPU ( - 1398 MHz)Qualcomm Adreno 730Qualcomm Adreno 730
ArchitectureARMARM v9ARM v9
Announced
Manufacturerwww.apple.comwww.qualcomm.com
CodenameCortex-X2 / A710 / A510 (Kryo) WaipioCortex-X2 / A710 / A510 (Kryo) Waipio

Benchmarks

Cinebench 2024 - CB24 CPU Single Core
100%
1 M2 +
121 Points (84%)
Cinebench 2024 - CB24 CPU Multi Core
100%
1 M2 +
513 Points (10%)
Cinebench R23 - Cinebench R23 Multi Core
100%
1 M2 +
min: 8517     avg: 8654     median: 8667 (8%)     max: 8772 Points
Cinebench R23 - Cinebench R23 Single Core
100%
1 M2 +
min: 1580     avg: 1595     median: 1585 (67%)     max: 1638 Points
Cinebench R20 - Cinebench R20 CPU (Single Core)
100%
1 M2 +
min: 216     avg: 370.8     median: 381 (42%)     max: 446 Points
Cinebench R20 - Cinebench R20 CPU (Multi Core)
100%
1 M2 +
min: 2231     avg: 2325     median: 2324 (6%)     max: 2416 Points
Cinebench R15 - Cinebench R15 CPU Multi 64 Bit
100%
1 M2 +
min: 1209.9     avg: 1222     median: 1215 (8%)     max: 1243 Points
Cinebench R15 - Cinebench R15 CPU Single 64 Bit
100%
1 M2 +
min: 222     avg: 223.8     median: 223 (67%)     max: 229 Points
Blender - Blender 3.3 Classroom CPU *
100%
1 M2 +
min: 540     avg: 620     median: 619.5 (8%)     max: 702 Seconds
Blender - Blender 2.79 BMW27 CPU *
100%
1 M2 +
min: 549     avg: 614     median: 597 (4%)     max: 713 Seconds
Geekbench 6.2 - Geekbench 6.2 Single-Core
100%
M2 +
min: 2593     avg: 2622     median: 2621.5 (71%)     max: 2650 Points
1610 Points (43%)
min: 1530     avg: 1719     median: 1741 (47%)     max: 1806 Points
Geekbench 6.2 - Geekbench 6.2 Multi-Core
100%
M2 +
min: 10034     avg: 10064     median: 10063.5 (40%)     max: 10093 Points
3860 Points (15%)
min: 4140     avg: 4483     median: 4584 (18%)     max: 4690 Points
Geekbench 5.5 - Geekbench 5.1 - 5.4 64 Bit Single-Core
100%
M2 +
min: 1890     avg: 1918     median: 1917 (81%)     max: 1953 Points
Geekbench 5.5 - Geekbench 5.1 - 5.4 64 Bit Multi-Core
100%
M2 +
min: 8491     avg: 8839     median: 8961 (16%)     max: 8994 Points
Geekbench 4.4 - Geekbench 4.1 - 4.4 64 Bit Single-Core
min: 6273     avg: 6608     median: 6668 (67%)     max: 6984 Points
Geekbench 4.4 - Geekbench 4.1 - 4.4 64 Bit Multi-Core
min: 14289     avg: 15053     median: 15021 (16%)     max: 15948 Points
Geekbench 4.0 - Geekbench 4.0 64 Bit Single-Core
5038 Points (69%)
Geekbench 4.0 - Geekbench 4.0 64 Bit Multi-Core
13465 Points (33%)
Geekbench 3 - Geekbench 3 64 Bit Multi-Core
7296 Points (11%)
15884 Points (25%)
Geekbench 3 - Geekbench 3 64 Bit Single-Core
3017 Points (45%)
6109 Points (91%)
Geekbench 2 - 32 Bit - Geekbench Stream
4412 Points (36%)
Geekbench 2 - 32 Bit - Geekbench Memory
8709 Points (79%)
Geekbench 2 - 32 Bit - Geekbench Floating Point
12775 Points (25%)
Geekbench 2 - 32 Bit - Geekbench Integer
5715 Points (12%)
Geekbench 2 - 32 Bit - Geekbench Total Score
8654 Points (23%)
Mozilla Kraken 1.1 - Kraken 1.1 Total Score *
100%
M2 +
min: 440     avg: 452.4     median: 450.9 (1%)     max: 466.8 ms
min: 813.5     avg: 1010     median: 897.3 (1%)     max: 1440.1 ms
min: 728.6     avg: 1047     median: 982.6 (1%)     max: 1706.5 ms
Sunspider - Sunspider 1.0 Total Score *
302.5 ms (3%)
190.4 ms (2%)
Octane V2 - Octane V2 Total Score
100%
M2 +
min: 72484     avg: 74097     median: 74614 (67%)     max: 75776 Points
min: 27730     avg: 42391     median: 45945 (41%)     max: 50626 Points
min: 17622     avg: 41373     median: 39564 (36%)     max: 55611 Points
WebXPRT 4 - WebXPRT 4 Score
100%
M2 +
min: 223     avg: 235.5     median: 226.5 (65%)     max: 256 Points
min: 68     avg: 93     median: 92.5 (27%)     max: 119 Points
min: 69     avg: 111     median: 101 (29%)     max: 159 Points
WebXPRT 3 - WebXPRT 3 Score
100%
M2 +
min: 342     avg: 369.1     median: 377 (79%)     max: 387 Points
min: 79     avg: 142.9     median: 151 (31%)     max: 193 Points
min: 106     avg: 159.4     median: 156.5 (33%)     max: 224 Points
Antutu v9 - AnTuTu v9 Total Score
100%
M2 +
min: 1257990     avg: 1337360     median: 1337360 (81%)     max: 1416730 Points
Antutu v9 - AnTuTu v9 CPU
100%
M2 +
min: 294643     avg: 298254     median: 298254 (82%)     max: 301865 Points
PCMark for Android - PCM f. Android Storage 2.0 random write internal
min: 36.15     avg: 47.6     median: 43.5 (32%)     max: 69.62 MB/s
55.5 MB/s (41%)
PCMark for Android - PCM f. Android Storage 2.0 seq write internal
min: 831     avg: 1096     median: 1169.1 (36%)     max: 1193.1 MB/s
1504 MB/s (46%)
PCMark for Android - PCM f. Android Storage 2.0 random read internal
min: 29.04     avg: 32.6     median: 30.1 (37%)     max: 42.71 MB/s
37.6 MB/s (46%)
PCMark for Android - PCM f. Android Storage 2.0 seq read internal
min: 1283     avg: 1482     median: 1526.6 (42%)     max: 1662.25 MB/s
1588 MB/s (44%)
PCMark for Android - PCM f. Android Storage 2.0 score
min: 19708     avg: 30794     median: 30302 (48%)     max: 44918 Points
PCMark for Android - PCM f. Android Work Score 2.0
min: 11351     avg: 11629     median: 11628.5 (76%)     max: 11906 Points
CrossMark - CrossMark Overall
100%
M2 +
min: 1496     avg: 1533     median: 1520 (58%)     max: 1585 Points
Power Consumption - Cinebench R15 Multi Power Consumption - external Monitor *
100%
1 M2 +
29 Watt (5%)
Power Consumption - Geekbench 5.5 Power Consumption 150cd *
100%
1 M2 +
min: 9.08     avg: 9.4     median: 9.4 (4%)     max: 9.71 Watt
Power Consumption - Idle Power Consumption - external Monitor *
100%
1 M2 +
min: 2.03     avg: 2.6     median: 2.4 (2%)     max: 3.98 Watt
Power Consumption - Idle Power Consumption 150cd 1min *
100%
1 M2 +
min: 2.32     avg: 4.1     median: 4.7 (5%)     max: 5.32 Watt
Power Consumption - Cinebench R15 Multi Power Efficiency - external Monitor
100%
1 M2 +
42.4 Points per Watt (32%)

Average Benchmarks Apple M2 → 100% n=11

Average Benchmarks Qualcomm Snapdragon 8 Gen 1 → 60% n=11

Average Benchmarks Qualcomm Snapdragon 8+ Gen 1 → 63% n=11

- Range of benchmark values for this graphics card
- Average benchmark values for this graphics card
* Smaller numbers mean a higher performance
1 This benchmark is not used for the average calculation

v1.26
log 19. 13:42:20

#0 checking url part for id 14521 +0s ... 0s

#1 checking url part for id 14029 +0s ... 0s

#2 checking url part for id 14528 +0s ... 0s

#3 not redirecting to Ajax server +0s ... 0s

#4 did not recreate cache, as it is less than 5 days old! Created at Sun, 19 May 2024 05:35:32 +0200 +0.001s ... 0.001s

#5 composed specs +0.029s ... 0.031s

#6 did output specs +0s ... 0.031s

#7 getting avg benchmarks for device 14521 +0.003s ... 0.033s

#8 got single benchmarks 14521 +0.018s ... 0.051s

#9 getting avg benchmarks for device 14029 +0.003s ... 0.054s

#10 got single benchmarks 14029 +0.042s ... 0.096s

#11 getting avg benchmarks for device 14528 +0.003s ... 0.099s

#12 got single benchmarks 14528 +0.076s ... 0.175s

#13 got avg benchmarks for devices +0s ... 0.175s

#14 min, max, avg, median took s +0.262s ... 0.437s

#15 return log +0s ... 0.437s

Please share our article, every link counts!
> Expert Reviews and News on Laptops, Smartphones and Tech Innovations > Benchmarks / Tech > Processor Comparison - Head 2 Head
Redaktion, 2017-09- 8 (Update: 2023-07- 1)