Notebookcheck Logo

Apple M1 Max vs Mediatek Helio G99

Apple M1 Max

► remove from comparison Apple M1 Max

The Apple M1 Max is a System on a Chip (SoC) from Apple that is found in the late 2021 MacBook Pro 14 and 16-inch models. It offers all 10 cores available in the chip divided in eight performance cores (P-cores with 600 - 3220 MHz) and two power-efficiency cores (E-cores with 600 - 2064 MHz). There is no Turbo Boost for single cores or short burst periods. The cores are similar to the cores in the Apple M1.

The big cores (codename Firestorm) offer 192 KB instruction cache, 128 KB data cache, and 24 MB shared L2 cache (up from 12 MB in the M1). The four efficiency cores (codename Icestorm) are a lot smaller and offer only 128 KB instruction cache, 64 KB data cache, and 4 MB shared cache. CPU and GPU can both use the 48 MB SLC (System Level Cache). The efficiency cores (E cluster) clock with 600 - 2064 MHz, the performance cores (P cluster) with 600 - 3228 MHz.

The unified memory (32 or 64 GB LPDDR5-6400) next to the chip is connected by a 512 bit memory controller (200 GB/s bandwidth) and can be used by the GPU and CPU. This is the main difference to the M1 Pro and the CPU performance is quite similar.

The biggest difference to the M1 Pro is the bigger integrated GPU with 24 or 32 cores (up from 16).

Furthermore, the SoC integrates a fast 16 core neural engine, a secure enclave (e.g., for encryption), a unified memory architecture, Thunderbolt 4 controller, an ISP, and media de- and encoders (including two ProRes engines).

The M1 Pro is manufactured in 5 nm at TSMC and integrates 57 billion transistors. The peak power consumption of the chip was advertised around 30W for CPU intensive tasks. 

Mediatek Helio G99

► remove from comparison Mediatek Helio G99

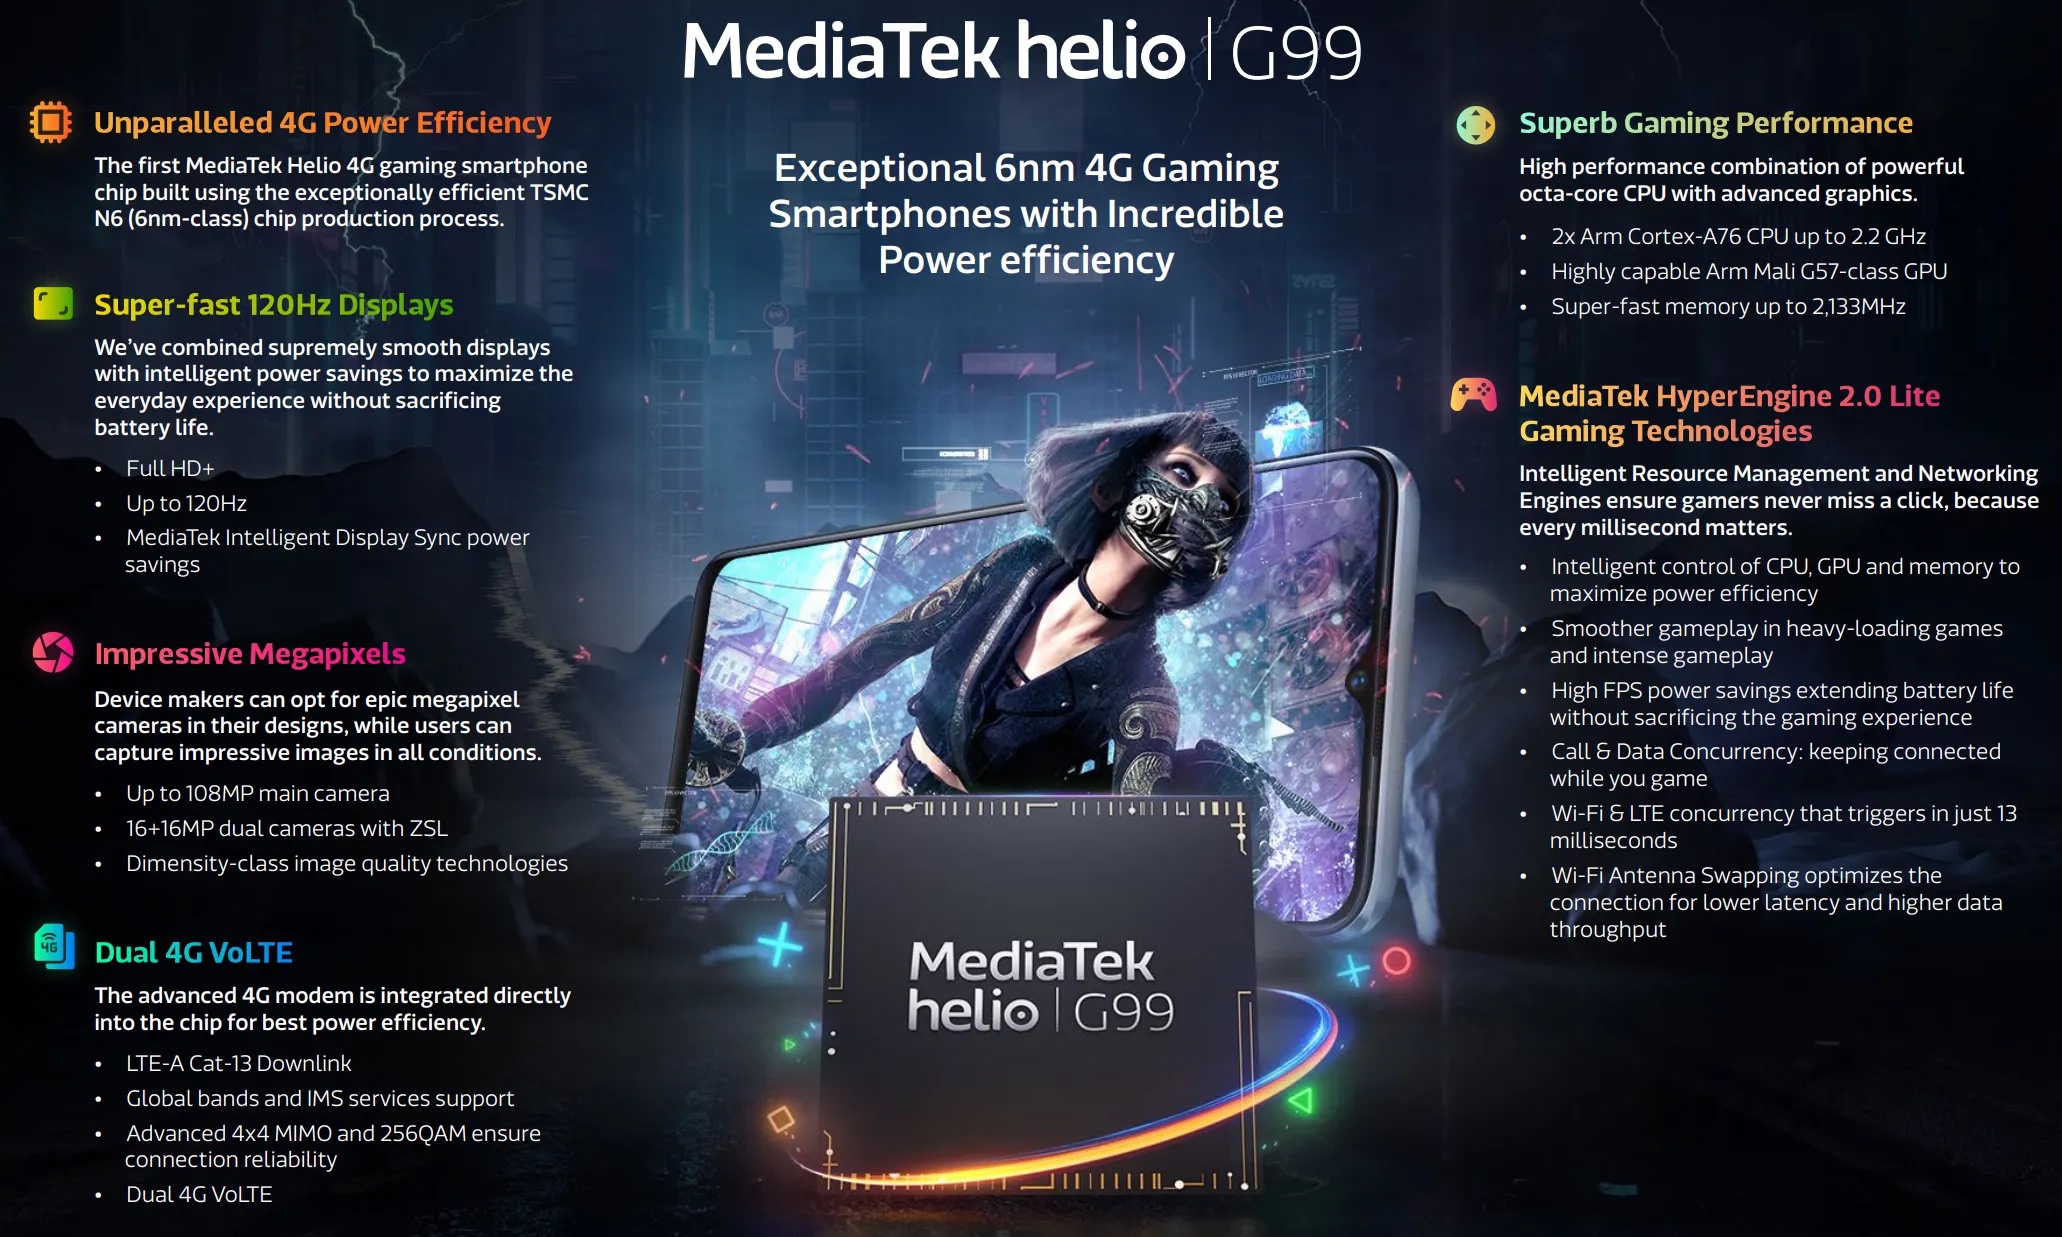
The Mediatek Helio G99 is a mainstream ARM SoC for smartphones (mainly Android based) that was introduced in 2022. It is manufactured in a 6 nm FinFET process and is equipped with 2x big ARM Cortex-A76 cores with up to 2.2 GHz and 6x small and power efficient ARM Cortex-A55 cores (max. 2 GHz) in two clusters (bigLITTLE). The chip integrates an ARM Mali-G57 MC2 (two cores). Compared to the older Helio G96, the G99 is manufactured in the more recent 6nm process and clocks higher.

Furthermore, the integrated LTE / 4G modem supports Cat-13 download speeds. Wi-Fi 5 is also integrated (a/b/g/n/ac). The memory controller supportsLPDDR4x with up to 4,266 Mbps.

ModelApple M1 MaxMediatek Helio G99
SeriesApple M1Mediatek Mediatek Helio G
Series: Mediatek Helio G Cortex-A76 / A55
Apple M1 Max « 2.06 - 3.22 GHz10 / 10 cores48 MB L3
Apple M1 Pro compare2.06 - 3.22 GHz10 / 10 cores24 MB L3
Apple M1 Pro 8-Core compare2.06 - 3.22 GHz8 / 8 cores16 MB L3
Apple M1 compare2.06 - 3.22 GHz8 / 8 cores8 MB L3
Mediatek Helio G100 compare2 - 2.2 GHz8 / 8 cores Cortex-A76 / A55
Mediatek Helio G99 « 2 - 2.2 GHz8 / 8 cores Cortex-A76 / A55
Mediatek Helio G96 compare2 - 2.05 GHz8 / 8 cores Cortex-A76 / A55
Mediatek Helio G95 compare2 - 2.05 GHz8 / 8 cores Cortex-A76 / A55
Mediatek Helio G90T compare2.05 GHz8 / 8 cores Cortex-A76 / A55
Clock2060 - 3220 MHz2000 - 2200 MHz
L1 Cache2.9 MB
L2 Cache28 MB
L3 Cache48 MB
Cores / Threads10 / 108 / 8
2 x 2.2 GHz ARM Cortex-A76
6 x 2.0 GHz ARM Cortex-A55
Transistors57000 Million
Technology5 nm6 nm
FeaturesARMv8 Instruction Set2x Cortex-A76, 6x Cortex-A55, 4G LTE Cat-12/13, 64MP AI-Camera support, LPDDR3/LPDDR4x-2133, eMMC 5.1, UFS 2.1, Beidou, Galileo, Glonass, GPS, Wi-Fi 5 (a/b/g/n/ac), AI Accelerator up to 1 TMACs, H.264 / H.265 / HEVC video encoding (4k30)
iGPUApple M1 Max 32-Core GPUARM Mali-G57 MP2
Chip AI11 TOPS INT8
ArchitectureARMARM
Announced
CodenameCortex-A76 / A55
Manufacturerwww.mediatek.com

Benchmarks

Cinebench R23 - Cinebench R23 Multi Core
100%
1 M1 Max +
min: 12385     avg: 12389     median: 12386 (12%)     max: 12396 Points
Cinebench R23 - Cinebench R23 Single Core
100%
1 M1 Max +
min: 1530     avg: 1533     median: 1533 (64%)     max: 1536 Points
Cinebench R20 - Cinebench R20 CPU (Single Core)
100%
1 M1 Max +
min: 390     avg: 393.3     median: 395 (43%)     max: 395 Points
Cinebench R20 - Cinebench R20 CPU (Multi Core)
100%
1 M1 Max +
min: 2735     avg: 2746     median: 2750 (7%)     max: 2753 Points
Cinebench R15 - Cinebench R15 CPU Multi 64 Bit
100%
1 M1 Max +
min: 1689     avg: 1691     median: 1691 (11%)     max: 1693 Points
Cinebench R15 - Cinebench R15 CPU Single 64 Bit
100%
1 M1 Max +
min: 197     avg: 202.3     median: 200 (55%)     max: 210 Points
Blender - Blender 2.79 BMW27 CPU *
100%
1 M1 Max +
min: 187     avg: 188.7     median: 189 (1%)     max: 190 Seconds
3DMark - 3DMark Sling Shot (ES 3.0) Unlimited Physics
min: 3438     avg: 3596     median: 3630.5 (41%)     max: 3685 Points
Geekbench 6.5 - Geekbench 6.5 Single-Core
2442 Points (59%)
Geekbench 6.5 - Geekbench 6.5 Multi-Core
12994 Points (50%)
Geekbench 6.0 - Geekbench 6.0 Single-Core
2319 Points (74%)
min: 714     avg: 717     median: 717 (23%)     max: 720 Points
Geekbench 6.0 - Geekbench 6.0 Multi-Core
12456 Points (51%)
min: 1916     avg: 1941     median: 1940.5 (8%)     max: 1965 Points
Geekbench 5.5 - Geekbench 5.1 - 5.5 64 Bit Single-Core
min: 1764     avg: 1785     median: 1788.5 (68%)     max: 1798 Points
Geekbench 5.5 - Geekbench 5.1 - 5.5 64 Bit Multi-Core
min: 12563     avg: 12697     median: 12702.5 (23%)     max: 12818 Points
Geekbench 5.0 - Geekbench 5.0 64 Bit Single-Core
555 Points (2%)
Geekbench 5.0 - Geekbench 5.0 64 Bit Multi-Core
1921 Points (6%)
Geekbench 4.4 - Geekbench 4.1 - 4.4 64 Bit Single-Core
min: 2512     avg: 2620     median: 2672 (27%)     max: 2675 Points
Geekbench 4.4 - Geekbench 4.1 - 4.4 64 Bit Multi-Core
min: 7018     avg: 7608     median: 7896 (8%)     max: 7911 Points
Geekbench 4.0 - Geekbench 4.0 64 Bit Single-Core
2625 Points (29%)
Geekbench 4.0 - Geekbench 4.0 64 Bit Multi-Core
min: 7492     avg: 7532     median: 7531.5 (10%)     max: 7571 Points
Geekbench 3 - Geekbench 3 64 Bit Multi-Core
min: 7124     avg: 7934     median: 7933.5 (12%)     max: 8743 Points
Geekbench 3 - Geekbench 3 64 Bit Single-Core
min: 2334     avg: 2555     median: 2555 (38%)     max: 2776 Points
Mozilla Kraken 1.1 - Kraken 1.1 Total Score *
min: 404.3     avg: 459.2     median: 482.3 (1%)     max: 491.1 ms
min: 1628.6     avg: 2004     median: 1971 (2%)     max: 2443.7 ms
Octane V2 - Octane V2 Total Score
min: 66938     avg: 68647     median: 68029 (50%)     max: 70973 Points
min: 17228     avg: 21975     median: 22187 (16%)     max: 26476 Points
WebXPRT 4 - WebXPRT 4 Score
min: 39     avg: 73.1     median: 81 (22%)     max: 89 Points
WebXPRT 3 - WebXPRT 3 Score
min: 350     avg: 358.7     median: 360 (65%)     max: 366 Points
min: 80     avg: 95.4     median: 93.5 (17%)     max: 112 Points
Antutu v9 - AnTuTu v9 Total Score
min: 229468     avg: 317183     median: 319204 (16%)     max: 375956 Points
Antutu v9 - AnTuTu v9 CPU
min: 83150     avg: 98532     median: 100624 (25%)     max: 106860 Points
Antutu v10 - AnTuTu v10 Total Score
min: 383511     avg: 403419     median: 401641 (13%)     max: 422936 Points
Antutu v10 - AnTuTu v10 CPU
min: 120432     avg: 131716     median: 131438 (13%)     max: 140012 Points
PCMark for Android - PCM f. Android Storage 2.0 random write internal
min: 30.8     avg: 56     median: 63.7 (43%)     max: 71.8 MB/s
PCMark for Android - PCM f. Android Storage 2.0 seq write internal
min: 184.1     avg: 571     median: 681 (19%)     max: 830 MB/s
PCMark for Android - PCM f. Android Storage 2.0 random read internal
min: 17.6     avg: 33.8     median: 40.4 (20%)     max: 45.4 MB/s
PCMark for Android - PCM f. Android Storage 2.0 seq read internal
min: 719.36     avg: 789     median: 796 (20%)     max: 858 MB/s
PCMark for Android - PCM f. Android Storage 2.0 score
min: 14042     avg: 22881     median: 26431 (12%)     max: 28259 Points
CrossMark - CrossMark Overall
min: 1586     avg: 1607     median: 1615 (60%)     max: 1621 Points
Power Consumption - Prime95 Power Consumption - external Monitor *
100%
1 M1 Max +
50.8 Watt (9%)
Power Consumption - Cinebench R15 Multi Power Consumption - external Monitor *
100%
1 M1 Max +
53 Watt (10%)
Power Consumption - Idle Power Consumption - external Monitor *
100%
1 M1 Max +
11.6 Watt (8%)
Power Consumption - Power Efficiency - Cinebench R15 Multi external Monitor
100%
1 M1 Max +
31.9 Points per Watt (24%)

Average Benchmarks Apple M1 Max → 100% n=10

Average Benchmarks Mediatek Helio G99 → 25% n=10

- Range of benchmark values for this graphics card
red legend - Average benchmark values for this graphics card
* Smaller numbers mean a higher performance
1 This benchmark is not used for the average calculation

Add one or more devices and compare

In the following list you can select (and also search for) devices that should be added to the comparison. You can select more than one device.

restrict list:
v1.34
log 11. 15:52:05

#0 ran 0s before starting gpusingle class +0s ... 0s

#1 checking url part for id 13843 +0s ... 0s

#2 checking url part for id 14649 +0s ... 0s

#3 redirected to Ajax server, took 1760190725s time from redirect:0 +0s ... 0s

#4 did not recreate cache, as it is less than 5 days old! Created at Fri, 10 Oct 2025 05:18:33 +0200 +0s ... 0s

#5 composed specs +0.003s ... 0.004s

#6 did output specs +0s ... 0.004s

#7 getting avg benchmarks for device 13843 +0s ... 0.004s

#8 got single benchmarks 13843 +0s ... 0.004s

#9 getting avg benchmarks for device 14649 +0.001s ... 0.005s

#10 got single benchmarks 14649 +0.025s ... 0.03s

#11 got avg benchmarks for devices +0s ... 0.03s

#12 min, max, avg, median took s +0.019s ... 0.049s

#13 return log +0s ... 0.05s

Please share our article, every link counts!
Mail Logo
> Expert Reviews and News on Laptops, Smartphones and Tech Innovations > Benchmarks / Tech > Processor Comparison - Head 2 Head
Redaktion, 2017-09- 8 (Update: 2023-07- 1)