Intel Xeon w9-3495X vs AMD EPYC 9654: Sapphire Rapids shows giant strength per core but Genoa Zen 4 has the efficiency edge in battle of PassMark leaders
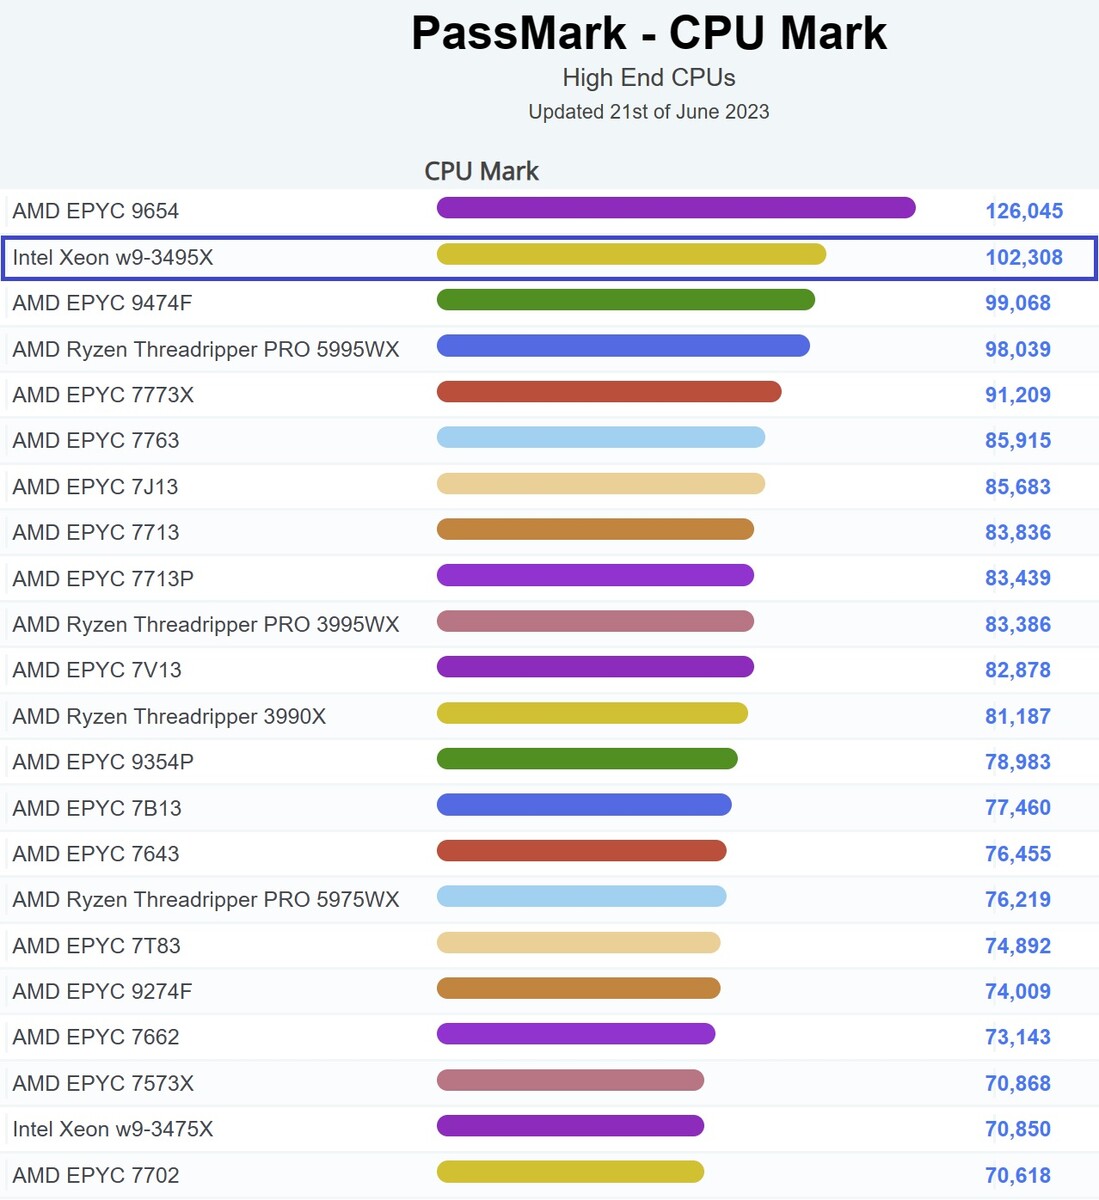
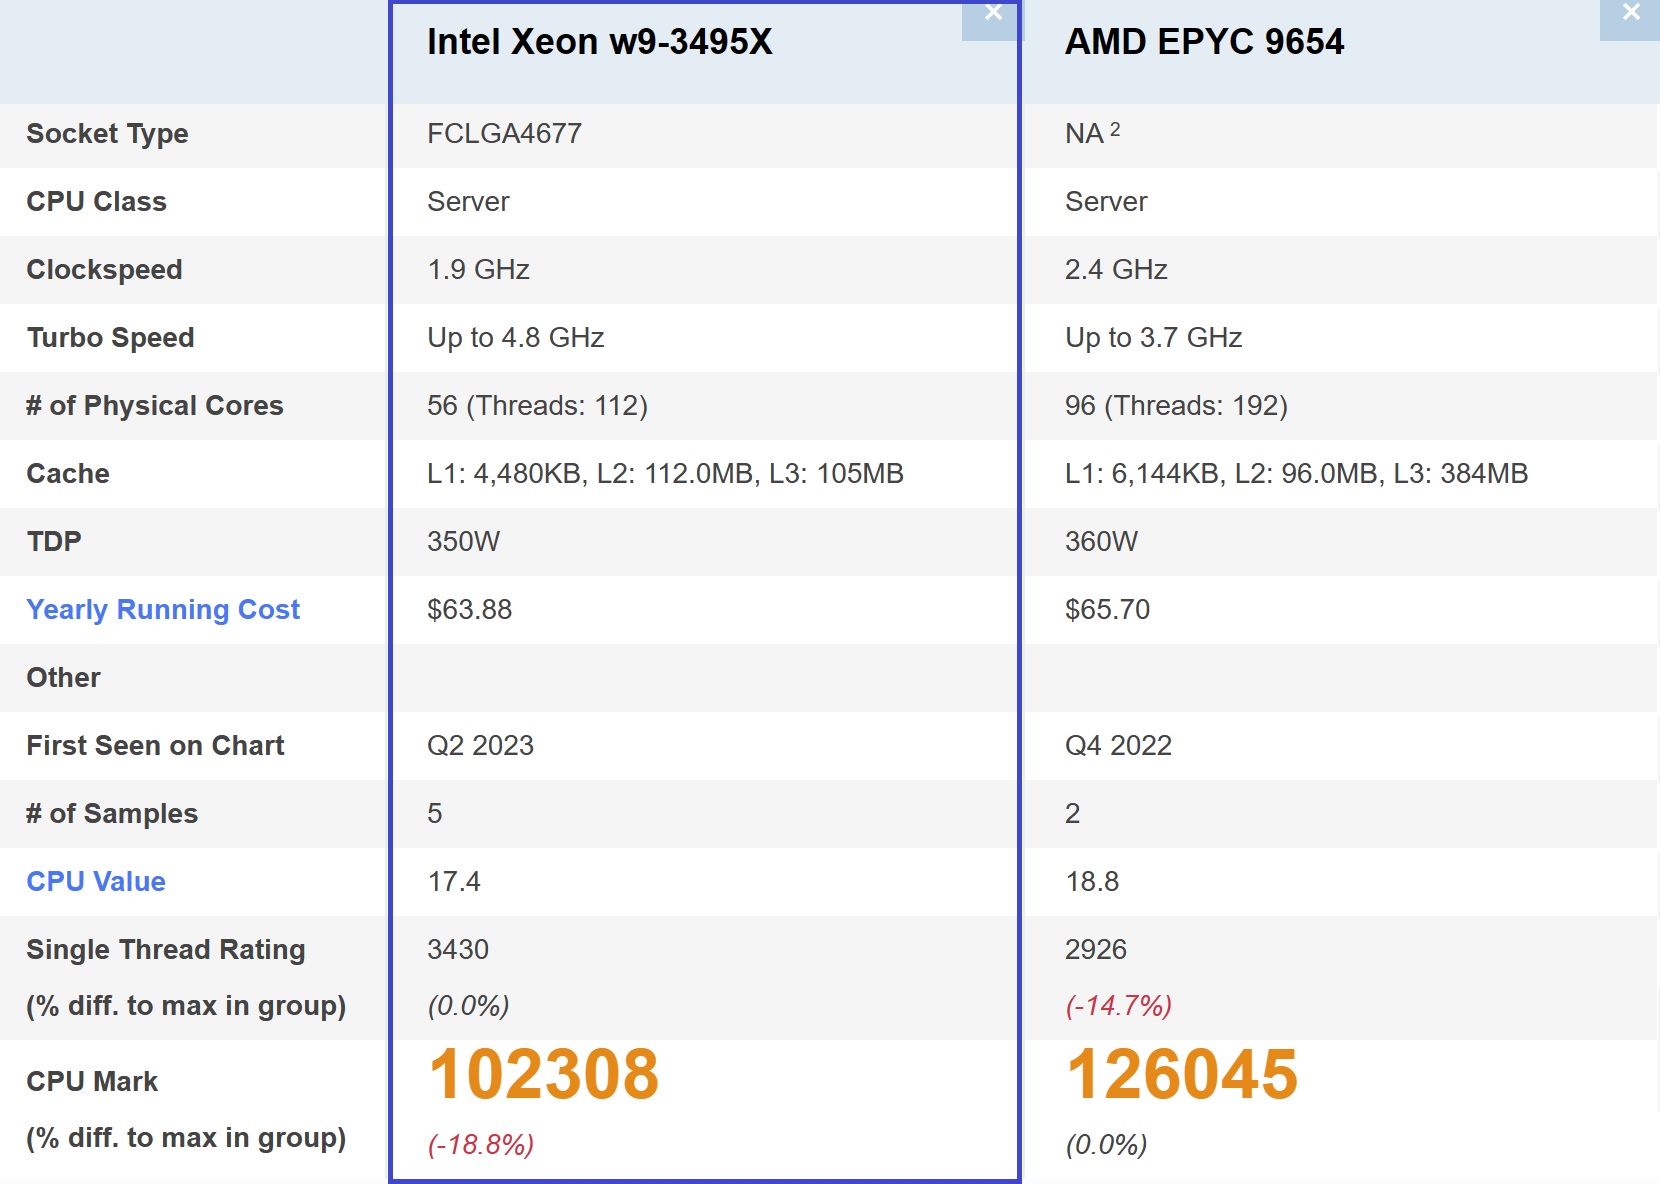
The Intel Xeon w9-3495X has cemented its place in the High End CPU chart over at PassMark, with five samples offering an average CPU Mark score of 102,308. This total is achieved by testing the workstation processor over a suite of benchmarks, which includes single-thread testing. The Intel Xeon w9-3495X utilizes 56 cores and 112 threads, with each of those Golden Cove cores being of the performance variety rather than efficient. The Golden Cove microarchitecture has been around since 2021, and it has found its way into Intel’s Sapphire Rapids-WS series.
The Intel Xeon w9-3495X’s average score is enough to put it firmly into second position in PassMark’s chart, thus breaking up a wall of 19 AMD processors that were made up of EPYC chips and Ryzen Threadripper/Threadripper PRO parts. Only the 96-core AMD EPYC 9654 is above the Xeon w9-3495X, although it is far and away ahead on a score of 126,045 (based on two samples; high margin of error). Unsurprisingly, the Intel part thrashes the AMD chip in single-thread testing, but this is not exactly what these server processors are designed for.
According to PassMark’s calculations, the Intel Xeon w9-3495X and AMD EPYC 9654 would cost about the same amount to run. However, in terms of performance, it depends if you want to calculate per core or per watt based on recorded TDP Up. When it comes to cores, the w9-3495X can trundle out roughly 1,827 points per core, which is way above the 1,313 per core for the EPYC 9654. But base the comparison on power (TDP Up as reported on PassMark) and Team Blue struggles with 243.6 per watt (420 W (although this can go MUCH higher)) while Team Red happily and efficiently delivers 315.1 per watt (400 W), which works out at a huge +29.35% advantage.
When it was released, the EPYC 9654 processor cost US$11,805 - an amount that would have made this comparison completely lopsided, as the Sapphire Rapids contender is priced at US$5,889 and has a much better performance per core value (+39%). But it is possible to find the Genoa Zen 4 giant for US$6,579 at present, which means any purchase will boil down to either a desire for a higher performance per core value that should offer superior processing peaks or a greater power-efficiency value that points to a likely better long-term investment.